Embed Size (px)
Citation preview

From Citizenship to Voting:
ImprovIng regIstratIonfor new amerIcans
by To va a n d r e a Wa n g and Yo uj i n b. K i m
d ē m o s .o r g

A B O U T T h e A U T h O r s
to va a n d r e a wa n g , a nationally known expert on election reform and political participation, is Senior Democracy Fellow at Dēmos. Her commentary on this subject has appeared in numerous print media outlets and she has frequently appeared on national radio and television, including NBC’s the Today Show, ABC Nightly News, ABC Good Morning America, CBS Morning News, CNN, C-Span’s Washington Journal, MSNBC, CBS Evening News, and NPR. She has been a featured speaker at a number of national election reform conferences and forums and has provided her expertise to members of Congress and state legislators, as well as advocates and legislators from around the world.
She was the Executive Director of The Century Foundation’s Post-2004 Election Reform Working Group, comprised of many of the preeminent election law scholars in the country. In 2001, she was staff person to the National Commission on Federal Election Reform, co-chaired by former Presidents Carter and Ford. She is the author of numerous election reform reports.
She is also a Democracy Fellow at The Century Foundation.
Yo uj I n B. K I m is Policy Analyst in the Democracy Program at Dēmos. Her research fo-cuses on various aspects of voter registration including the implementation of the National Voter Registration Act, Same Day Registration, and Voter Registration Modernization. She is the co-author of Increasing Access in Hard Times and other reports.
A c k n O w l e d g e m e n T s
The authors are extremely grateful for the invaluable input we received from Michael Jones-Correa and John Mollkenkopf, and the tremendous assistance of Laura Meyer.
A B O U T d ē m O s
Dēmos is a non-partisan public policy research and advocacy organization. Headquartered in New York City, Dēmos works with advocates and policymakers around the country in pursuit of four overarching goals: a more equitable economy; a vibrant and inclusive de-mocracy; an empowered public sector that works for the common good; and responsible U.S. engagement in an interdependent world. Dēmos was founded in 2000.
In 2010, Dēmos entered into a publishing partnership with The American Prospect, one of the nation’s premier magazines focusing on policy analysis, investigative journalism and forward-looking solutions for the nation’s greatest challenges.
c O n T A c T
d ē m O s
220 Fifth Avenue, 2nd FloorNew York, New York 10001Phone: (212) 633-1405Fax: (212) 633-2015info@dēmos.org
d ē m O s m e d i A
Lauren StrayerAssociate Director of Communicationslstrayer@Dēmos.org(212)-389-1413

table oF Contents
e x e c u T i v e s u m m a r Y 2
i n T r o d u c T i o n 6
T h e i m m i g r a n T P a r T i c i P a T i o n g a P 7
W h Y n a T u r a l i z e d c i T i z e n s a r e n o T r e g i s T e r e d
• T h e c u r r e n T P o P u l a T i o n s u r v e Y 10
• l i T e r a T u r e r e v i e W 12
W h a T c a n b e d o n e 20
c o n c l u s i o n 25
r e c o m m e n d a T i o n s 26

2 from cItIzenshIp to votIng
eXeCUtiVe sUmmarY
There is, unfortunately, great controversy and disagreement
in the United States about immigration and the role of im-
migrants in our society. Yet most agree that when someone
from another country goes through the difficult process of
becoming an American citizen, he or she should be entitled to full participation in
our nation’s democracy. The most fundamental form of participation is voting. Vot-
ing is the means by which we seek to ensure every citizen has an equal voice in the
decision-making process of the country and in our local communities. It is how we
ensure that our elected leadership truly represents the will of the people.
For our democracy to work, we need all sectors of society involved, including new
American citizens. Yet in the United States, there is a significant gap in the voter
participation rates of native-born and naturalized American citizens. Analysts have
different theories for why this is so.

3from cItIzenshIp to votIng
s U m m A r y O f f i n d i n g s
the immigrant partiCipation gap: the Voter registration proCess as an obsta-Cle to eleCtoral partiCipation
Voter turnout among naturalized citizens is much lower overall than that of native-born citizens—con-sistently around 9 to 12 percentage points less during at least the past four elections.1 In the last general election of 2010, almost 1 in 2 native-born citizens turned out to vote, while less than 2 in 5 naturalized citizens did.2 Even in 2008, a year of historic turnout among many constituencies, just over half of natural-ized Americans voted, compared to a little less than two thirds of native-born citizens.3
The significant difference in turnout rates between native-born and naturalized Americans is due, to an enormous degree, to a parallel gap in voter registra-tion rates. For example, in 2010 just over 1 in 2 nat-uralized citizens were registered to vote by Election Day, while 2 out of 3 native citizens were registered.4 In 2008, the gap narrowed slightly but remained sig-nificant; just over 60 percent of naturalized Ameri-cans were registered to vote, compared to over 70 percent of native-born Americans.5
The telling statistic is this: among those citizens who do succeed in registering to vote, there is little dif-ference in turnout rates between native-born and naturalized citizens. Although turnout among all citizens has varied from election to election over the past several cycles, turnout rates of registered native-born Americans and naturalized citizens have been fluctuating together and have been virtually identical.
Moreover, the research assessed in this report sug-gests that structural barriers to registration—such as restrictive requirements and lack of language access —are a key factor in why naturalized citizens remain registered at lower rates. These barriers remain a far bigger obstacle to voter registration among natural-ized citizens than among the native-born. Indeed, among naturalized citizens who are unregistered, 57 percent—nearly three in five—cite structural barri-ers as the reason they are not registered, compared to only 37 percent of native-born citizens.6 Native-born
citizens, on the other hand, are far more likely than naturalized citizens to cite lack of interest in politics or lack of faith in the impact of their vote as rea-sons why they are not registered—reasons that can be categorized as “political alienation.”7 Sixty-three per-cent of unregistered native-born citizens cite political alienation as the reason why they are not registered, compared to only 43 percent of naturalized citizens.8
other eXplanations For immigrant partiCipation gap
Apart from the analysis of census data, an assessment of other research offers insights into a variety of ex-planations for the participation gap between native-born Americans and naturalized citizens, and factors that may help explain why registration is a particular problem. This research has assessed such variables as socioeconomic factors; length of time in the United States; variations based on country of origin; location of the immigrant community (e.g., does it comprise a majority-minority electoral district and is it an estab-lished community or a new immigrant destination); the extent of voter mobilization by political parties and candidates; language barriers; and the persistence of discriminatory practices. Each of these areas of re-search illuminates different aspects of the problem and suggests policy implications for efforts to reduce the gap in participation between native-born and naturalized citizens.
Socioeconomic FactorsSome academics have theorized over the years that one reason for lower registration and voting rates among new Americans may be socioeconomic fac-tors, especially lower income and education levels. However, other analysis of the census data indicate that even controlling for these socioeconomic fac-tors, naturalized citizens register and vote at a lower rate.9 One explanation for this is that socioeconomic factors may impact the degree to which naturalized Americans are less engaged, but are not the only driv-ing force behind the problem.

4 from cItIzenshIp to votIng
Length of Time in the United StatesScholars have found that another very consistent predictor of voter participation among naturalized citizens is length of time in the United States. This is so to a far greater degree with respect to registering than to voting because of the increased acculturation to the system and society that is required to navigate this institutional procedure preceding arrival at the polls.
Variation by Country of OriginVoting and registration rates among immigrants can vary greatly by country of origin. The most commonly made link between country of origin and electoral participation is the type of regime or political system from which an immigrant came and therefore one’s prior experience with the democratic process, which may influence the likelihood of registering and voting.10 More research needs to be done disaggregating voter registration data by country of origin to better understand these variations.
LocationStudies on the impact of the community in which a naturalized citizen lives have mostly focused on voter turnout rather than registration. The preponderance, though not the totality, of this research has found that living in majority-minority electoral districts facilitates voter participation.
What impact does it have if a new American lives in a “gateway” state with a new and scattered immigrant popu-lation as compared to established immigrant communities such as Los Angeles and New York? Researchers find that living in a new locus of immigrant migration leads to lower participation rates because community-based and other organizations that undertake mobilization efforts simply do not exist in new immigrant destinations.11
Extent of Mobil ization by Parties and CandidatesAlthough the campaign of President Barack Obama in 2008 began to change this dynamic marginally, campaigns and parties still do not invest substantially in mobilizing the immigrant or even the ethnic minority vote, particu-larly when it comes to voter registration, calculating that their resources are better spent focusing on prospective voters who already have a history of high participation rates.12
Language BarriersStudies about the impact of Section 203 of the Voting Rights Act13—which requires jurisdictions with large num-bers of language minority voters to provide translated voting materials (including registration forms and instruc-tions)—indicate that language access plays a significant role in propensity to participate in the voting system.
Discriminatory PracticesIn addition to the contextual reasons why naturalized citizens might be less likely to register to vote, there are also discriminatory policies that inhibit their ability to register to vote. These include ethnic minorities being blocked by election administrators in the voter registration process; laws requiring voters to prove their citizenship prior to registering to vote; and inaccurate database citizenship checks.

5from cItIzenshIp to votIng
w h AT c A n B e d O n e
Narrowing the registration gap will take action from government, political parties, and non-profits alike. The recommendations below fall into three broad categories: making registration easier for new Americans, focusing mobilization efforts on these communities, and providing better resources for them to obtain civic education and the tools to participate.
reCommendations
•United States Citizenship and Immigrant Services should fully implement its newly adopted policy of ensur-ing that new Americans are provided with a voter registration application at all administrative naturalization ceremonies,14 and ultimately should be designated as a full voter registration agency under the National Voter Registration Act so that every newly naturalized American is automatically and systematically given the opportunity to register to vote.
•Nongovernmental voter mobilization groups should focus a good portion of their efforts on unregistered naturalized citizens including, if possible, in “new destination” states.
•The donor community should fund year-round activities around voter registration, including in immigrant communities wherever they may be.
•State and local elections officials should be active in registering new citizens to vote by reaching out to these communities through a variety of means and working with USCIS to provide voter registration services at naturalization ceremonies. These officials should also provide as much material as possible in alternative languages spoken prevalently in their jurisdictions, whether required to by federal law or not.
•Political parties should be much more pro-active in reaching out to naturalized citizens, tapping into a huge potential pool of new voters. The parties also have a role to play in civic education, especially regarding the electoral process in immigrant areas.
•Candidates must appeal to and speak to the issues of concern to immigrants. Having paid advertising in Spanish is insufficient.
•The civic education and civic skill-building process must start early upon immigrants’ arrival in this country so that by the time they are eligible to register and vote they understand the process and the importance of participating. This means more government resources for such services, including English as a Second Lan-guage instruction.
•Every means possible must be explored for eliminating administrative practices and legal requirements that discriminate against immigrant voters. These include certain types of database matching policies, laws requir-ing documentary proof of citizenship in order to register to vote, and voter identification laws. Swift and serious action must be taken against any election administrator or other actors who engage in discriminatory practices.

6 from cItIzenshIp to votIng
introdUCtion
It may be a cliché that we are a nation of immigrants, but statistics show
that it is as true today as in any other period in our history. And while
Americans may debate the best way to bring noncitizens into the civic
life of our communities, there is widespread, strong agreement that when
someone from another country takes the affirmative step to take the oath of loyalty
and become a citizen of this country, he or she should be welcomed and encouraged to
be a part of our country and our social and political life. The most obvious and fun-
damental form of civic participation is voting. In our democracy, the voting process is
the means by which we ensure that every citizen has an equal voice and a role to play
in self–governance. As a society, we should strive to ensure that new citizens become
engaged, incorporated and invested in democracy by encouraging their participation
in elections.
Yet in the United States, there is a significant gap in the voter participation rates of
native-born and naturalized American citizens. Analysts have different theories for
why this is so. One paramount reason is upon inspection immediately evident, but not
much discussed: The unique American voter registration process is a significant barrier
to voting for naturalized Americans in particular.
Fortunately, there are some concrete remedies that can and should be implemented to
address the lower rate of participation among naturalized citizens. This paper describes
the voting and registration gap, identifies reasons that have been put forward for it,
and suggests some potential ways to close or at least narrow the gap.

7from cItIzenshIp to votIng
the immigrant partiCipation gap: the Voter registration proCess as the obstaCle to eleCtoral partiCipation
The United States is one of the few democracies in the world that requires the citizen to undertake an administra-tive process of registration prior to being given the right to cast a ballot.15 Rather than automatically being put on the registration rolls, Americans must navigate our unique voter registration system; this presents a significant hurdle for some, especially those with fewer resources, such as education and income.16 New citizens often con-front the additional hurdles of discrimination and administrative barriers that disproportionately impact them.
Although the United States Citizenship and Immigration Services office has recently been making strides in the right direction by issuing revised guidance to its employees that technically ensures all participants in naturaliza-tion ceremonies will at least be given a voter registration form, the federal government has generally done little systematically to help new American citizens register or vote.17 Parties and candidates largely ignore this potential constituency18 and the efforts of non-profit organizations are usually under-resourced, limited, confront obstacles or some combination of all three.19 This gap in the system is reflected in the poor voter participation numbers of recently naturalized Americans relative to native-born citizens.
The US Census Bureau’s 2010 Ameri-can Community Survey shows that the foreign-born population now stands at nearly 40 million, a historic high, representing 12.9 percent of the US population. Between 2009 and 2010, the foreign-born population increased by more than 1.4 million, or by 3.7 percent, compared to 1.5 percent from 2008-09.20 In terms of naturalized citi-zens, in 2009 there were an estimated 38.5 million immigrants living in the United States of which 44 percent were naturalized U.S. citizens.21
Naturalizations grew at a record pace between 2008 and 2010, with a total of 2.4 million immigrants becoming new citizens in the United States during that time.22 The number of persons naturalized in the United States increased 58 percent from 660,477 in 2007 to an all-time record of 1,046,539 in 2008.23 While there have been ebbs and flows, the number of new citizens has been increasing dramatically over the last few decades (see Figure 1).
These new Americans, however, have not been participating in elections on par with their native-born counter-parts. Even in 2008, a year of historic turnout among many constituencies and enormous interest in the election,
figure 1. | A n n U A l n U m B e r O f n e w U s c i T i z e n s , 1 9 7 8 T O 2 0 1 0
s O U r c e : Yearbook of Immigration Statistics: 2010, Department of Homeland Security, Office of Immigration Statistics, April 2010. http://www.dhs.gov/xlibrary/assets/statistics/yearbook/2010/table20.xls.
0
2 0 0 , 0 0 0
1978
1979
1980
198
119
8219
8319
8419
8519
8619
8719
8819
8919
9019
9119
9219
9319
9419
9519
9619
9719
9819
9920
0020
0120
02
2003
2004
2005
2006
2007
2008
2009
20
10
4 0 0 , 0 0 0
6 0 0 , 0 0 0
8 0 0 , 0 0 0
1 , 0 0 0 , 0 0 0
1 , 2 0 0 , 0 0 0

8 from cItIzenshIp to votIng
the nativity gap in turnout barely im-proved relative to previous elections. Nationwide, turnout among natu-ralized voting Americans was 10 per-centage points less than among the native-born voting age population.24 The disparities in certain states were particularly stark (see Figure 2).
The disparity in turnout between na-tive and naturalized Americans has been persistent—in the midterm elections of 2010 and 2006, only 37 percent of naturalized citizens voted—a rate 9 percentage points less than their native counterparts in 2010 and 12 percentage points lower in 2006.25
The significant difference in turn-out rates between native-born and naturalized Americans is due, to an enormous degree, to the significant disparities between the numbers of native-born and naturalized Ameri-cans who are registered to vote (see Figure 3), a threshold requirement to casting a ballot in all but one state.
For example, in 2004, 73 percent of native-born Americans were regis-tered, compared to only 61 percent of naturalized citizens.26 About 7 in 10 native-born Americans were again registered to vote by the following midterm election of 2006, while barely over half of naturalized citizens were registered to vote by Election Day.27 During the past two elections of 2010 and 2008, the registration gap remained at 12 and 11 percent-age points.28
Academic research confirms the lower likelihood of naturalized citizens to be registered. Research by the Census Bureau Housing and Household Economics Statistics Division found that, controlling for all other social and demographic factors, naturalized citizens are consistently less likely to register and vote than native citizens, in both congressional and presidential elections. In 2006, for example, naturalized citizens were half as likely to be registered as native-born.29
figure 3. | V O T e r r e g i s T r A T i O n r A T e , B y n A T i V i T y 2 0 0 0 - 2 0 1 0
s O U r c e : U.S. Census Bureau, DataFerrett, Current Population Survey, Voting and Registration, November 2000-2010. A n A ly s i s B y d ē m O s .
5 0 %
2 0 0 0 2 0 0 2 2 0 0 4 2 0 0 6 2 0 0 8 2 0 1 0
5 5 %
6 0 %
6 5 %
7 0 %
7 5 %
70.2%
58.1%
72.9%
61.2% 60.5%
71.8%
67.3%
54.8%
68.6%
54.3% 54.2%
66.1%
NA T I V E NA T U R A L I Z E D
naturalized citizens native citizens
alabama 17.1% 62.7%oklahoma 27.1% 59.7%arkansas 28.1% 54.0%utah 34.9% 53.7%hawai i 35.4% 54.4%Louis iana 35.4% 70.8%tennessee 38.2% 56.0%Il l ino is 40.3% 64.4%nebraska 45.2% 67.8%north caro l ina 47.1% 68.0%washington 47.1% 68.4%south dakota 48.3% 68.1%colorado 48.6% 69.3%Iowa 50.1% 70.8%s O U r c e : U.S. Census Bureau, DataFerrett, Current Population Survey, Voting and Registration, November 2008. A n A ly s i s B y d ē m O s .
figure 2. | T U r n O U T A m O n g c i T i z e n V O T i n g A g e P O P U l A T i O n i n n O V e m B e r 2 0 0 8 ,B y n A T i V i T y

9from cItIzenshIp to votIng
It is not that new Americans don’t want to partici-pate—once they are registered, the vast majority of immigrants vote. In fact, the turnout rates among registered voters since 1996 have consistently been virtually equal between native-born and natural-ized citizens. New citizens even had a marginally higher rate of turnout than the native-born in three consecutive elections from 1996 to 2000.30 While overall turnout rates among voting-age citizens have varied from 67 to 90 percent over the years during both presidential and midterm elections, the vot-ing rates of registered native-born Americans and naturalized citizens have been fluctuating together (see Figure 4).
Although there has not been much academic research isolating the effect of the registration process on the im-migrant vote, that which has been done supports the assertion that the effect is significant. In her book, Janelle Wong shows voting rates among Asian American and Latino immigrants comparable to that of the general population once they become registered, and states, “[v]oter registration is the key to immigrant political par-ticipation.”31 Jun Xu comes to similar conclusions when she finds that the impact of immigration status on participation among Asian Americans actually occurs at the registration stage.32
figure 4. | T U r n O U T A m O n g r e g i s T e r e d V O T e r s , 1 9 9 6 - 2 0 1 0
Year Total native naturalized1996 72% 72% 73%
1998 68% 67% 69%
2000 86% 85% 87%
2002 69% 69% 67%
2004 89% 89% 88%
2006 71% 71% 68%
2008 90% 90% 89%
2010 69% 70% 68%s O U r c e : U.S. Census Bureau, DataFerrett, Current Population Survey, Voting and Registration, November
1996-2010. A n A ly s i s B y d ē m O s .

10 from cItIzenshIp to votIng
WhY natUralized Citizens are not registered—CensUs data shoW strUCtUral barriers are KeY
c U r r e n T P O P U l AT i O n s U r V e y d ATA
Analysis of self-reported data lends some evidence as to why immigrants are less likely to be registered to vote than native-born Americans. According to the Current Population Survey of 2008, a year of historic turnout and interest in the presidential election, native-born Americans are more likely to be unregistered because of lack of interest in politics or lack of faith in the impact of their vote—reasons that can be categorized as “political alienation.”33 However, naturalized citizens are more often unregistered because of restrictive registration require-ments and language access—reasons that can be categorized as “structural barriers”.
In this paper, we analyze the 2008 survey responses in order to obtain more accurate estimates from a larger sample, although the Census Bureau has asked respondents why they were not registered since 2004. In addition, the impact of the high level of interest in the 2008 presidential election on registration and therefore turnout, has not been captured in this analysis.
Political alienation includes re-sponses “not interested in the election or not involved in pol-itics” and “my vote would not make a difference”; the remain-ing options respondents could choose from were considered structural barriers, such as “did not meet registration dead-lines”, “did not know where or how to register”, and “difficulty with English”. Overall, about 61 percent of the unregistered population cited political alien-ation as reasons for not being
registered, while about 39 percent cited difficulties overcoming structural barriers to voter registration.
However, a further breakdown by nativity reveals that most of the political alienation responses can be attributed to the native-born population. Native-born citizens are much more likely to not be registered because of politi-cal alienation than because of structural reasons. On the other hand, it is the other way around for naturalized citizens—structural barriers more often prevent them from registering than political alienation.A crucial element in any discussion about immigrants in America has not yet been factored into any of our
figure 5. | r e A s O n s n O T r e g i s T e r e d , B y n A T i V i T y , 2 0 0 8
s O U r c e : U.S. Census Bureau, DataFerrett, Current Population Survey, Voting and Registration, November 2008. A n A ly s i s B y d ē m O s .
P O L I T I C A L A L I E N A T I O NS T R U C T U R A L B A R R I E R
total
39%61%
native
37%63%
naturalized
43%57%

11from cItIzenshIp to votIng
analyses above—that of race and ethnicity. After all, native-born Americans are more likely to be non-Hispanic White (for now) and naturalized Ameri-cans are more likely to be His-panic and Asian. We introduce this variable in the “reasons not registered” analysis below. Fig-ure 6 provides breakdowns in responses by race and ethnic-ity (without regard to nativity), while Figure 7 provides a fur-ther demographic breakdown of these groups by nativity sta-tus within each group.
These figures show important differences among demograph-ic groups in the extent to which structural barriers versus po-litical alienation are reported as reasons for not being registered. Among citizens of any nativity, Hispanics, Latinos and African Americans are far more likely than whites to cite structural barriers as impeding registra-tion. In addition, native-born African Americans, Asians and Latinos all perceive greater structural barriers than native-born whites. A further analysis of “reasons not registered” by race and Hispanic origin reveals that though there is some varia-tion in the magnitude of the difference between responses across race and ethnic groups,
the direction is generally consistent. That is, the proportion of native citizens that are unregistered because of political alienation is larger than the proportion citing structural barriers, and vice versa for naturalized citizens—in nearly all of the race or ethnicity categories. The difference is particularly striking among Hispanics and to a somewhat lesser extent Asians.
figure 6. | r e A s O n s n O T r e g i s T e r e d , B y r A c e O r h i s P A n i c O r i g i n , 2 0 0 8
s O U r c e : U.S. Census Bureau, DataFerrett, Current Population Survey, Voting and Registration, November 2008. A n A ly s i s B y d ē m O s .
S T R U C T U R A L B A R R I E R P O L I T I C A L A L I E N A T I O N
total white black asian34 hispanic0 %1 0 %
2 0 %
3 0 %
4 0 %5 0 %
6 0 %7 0 %
figure 7. | r e A s O n s n O T r e g i s T e r e d , B y n A T i V i T y A n d r A c e O r h i s P A n i c O r i g i n , 2 0 0 8
structuralbarriers
Political alienation
totaltotal 39.2% 60.8%
native 37.2% 62.8%
naturalized 56.9% 43.1%
White, non-hispanic
total 34.9% 65.1%
native 34.4% 65.6%
naturalized 49.4% 50.6%
blacktotal 49.4% 50.6%
native 49.2% 50.8%
naturalized 52.6% 47.4%
asiantotal 51.8% 48.2%
native 44.1% 55.9%
naturalized 55.6% 44.4%
hispanic, all racestotal 50.8% 49.2%
native 46.3% 53.7%
naturalized 64.9% 35.1%s O U r c e : U.S. Census Bureau, DataFerrett, Current Population Survey, Voting and Registration, November 2008. A n A ly s i s B y d ē m O s .
12 from cItIzenshIp to votIng
O T h e r P O T e n T i A l fA c T O r s A f f e c T i n g r e g i s T r AT i O n g A P f O r n AT U r A l i z e d c i T i z e n s : A s s e s s i n g e X i s T i n g r e s e A r c h
Most of the literature on political participation to date has focused on the gap in voter turnout, rather than the divergence in voter registration. However, the analysis above suggests that registration has a central role in the nativity gap in turnout, and a few studies have shown that the determinants of voting apply to the likelihood of voter registration as well. In addition to the census data which highlights the importance of structural factors, discussed above, the following is a summary of what other existing research shows as to important variables that may explain the voting and registration gap: socioeconomic status, lack of mobilization in these communities, length of time in the United States, the type of community in which the citizen resides, language issues, and administrative discrimination.
soCioeConomiC FaCtors
Some academics have theorized over the years that one reason for lower registration and voting rates among new Americans may be socioeconomic factors, especially lower income and education levels. Voters with fewer such resources generally are found to have lower levels of voter participation in the United States. For example, in 2008, only 65 percent of citizens in households making less than $25,000 per year were registered to vote, compared to 85 percent of those in households making $100,000 or more.35
Naturalized Latinos are disproportionately in the low-income and lower level of education strata of American society and therefore, according to this research, less likely to vote than their native-born counterparts. Accord-ing to Matt Barreto, socioeconomic variables, including age and marital status (in addition to education and income) are strong indicators of one’s propensity to vote and “[g]iven that many immigrants, particularly those from Latin America, come to this country for economic opportunities, they typically have not had high levels of these…indicators.” As a result naturalized Latinos have typically not had high levels of participation.36 Robert A. Jackson also finds that variation in registration and voting rates among different Latino groups (including native-born) is largely due to variation in socioeconomic traits. For example Mexican Americans and Puerto Ricans are less likely to be registered “due to lower levels of education and income, their youth and mobility, and their greater likelihood of being immigrants.”37
However, other analyses of census data indicate that even controlling for these socioeconomic factors, naturalized citizens register and vote at a lower rate.38 According to these studies, socioeconomic factors impact the degree to which naturalized Americans are less engaged, but it is certainly not the only driving force.
Further, socioeconomic factors seem to play somewhat less of a role among Asian American immigrants. Wong notes that Asian Americans overall have relatively high education and income rates, yet low rates of voter par-ticipation.39 Xu speculates that, although Asians are less likely to immigrate to the U.S. based on economic need and are higher up on the socioeconomic ladder, they are more likely to come from undemocratic societies and therefore have little to no experience with elections and voting. She also theorizes that, due to discrimination, Asians see “little utility” in participating in the political system and rather look to individual and family advance-ment through other means to advance their interests.40
On the other hand, Pei-te Lien argues that because Asians come from a wide array of countries (or ethnicities) and are highly polarized in terms of income, education, and immigration background (e.g. timing and natural-ization rate), researchers must look beyond socioeconomic factors and take country of origin or ethnicity into account when analyzing the political participation of Asian Americans.41 Lien finds the impact of income and education on voting and registration to vary across the Asian subgroups. For example, level of income and rate
of registration have a proportional relationship among Chinese and Vietnamese Americans but not for other Asian American groups.42 The impact of country of origin on political participation is further explored below.
length oF time in the United states
Scholars have found that another very consistent predictor of voter participation is length of time in the United States. Loretta E. Bass and Lynne M. Casper suggest that as naturalized citizens spend more and more time in the United States, they “[build] stronger ties to community and becom[e] more integrated into U.S. institutions and social customs” and therefore, are more likely to participate in the political process.43 Bass and Casper also take note of the structural barriers to registration and voting, such as English proficiency, and how time spent in the US increases an immigrant’s ability to overcome them.44
Janelle Wong’s study using 2000 numbers shows how the relationship between length of time and political participation also applies to Asian Americans. She finds that naturalized Asians who have lived here more than twenty-one years actually have higher registration rates than native-born Asian Americans even after taking socioeconomic traits into account.45 Jun Xu also finds that length of residency in the United States is the major factor for Asian American and Latino immigrants in registering—and like Bass and Casper, she finds this is so to a far greater degree with respect to registering than to voting because of the increased acculturation to the system and society that is required to navigate this institutional procedure preceding arrival at the polls.
Variation bY CoUntrY oF origin
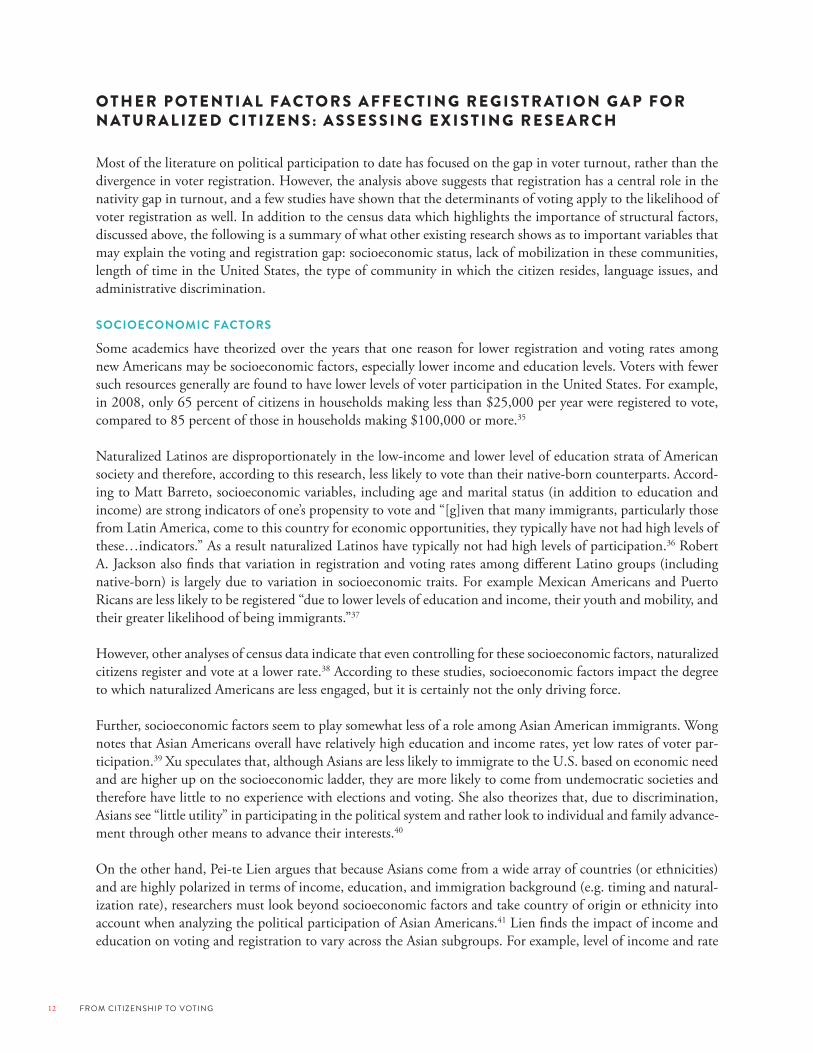
While most studies on immigrants and political participation take race into account, considerable variation also exists within racial groups. That is, voting and registration rates among immigrants can vary greatly by country of origin (see Figure 8).
figure 8. | V O T i n g A n d r e g i s T r A T i O n A m O n g n A T U r A l i z e d c i T i z e n s B y c O U n T r y O f O r i g i n i n 2 0 0 8
s O U r c e : U.S. Census Bureau, DataFerrett, Current Population Survey, Voting and Registration, November 2008. A n A ly s i s B y d ē m O s .
20% 30% 40% 50% 60% 70% 80% 90% 30%20% 40% 50% 60% 70% 80% 90%
P o l a n d
C h i n a
V i e t n a m
M e x i c o
R u s s i a
K o r e a
D o m i n i c a n R e p .
P h i l i p p i n e s
I n d i a
A l l N a t u r a l i z e d
T a i w a n
H a i t i
I t a l y
E l S a l v a d o r
A l l N a t i v e
G e r m a n y
C u b a
E n g l a n d
J a m a i c a
J a m a i c a
C o l o m b i a
T U R N O U T A M O N G V O T I N G - A G E C I T I Z E N P O P U L A T I O N
W I T H 9 0 P E R C E N T C O N F I D E N C E I N T E R V A L
R E G I S T R A T I O N R A T E A M O N G C I T I Z E N V O T I N G - A G E
P O P U L A T I O N W I T H 9 0 P E R C E N T C O N F I D E N C E I N T E R V A L
C a n a d a
C u b a
E n g l a n d
A l l N a t i v e - B o r n
T a i w a n
G e r m a n y
I t a l y
P h i l i p p i n e s
E l S a l v a d o r
A l l N a t u r a l i z e d
I n d i a
R u s s i a
D o m i n i c a n R e p .
H a i t i
K o r e a
V i e t n a m
M e x i c o
C h i n a
P o l a n d

14 from cItIzenshIp to votIng
The most commonly made link between country of origin and electoral participation is the type of regime or political system from which an immigrant came and therefore one’s prior experience with the democratic process, which may influence the likelihood of registering and voting.46
Much of the scholarly analysis of the impact of country of origin has focused on voter turnout (as opposed to registration) and the findings have been mixed.47 Catherine Simpson Bueker examined voter turnout among immigrant voters from ten countries using CPS data from 1994 to 2000 and found that country of origin does not have an independent impact on voting but rather, an interactive effect—that is, the impact of socioeconomic status on one’s likelihood of voting varies by country of origin. For example, immigrants with incomes below the poverty level from Mexico, Canada, Italy and Great Britain—all democratic countries—are much less likely to vote than their wealthier compatriots, but for immigrants from Southeast Asia, the Former Soviet Union, China, Cuba, India, and the Philippines—the first four of which are communist regimes—level of income is not a significant predictor of voting.48
Bass and Casper also find substantial variation in voting and registration rates by country of origin among new Americans from Asia and from Latin America.49 Among naturalized citi-zens from Asia, Filipinos are more likely to be registered and to vote than the Chinese—net of socioeconomic factors. Among naturalized citi-zens from Latin America, Dominicans are more likely to be registered and to vote than Mexi-cans—net of socioeconomic factors. In addition to regime type and democratic experience, the authors suspect English-speaking ability (e.g. Filipinos and Indians) and political socializa-tion in the United States (e.g. Dominicans) as reasons to why country of origin has an impact on voting and registration.
In addition, turnout among registered im-migrants varies by country of origin but to a much lesser extent (see Figure 9). More than 95 percent of immigrants from El Salvador, Haiti, Jamaica, Italy and Germany turn out to vote once they are registered, while immigrants from Russia, China, Poland, Vietnam and Taiwan vote at lesser levels after registration but never-theless at about 78 percent. Overall, registered new Americans vote at very high rates.
In her analyses, Pei-te Lien shows that once reg-istered, Asian immigrants have a higher likeli-hood of voting and once citizens, immigrants have a higher likelihood of registration than their native-born counterparts, net of socioeco-nomic factors. However, she also finds that the
figure 9. | V O T i n g A m O n g r e g i s T e r e d , n A T U r A l i z e d c i T i z e n s B y c O U n T r y O f O r i g i n , 2 0 0 8
s O U r c e : U.S. Census Bureau, DataFerrett, Current Population Survey, Voting and Registration, November 2008.A n A ly s i s B y d ē m O s .
M e x i c o
K o r e a
I n d i a
A l l N a t u r a l i z e d
E n g l a n d
J a m a i c a
C o l o m b i a
P E R C E N T V O T E D A M O N G R E G I S T E R E D
C a n a d a
C u b a
A l l N a t i v e - B o r n
T a i w a n
G e r m a n y
I t a l y
P h i l i p p i n e s
E l S a l v a d o r
R u s s i a
D o m i n i c a n R e p .
H a i t i
V i e t n a m
C h i n a
P o l a n d
70% 75% 80% 85% 90% 95% 100%

15from cItIzenshIp to votIng
ability to satisfy such institutional requirements (of naturalization and voter registration) varies among Asian subgroups (e.g. Japanese, Vietnamese, etc.) and that individual factors (such as income, gender, and marital status) do not have the same impact on turnout across ethnic groups. In sum, Lien argues that institutional, individual and context factors matter in Asian American political participation in different ways among ethnic groups but most importantly, that there is an ethnic gap in voting and registration in addition to institutional, individual and contextual factors.50
More research needs to be done disaggregating voter registration data by country of origin to better understand these variations.
l O c AT i O n
Studies on the impact of the community in which a naturalized citizen lives have mostly focused on voter turnout rather than registration. The preponderance though not the totality of research has found that living in majority-minority electoral districts facilitates voter participation. According to one study, turnout rates are higher in concentrated immigrant areas mainly due to commonality of language and communication.51 That is, immigrants are more likely to talk about elections, or find media coverage of them, in their native language because it is easier and more readily available in neighborhoods where they find many others from the same country or who speak the same language. Hence, immigrant communities “provide the critical context for engagement” by lowering language and information barriers.52
On the other hand, there is another strain of thought that argues that immigrant neighborhoods may be reflective of residential segregation that inhibits political participation. Ethnic enclaves may not only constrain socioeco-nomic mobility and integration, but also may isolate immigrants “from diverse discussion networks and civically active communities.”53 More research is needed in this area.
While much of the literature on immigrant communities has focused on traditional receiving centers for im-migrants, such as New York and California—often large metropolitan areas or near borders—recently, more immigrants in the United States are migrating to parts of the country that are not one of the so-called “gateway communities.” How do such new immigrant destinations fare in regards to political participation? According to Karen M. Kaufman and Antonio Rodriguez, living in a new locus of immigrant migration leads to lower partici-pation rates because community-based and other organizations that undertake mobilization efforts simply do not exist in new destinations, and that void is significant.54 Moreover, election-year registration efforts by third-party organizations focus almost exclusively on traditional immigrant locales. Even after considering individual-level indicators of party identification and participation (among Latinos), immigrants in new destinations are much more apolitical than their cohorts who live in immigrant communities that have been able to mature over the years. The authors also point out that this finding should impact how organizations trying to increase Latino and immigrant participation conduct their mobilization strategies.55

16 from cItIzenshIp to votIng
These findings are of particular interest because states that gained population, and thus seats in the 2010 round of reapportionment, did so largely as a result of immigrants and many of them are new destination states, such as Georgia, Nevada, South Carolina, and Utah (see Figure 10). At the same time, these states with more seats and more immigrants have had some of the lowest turnout rates in the nation (with the exception of Washington which has all-mail voting). Therefore, immigrants have the potential to gain the representation that they brought to the state but not without much needed mobilization efforts and resources.
e X T e n T O f m O B i l i z AT i O n B y PA r T i e s A n d c A n d i d AT e s
Although the campaign of President Barack Obama in 2008 began to change this dynamic marginally, campaigns and parties still do not invest sufficiently in mobilizing the immigrant or even the ethnic minority vote, particu-larly when it comes to voter registration, calculating that their resources are better spent focusing on prospective voters who already have a history of high participation rates.56
This is hardly surprising since a major data source the parties and candidates use in targeting voters for mobi-lization is voter registration lists. Although they have started employing more sophisticated lists containing a variety of identifying factors about potential voters, it is still the case that the voter registration list is the most readily available source of information to the parties. Many states provide information identifying individuals’ party registration and the party primary in which they voted.57 This allows voter registration lists to provide the fundamental basis for voter outreach.
Moreover, Janelle Wong points out that unlike at the turn of the 20th century when the political parties played a major role in personally mobilizing immigrants to participate and become engaged, that is not the case now. “Today, parties primarily use direct-mail and media campaigns that target only those registered voters who are the most likely to vote, a group that includes few immigrants. The potential for mass-mobilization efforts—including the type of face-to face mobilization at the neighborhood level that in the past was standard practice for reaching European immigrants—has been overlooked in favor of party activity confined primarily to the airwaves.”58 This has made the parties’ efforts less effective than they could be given that we know (as detailed more below) that personal mobilization of the sort Wong describes has a real impact on participation rates. Research has shown that direct mail and paid advertising, by contrast, are not very effective in mobilizing voters.59 Parties have the opportunity to do much more to mobilize immigrants, especially those who have not yet registered.
vap turnout rate percentage change, 2000-2010
state 2010 2008 total native-born naturalized
arizona 34.7% 45 47.7% 48 24.6% 20.4% 40.6%florida 36.9% 33 58.3% 32 17.6% 11.1% 30.7%georgia 34.8% 44 54.7% 39 18.3% 13.4% 67.1%
nevada 36.2% 37 49.7% 47 35.1% 22.3% 63.5%
south carolina 37.9% 30 55.8% 37 15.3% 8.4% 38.1%texas 27.1% 50 45.8% 49 20.6% 11.6% 29.9%utah 32.7% 47 50.4% 43 23.8% 17.7% 35.7%washington 48.2% 9 60.3% 23 14.1% 7.5% 34.2%n O T e : The column of numbers to the left of 2010 and 2008 turnout rates reflect the states’ turnout rank among the fifty states (highest turnout: 1, lowest turnout:50).
s O U r c e s: McDonald, Michael P. 2010, “Presidential and Midterm Voter Turnout Rates, 2008-2010.” United States Elections Project, accessed December 22, 2010; U.S. Census Bureau, American Community
Survey 2005-2009, accessed December 22, 2010. A n A ly s i s B y d ē m O s .
figure 10. | r A T e O f P O P U l A T i O n c h A n g e A n d T U r n O U T i n s T A T e s T h A T g A i n e d c O n g r e s s i O n A l s e A T s i n 2 0 1 0 .

17from cItIzenshIp to votIng
l A n g UA g e B A r r i e r s
As noted above, the longer an immigrant has lived in the United States, the more likely it is he has become profi-cient in English.60 This last hypothesis naturally leads to the question of whether, and to what degree, insufficient knowledge of English affects navigation of the registration and voting process.61 Studies about the impact of Sec-tion 203 of the Voting Rights Act62—which requires jurisdictions with large numbers of language minority voters to provide translated voting materials (including registration forms and instructions)—indicate that language plays a significant role. According to a study by Michael Jones-Correa, voters who have access to voting materials in their own language are 5 percent more likely to have voted in the 1996 and 2000 elections.63 In addition, he finds that the language provisions of the Act have their biggest impact by far on naturalized Americans.64
Growth in Asian American voting bears out the importance of Section 203. Jocelyn Benson reports that in 1992 the numerical triggers of Section 203 were amended to cover more predominantly Asian communities, and as a result, over 672,000 citizens of Asian descent in seven states were eligible to receive minority language assistance, including translated registration forms and instructions, after the 2000 census.65 Census data from 1998 and 2004 show a 61 percent growth in registration rates and a 98 percent increase in turnout rates among self-identifying Asian American citizens between November 1998 and November 2004.66
However, compliance with Section 203 is uneven at best in many jurisdictions that are covered by it.67 More-over, not every jurisdiction is required to provide such language assistance and there are many limited English proficient Americans in all corners of America, including places that are not covered by the Act. It would seem natural that limitations in reading and understanding English might deter or make it especially difficult for natu-ralized citizens to register. Although immigrants are of course required to learn basic English in order to become citizens, this knowledge might not be extensive enough to make them comfortable inquiring into how to get a registration form and filling it out confidently, let alone voting. Ballots and ballot questions can be complicated and difficult to understand for advanced, even native English speakers—for example, in 2004, a number of na-tive English speakers complained to a Nevada legislator that ballot questions were too difficult to understand.68
Yet learning and becoming proficient in English is itself a huge hurdle in this country for immigrants, including naturalized citizens and non-citizens applying to become citizens. English language instruction, including for those who already speak basic English, is woefully scarce and under-funded, and waiting lists in some jurisdic-tions for such classes are years long.69 As James Tucker notes, “Few classes are available to intermediate and more advanced English learners, because ESL providers are flooded by the demand for the most basic instruction. It can take several years for LEP students to acquire spoken English language and literacy skills equal to those of a person with a fifth grade education—and that level is still functionally illiterate.”70
d i s c r i m i n AT O r y P r A c T i c e s
In addition to the contextual reasons why naturalized citizens might be less likely to register to vote, there are also discriminatory policies that inhibit their ability to register to vote. They include the following:
administratiVe disCrimination:
There are frequent reports of ethnic minorities being blocked by election administrators in the voter registration process. Many accounts emerged during hearings on the reauthorization of the Voting Rights Act in 2006. For example, Victor Landa from the Southwest Voter Registration Education Project “described ‘strategic’ efforts in the 2004 Texas election cycle to prevent some citizens from registering to vote. ‘In one county in South Texas, some of our Spanish-speaking volunteers were denied the eligibility to be deputized as registrars,’ he said, adding

18 from cItIzenshIp to votIng
that in Texas only deputized registrars can register voters in the field.”71 José A. Garcia, representing the Institute for Puerto Rican Policy and the Latino Voting Rights Network, also described the refusal to register Latinos in New York.72 Nina Perales, regional counsel of the Mexican American Legal Defense and Educational Fund (MALDEF), testified about other examples—including how in Colorado voter registration branches were placed in Anglo homes and there were limited hours for farm workers to register to vote.73
prooF oF Citizenship laWs:
State voter registration laws uniformly require registrants to affirm, under threat of criminal penalties, that they are U.S. citizens. However, two states, Arizona and Georgia, have passed additional laws requiring voters to pro-vide documentary proof of their citizenship prior to registering to vote.74 These laws are a barrier to registration, before a voter even gets to the point of casting a ballot.
Proof of citizenship requirements are designed to have a depressing effect on naturalized citizens in particular. This is reflected in the voting provisions of the laws: all documentary evidence of citizenship (e.g., birth certifi-cates) may be photocopied and mailed into the registrar—except naturalization papers, which must be presented in person in their original form to the board of elections.75
Many eligible voters will not have access to documentation that proves they are citizens. Barreto finds that foreign-born U.S. citizens are less likely to have a driver’s license than white native-born Americans.76 In some states a driver’s license would not even do, and then the only acceptable proof is effectively a birth certificate, passport, or naturalization papers. The Brennan Center has found that approximately 13 million Americans do not have ready access to such documents.77 If the voter does not have those documents on hand, he or she will have to pay to acquire them, amounting to a poll tax. Indeed, naturalization documents cost $220 to replace if they have been lost or damaged in some way.78 And such restrictive requirements are unnecessary: as noted above, voter registration forms already require an applicant to affirm under oath that he or she is a citizen, under penalty of criminal sanctions.
inaCCUrate database CheCKs on Citizenship:
In 2008, the Secretary of State of Georgia started instituting a “citizenship check” or verification of not only new registration forms coming in, but of voters already on the registration rolls. The procedures flagged certain voters as alleged non-citizens based on records from the Georgia Department of Driver Services (DDS). The records, however, contained out-of-date citizenship information because DDS fails to update them to reflect the thousands of Georgia residents who become U.S. citizens each year. Since the errors were made due to out-of-date records on citizenship, it was clear that this practice was going to affect eligible naturalized Americans more than others. Those who were flagged were denied the right to vote unless they presented written evidence of citizenship.79 In October of 2008, a coalition of voting rights groups filed a lawsuit challenging the voting procedures after a number of U.S. citizens had been incorrectly flagged as non-citizens.80 The Department of Justice in the mean-time twice interposed objections to the new law under its Section 5 authority to block changes in voting laws in certain covered states if the change would negatively affect minority voters. The Department found “the Georgia Secretary of State was seeking to implemented a “flawed system [which] frequently subjects a disproportionate number of African American, Asian, and/or Hispanic voters to additional, and more importantly, erroneous burdens on the right to register to vote. These burdens are real, are substantial and are retrogressive for minor-ity voters.”81 Unfortunately, after extensive litigation, and a minor change to the pool of people who would be subjected to the citizenship check, the Department of Justice very suddenly approved the practice, apparently making the case “moot.”82 This meant that Georgia could go forward with a program the Department previously found to have resulted in wrongful burdens on minority voters.

19from cItIzenshIp to votIng
other error-prone database matChing praCtiCes:
When voters submit their voter registration applications, under the Help America Vote Act (“HAVA”) states are supposed to determine if the information on the form matches the information they have on file in other government databases, such as that maintained by the Department of Motor Vehicles. However, different states have different procedures and policies for determining what qualifies as a match.83 Some states, unfortunately, have rules requiring that some or all of the information match exactly, character for character. This results in perfectly eligible voters being denied the right to register and vote; there are many reasons such information might not match that say nothing about the voter’s eligibility or identity. Even familiar names such as “O’Brien” can trigger a “non-match” if an apostrophe is missing or if the “B” is sometimes capitalized and sometimes not. But an “exact-match” standard particularly affects Latinos, not only because of unfamiliar spellings but because they may use their mothers’ maiden name as part of the surname—a practice that may be unfamiliar to some state and local election officials. For all immigrants, especially Asians, errors may be more likely because election administrators may be less familiar with their names, which may have unusual spellings for an English speaker.

20 from cItIzenshIp to votIng
What Can be done
Narrowing the registration gap will take action from government, political parties, and non-profits alike. The recommendations below fall into three broad categories: making registration easier for new Americans by address-ing structural barriers to registration, focusing mobilization efforts on these communities, and providing better resources for them to obtain civic education and the tools to participate. Of course, these recommendations will be even more effective when implemented in concert.
implementing Federal initiatiVes to improVe aCCess and ease oF Voter registration For natUralized Citizens
As has been discussed, the federal government does little to proactively facilitate participation in our electoral process and, despite the public rhetoric around citizenship, has until very recently has done little systematically assist new Americans in particular to navigate through a new system. This can easily be remedied.
nVra designation For the oFFiCe oF Citizenship and immigrant serViCes
In October 2011, United States Citizenship and Immigrant Services announced new guidelines that would be provided to regional and local USCIS staff regarding naturalization ceremonies.84 This new guidance advised that state or local election officials or nonprofit, nonpartisan organizations should provide voter registration services at naturalization ceremonies. If that is not possible, USCIS staff should offer newly naturalized citizens a voter registration reform, but do not have the responsibility of collecting or processing them. This new guidance is a huge step forward. But the federal government could do much better.
The National Voter Registration Act of 1993 (“NVRA”) includes a provision that requires state-based public assistance offices to provide voter registration materials to clients, assist them in filling out the forms, and transmit them to the proper elections office. The law also provides that federal government agencies could be designated as voter registration agencies and thus also required to provide these services. As the law was written, this requires a state to request such a designation and the federal agency to accept it. This provision remained largely unused until recently when several states, as a result of educational efforts by Dēmos and other voting rights organizations, have begun requesting various federal agencies to accept designations under the NVRA.85 No federal agency has yet accepted such a designation, but the requests remain under consideration by agencies such as USCIS, the Department of Veterans Affairs and Indian Health Services.
The federal entity responsible for the naturalization process, the United States Office of Citizenship and Immi-grant Services (“USCIS”) is one of the agencies that clearly should be designated as a voter registration agency in the same way other public assistance offices currently are. Since this has not yet happened through the methods prescribed by the NVRA—at state request—it should preferably be done by presidential executive order, which is fully within the executive power to do,86 or by agency directive. The order or directive should specify that USCIS staff is required at all naturalization ceremonies to provide voter registration forms, assist new Americans with their accurate completion, and transmit them to the proper elections authority for processing. Doing so is clearly within the agency’s mission, mandate and capacity.87
Based on the studies described above, it is clear that uniformly and systematically providing every new American with the opportunity to register to vote at the naturalization ceremony itself is the biggest step the United States could take to close the registration gap. This is further evidenced by the fact that the state public assistance agen-

21from cItIzenshIp to votIng
cies, when compelled to fully implement this mandate, have seen dramatic increases in the numbers of persons applying to register to vote.88 Adopting a policy of encouraging voter registration at naturalization ceremonies would also send an affirmative message about our country’s desire to include new American citizens in our polity and civic society.
modernizing Voter registration praCtiCes
“Voter Registration Modernization” (“VRM”) is a reform that would streamline the registration process by using existing government databases to populate and update voter registration rolls for eligible citizens. This transfor-mation of our voter registration process would result in a much more effective and inclusive system, because the burden of registering to vote and making sure one stays on the rolls would no longer rest exclusively on the indi-vidual citizen. Under VRM, departments of motor vehicles, public assistance agencies, and other governmental offices would collect basic information from their client databases and transmit to state election officials all the data necessary—and only that which is necessary—for adding citizens to the voter rolls. Individuals preferring not to register to vote could exercise an opt-out option. Any eligible voter who was missed by automatic voter registration procedures would have an opportunity to add herself to the voter rolls and cast a regular ballot on Election Day.89
While no in-depth examination has been undertaken, it would appear that USCIS’ database of persons who successfully naturalize could at some point be made to work well within a VRM system. As a result, it may be that at some future date, the system of providing registration at all naturalization ceremonies proposed above could be converted into a more automatic voter registration system within the VRM scheme.
USCIS has many databases, but the one that seems most appropriate for VRM is the CLAIMS 4 database. CLAIMS 4 is a tracking and processing system that is used to monitor the different stages of the naturalization process, including the oath ceremony and the granting of citizenship.90
The database includes all of the information necessary for voter registration including, obviously, citizenship status. The database also contains such needed data as names and addresses, telephone numbers, birth informa-tion, death information, Social Security Numbers (SSN), and criminal history information.91
Most of the information in the CLAIMS 4 database is obtained from the applicants and entered by USCIS staff. “CLAIMS 4 information is also checked for accuracy through database technical controls (e.g., a program that checks the zip code to ensure it matches the city, state and street), inherent business logic built into the system, and a manual review process (e.g., interviews with the applicants).”92
USCIS is in the process of modernizing its information technology across the board, and is still largely paper-based.93 In addition, it must be noted that experts have questioned the accuracy of other related databases.94 USCIS systems’ readiness for VRM requires more study to ensure efficiency, fairness and accuracy before steps are taken to implement such a transition.
engaging natUralized Citizens and their CommUnities throUgh targeted mobilization eFForts
Unless and until the federal government fully takes on the responsibility for voter registration, Americans will continue to rely on other institutions to perform this function. Numerous studies undertaken in recent years demonstrate that focused mobilization activities have a significant positive effect on turnout rates among ethnic minority and immigrant voters.95 For example, a concerted mobilization campaign led by organizations such as

22 from cItIzenshIp to votIng
National Association for Latino and Appointed Elected Officials (NALEO) and Southwest Voter Registration and Education Project, focused on immigrant communities in California in 2002, led to a dramatic increase in the number of naturalized citizens registered to vote that year.96 Such efforts need to be expanded by national nongovernmental organizations (“NGOs”), political parties and candidates, and the government at the state and local levels.
oUtreaCh bY non-goVernmental organizations:
In recent years NGOs have realized the benefit of reaching out to not just native-born ethnic minorities but the naturalized community as well, though this does not seem to have always been the case. Though in a few recent elections registered naturalized Latino voters have actually voted at a slightly higher rate than native-born Latinos, the voter turnout of registered naturalized Latinos generally remains well below that of the general population, and there is still much room for improvement with respect to increasing the number of naturalized Latinos who are registered.97 NGOs that focus on Asian Americans may have even more of a motivation to increase efforts at mobilization to register naturalized voters given that a large number of Asian Americans are naturalized citizens and that naturalized Asians are actually registered at a slightly lower rate than other naturalized groups. That naturalized Asian Americans constitute a majority of all Asian American citizens leads to a rate of participation of the Asian American community overall that is far lower than that for non-Asians.98
Examples of recent outreach to the immigrant population include the efforts of NALEO and the National Council of La Raza and their partners who launched the“YaEsHora! Ve y Vota!”campaign in 2008.99 These or-ganizations along with the We Are America Alliance joined in a coordinated effort to register immigrant voters, for example, by holding events on National Citizenship Day in September of that year that registered 20,000 Latino, Asian and immigrant voters. The partners were able to register 372,591 immigrant voters by focusing on thirteen states with large immigrant populations.100
These types of efforts should be sustained year round, not just at election times. Clearly the will among groups to do that is there. The resources necessary are the major obstacles to carrying it out. This makes it more incumbent on foundations and other donors supporting these efforts as well to understand the importance of year-round registration assistance for new Americans and to allocate their resources accordingly.
In addition, although again resources are a problem, some organizations might reconsider where they are focus-ing their efforts. For understandable reasons, major groups as well as smaller community organizations tend to focus their efforts and resources where they seemingly can get the “biggest bang for the buck”: where there are large numbers of ethnic minorities in concentrated areas. Working with academics, it should be determined whether this is really the best use of limited resources in all circumstances. Existing literature for the most part says that ethnic minorities, including immigrants, who live in such communities, are more likely to turn out than immigrants in areas in which they are more dispersed.101 More research needs to be done on the extent to which this is a result of the concentrated activity of outside groups in these areas, or whether there is something more intrinsic to these communities that leads to higher participation. If the latter is the case, we must reassess whether it might not be useful to devote some increased attention to immigrants and ethnic minorities not living in minority or immigrant-dominated communities, including those who live in “new destinations” in the United States. Given the consistent research showing that the most effective outreach for the dollar is that provided by a co-ethnic and someone who speaks the voter’s language,102 non-governmental organizations big and small, national and local, have a special role to play. This is something that all those interested in increasing immigrant citizens’ turnout need to understand—while the immediate raw numbers that result from such efforts might not be as large because the population is dispersed, the type of voters reached are the ones that needed the extra attention the most, and may go on to become consistent voters in the long term.

23from cItIzenshIp to votIng
oUtreaCh bY state and loCal oFFiCials:
The government has a role to play in this too. In some parts of the nation, elections officials take a very proac-tive approach to getting new Americans registered, for example in Phoenix, Arizona and by the Secretary of State in Michigan.103 In most parts of the country, they do not. This should change, including in areas of the country where language minority assistance is not necessarily required under the federal laws. At a minimum, it is not expensive or labor intensive to make voter registration forms in alternative languages widely available in a community, and to provide voter assistance in that language as well, through a hotline. The Election Assistance Commission (“EAC”), the federal agency that provides guidance on election practices in the United States, has very commendably provided a multitude of voting materials and registration forms in several languages and has posted them on its website. State and local government officials can easily make use of this service, and should do so. The registration form made available by the EAC, the federal voter registration form, must be accepted by state elections officials under the NVRA.104
oUtreaCh bY politiCal parties and Candidates:
A plethora of research has shown that when parties want to mobilize a particular constituency, they can be ef-fective at doing so.105 To date, the parties have not seen it as in their interest to invest in the naturalized citizen population because it does not fit within their “win now” mentality and short-term thinking about elections. The population of naturalized immigrants is an untapped enormous potential piece of the electorate, but tak-ing advantage of this requires seeing the big picture and not just being focused on immediate gains. The parties particularly ignore naturalized Americans who remain unregistered. This is a missed opportunity given the de-mographic revolution occurring in the United States today. It would appear to be in the parties’ long-term and even medium-term self-interest to focus on this group.
As scholars such as Janelle Wong have also suggested, this needs to change. Wong has made specific recommen-dations for political party outreach that have resonance here, such as mass registration drives throughout the year (rather than only during the campaign season), direct education about the political process both through in-person methods and written material, and workshops and town hall meetings.106 To be sure, this would be resource intensive, though perhaps achievable if done in conjunction with local actors and community organiza-tions. Even if overly ambitious, these suggestions ought to be considered at some level of capacity.
The candidates also have a role to play. When it comes to the naturalized citizen vote, the candidate and what the candidate believes, does, and says matters. NGOs can make huge efforts to mobilize these groups, but if the community does not like the candidates or their positions, or are alienated by the lack of attention a candidate pays to the community and its interests, it will only make a marginal difference in the end. Like any other con-stituency, immigrant voters need a reason to turn out regularly to vote, beyond just a sense of civic duty. Solely having paid advertisements in Spanish will not do it. As with other groups, the candidates must speak to their issues in a way that attracts immigrant citizens to them. As with other groups, candidates must want the votes of these Americans and make that clear.107 Of course the problem with this is that as naturalized citizens continue to under-participate, candidates have less of an incentive to do this kind of work, and it devolves into an unfor-tunate vicious circle. Therefore, possibly more groundwork in the other areas discussed here would have to be underway before such an outcome can be legitimately expected in a wide range of campaigns.
On the other hand, the centrality of the candidate certainly holds true even now depending on the conditions surrounding the campaign. The need for candidate attention was anecdotally observed in the 2009 election for governor in the State of Virginia. Although community groups undertook Herculean efforts to mobilize im-migrant voters in this new immigrant destination state, neither candidate took appealing positions on issues of concern to immigrant voters, including on immigration issues. As a result of this and other factors, though

24 from cItIzenshIp to votIng
the mobilization efforts had some positive effect, immigrants, and other constituencies similarly situated, dis-proportionately stayed home on Election Day. Many political observers attributed the Democrats’ loss to this abstention.108
aCCelerating the CiViC edUCation and CiViC sKill-bUilding proCess:
As noted above, many studies show that length of time in the country is key to whether a naturalized citizen will be registered to vote or not. These studies all seem to suggest that as an immigrant becomes more familiar with the American system, politics and culture and feels more a sense of belonging to this country, he or she becomes more inclined to participate. This should not take twenty years to accomplish. The lack of effort and programs throughout our system with regard to immigrant civic inclusion are at least partially to blame. Increased resources and interest in providing civic education, civic skill-building, and systems through which immigrants learn about and participate in our democracy even prior to attaining citizenship and voting rights would go a long way to reducing the time within which a naturalized citizen becomes inclined to register to vote. This is something that must be taken on at all levels of government, and to the extent that resources permit, by NGOs and community organizations. Such programmatic and systemic approaches to immigrant civic inclusion throughout our gov-ernment and our civil society are essential not only for maintaining the integrity of our electoral process, but in maintaining the health of our democracy as a whole.
Providing resources for immigrants to learn English is a major part of this. We know that language has a direct impact on voter participation, and in civic, economic, and social integration in general.109 Recent legislative efforts at immigration reform would demand even greater levels of proficiency in English than ever before in order to become naturalized.110 Yet the government provides only a small fraction of the resources necessary to allow new Americans and other immigrants who may wish to become citizens to learn English.111 This includes the public schools. This will need to change if we want to close the participation gap between native-born and naturalized citizens in our system of governance.

25from cItIzenshIp to votIng
ConClUsion
Without the sufficient participation of naturalized Americans and other under-represented groups, our de-mocracy is flawed. Democracy needs a broad spectrum of society to participate in order to ensure appropriate representation and policy outcomes that reflect the will of the people. We are failing to ensure that many groups in our society are able to vote, and naturalized citizens are at the top among them. This need not continue. There are many solutions for overcoming barriers to political participation for naturalized citizens, including the simple but powerful step of ensuring that all new Americans receive assistance in registering to vote at the naturalization ceremony itself.
The potential repercussions for the coming 2012 elections are palpable. Yet they are in many ways still just po-tential. Immigrants make up a far greater share of the population than they do the electorate. To some degree this is because many immigrants who are eligible to become citizens have not done so. It is estimated that 800,000 Asians in California alone are eligible to naturalize but have not, and remain therefore ineligible to vote.112 In 2010, although Latinos voted in unprecedented numbers, they still made up 16.3 percent of the population but only 7 percent of the electorate, in large part because many Latinos were not eligible—only 41 percent.113 As immigration reform has become increasingly controversial and at the same time a major factor in Latino and Asian electoral decision-making in the polling booth, immigrant voters could be the margin of victory in many states if they naturalize, register and vote. Many of the thoughts and recommendations set forth in this paper regarding mobilization and outreach efforts among a variety of actors will be a factor in how this turns out.
In the long term, it is clear that we as a nation need to make a concerted commitment to including immigrant citizens in our democracy. Particularly at the governmental level, we have not done enough in this regard. Whether or not we achieve comprehensive immigration reform in this country, rapidly changing demograph-ics dictate that it is more necessary than ever that government, non-governmental organizations, community groups, the media and the public work together to make new Americans full members of our polity and society.

26 from cItIzenshIp to votIng
reCommendations
•United States Citizenship and Immigrant Services (USCIS) should fully implement its newly adopted policy of ensuring that new Americans are provided with a voter registration application at all administrative naturalization ceremonies, and ultimately should be designated as a full voter registration agency under the National Voter Registration Act so that every newly naturalized American is automatically and systematically given the opportunity to register to vote.
•Nongovernmental voter mobilization groups should focus a good portion of their efforts on unregistered naturalized citizens including, if possible, in “new destination” states.
•The donor community should fund year-round activities around voter registration, including in immigrant communities wherever they may be.
•State and local elections officials should be active in registering new citizens to vote by reaching out to these communities through a variety of means and working with USCIS to provide voter registration services at naturalization ceremonies. These officials should also provide as much material as possible in alternative languages spoken prevalently in their jurisdictions, whether required to by federal law or not.
•Political parties should be much more pro-active in reaching out to naturalized citizens, tapping into a huge potential pool of new voters. The parties also have a role to play in civic education especially regarding the electoral process in immigrant areas.
•Candidates must appeal to and speak to the issues of concern to immigrants. Having paid advertising in Spanish is insufficient.
•The civic education and civic skill-building process must start early on upon an immigrant’s arrival in this country so that by the time they are eligible to register and vote they understand the process and the importance of participating. This means more government resources for such services, including English as a Second Language instruction.
•Every means possible must be explored for eliminating administrative practices and legal requirements that discriminate against eligible immigrant voters. These include certain types of database matching policies, laws unduly restricting the means of confirming citizenship for purposes of registering to vote, and unnecessarily restrictive voter identification laws. Swift and serious action must be taken against any election administrator or other actors who engage in discriminatory practices.

27from cItIzenshIp to votIng
e n d n O T e s
1. United States Census Bureau, DataFerrett, Current Population Survey, Voting and Registration, November 2004-2010, analysis by Dēmos.2. Id.3. Id.4. Id.5. Id.6. Id.7. Issues around Americans’ alienation from the political process and low levels of feelings of political efficacy are complex and are the subject of an enormous
literature. Structural features of the system can contribute to what is referred to as “political alienation.” See, e.g., Frances Fox Piven and Richard A. Cloward, Why Americans Still Don’t Vote And Why Politicians Want to Keep it That Way, Beacon Press, 2000, especially pp. 39-44.
8. United States Census Bureau, supra note 1.9. Sarah R. Crissey and Thom File, “Voting Behavior of Naturalized Citizens: 1996-2006,” United States Census Bureau Housing and Household Economic Statistics
Division, Paper presented at the Annual Meeting of the Population Association of America, New Orleans, LA, April 16-19, 2008.10. See, e.g., S. Karthick Ramakrishnan and Thomas J. Espenshade, “Immigrant Incorporation and Political Participation in the United States,” The International
Migration Review, Fall 2001, Vol. 35, No. 3, p. 870; Catherine Simpson Bueker, “Political Incorporation Among Immigrants from Ten Areas of Origin: The Persistence of Source Country Effects,” The International Migration Review, Spring 2005, Vol. 39, No. 1, p. 103.
11. Karen M. Kaufmann and Antonio Rodriguez, “Local Context and Latino Political Socialization: Why Immigrant Destinations Matter,” Presented at National Conference on Latino Politics, Power and Policy at Brown University, October 24, 2009, p. 12.
12. Janelle S. Wong, Democracy’s Promise: Immigrants and American Civic Institutions, University of Michigan Press, 2006, p. 52. 13. 42 U.S.C. §§ 1973aa-1a.14. See Model Plan for Administrative Naturalization Ceremonies; Revision to Adjudicator’s Field Manual (AFM) Chapter 75.3; AFM Update AD10-53; Dēmos,
“Voter Registration for New Americans: The USCIS Has New Guidance on Voter Registration at Naturalization Ceremonies,” November 2011, available at http://www.Dēmos.org/sites/default/files/publications/VoterRegistration_ForNewAmericans_Dēmos.pdf ;
15. Jennifer Rosenberg with Margaret Chen, “Expanding Democracy: Voter Registration Around the World,” Brennan Center for Justice, June 10, 2009.16. See Scott Novakowski, “Fulfilling the Promise,” Dēmos, July 22, 2010, available at http://www.Dēmos.org/sites/default/files/publications/Fullfilling_Promise_
NVRA_Dēmos.pdf.17. 17 See Model Plan for Administrative Naturalization Ceremonies, supra note 14; Dēmos, “Voter Registration for New Americans, supra note 14; Tova
Andrea Wang, “A Citizen from Day One,” Dēmos, June 29, 2010, available at http://www.Dēmos.org/sites/default/files/publications/CitizenFromDayOne_Dēmos.pdf.
18. Janelle S. Wong, supra note 12.19. See for example, “Funders’ Committee for Civic Participation and the Proteus Fund,” Voter Engagement Evaluation Project, January 2006.20. Migration Policy Institute, “Immigrant Population in the United States at Historic High — But Does a ‘Data Illusion’ Affect the Increase?”, October 27, 2011.21. Thomas A. Gryn and Luke J. Larsen, “Nativity Status and Citizenship in the United States: 2009,” United States Census Bureau, October 2010, available at http://
www.census.gov/prod/2010pubs/acsbr09-16.pdf. ^ An estimated 12.6 million Legal Permanent Residents lived in the United States on January 1, 2008. Nancy Rytina, “Estimates of the Legal Permanent Resident Population in 2008,” Department of Homeland Security, Office of Immigrant Statistics, October 2009. ^ Although the number of undocumented persons is not definitively known, the Department of Homeland Security estimates are that it is about 10.8 million. Michael Hoefer, Nancy Rytina, and Bryan C. Baker, “Estimates of the Unauthorized Immigrant Population Residing in the United States: January 2009,” Department of Homeland Security, Office of Immigrant Statistics, January 2010.
22. James Lee, “U.S. Naturalizations: 2010, Annual Flow Report,” Department of Homeland Security, Office of Immigration Statistics, April 2010, available at http://www.dhs.gov/files/statistics/publications/gc_1302103955524.shtm.
23. James Lee and Nancy Rytina, “Naturalizations in the United States: 2008,” Department of Homeland Security, Office of Immigration Statistics, March 2009.24. U.S. Census Bureau, supra note 1.25. Id.26. Id.27. Id.28. Id.29. Sarah R. Crissey and Thom File, supra note 9, at p. 8.30. Rob Paral of the Immigration Policy Center took note of this in his 2004 report analyzing the immigrant and minority electorate in the 1996 and 2000
elections—“while new citizens are less likely than the native-born to take the crucial step of registering to vote, they are more likely to actually vote once they do so.” Rob Paral, “Power and Potential: The Growing Electoral Clout of New Citizens,” Immigration Policy Center, October 1, 2004.
31. Janelle S. Wong, supra note 12, at p. 172.32. Jun Xu, “Why Do Minorities Participate Less? The Effects of Immigration, Education, and Electoral Process on Asian American Voter Registration and Turnout,”
Social Science Research 34, pp. 682–702, 2005, at p. 694.33. Issues around Americans’ alienation from the political process and low levels of feelings of political efficacy are complex and are the subject of an enormous
literature. Structural features of the system can contribute to what is referred to as “political alienation.” See for example, Frances Fox Piven and Richard A. Cloward, supra note 7, especially pp. 39-44
34. The category Asian includes Asian, Pacific Islanders and Native Hawaiians as a result of collapsing the two Census categories, “Asian or Pacific Islander” and “Native Hawaiian or Other Pacific Islander”.
35. United States Census Bureau, supra note 1..36. Matt A. Barreto, “Latino Immigrants at the Polls: Foreign-born Voter Turnout in the 2002 Election,” Political Research Quarterly 2005, 58, 79 at p. 79.37. Robert A. Jackson, “Differential Influences On Latino Electoral Participation,” Political Behavior, Vol. 25, No. 4, December 2003, at p. 347.38. Sarah R. Crissey and Thom File, supra note 9.39. Janelle S. Wong, supra note 12, at p. 155.40. Jun Xu, supra note 32, at p. 698.41. Pei-te Lien, “Asian Americans and Voting Participation: Comparing Racial and Ethnic Differences in Recent U.S. Elections,” International Migration Review, Vol.
38, No. 2, Summer 2004.42. Id. at p. 510.43. Loretta E. Bass and Lynne M. Casper, “Impacting The Political Landscape: Who Registers and Votes among Naturalized Americans?” Political Behavior, Vol. 23,
No. 2, June 2001, at p. 121.44. Id.45. Janelle S. Wong, supra note 12, at pp. 162, 165.46. See, e.g., S. Karthick Ramakrishnan, Thomas J. Espenshade, supra note 10, at p. 870; Catherine Simpson Bueker, supra note 10, at p. 103.47. See Loretta E. Bass and Lynne M. Casper, supra note 43; Benjamin Highton and Arthur R. Burris, “New Perspectives On Latino Voter Turnout In The United
States,” American Politics Research, Vol. 30 No. 3, May 2002, pp. 285-306, at p. 290.
28 from cItIzenshIp to votIng
48. Catherine Simpson Bueker, supra note 10, p. 103.49. Loretta E. Bass and Lynne M. Casper, supra note 36, at p. 122.50. Lien, supra note 41, at p. 513.51. See Gary Segura and Nathan Woods, “Majority-Minority Districts, Co-ethnic Candidates, and Mobilization Effects,” Prepared for presentation to the University
of California, Berkeley, Warren Institute on Civil Rights, Conference, Washington, DC, February 9, 2006; Matt A. Barreto, Gary M. Segura, and Nathan D. Woods, “The Mobilizing Effect of Majority-Minority Districts on Latino Turnout,” American Political Science Review, Vol. 98, No. 1, February 2004, pp. 65-76.
52. Michael Parkin and Frances Zlotnick, “English Proficiency and Latino Turnout,” Prepared for the Annual Meeting of the Midwest Political Science Association, April 22nd, 2010, Chicago, IL, at pp. 18-19.
53. Shanna Pearson-Merkowitz, “Out of Sight, Out of Mind: How Latino Segregation Affects Political Participation,” PhD. Dissertation, 2009, at p. 2.54. Karen M. Kaufmann and Antonio Rodriguez, “Local Context and Latino Political Socialization: Why Immigrant Destinations Matter,” Presented at National
Conference on Latino Politics, Power and Policy at Brown University, October 24, 2009, at p. 12.55. Id. at p. 22.56. Janelle S. Wong, supra note 12, at p. 52.57. See Robert Huckfeldt and John Sprague, “Political Parties and Electoral Mobilization: Political Structure, Social Structure, and the Party Canvass, The American
Political Science Review, Vol. 86, No. 1 (Mar. 1992) pp. 70-86; EitanHersh, “At the Mercy of Data: Campaigns’ Reliance on Available Information in Mobilizing Supporters, Department of Government, Harvard University, September 26, 2010.
58. Janelle S. Wong, supra note 12, at p. 52.59. See Jonathan Krasno and Donald P. Green, “Do Televised Presidential Ads Increase Voter Turnout? Evidence from a Natural Experiment,” The Journal of Politics,
70, pp. 245-261, 2008; Donald P. Green and Alan S. Gerber, Get Out the Vote: How to Increase Voter Turnout, Brookings Institution Press, 2008. 60. Benjamin Highton and Arthur R. Burris, supra note 47, at p. 301.61. We note that the Current Population Survey regards language as a structural barrier, in the same manner as voter registration. Lack of English language
proficiency can be considered both a structural barrier of this nature as well as a broader inhibitor of participation in the process.62. 42 U.S.C. §§ 1973aa-1a.63. Michael Jones-Correa, “Language Provisions Under the Voting Rights Act: How Effective Are They?” Social Science Quarterly, Vol. 86, No. 3, September 2005,
pp. 549-564, at p. 558.64. Id. at p. 561.65. Jocelyn Benson, “¡Su Voto es su Voz! Incorporating Voters of Limited English Proficiency into American Democracy,” Boston College Law Review, 2007, Vol. 48,
p. 251, at p. 271.66. Id. Benson adds that, “In the twelve years following the passage of Section 203, Latino voters went from comprising just 2.4% of the national electorate to
3.6%—a 50% increase. In addition, Latino citizens living in areas covered by Section 203 were 4.4% more likely to vote in 1996 and 2000 than Latino citizens living in non-covered areas. Similar patterns arise among Asian Americans.” In congressional testimony the Asian American Legal Defense and Education Fund reported that “Partly due to Section 203’s mandate for translated voter registration forms, Asian American voter registration growth from 1996 to 2004 was nearly 60%. This number led all other demographic groups (Hispanics at 44.6%, Blacks at 14.6%, and whites at 6.9%). Asian Americans also led in voter turnout growth at 71.2%, (Hispanics at 57.1%, Black at 25.6%, and white at 15.0%).” Testimony of Glenn D. Magpantay, Asian American Legal Defense and Education Fund, Before the U.S. House of Representatives Committee on the Judiciary Subcommittee on the Constitution, Civil Rights, and Civil Liberties, Hearing on “Lessons Learned from the 2008 Election,” March 19, 2009. Terry Ao from Asian American Justice Center has written that, “Once Asian American voters are given information in their own language about the voting process—that is, how to register and vote, where to vote, ballots that they can understand, and how they can get help if needed, among other components—they turn out to vote. In San Diego County, voter registration among Filipinos rose by over 20 percent after the U.S. Department of Justice (DOJ) filed a lawsuit against the county for Section 203 noncompliance. DOJ was also able to secure voluntary language assistance for Vietnamese voters in San Diego, resulting in a 40 percent increase in Vietnamese registrations. Similarly, in Harris County, Texas, Vietnamese voters doubled their turnout following efforts by DOJ in 2004 after the county failed to comply with Section 203…Finally, more than 10,000 Vietnamese American voters registered in Orange County in 2004…” Terry M. Ao, “Impact of Section 203 on Asian American Voters,” in James Thomas Tucker, The Battle Over Bilingual Ballots, Ashgate, 2009, p. 296.
67. See Michael Jones-Correa & Israel Waismel-Manor, “Verifying Implementation of Language Provisions in the Voting Rights Act,” Symposium on “Protecting Democracy: Using Research to Inform the Voting Rights Reauthorization Debate,” Chief Justice Earl Warren Institute on Race, Ethnicity and Diversity at the University of California, Berkeley School of Law and the Institute for Governmental Studies, Washington, DC, February 9, 2006.
68. James Thomas Tucker, “The ESL Logjam: Waiting Times for Adult ESL Classes and the Impact on English Learners,” National Association of Latino and Elected Officials Education Fund, September 2006, p. 9. See also Shauna Reilly and Sean Richey, “Ballot Question Readability and Roll-Off: The Impact of Language Complexity,” Political Research Quarterly 64, 2011, pp. 59-67.
69. See Margie McHugh, Julia Gelatt, and Michael Fix, “Adult English Language Instruction in the United States, Determining Need and Investing Wisely,” Migration Policy Institute, July 2007.
70. James Thomas Tucker, supra note 68, at p. 2.71. Lawyers Committee for Civil Rights, “Highlights Of Hearings Of The National Commission On The Voting Rights Act 2005, A Supplement to: Protecting Minority
Voters: The Voting Rights Act At Work, 1982-2005,” The National Commission on the Voting Rights Act, February 2006, p. 5.72. Id. at p. 24.73. Id. at p. 14.74. Ariz. Rev. Stat. §§ 16-152, 16-166; Ga. Code Ann., § 21-2-216. Kansas has passed similar legislation but it does not take effect until 2013. K.S.A. § 25-2309.75. Ariz. Rev. Stat., § 16-166; Ga. Code Ann., § 21-2-216. Applicants can also submit their naturalization certificate number but will not be considered registered
until the county recorder/board of registrars verifies the number with the United States Citizenship and Immigrant Services, a process that could be unreliable and/or lengthy. See alsoRenee Feltz and StokelyBadsh, “Prop 200—Unconstitutional?,” Interview with Nina Perales, Southwest Regional Counsel for the Mexican American Legal Defense Fund, and lead counsel for plaintiffs in Gonzales v. Arizona, July 14, 2008.
76. Matt Barreto, Stephen Nuno, and Gabriel Sanchez, “Voter ID Requirements and the Disenfranchisement of Latino, Black and Asian Voters,” Prepared for presentation at the American Political Science Annual Conference, November 1, 2007, p. 16.
77. Brennan Center for Justice, “Citizens Without Proof: A Survey Of Americans’ Possession Of Documentary Proof Of Citizenship And Photo Identification,” November 2006.
78. Brennan Center for Justice, “Policy Brief on Proof of Citizenship Requirements,” available at http://www.brennancenter.org/content/resource/policy_brief_on_proof_of_citizenship/.
79. See American Civil Liberties Union, “Georgia’s Voter Registration Procedures Discriminate And Should Be Permanently Blocked, Civil Rights Coalition Argues,” Press Release, May 24, 2010.
80. Id.81. State of Georgia v. Holder, Response to Plaintiff’s and Defendant’s Joint Motion to Dismiss by Defendant-Intervenors Brooks, et. al, Georgia Association of
Latino Elected Officials, and Organization of Chinese Americans Georgia Chapter, et. al., No. 1:10-cv-01062, p. 9, citing May 29, 2009 Objection Letter. 82. State of Georgia v. Holder, No. 1:10-cv-01062 (D.D.C. 2010).83. See Dēmos and Common Cause, “Voting in 2010: 10 Swing States,” September 16, 2010, available at http://www.Dēmos.org/publication/voting-2010-ten-
swing-states.84. Model Plan for Administrative Naturalization Ceremonies, supra note 14; see also Dēmos, supra note 14. 85. In the spring and summer of 2008, California, Connecticut, Vermont, North Carolina, and Arkansas designated the Department of Veterans Affairs under

Section 7. The VA refused to agree to California’s designation. Subsequently, both Houses of Congress considered legislation: the House passed a bill that would have required the VA to agree to designation but the Senate adjourned amidst extensive negotiation over a similar bill. Arguably, all but California’s designation remain pending. The following state designations occurred in 2009: California, Kansas, Vermont, North Carolina, and Ohio have designated the Department of Veterans Affairs; California, Kansas, Vermont, and North Carolina have designated USCIS; California, Kansas, and North Carolina have designated the Social Security Administration; California, Kansas, and North Carolina have designated Indian Health Services; North Carolina has designated military pay and personnel offices. These designations remain pending except Kansas’s designation of the Social Security Administration, which was refused, and North Carolina’s designation of Indian Health Services, which was refused because there were no appropriate facilities within North Carolina. Additionally, the 2009 MOVE Act authorized the Secretary of Defense to allow designation of military pay and personnel offices as NVRA agencies, and the Secretary of Defense announced his intent to proceed with such designations in December 2009. Letter dated December 16, 2009 to Senator Jon Cornyn and Senator Charles Schumer from Deputy Secretary of Defense William J. Lynn III.
86. See Kenneth R. Mayer, With the Stroke of a Pen: Executive Orders and Presidential Power, Princeton University Press, 2002, pp. 4-5.87. Tova Andrea Wang, supra note 17.88. See Scott Novakowski, “Voter Rolls Grow as States Help Poor People Register,” Dēmos, October 7, 2008, available at http://www.Dēmos.org/press.cfm?current
articleID=E3D5957B%2D3FF4%2D6C82%2D553680517DF4B817.89. It is critical that any voter registration modernization scheme have systems in place that would ensure that only citizens are added to the voter registration list
and that any non-citizen added to the rolls through this system not be subject to penalty.90. Department of Homeland Security, “Privacy Impact Assessment for the Computer Linked Application Information Management System (CLAIMS 4),” September
5, 2008, p. 2. 91. Id. at p. 3. Indeed, the database contains a lot of other information about new Americans, including some that is sensitive and should by no means be shared
with voting registrars. Any VRM system will of course need appropriate safeguards to ensure that only the information relevant to voter registration is shared with elections officials.
92. Id. at p.11.93. See U.S. Department of Homeland Security, U.S. Citizenship and Immigration Services’ Progress in Modernizing Information Technology, July 2009, available at
http://www.dhs.gov/xoig/assets/mgmtrpts/OIG_09-90_Jul09.pdf.94. See Tony Romm, “Report: E-Verify immigration system suffers from low accuracy rate,” The Hill, February 25, 2010, available at http://thehill.com/blogs/
hillicon-valley/technology/83649-report-e-verify-immigration-system-suffers-from-low-accuracy-rate.95. Melissa R. Michelson, “Meeting the Challenge of Latino Voter Mobilization,” September 2005, pp. 18-19, available at http://www.greatvalley.org/conference/
docs/2005/speakermaterials/mmichelson.doc. See also Ricardo Ramirez, “Giving Voice to Latino Voters: A Field Experiment on the Effectiveness of a National Nonpartisan Mobilization Effort,” 601 The ANNALS of the American Academy of Political and Social Science 2005, 66; Melissa R. Michelson, Lisa García Bedolla, and Donald P. Green, “New Experiments in Minority Voter Mobilization, Third and Final Report on the California Votes Initiative,” James Irvine Foundation, November 2009; Melissa R. Michelson, Lisa GarcíaBedolla, and Donald P. Green, “New Experiments in Minority Voter Mobilization, A Report on the California Votes Initiative,” James Irvine Foundation, September 2007.
96. Matt A. Barreto, supra note 36.97. See National Association of Latino Elected and Appointed Officials Education Fund, NALEO 2010: Latino Election Handbook, pp. 46-47: “With the exception
of New York, the percentage of naturalized Latino U.S. citizens who cast ballots in the 2008 presidential election (the “voter turnout rate”) was higher than the comparable percentage of native-born Latinos in all states and across the nation as a whole. This pattern, of higher voter turnout of naturalized citizens is observed at the national level in all biennial elections going back to 1996.”
98. See Paul Ong, Melany Dela Cruz-Viesca, and Don Nakanishi, “Awakening the New ‘Sleeping Giant’?” Asian American Political Engagement, July 2, 2008, pp. 3-4.99. Led by a joint effort between Mi Familia Vota Education Fund, the NALEO Educational Fund, the National Council of La Raza and Spanish language media
companies Entravision Communications, ImpreMedia, and Univision Communications, the campaign seeks to increase Latino civic participation by: 1) assisting eligible legal permanent residents apply for U.S. citizenship, and 2) educating, registering, and mobilizing Latinos to vote. The campaign strategy is to remove barriers that have prevented Latinos from becoming full participants in our U.S. democracy. The comprehensive campaign is comprised of two strategic and focused phases. ya es hora ¡Ciudadanía! was the first phase of the campaign to launch, which contributed to the 1.4 million eligible legal permanent residents who applied for U.S. citizenship in 2007. ya es hora ¡Ve Y Vota! is the second phase of the campaign which will seek to register thousands and mobilize more than half a million naturalized and native born Latinos to vote in the 2008 Presidential elections, available at http://www.naleo.org/VeYVotaCampaignPressKit.pdf.
100. Paco Fabian, “With Massive Push, New Citizens Register to Vote in Record Numbers,” America’s Voice Blog, September 26, 2008, available at http://americasvoiceonline.org/blog/entry/with_massive_push_new_citizens_register_to_vote_in_record_numbers/.
101. See Gary Segura and Nathan Woods, supra note 51; Matt A. Barreto, Gary M. Segura, and Nathan D. Woods, supra note 51.102. See Matt Barreto and Stephen Nuno, “The Effectiveness of Co-Ethnic Contact on Latino Political Recruitment,” Political Research Quarterly, Vol. 63, No. 3,
2010,; Stephen A. Nuno, “Messenger Politics: The Influence of Co-Ethnic Partisan Recruitment on Latino Vote Choice, 2008;” Michelle Michelson, “Meeting the Challenge of Latino Voter Mobilization,” note 95.
103. Dēmos and Common Cause, supra note 83, at p. 66 and p. 70.104. Sec. 1973gg-4 Mail registration.105. See Robert Stein, Chris Owens, and Jan Leighly, “Electoral Reform, Party Mobilization and Voter Turnout,” Paper presented at Midwest Political Science
Association 61st Annual National Conference in Chicago, IL, April 3–6, 2003, available at http://politics.as.nyu.edu/docs/IO/4744/leighley.pdf; Steven J. Rosenstone and John Mark Hansen, Mobilization, Participation, and Democracy in America, Macmillan, 1993.
106. Wong, supra note 12, at p. 172.107. It should be noted that a good deal of research has been done in this regard with respect to young voters; less has been done with respect to immigrant
voters.108. Tova Andrea Wang, “Immigrant Mobilization in the Virginia 2009 Gubernatorial Election,” unpublished by the author, on file with the author.109. See Tia Elena Martinez and Ted Wang, “Supporting English Language Acquisition: Opportunities for Foundations to Strengthen Immigrant Families,
Grantmakers Concerned with Immigrants and Refugees,” August 2005; “Promising Practices in Language Acquisition, in Immigrant Integration Toolkit, Grantmakers Concerned with Immigrants and Refugees,” September 2006.
110. See Margie McHugh, Julia Gelatt, and Michael Fix, supra note 69.111. Id.112. Eming Piansay, Vivian Po, “Too Many Asians Fail to Apply for Citizenship,” New America Media, April 1, 2011, available at http://newamericamedia.
org/2011/03/encourage-aapi-to-become-us-citizens.php.113. Suzanne Gamboa, “Record Number of Latinos Voted in Midterms,” Associated Press, April 26, 2011.

30 from cItIzenshIp to votIng