Embed Size (px)
Citation preview

50
339--Rece
Frequency Analysis ofMicrocluster Halftoning
Henry R. KangXerox Corporation, SDSP/ODPG
Mail Stop 820-03F, 200 Crosskey Office Park, Fairport, NY. 144
engoeodod tnincelalelhecl
eveleue aei ausesmped
ingncisl.
inintonfalston cer ofthMho a wfibs,
isp theM)
toagesorie,tonence,ange,n topeed.ingry to, the totuneofing
achning.en
goalseoffdots,thecepteenron,mi-b-ingareixelucleiixels, theouse es-d foreseareare-dot
Abstract
Microcluster halftoning is a hybrid approach betweclustered-dot and dispersed-dot ordered dithers. The of the microcluster halftoning are to overcome the tradbetween screen frequency and tone level of clustered to minimize distinctive structures of dispersed dots, anreduce the graininess. Basically, the microcluster halftois an integration of the frequency modulation, super multi-center dot, and nucleus randomization. First, a htone cell is divided into small subcells. A general cpartition technique is used for dividing halftone cells. Tfrequency modulation is employed to disperse the nuamong subcells. A general pixel dispersion scheme is doped for this purpose. In addition, a stochastic nucrandomization within the subcell is possible to providmore homogeneous nucleus dispersion. Once the nuclestablished, the classical clustered-dot order dither is for further dot growth. A series of dots based on thprinciples is designed and the frequency spectra are coted by using the Fourier transform. Results are comparthe clustered-dot and dispersed-dot approaches.
Introduction
A major problem in clustered-dot ordered-dither halftonis the conflicting requirements for high screen frequeand high tone level.1 This is because the frequency inversely proportional to the square root of the tone leveone increases the frequency for the purpose of obtafiner details and making the screen less visible, the level will be decreased. This raises the chance of contouring. On the other hand, if one increases the level, thereby decreasing the likelihood of contours, thesize becomes larger and the screen becomes coarsemore visible. The finer details will be lost. The problemfrequency-level tradeoff can be eliminated by using dispersed-dot ordered dither, frequency modulation (For stochastic screening. Unlike clustered-dot, these metdo not have the constraints of the screen frequencyangle. Pixels in a dispersed-dot are ordered in such athat the total "on" positions in the array3 at any instance oordering are distributed as homogeneously as possAlthough these dispersed-dot patterns are homogeneou
nt Progress in Digital Halftoning II
alsffts,ogl,f-l
eil-s
reedeu-to
y
Ifgeeelland
e),dsnday
le.
they suffer from rigid regular structures. This problemreduced by the random nucleated screens to break uregularity, and the developments of blue-noise mask (BNand void-and-cluster methods.2-7 These developments leadthe ever-popular stochastic screening. Many advanthave been claimed, such as no visible dot pattern, no mno tradeoff between tone level and frequency, and no jump. It, however, shows graininess or noisy appearahas severe dot gain problems across the whole tone rand requires a stable, reproducible printer. In additiothese problems, there are penalties to the cost and sFor example, to properly disperse pixels for minimiztextures requires large screen size, thus more memostore it. For screenless halftoning such as error diffusioncomputation cost is usually high. Moreover, it is difficultfine tune a large screen and it is not possible to fine screenless approaches. These problems make color promore difficult.
In this paper, we present a new microcluster approthat can reduce the problems of the stochastic screeMicrocluster halftoning is a hybrid approach betweclustered-dot and dispersed-dot ordered dithers. The of the microcluster halftoning are to overcome the tradbetween screen frequency and tone level of clustered to minimize distinctive structures of dispersed dots in highlight region, and to reduce the graininess. The conand design principles of microcluster dots have bpresented by Kang in 1995.8 Basically, the microclustehalftoning is an integration of the frequency modulatisuper cell, multi-center dot, and nucleus randozation.2,3,9,10 First, a halftone cell is divided into small sucells. A general cell partition technique is used for dividhalftone cells. Then, positions of nuclei for subcells established by using frequency modulation. A general pdispersion scheme is developed to disperse the namong subcells. Because a subcell contains multiple pit is possible to stochastically randomized nucleus withinsubcell for the purpose of providing a more homogenenucleus dispersion among subcells. Once the nuclei artablished, the classical clustered-dot order dither is usefurther dot growth. A series of dots based on thprinciples is designed and the frequency spectra computed by using the Fourier transform. Results compared to the clustered-dot and dispersedapproaches.
Recent Progress in Digital Halftoning II--339
o i
ftoc
fn
bl
g
t
s,
a
isk
theold
e
ero
en
ith
re
e
dr
. It
a; a
Fourier Transform
Fourier transform has been used to solve a large number oflinear problems ranging from mechanical engineering teconomy. It is the foundation of the linear signal filteringelectronic imaging. In printing, it has been used to derivethe optimal dispersed-dot screens, to study classical halscreens, to examine image induced artifacts due to interawith clustered and dispersed-dot ordered dither on squaregrids, and to compute and display the Fourier spectrum oordered dither in terms of the continuous-space dimensioof rectangular and hexagonal grids.11-15 This analysis followsthe method developed by Ulichney.14,15
The binary output from halftoning a gray level input means of ordered dither is periodic with the same spatiaperiod as the threshold array. The spatial period is specifiedby two vectors, px and py , in terms of the spatial samplinvectors, vx and vy
px = Nvx and py = Nvy,
for some integer N. The sampling vectors can be thoughas grid generating vectors. The Discrete Fourier Transform(DFT) of an even period is
C(f) = ( |detP| )-1å I[k] d (f - Q k) , (1)
where, in scalar notation,
I[k] = I[k1, k2] =åå I[n1, n2] exp{-j2p (k1n1+k2n2)/N} (2)
is the two-dimensional DFT. This equation applies toperiodic grids in general. For the case of rectangular gridthe matrices involved can be expressed in terms of thesample and line periods:
VS 0
0 LU
S 0
0 L
PNS 0
O NLQ =
(NS) 0
0 NL)
-1
-1
-1
-1
= é ùë û
= é ùë û
= é ùë û
é ùë û
, ,
, ( ,
and fT = kT QT,
where superscript T represents the transpose of a mor vector that is obtained by exchanging lines withcorrespon-ding columns. One limitation of this equation isthat it is only valid for periods which have a perfect squarenumber of elements. For non-square periods (or thresholdarrays), Ulichney utilizes the Similarity Theorem that thetransform of k periods as one period results a scaled DFT;each nonzero frequency component in the resulting DFT accompanied by k zero coefficients and have a magnitude times as large as the DFT of a single period.16 Therefore,packing odd tiles in this way only requires the additionalstep of dividing the resulting DFT by k.
The magnitude spectrum of DFT provides insights intothe relative distribution of energy in frequency domain. In
340--Recent Progress in Digital Halftoning II
n
netion
s
y
of
trix
this application, a composite DFT which summarizes energy distributions over all tone levels for a given thresharray is used. This composite DFT is defined as the sum ofabsolute DFT values at every possible tone level, then thresult is divided by the total number of tone levels:
I ksum[ ] ( ) | [ ; ] |k Z g= + - å1 1 (3)
where Z is the total number of tone levels excluding the ztone level. Substituting Eq. (3) into Eq. (1) yields aspecification of the location and magnitude of Fouriertransform impulses. The computed I sum [k] can be displayedwith dots of an area proportional to the magnitude of thimpulse. Such a display is similar to a photograph of aoptical Fourier transform consisting of points of light wdifferent intensity; the resulting size of exposed pointswould be proportional to their magnitude. Based on thissimilarity, Ulichney named them “exposure plots” .
Fourier Analyses of Clustered Dots
Based on the conventional practice of color printing, theblack screen is set at 45º. Cyan and magenta screens arotated 30º away from the black, having values 15º and 75º,respectively. The lightest color, yellow, is placed at 0º (or90º). In this study, the clustered-dots are used as the baselineinformation for comparisons with microcluster dots. Theseclustered-dots are rational tangent screens that the screenangles must be a tangent of integer ratio. Because of thisconstraint, the exact 15º (or 75º) angle is not achievable atthe tone levels employed in this study. Moreover, thedifferences in screen angles lead to slightly different screenfrequencies and tone levels for four primary colors with thexception that cyan screen is the mirror image of themagenta screen. The first set of screens is small dots withtone levels of 10, 10, 9, and 8 (these numbers are Z valueswhich do not include the white level of no “on” pixel) forcyan, magenta, yellow, and black, respectively. Theirthreshold arrays are given in Figure 1; they are clustered-dotsin a spiral pattern with screen angles of 18º, 72º, 0º, an45º, for cyan, magenta, yellow, and black, respectively. Focyan and magenta screens, the resulting angles are theclosest approximations to 15º and 75º at this dot size (10pixels) by the rational tangent screen.
Figure 1. The threshold arrays of small clustered-dots.
The black at 45º can be coded into a rectangularblock by using the Holladay algorithm.17 The resultingblock has the width (in pixels) exactly twice of the heighttakes two 45º screens to make a square, indicating an oddperiod. This is evidenced in the exposure plot of Figure 2
gny
e
ofn
,
e
d
s
ure
n. A
square
e
s for5e
r
eourier
characteristic diagonal orientation of the energy distributionin the frequency domain. The highest energy other than thezero frequency locates in the midway between the center andcorners of baseband, showing the low frequencycharacteristic of a clustered dot. But, substantial energydistributes at corners, 1/(2S) cycles/unit-length where thehighest possible frequencies reside, indicating the relativehigh frequency characteristic of a small dot.
The yellow screen at 0º is a square array with 3 ´ 3elements. This is an even period threshold array with an oddnumber of elements on each side. It poses an interestinproblem that the frequency sample at 1/(2S) is not ainteger. To correct this problem, we employ the SimilaritTheorem by packing four 3 ´ 3 screens into a 6́6 cell. Theresulting exposure plot for yellow screen is given in Figure2b; the horizontal and vertical periods are 3 units, thereexists no energy at the edges of the baseband. Instead, thhighest energy distributions are located at 1/(3S), showingthe high frequency characteristic of a small dot.
Because of their size and shape, the Fourier analysis cyan or magenta screen requires the packing of ten screegive a 10 ́ 10 square cell in order to use the SimilarityTheorem. Resulting exposure plots are depicted in Figs. 2cand 2d. The shape of the baseband is still square, but theenergy distribution is no longer uniform. The magentascreen orients more toward horizontal direction and cyan ori-ents more toward vertical direction, indicating the angularorientation of the screen.
Utilizing the linear property of the Fourier transformwe obtain the combined effort from individual screens.18
F{hc (x,y) Ic (x,y) + hm (x,y) Im (x,y) + hy (x,y) Iy (x,y)+ hk (x,y) Ik (x,y)}
= F{hc (x,y) Ic (x,y) } + F{hm (x,y) Im (x,y)}
+ F{hy (x,y) Iy (x,y) } + F{hk (x,y) Ik (x,y) } ,
where F is the Fourier transform operator, Ic , Im , Iy, and Ikare cyan, magenta, yellow, and black separations of thimage, and hc, hm, hy, and hk are their corresponding halftonethreshold arrays. To see the combined effort of thresholdarrays on any arbitrary image, we need only analyze thethreshold arrays themselves
F{hc(x,y) + hm(x,y) + hy(x,y) + hk(x,y)}
= F{hc(x,y)} + F{hm(x,y)} + F{hy(x,y)} + F{hk(x,y)} .
Figure 2e gives the combined spectrum of all four screensby summing them together. It shows that high energy sitesfrom four primary colors form a ring surrounding the zero-frequency center with a radius about 1/(3S). Very littleenergy is located inside this ring, showing a relatively high
341--Recent Progress in Digital Halftoning II
s to
frequency characteristic of small dots. The center and fourcorners are drawn as a four-concentric circle to indicate thatthey are overlapped four times; the number of circles in theconcentric circle represents the number of overlaps.
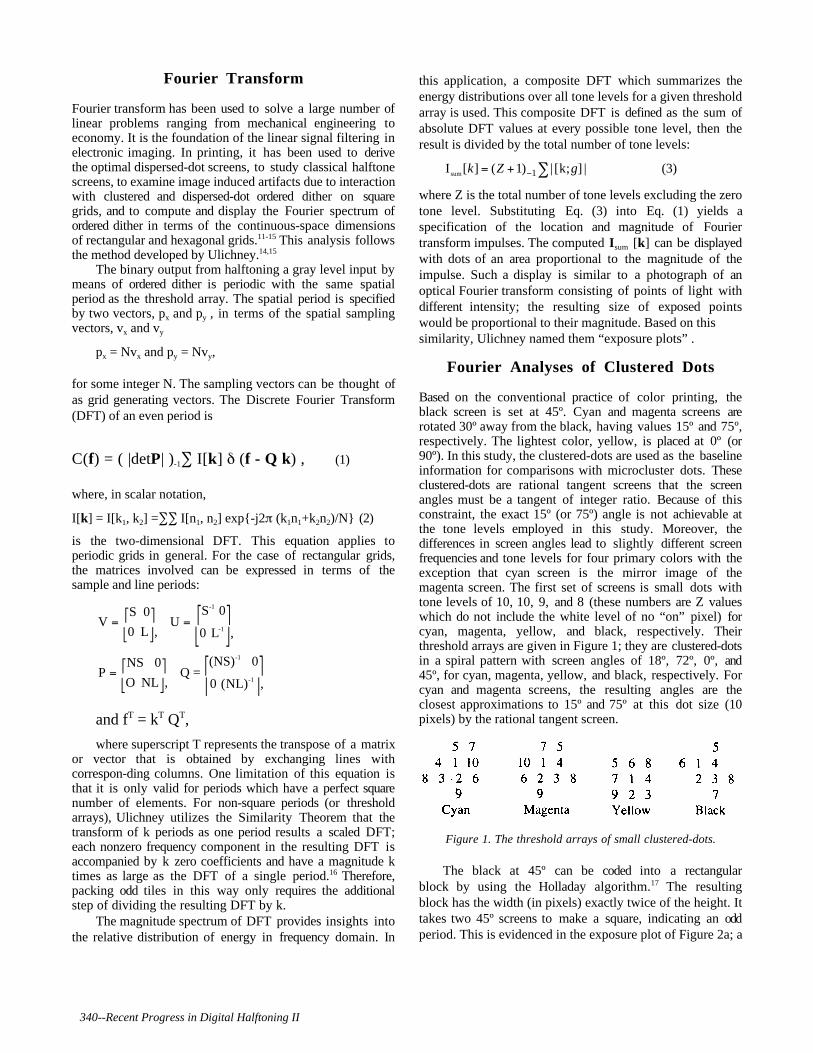
The second set of primary screens has 17, 17, 16, an18 tone levels for cyan, magenta, yellow, and black,respectively. Figure 3 gives the threshold arrays.
Figure 3. The threshold arrays of the second set of screen
The exposure plot of the black screen is given in Fig4a, its energy distribution concentrates around the center inan odd fashion. The yellow threshold array is a perfect 4´ 4square, giving an even and rectangular energy distributiomajority of the energy is distributed in the low frequency(£1/[4S]) region as shown in Figure 4b. For magenta andcyan and dots, 17 screens are packed together to give a 17 ´ 17 cells. Once again, the Fourier spectra shown inFigs. 4c and 4d are not uniform, indicating an angularorientation. The combined Fourier spectrum is depicted inFigure 4e, several rings are formed by these screens. Thhighest energy sites form the closest ring with a radiusabout 1/(4S), the energy gradually reduces as the frequencyincreases. This spectrum clearly shows that the larger dots(as compared to the first set of screens) have more lowfrequency components.
The third set of screens has 40, 40, 36, and 32 tonecyan, magenta, yellow, and black, respectively. Figure gives the threshold arrays of this set of screens. They arexactly four times larger than the first set. The exposureplots of Figure 6 indicate that, as the number of tone levelincreases, the additional frequency terms in the Fourietransform assume positions between those of smaller dotswith proportionally less energy in them. The size of thbaseband, however, remains the same. The combined Fspectrum is given in Figure 6e.
Recent Progress in Digital Halftoning II--341

,
Figure 2. Fourier exposure plots of small dots with tone levels of 10, l0, 9, and 8 levels for cyan, magenta, yellow and black, respectivelyand the sum of all four spectra.342--Recent Progress in Digital Halftoning II

Figure 4. Fourier exposure plots of small dots with tone levels of 17, 17, 16, and 18 levels for cyan, magenta, yellow and black,respectively, and the sum of all four spectra.
343--Recent Progress in Digital Halftoning II Recent Progress in Digital Halftoning II--343

Figure 6. Fourier exposure plots of small dots with tone levels of 40, 40, 36, and 32 levels for cyan, magenta, yellow and black,respectively, and the sum of all four spectra.
344--Recent Progress in Digital Halftoning II

Figure 8. Fourier exposure plots of small dots with tone levels of 40, 40, 36, and 32 levels for cyan, magenta, yellow and black,respectively, and the sum of all four spectra.
345--Recent Progress in Digital Halftoning II Recent Progress in Digital Halftoning II--345

.
ts
hexe oe
gys
hisege
igh
inhe
ter
ller
n is
to the
es ofthanare
nd of
er; its
of
ded
is
hishe)
Figure 5. Threshold arrays of the third set of clustered dots
Fourier Analyses of Quad-Dots
The third set of screens, having sufficient number of pixels,makes them eligible to be divided into smaller componensuch as four subcells (quad-dot). Figure 7 shows thethreshold arrays of these quad-dots; each screen is dividedinto four equal sections. Because of the interceptionbetween the digital grid and the halftone cell boundary, tsize and shape of subcells represented by digitized pimay not be the same (see Figure 7). The exposure plotsFigure 8 look like the plots in Figure 2, especially thlocations of high energy sites are identical. The difference isthat the exposure plots of Figure 8 have many low enersites populated in the high frequency region (>1/[4S]) awell as a few in the low frequency region (<1/[4S]). Tintroduces some low frequency components in the tonramps. However, they don't seem to degrade the imaquality because of the low population. Compared to thecorresponding clustered-dot spectra of Figure 6, the henergy sites are moved away from the zero-frequencycenter, showing some dispersed nature. The combspectrum of four screens is plotted in Figure 8e. Again, tspectrum is very similar to the first set (see Figure 4e).
Fourier Analyses of Microcluster Dots
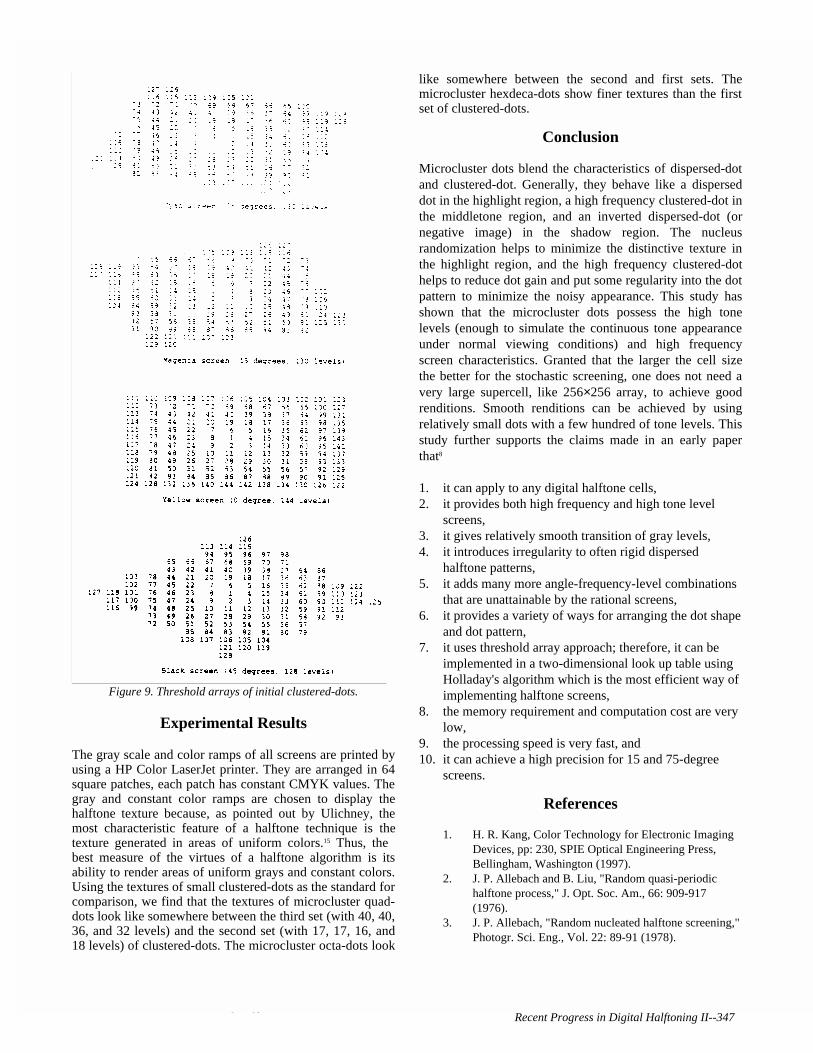
The advantages of microcluster dots are illustrated by usinga set of dots with 130, 130, 144, and 128 levels for cyan,magenta, yellow, and black, respectively. This set of screensgives screen angles of 15.255°
o, 74.745°, 0°, and 45°,
respectively. The first advantage is that it provides betapproximations to the 15° and 75° angles. Threshold arraysof the initial clustered-dots are given in Figure 9. TheFourier spectrum of the 45°, 128-level clustered-dot is givenin Figure 10a and the spectrum of 0°, 144-level is given inFigure 11a.
346--Recent Progress in Digital Halftoning II
lsf
ed
Figure 7 Threshold arrays of quad-dots.
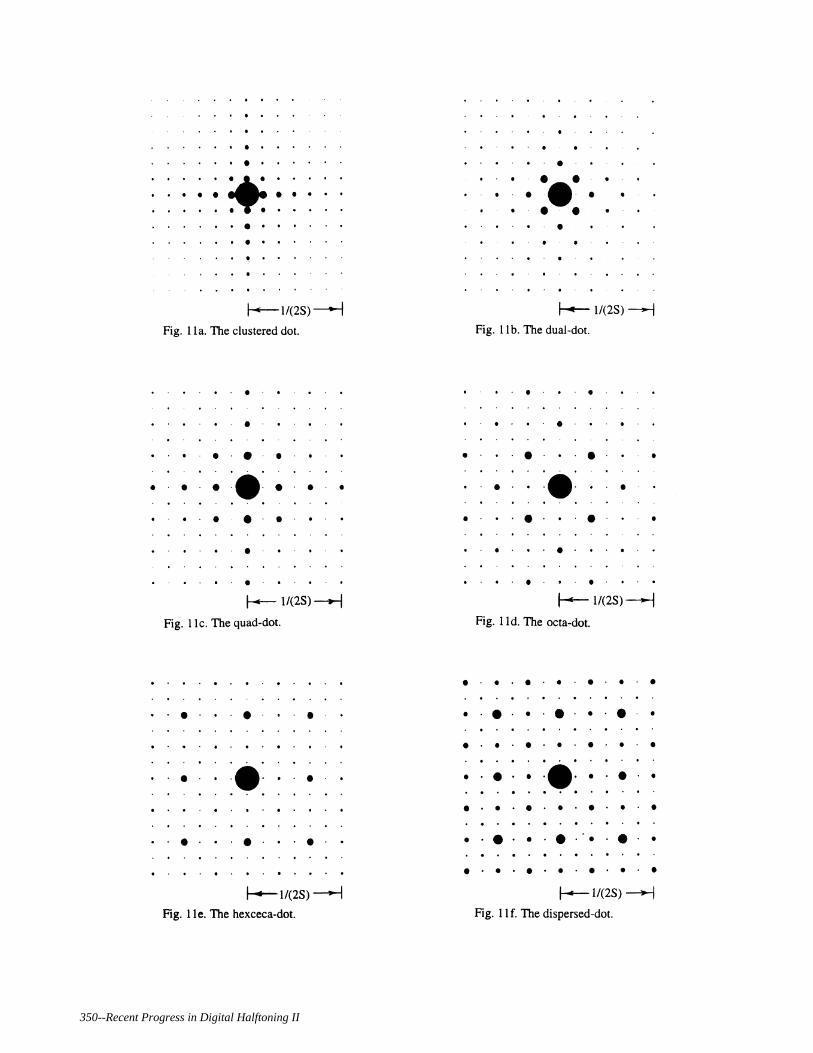
This set of screens is successively divided into smacomponents ranging from 2 to 16 subcells. Figure 12 showsthe threshold arrays of dual-dots. The screen pattergrown in a way that it has two hills and two valleys inopposite corners. The advantage of this dot pattern is achieve the condition that the white areas on color whenarea coverage is greater than 50% are the inverse imagcolored dots on white when the area coverage is less 50%.1 Fourier spectra of the black and yellow dual-dots shown in Figure 10b and Figure 11b, respectively. As soonas the screen is subdivided, the odd energy sites in bothhorizontal and vertical directions drop to a very small valueand the high energy distributions move away from the zerofrequency center. Similar behaviors are shown in cyan amagenta screens. Figure 13 gives the threshold arraysquad-dots. Fourier spectra of the black and yellow quad-dots are shown in Figure 10c and Figure 11c, respectively;positions of high energy distributions are moving farthaway from the center. The next set is divided into 8 partsthreshold arrays are shown in Figure 14. Fourier spectrathe black and yellow screens are depicted in Figure 10d andFigure 11d, respectively. The last set of screens is diviinto 16 subcells. Threshold arrays of the last microclusterdots are given in Figure 15, and the Fourier spectra of theblack and yellow screens are shown in Figure 10e andFigure 11e, respectively. It is apparent that more energy distributed farther away from the center as the partitionbecomes finer. For comparisons, the completely dispersedblack screen is given in Figure 10f; the highest energydistributions are located at the corners of the baseband. Tis different from the microcluster dot of Figure 10e that tenergy is about equal at two frequency locations of 1/(4Sand 1/(2S). This is the purpose of the microclusterhalftoning to retain some low frequency components in themidtone region.
b
. T tthe
d-0,an
first
us
dot dotas
cy
ed adghis
ns
ape
gof
ery
g,"
Figure 9. Threshold arrays of initial clustered-dots.
Experimental Results
The gray scale and color ramps of all screens are printedusing a HP Color LaserJet printer. They are arranged in 64square patches, each patch has constant CMYK valuesgray and constant color ramps are chosen to displayhalftone texture because, as pointed out by Ulichney, most characteristic feature of a halftone technique is thetexture generated in areas of uniform colors.15 Thus, thebest measure of the virtues of a halftone algorithm is itsability to render areas of uniform grays and constant colors.Using the textures of small clustered-dots as the standard forcomparison, we find that the textures of microcluster quadots look like somewhere between the third set (with 40, 436, and 32 levels) and the second set (with 17, 17, 16, 18 levels) of clustered-dots. The microcluster octa-dots look
347--Recent Progress in Digital Halftoning II
y
hehe
d
like somewhere between the second and first sets. Themicrocluster hexdeca-dots show finer textures than the set of clustered-dots.
Conclusion
Microcluster dots blend the characteristics of dispersed-dotand clustered-dot. Generally, they behave like a disperseddot in the highlight region, a high frequency clustered-dot inthe middletone region, and an inverted dispersed-dot (ornegative image) in the shadow region. The nuclerandomization helps to minimize the distinctive texture inthe highlight region, and the high frequency clustered-helps to reduce dot gain and put some regularity into thepattern to minimize the noisy appearance. This study hshown that the microcluster dots possess the high tonelevels (enough to simulate the continuous tone appearanceunder normal viewing conditions) and high frequenscreen characteristics. Granted that the larger the cell sizethe better for the stochastic screening, one does not nevery large supercell, like 256×256 array, to achieve goorenditions. Smooth renditions can be achieved by usinrelatively small dots with a few hundred of tone levels. Tstudy further supports the claims made in an early paperthat8
1. it can apply to any digital halftone cells,2. it provides both high frequency and high tone level
screens,3. it gives relatively smooth transition of gray levels,4. it introduces irregularity to often rigid dispersed
halftone patterns,5. it adds many more angle-frequency-level combinatio
that are unattainable by the rational screens,6. it provides a variety of ways for arranging the dot sh
and dot pattern,7. it uses threshold array approach; therefore, it can be
implemented in a two-dimensional look up table usinHolladay's algorithm which is the most efficient way implementing halftone screens,
8. the memory requirement and computation cost are vlow,
9. the processing speed is very fast, and10. it can achieve a high precision for 15 and 75-degree
screens.
References
1. H. R. Kang, Color Technology for Electronic ImagingDevices, pp: 230, SPIE Optical Engineering Press,Bellingham, Washington (1997).
2. J. P. Allebach and B. Liu, "Random quasi-periodichalftone process," J. Opt. Soc. Am., 66: 909-917(1976).
3. J. P. Allebach, "Random nucleated halftone screeninPhotogr. Sci. Eng., Vol. 22: 89-91 (1978).
Recent Progress in Digital Halftoning II--347

lue
r).
ns,
ing
1
f
ion
r,"
34
4. R. A. Ulichney, "Dithering with blue noise," Proc.IEEE, Vol. 76: 56-79 (1988).
5. T. Mitsa and K. Parker, "Digital halftoning using a bnoise mask," Proc. SPIE 1452: 47-56 (1991).
6. K. Parker, T. Mitsa, and R. Ulichney, "A newalgorithm for manipulating the power spectrum ofhalftone pattern," Proc. SPSE 7th Int'l Congress onNon-Impact Printing, pp. 471-475 (1991).
7. R. Ulichney, 'The void-and-cluster method for dithearray generation," Proc. SPIE 1913: 332-343 (1993
8. H. R. Kang, "Dispersed Micro-Cluster Halftoning,"IS&T's 11th International Congress on Adv. In Non-Impact Printing Technologies, pp: 427-430 (1995).
9. P. Fink, PostScript screening: Adobe accurate screeChapter 4: 43-61, Adobe Press, Mountain View, CA(1992).
10. H. R. Kang, Color Technology for Electronic ImagingDevices, Chapter 9: 208-261, SPIE Optical EngineerPress, Bellingham, Washington (1997).
11. B. E. Bayer, "An optimum method for two-levelrendition of continuous-tone pictures," IEEEInternational Conf. On Communication, Vol. 1: 26-1to 26-15 (1973).
8--Recent Progress in Digital Halftoning II
12. D. Kermisch and P. G. Roetling, "Fourier spectrum ohalftone images," J. Opt. Soc. Am., Vol. 65: 716-723(1975).
13. J. P. Allebach and B. Liu, "Analysis of halftone dotprofile and aliasing in the discrete binary representaton images," J. Opt. Soc. Am., Vol. 67:1147-1154(1977).
14. R. A. Ulichney, Digital Halftoning, The MIT Press,Cambridge (1987).
15. R. A. Ulichney, "Frequency analysis of ordered ditheSPIE Vol. 1079 Hard Copy Output: 361-373 (1989).
16. R. N. Brace, The Fourier Transform and ItsApplication, pp. 370, McGraw-Hill, New York (1978).
17. T. M. Holladay, "An optimum algorithm for halftonegeneration for displays and hard copies," Proc. SID,Vol. 21: 185-192 (1980).
18. A. R. Weeks, Jr., Fundamentals of Electronic ImageProcessing, SPIE/IEEE Series on Imaging Science &Engineering. P: 59 (1996).

Figure 10. Fourier exposure plots of the 45-degree and 128 level screen with different subdivisions.
349--Recent Progress in Digital Halftoning II Recent Progress in Digital Halftoning II--349
350--Recent Progress in Digital Halftoning II

Figure 12. Threshold arrays of dual-dots
Figure 13. Threshold arrays of quad-dots.
351--Recent Progress in Digital Halftoning II Recent Progress in Digital Halftoning II--351

Figure 14. Threshold arrays of octa-dots
Figure 15. Threshold arrays of hexdeca-dots
352--Recent Progress in Digital Halftoning II