Embed Size (px)
DESCRIPTION
French quaterly national accounts : Input-Output Tables methodology and indicators. IO tables methodology and indicators Programme. Calculation of the GDP: the 3 approaches to VA Calculation of the Intermediate Consumption The IOT-SUT synthesis: an iterative process Calibrating and fitting - PowerPoint PPT Presentation
Citation preview

Fabrice Lenglartnational account department
November, 7th 2006
French quaterly national accounts : Input-Output Tables methodology and indicators
Input-Output tablesF. Lenglartt November 7th , 2006
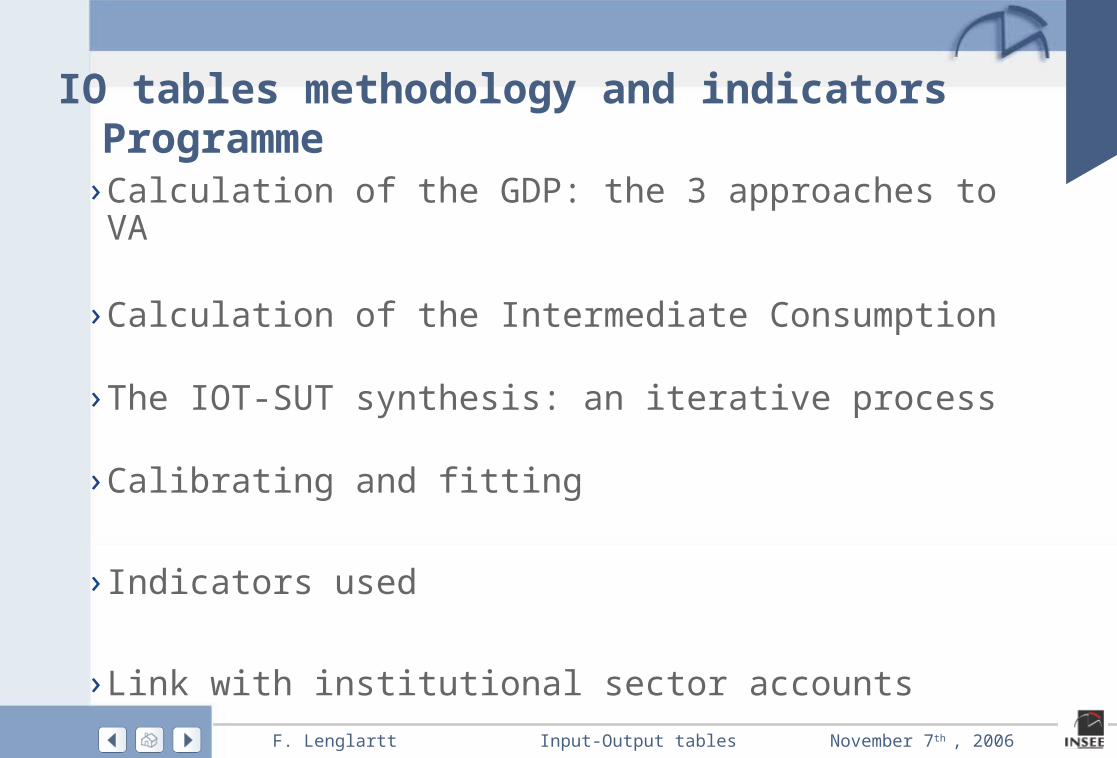
IO tables methodology and indicatorsProgramme›Calculation of the GDP: the 3 approaches to VA
›Calculation of the Intermediate Consumption
› The IOT-SUT synthesis: an iterative process
›Calibrating and fitting
› Indicators used
› Link with institutional sector accounts
Input-Output tablesF. Lenglartt November 7th , 2006
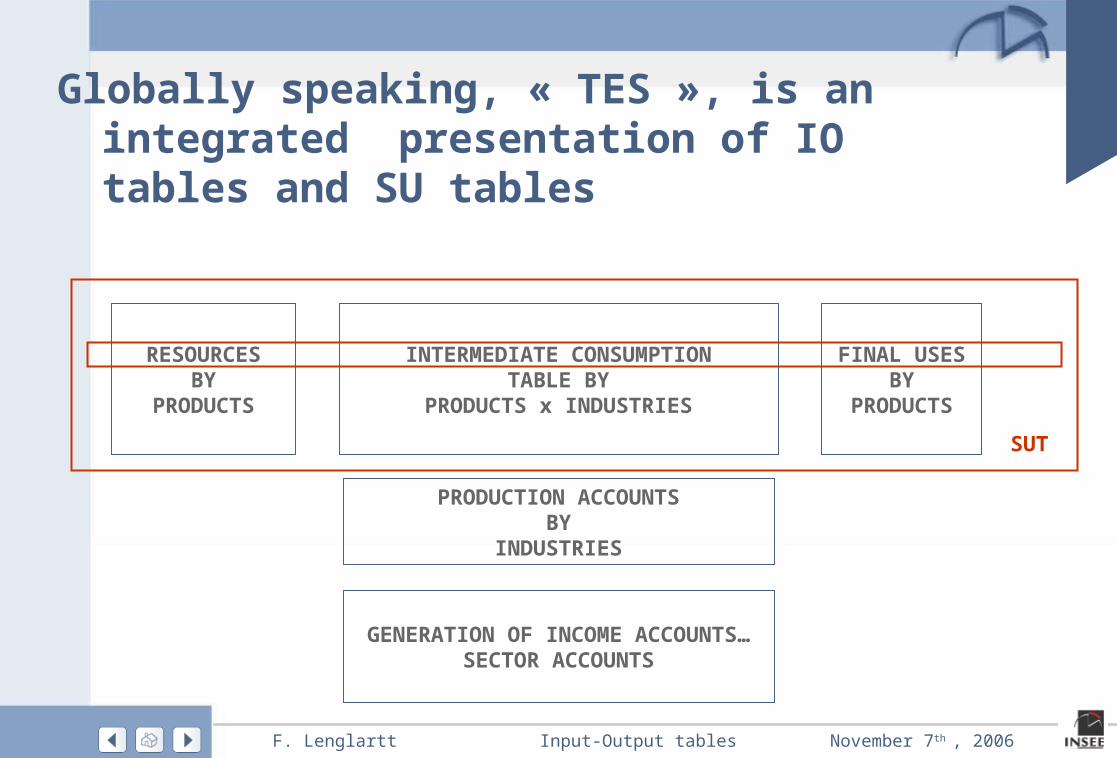
Globally speaking, « TES », is an integrated presentation of IO tables and SU tables
RESOURCESBY
PRODUCTS
INTERMEDIATE CONSUMPTIONTABLE BY
PRODUCTS x INDUSTRIES
FINAL USESBY
PRODUCTS
PRODUCTION ACCOUNTSBY
INDUSTRIES
GENERATION OF INCOME ACCOUNTS…
SECTOR ACCOUNTS
SUT
Input-Output tablesF. Lenglartt November 7th , 2006
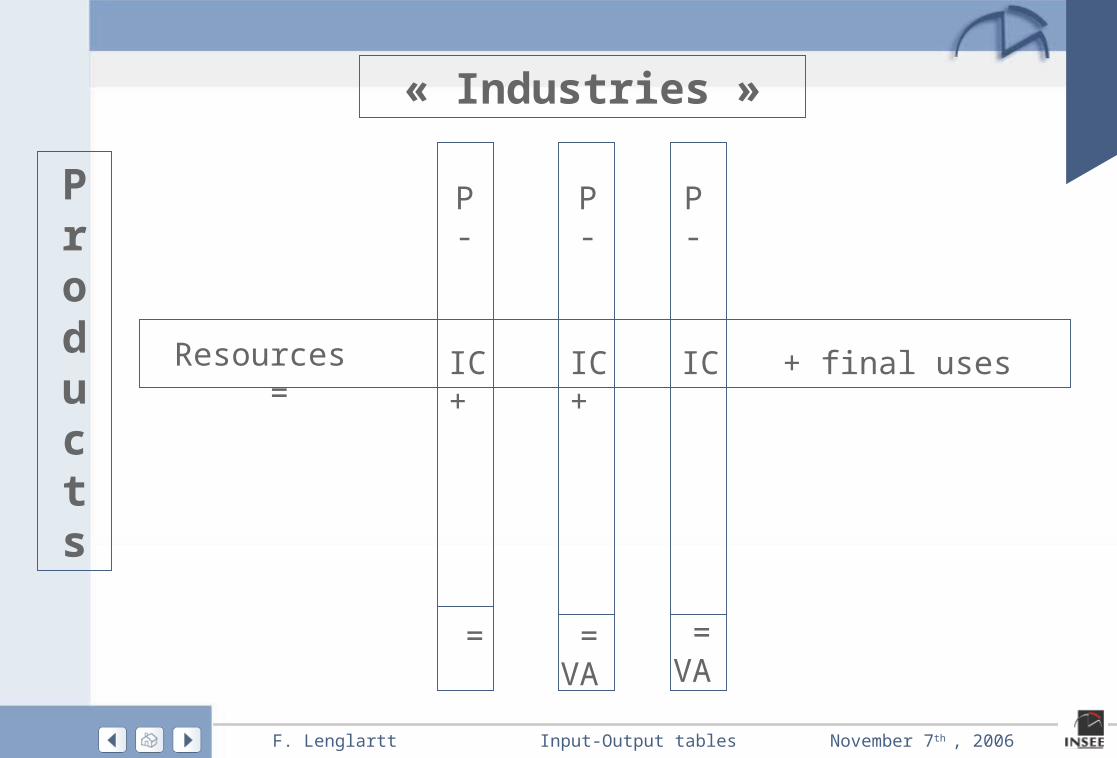
Products
« Industries »
Resources = IC +IC + IC + final uses
= VA
= VA
= VA
P-
P-
P-
Input-Output tablesF. Lenglartt November 7th , 2006
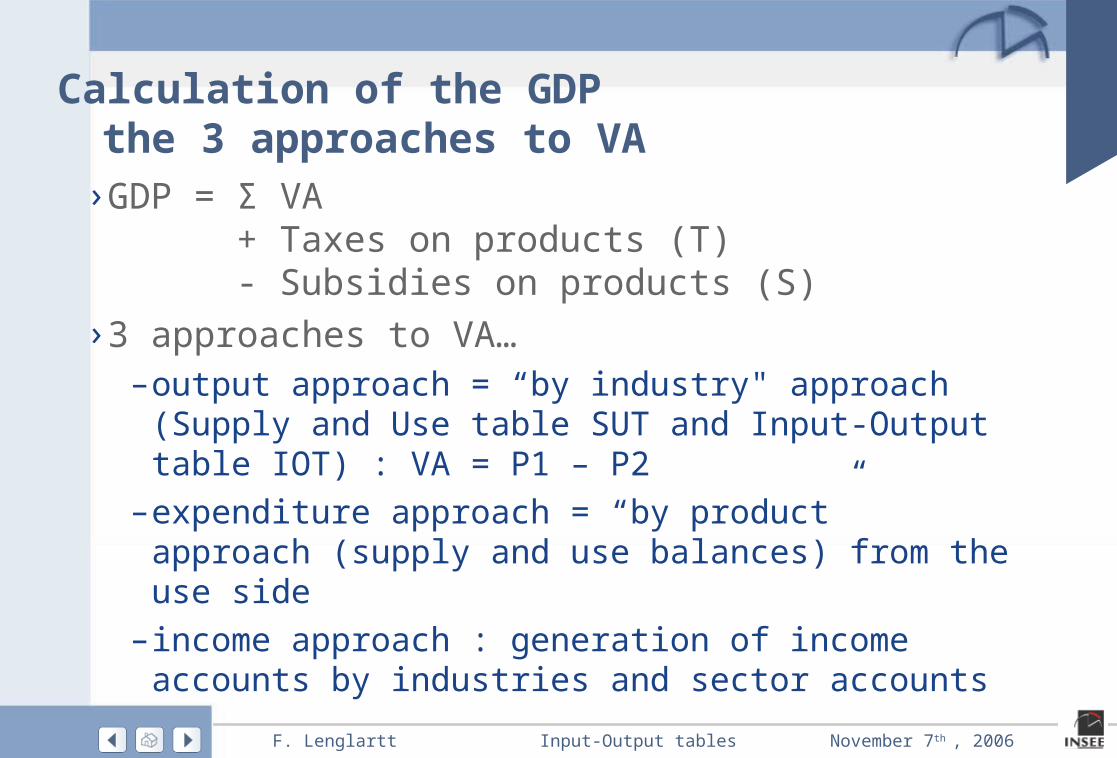
Calculation of the GDPthe 3 approaches to VA›GDP = Σ VA
+ Taxes on products (T) - Subsidies on products (S)
› 3 approaches to VA…–output approach = “by industry" approach (Supply and
Use table SUT and Input-Output table IOT) : VA = P1 – P2–expenditure approach = “by product” approach (supply
and use balances) from the use side–income approach : generation of income accounts by
industries and sector accounts

Input-Output tablesF. Lenglartt November 7th , 2006
Calculation of the GDPfrom one approach to the two others›We start with the "by industry" approach
GDP = Σ output – IC + Taxes on products (T) - Subsidies on products (S)
› Then, using the SUT / IOT relationships between industries and products (supply and use balances)
Output + T-S + M +T&TM = IU + FU and Σ IU = Σ IC
›we obtain the two other approaches:–expenditure approach = “by product” approach (supply
and use balances) all products but administration–income approach = generation of income accounts by
branches and sector accounts administration industry
Input-Output tablesF. Lenglartt November 7th , 2006
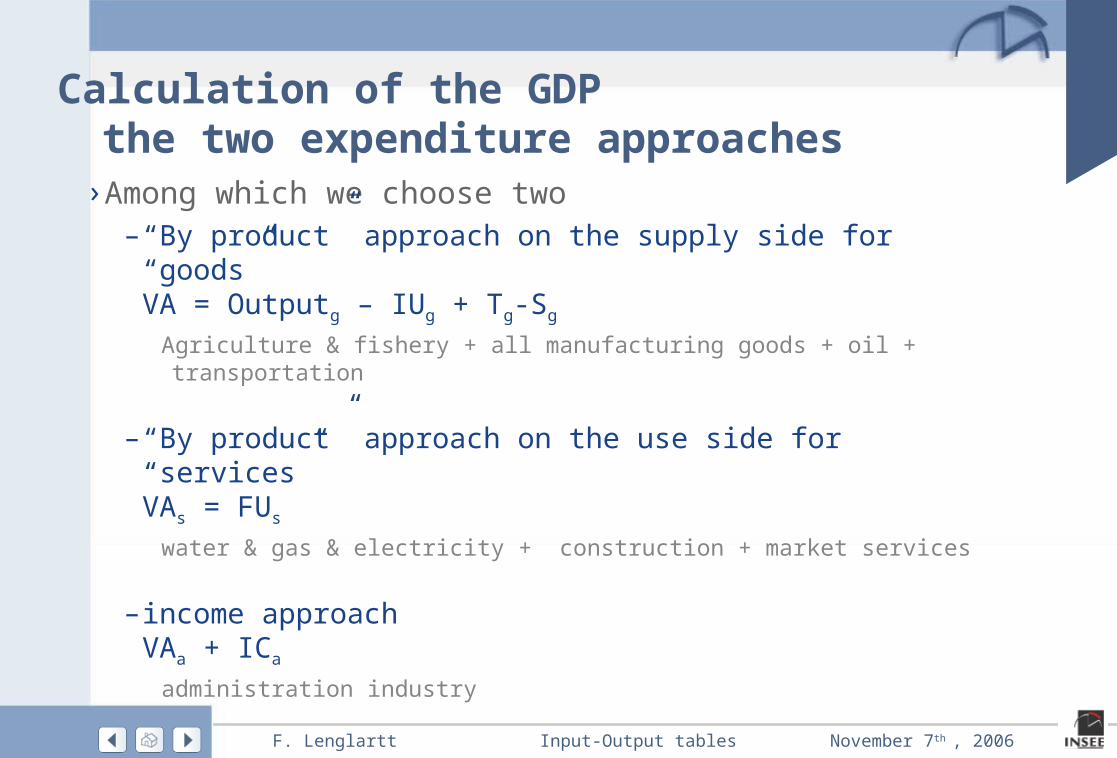
Calculation of the GDPthe two expenditure approaches› Among which we choose two
–“By product” approach on the supply side for “goods”VA = Outputg – IUg + Tg-Sg
Agriculture & fishery + all manufacturing goods + oil + transportation
–“By product” approach on the use side for “services”VAs = FUs
water & gas & electricity + construction + market services
–income approachVAa + ICa
administration industry
Input-Output tablesF. Lenglartt November 7th , 2006
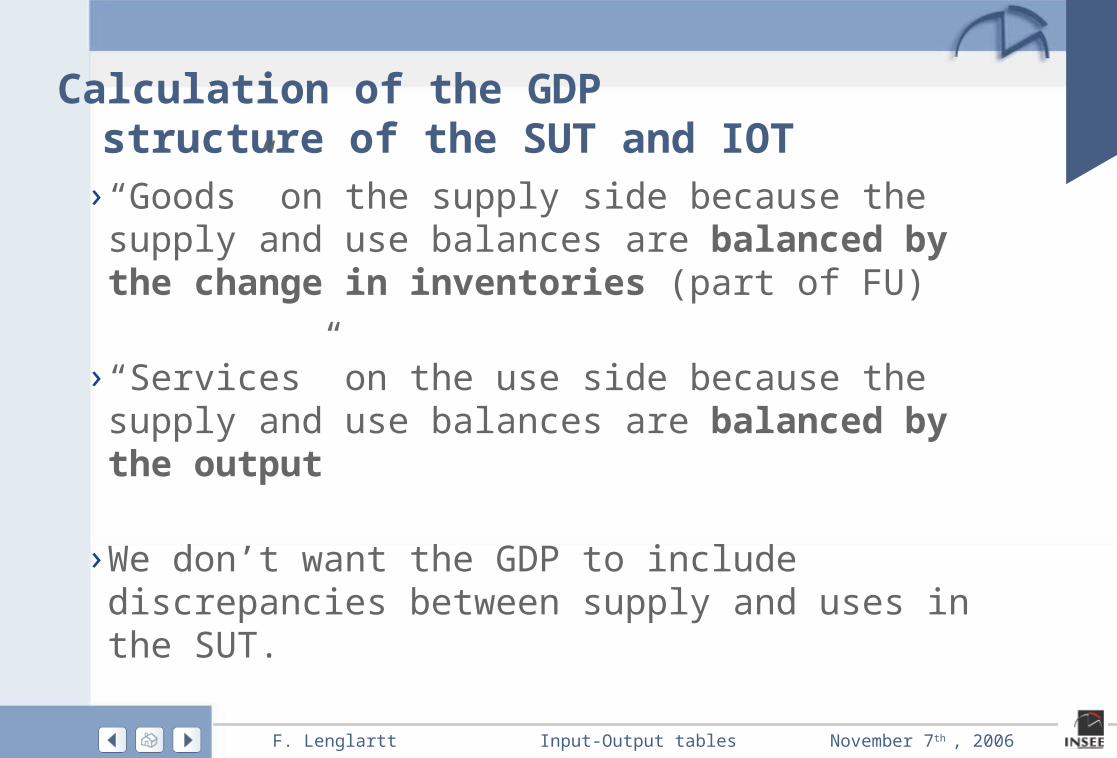
Calculation of the GDPstructure of the SUT and IOT› “Goods” on the supply side because the supply and use
balances are balanced by the change in inventories (part of FU)
› “Services” on the use side because the supply and use balances are balanced by the output
›We don’t want the GDP to include discrepancies between supply and uses in the SUT.
Input-Output tablesF. Lenglartt November 7th , 2006
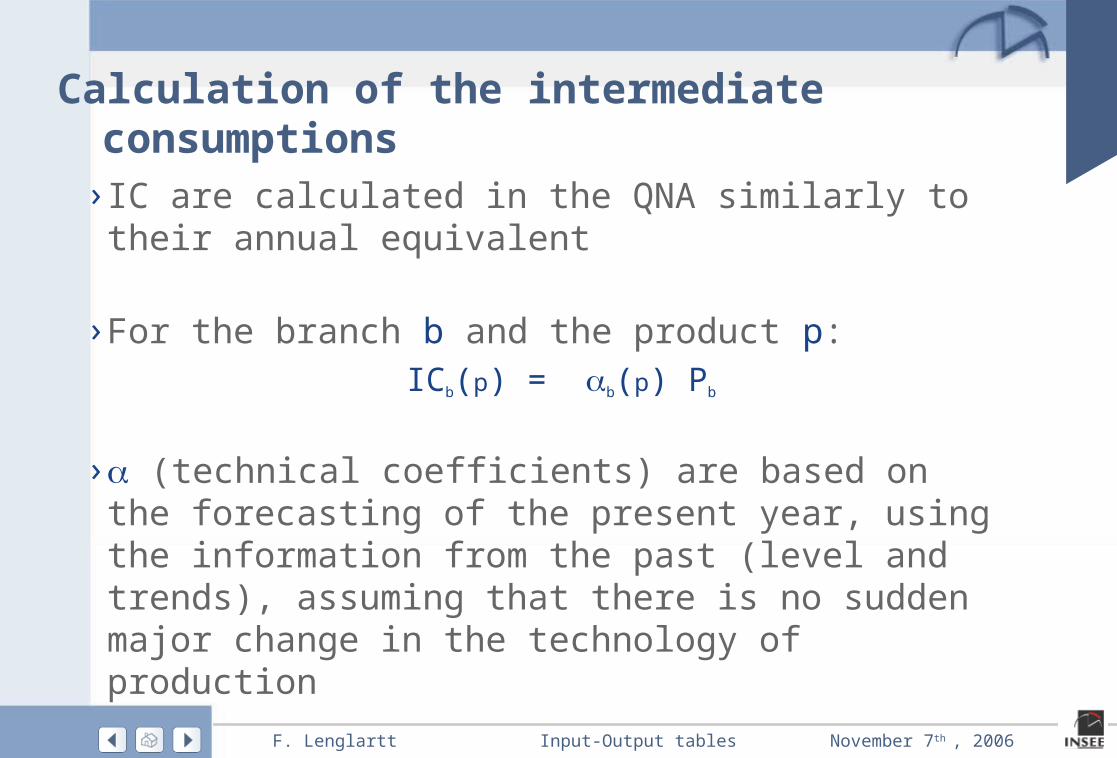
Calculation of the intermediate consumptions
› IC are calculated in the QNA similarly to their annual equivalent
› For the branch b and the product p:ICb(p) = b(p) Pb
› (technical coefficients) are based on the forecasting of the present year, using the information from the past (level and trends), assuming that there is no sudden major change in the technology of production
Input-Output tablesF. Lenglartt November 7th , 2006
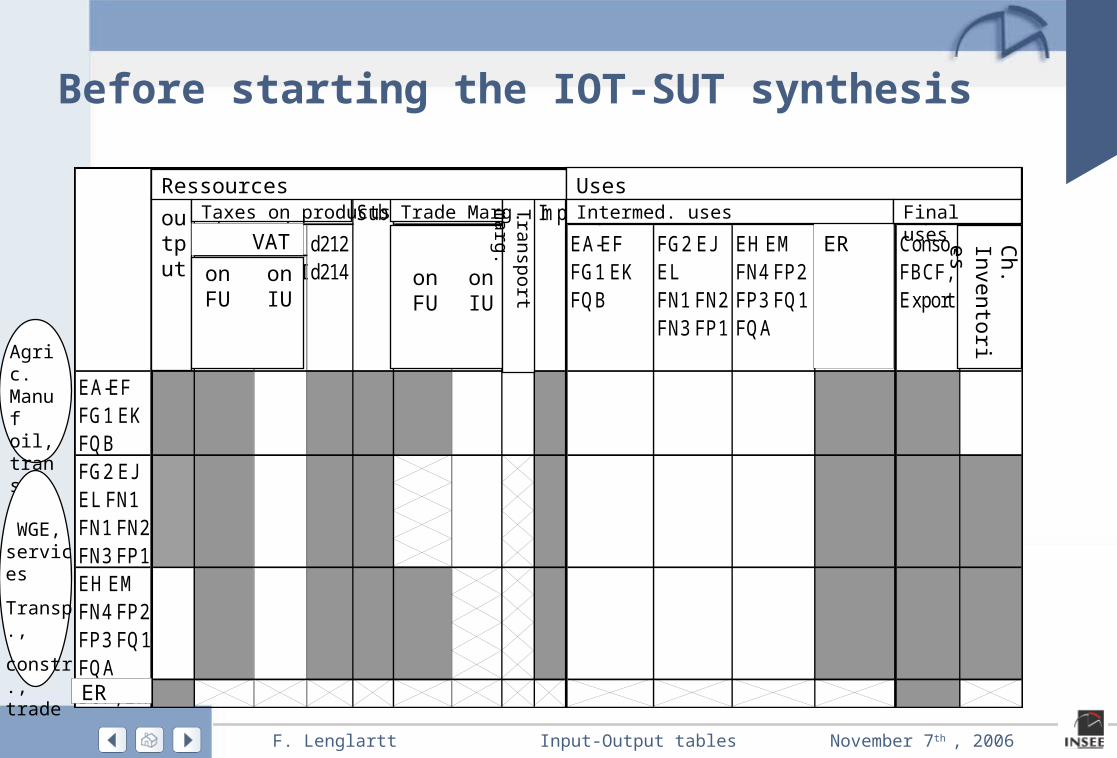
Before starting the IOT-SUT synthesis
RESSOURCES EMPLOISProd Impôts sur produits Sub MC MT Imp Emplois intermédiaires emplois finals
TVA d212 sur EF sur EI EA-EF FG2 EJ EH EM BUF, ER Conso, stockssur EF sur EI d214 FG1 EK EL FN4 FP2 FBCF,
FQB FN1 FN2 FP3 FQ1 ExportFN3 FP1 FQA
EA-EFFG1 EKFQBFG2 EJEL FN1 FN1 FN2FN3 FP1EH EM FN4 FP2FP3 FQ1FQABUF, ERER
ER
Ressources Uses
output
Taxes on products
VAT
Trade Marg. Transport m
arg.
Intermed. uses Final uses
on FU
on IU
on IU
on FU
Ch.
Inventories
Agric. Manuf oil, transp
WGE, services
Transp.,
constr., trade
Input-Output tablesF. Lenglartt November 7th , 2006
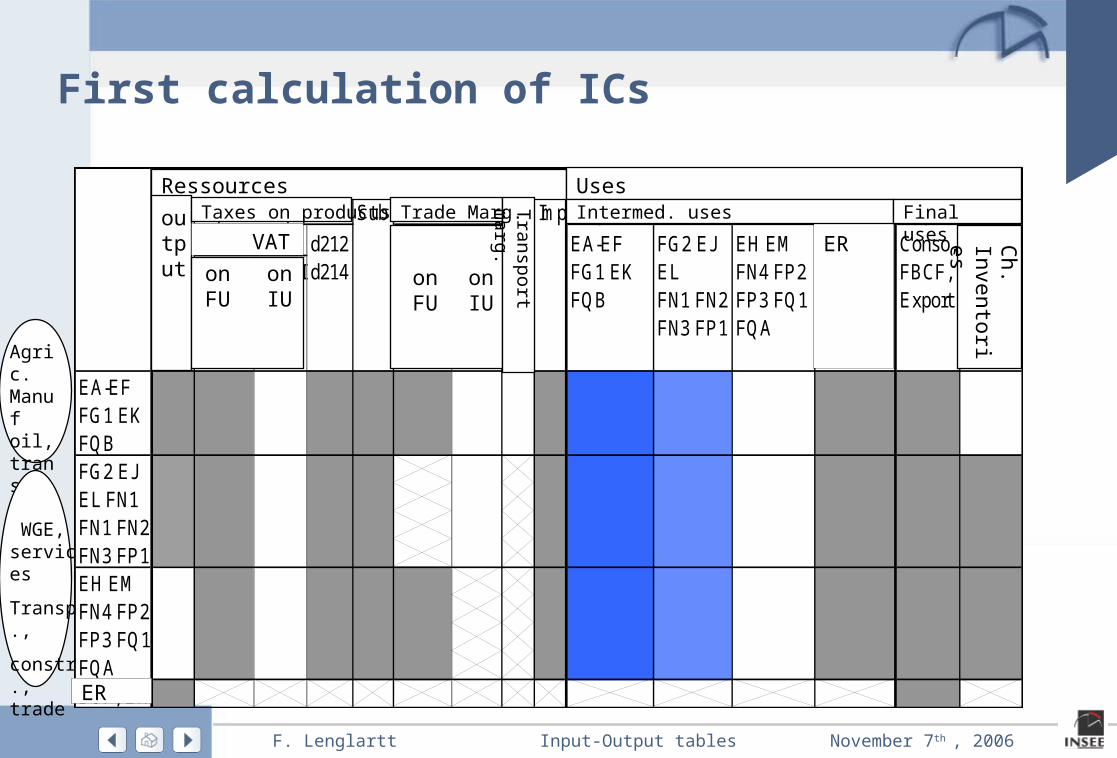
First calculation of ICs
RESSOURCES EMPLOISProd Impôts sur produits Sub MC MT Imp Emplois intermédiaires emplois finals
TVA d212 sur EF sur EI EA-EF FG2 EJ EH EM BUF, ER Conso, stockssur EF sur EI d214 FG1 EK EL FN4 FP2 FBCF,
FQB FN1 FN2 FP3 FQ1 ExportFN3 FP1 FQA
EA-EFFG1 EKFQBFG2 EJEL FN1 FN1 FN2FN3 FP1EH EM FN4 FP2FP3 FQ1FQABUF, ERER
ER
Ressources Uses
output
Taxes on products
VAT
on FU
on IU
Trade Marg.
on FU
on IU
Transport m
arg.
Intermed. uses Final uses
Ch.
Inventories
Agric. Manuf oil, transp
WGE, services
Transp.,
constr., trade

Input-Output tablesF. Lenglartt November 7th , 2006
First partial balancing
RESSOURCES EMPLOISProd Impôts sur produits Sub MC MT Imp Emplois intermédiaires emplois finals
TVA d212 sur EF sur EI EA-EF FG2 EJ EH EM BUF, ER Conso, stockssur EF sur EI d214 FG1 EK EL FN4 FP2 FBCF,
FQB FN1 FN2 FP3 FQ1 ExportFN3 FP1 FQA
EA-EFFG1 EKFQBFG2 EJEL FN1 FN1 FN2FN3 FP1EH EM FN4 FP2FP3 FQ1FQABUF, ERER
ER
Ressources Uses
output
Taxes on products
VAT
on FU
on IU
Trade Marg.
on FU
on IU
Transport m
arg.
Intermed. uses Final uses
Ch.
Inventories
Agric. Manuf oil, transp
WGE, services
Transp.,
constr., trade
Input-Output tablesF. Lenglartt November 7th , 2006
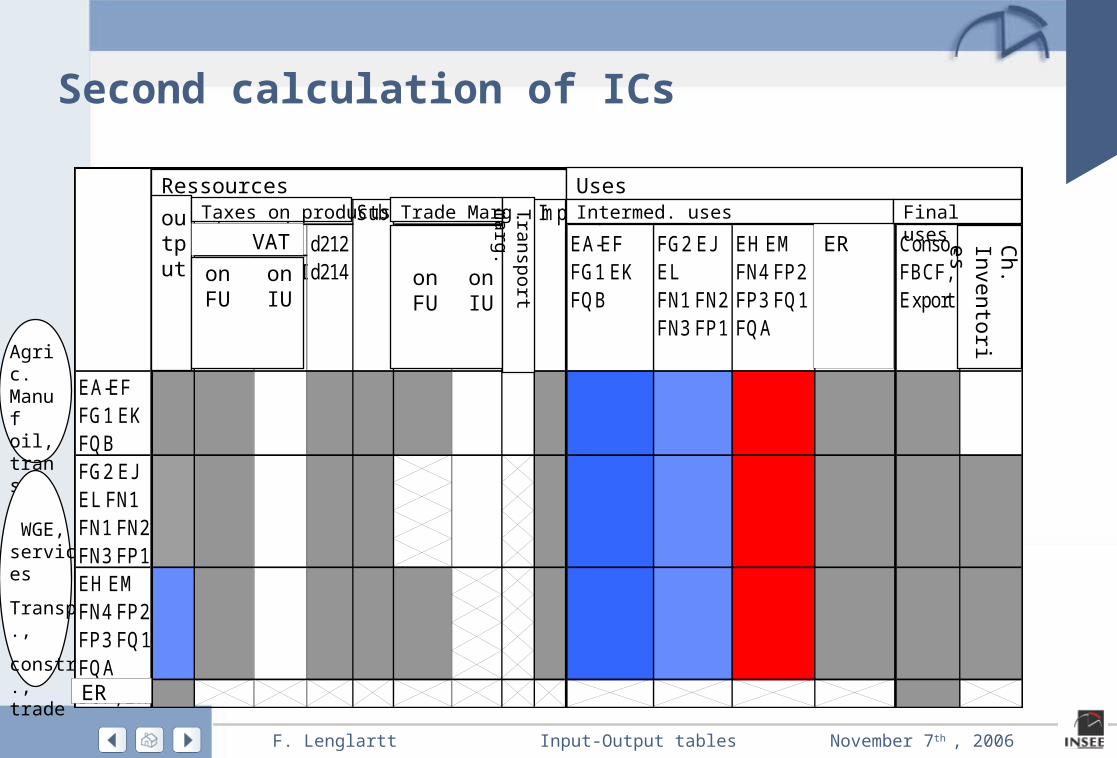
Second calculation of ICs
RESSOURCES EMPLOISProd Impôts sur produits Sub MC MT Imp Emplois intermédiaires emplois finals
TVA d212 sur EF sur EI EA-EF FG2 EJ EH EM BUF, ER Conso, stockssur EF sur EI d214 FG1 EK EL FN4 FP2 FBCF,
FQB FN1 FN2 FP3 FQ1 ExportFN3 FP1 FQA
EA-EFFG1 EKFQBFG2 EJEL FN1 FN1 FN2FN3 FP1EH EM FN4 FP2FP3 FQ1FQABUF, ERER
ER
Ressources Uses
output
Taxes on products
VAT
on FU
on IU
Trade Marg.
on FU
on IU
Transport m
arg.
Intermed. uses Final uses
Ch.
Inventories
Agric. Manuf oil, transp
WGE, services
Transp.,
constr., trade
Input-Output tablesF. Lenglartt November 7th , 2006
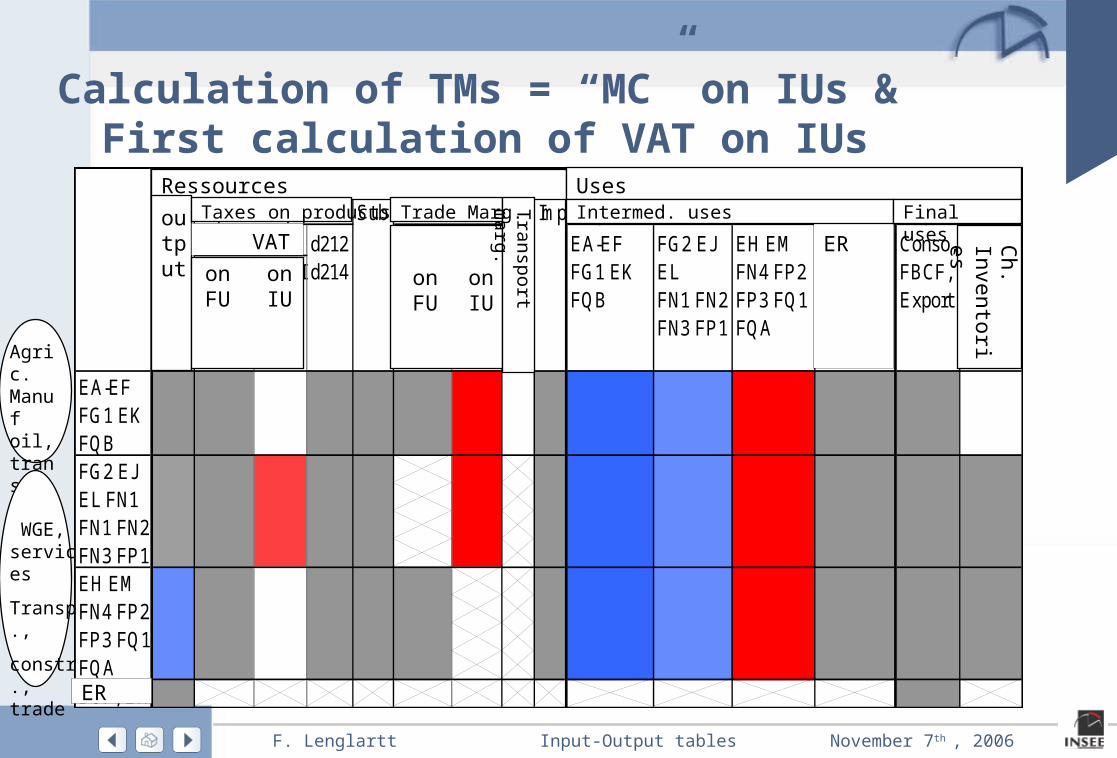
Calculation of TMs = “MC” on IUs & First calculation of VAT on IUs
RESSOURCES EMPLOISProd Impôts sur produits Sub MC MT Imp Emplois intermédiaires emplois finals
TVA d212 sur EF sur EI EA-EF FG2 EJ EH EM BUF, ER Conso, stockssur EF sur EI d214 FG1 EK EL FN4 FP2 FBCF,
FQB FN1 FN2 FP3 FQ1 ExportFN3 FP1 FQA
EA-EFFG1 EKFQBFG2 EJEL FN1 FN1 FN2FN3 FP1EH EM FN4 FP2FP3 FQ1FQABUF, ERER
ER
Ressources Uses
output
Taxes on products
VAT
on FU
on IU
Trade Marg.
on FU
on IU
Transport m
arg.
Intermed. uses Final uses
Ch.
Inventories
Agric. Manuf oil, transp
WGE, services
Transp.,
constr., trade
Input-Output tablesF. Lenglartt November 7th , 2006
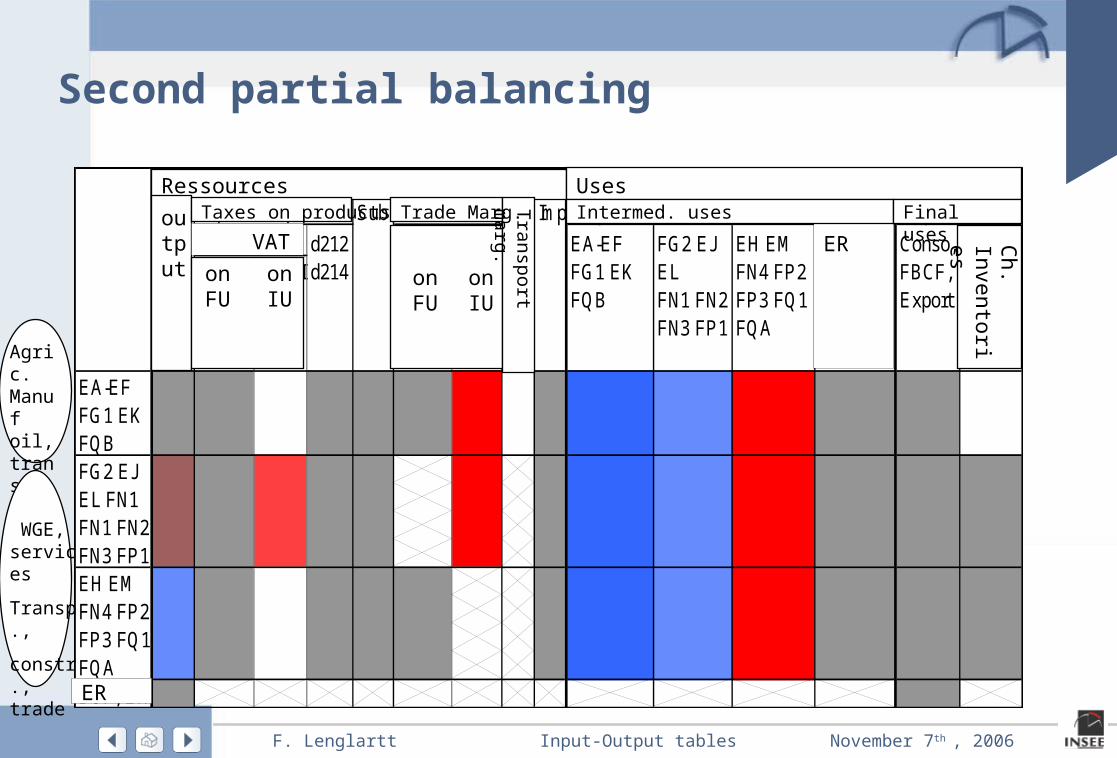
Second partial balancing
RESSOURCES EMPLOISProd Impôts sur produits Sub MC MT Imp Emplois intermédiaires emplois finals
TVA d212 sur EF sur EI EA-EF FG2 EJ EH EM BUF, ER Conso, stockssur EF sur EI d214 FG1 EK EL FN4 FP2 FBCF,
FQB FN1 FN2 FP3 FQ1 ExportFN3 FP1 FQA
EA-EFFG1 EKFQBFG2 EJEL FN1 FN1 FN2FN3 FP1EH EM FN4 FP2FP3 FQ1FQABUF, ERER
ER
Ressources Uses
output
Taxes on products
VAT
on FU
on IU
Trade Marg.
on FU
on IU
Transport m
arg.
Intermed. uses Final uses
Ch.
Inventories
Agric. Manuf oil, transp
WGE, services
Transp.,
constr., trade
Input-Output tablesF. Lenglartt November 7th , 2006
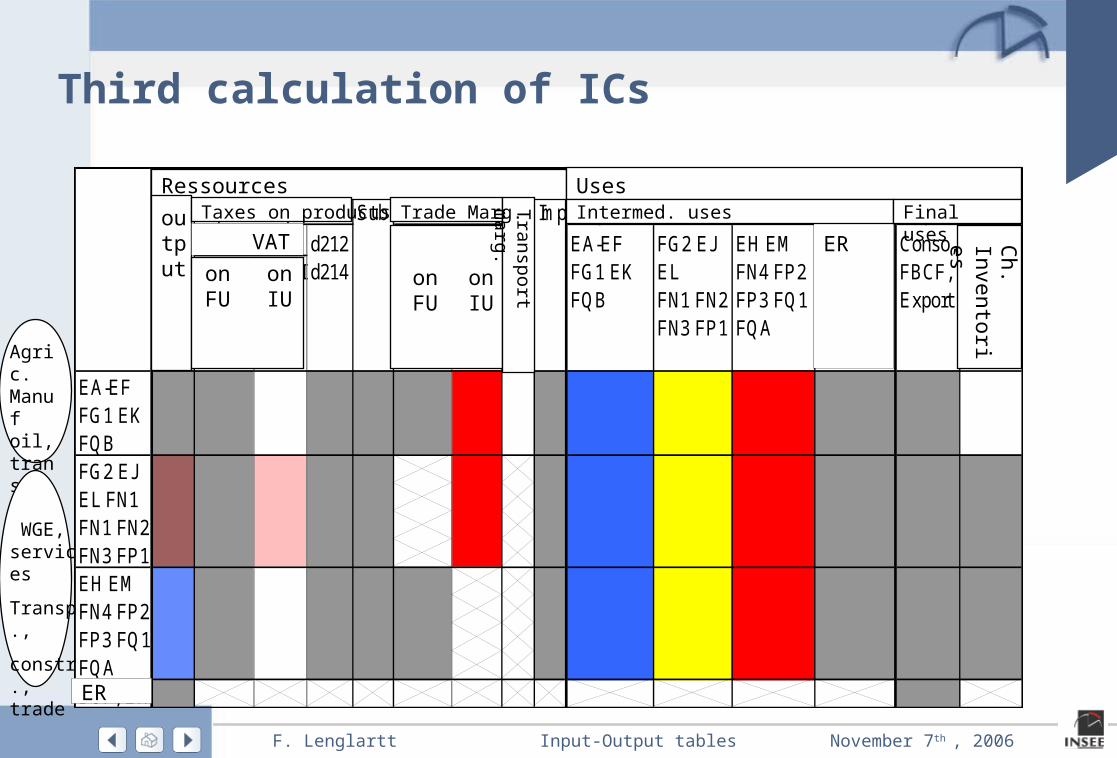
Third calculation of ICs
RESSOURCES EMPLOISProd Impôts sur produits Sub MC MT Imp Emplois intermédiaires emplois finals
TVA d212 sur EF sur EI EA-EF FG2 EJ EH EM BUF, ER Conso, stockssur EF sur EI d214 FG1 EK EL FN4 FP2 FBCF,
FQB FN1 FN2 FP3 FQ1 ExportFN3 FP1 FQA
EA-EFFG1 EKFQBFG2 EJEL FN1 FN1 FN2FN3 FP1EH EM FN4 FP2FP3 FQ1FQABUF, ERER
ER
Ressources Uses
output
Taxes on products
VAT
on FU
on IU
Trade Marg.
on FU
on IU
Transport m
arg.
Intermed. uses Final uses
Ch.
Inventories
Agric. Manuf oil, transp
WGE, services
Transp.,
constr., trade
Input-Output tablesF. Lenglartt November 7th , 2006
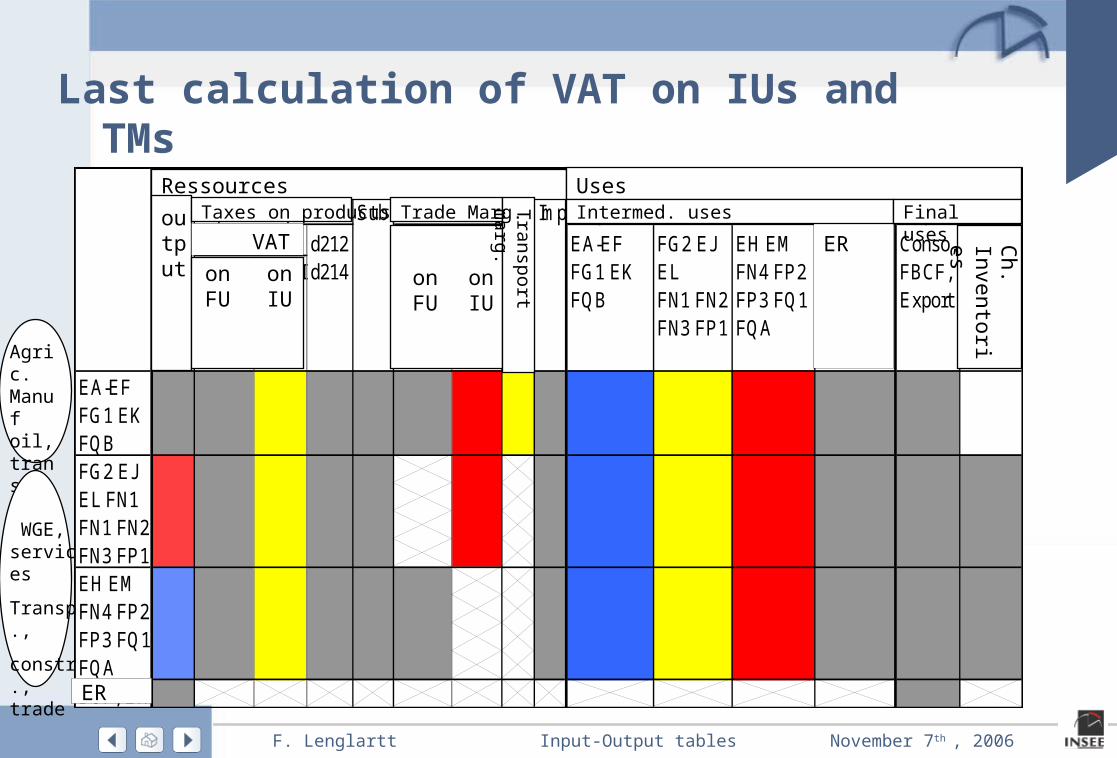
Last calculation of VAT on IUs and TMs
RESSOURCES EMPLOISProd Impôts sur produits Sub MC MT Imp Emplois intermédiaires emplois finals
TVA d212 sur EF sur EI EA-EF FG2 EJ EH EM BUF, ER Conso, stockssur EF sur EI d214 FG1 EK EL FN4 FP2 FBCF,
FQB FN1 FN2 FP3 FQ1 ExportFN3 FP1 FQA
EA-EFFG1 EKFQBFG2 EJEL FN1 FN1 FN2FN3 FP1EH EM FN4 FP2FP3 FQ1FQABUF, ERER
ER
Ressources Uses
output
Taxes on products
VAT
on FU
on IU
Trade Marg.
on FU
on IU
Transport m
arg.
Intermed. uses Final uses
Ch.
Inventories
Agric. Manuf oil, transp
WGE, services
Transp.,
constr., trade
Input-Output tablesF. Lenglartt November 7th , 2006
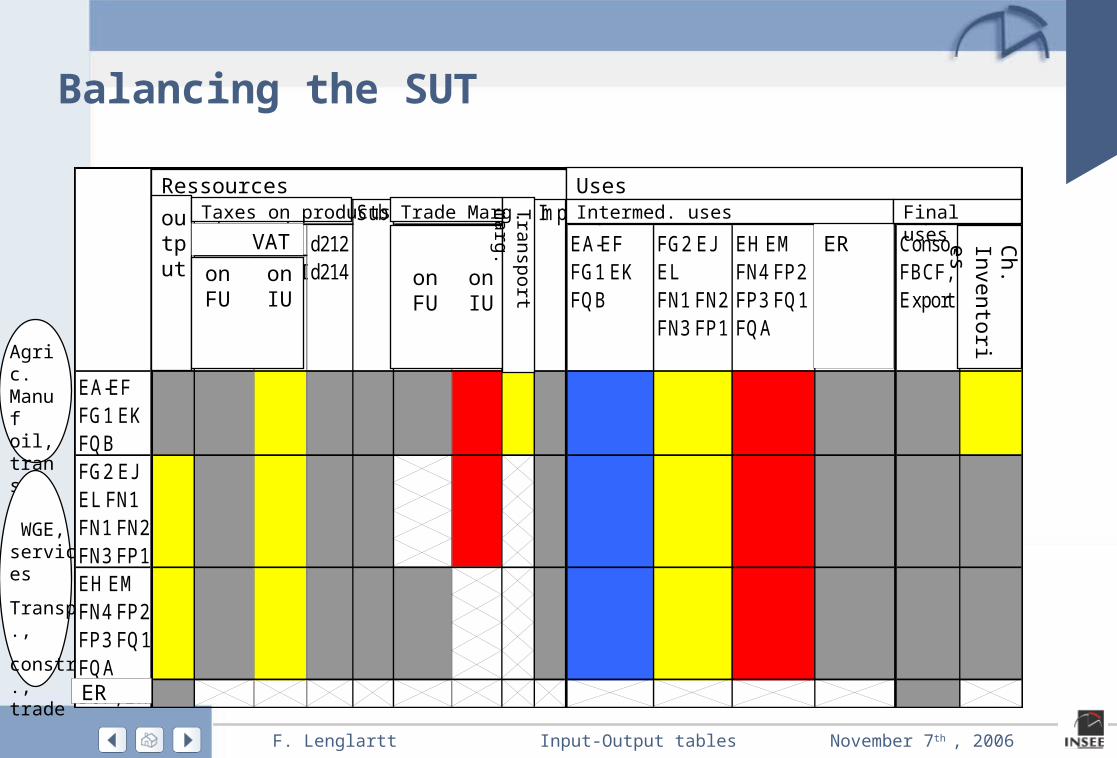
Balancing the SUT
RESSOURCES EMPLOISProd Impôts sur produits Sub MC MT Imp Emplois intermédiaires emplois finals
TVA d212 sur EF sur EI EA-EF FG2 EJ EH EM BUF, ER Conso, stockssur EF sur EI d214 FG1 EK EL FN4 FP2 FBCF,
FQB FN1 FN2 FP3 FQ1 ExportFN3 FP1 FQA
EA-EFFG1 EKFQBFG2 EJEL FN1 FN1 FN2FN3 FP1EH EM FN4 FP2FP3 FQ1FQABUF, ERER
ER
Ressources Uses
output
Taxes on products
VAT
on FU
on IU
Trade Marg.
on FU
on IU
Transport m
arg.
Intermed. uses Final uses
Ch.
Inventories
Agric. Manuf oil, transp
WGE, services
Transp.,
constr., trade
Input-Output tablesF. Lenglartt November 7th , 2006
Calibrating and fitting
Available data:
› Annual account series based on comprehensive sources–Ex :Household consumption of cars
› Quarterly partial data: indicators–Vehicle registration
› Under constraint the quarterly accounts add up to annual ones
Solution=calibration/fitting
Input-Output tablesF. Lenglartt November 7th , 2006
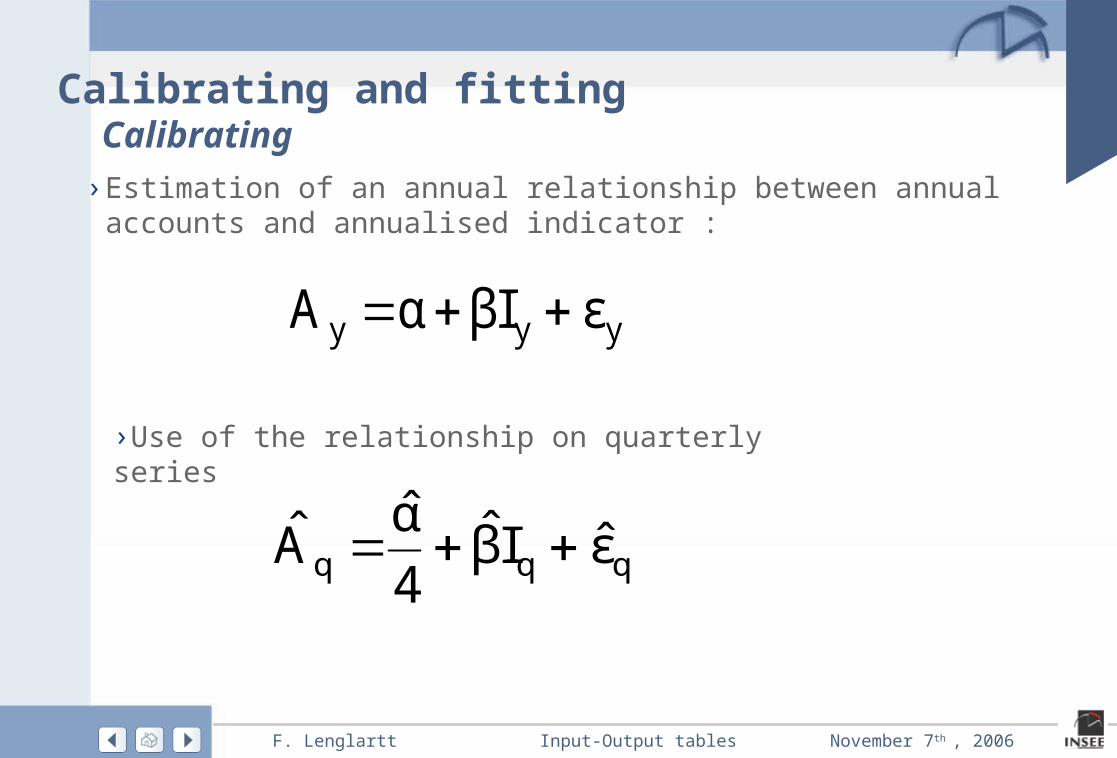
Calibrating and fittingCalibrating› Estimation of an annual relationship between annual accounts and
annualised indicator :
yyy εIβαA
qqq εIβ4
αA
›Use of the relationship on quarterly series
Input-Output tablesF. Lenglartt November 7th , 2006
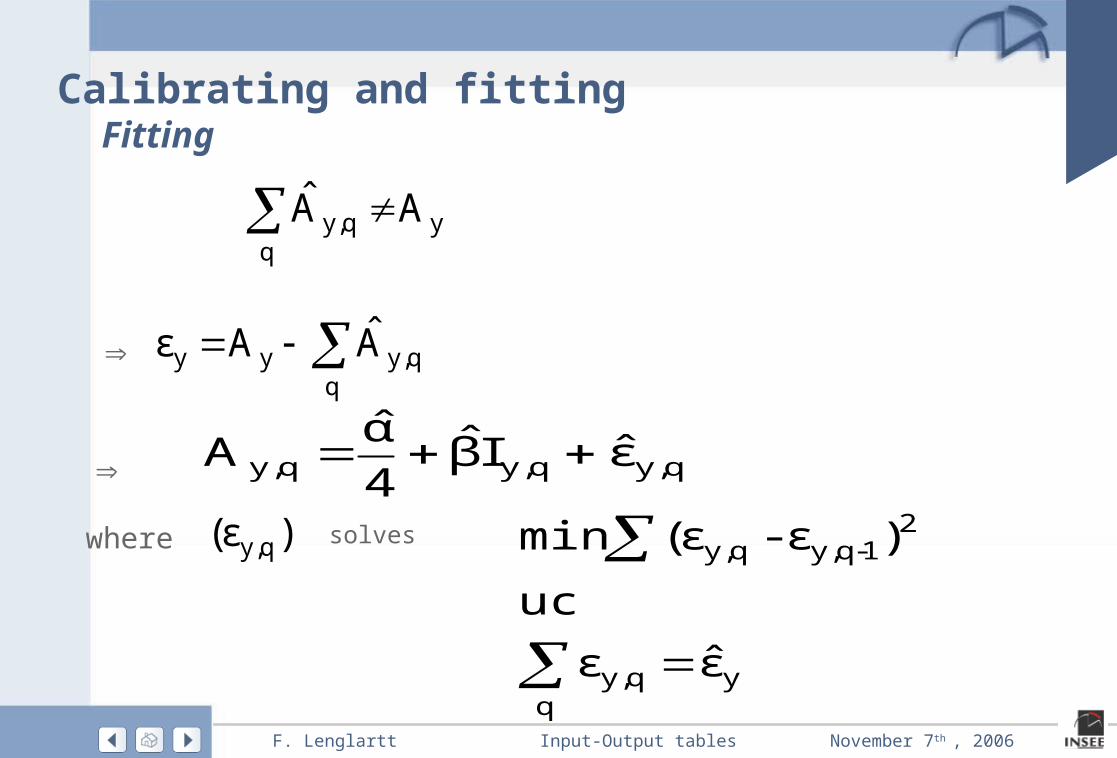
Calibrating and fittingFitting
yq
q,y AA
q
q,yyy AAε
q,yq,yq,y εIβ4
αA
)ε( q,y
yq
q,y
21-q,yq,y
εε
uc
)ε-ε(min
where solves
Input-Output tablesF. Lenglartt November 7th , 2006
Indicators and sources
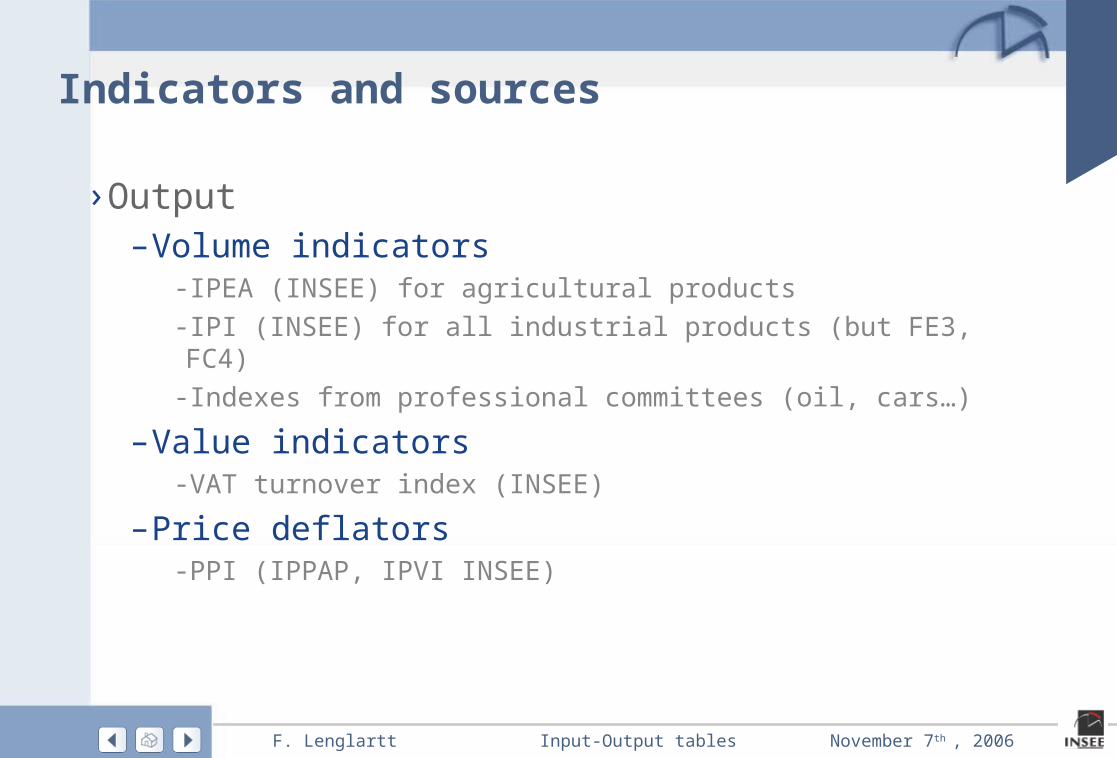
›Output–Volume indicators
‐ IPEA (INSEE) for agricultural products‐ IPI (INSEE) for all industrial products (but FE3, FC4)‐ Indexes from professional committees (oil, cars…)
–Value indicators‐VAT turnover index (INSEE)
–Price deflators‐PPI (IPPAP, IPVI INSEE)
Input-Output tablesF. Lenglartt November 7th , 2006
Indicators and sources
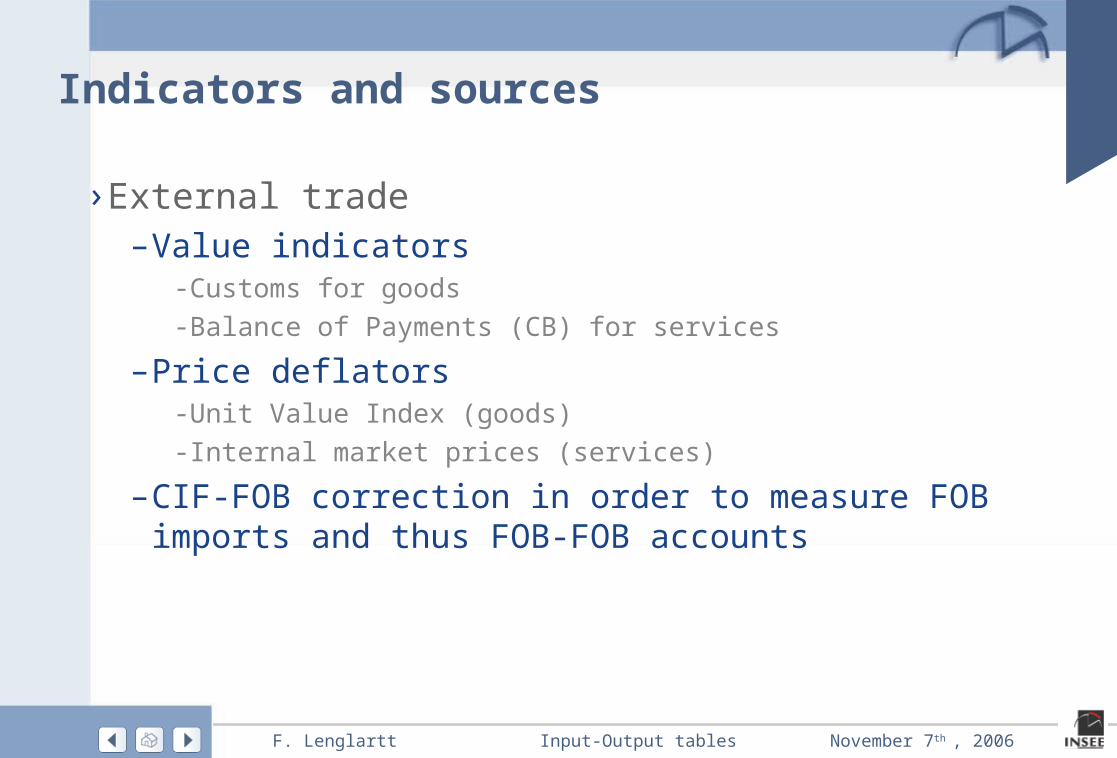
› External trade–Value indicators
‐Customs for goods‐Balance of Payments (CB) for services
–Price deflators‐Unit Value Index (goods)‐ Internal market prices (services)
–CIF-FOB correction in order to measure FOB imports and thus FOB-FOB accounts
Input-Output tablesF. Lenglartt November 7th , 2006
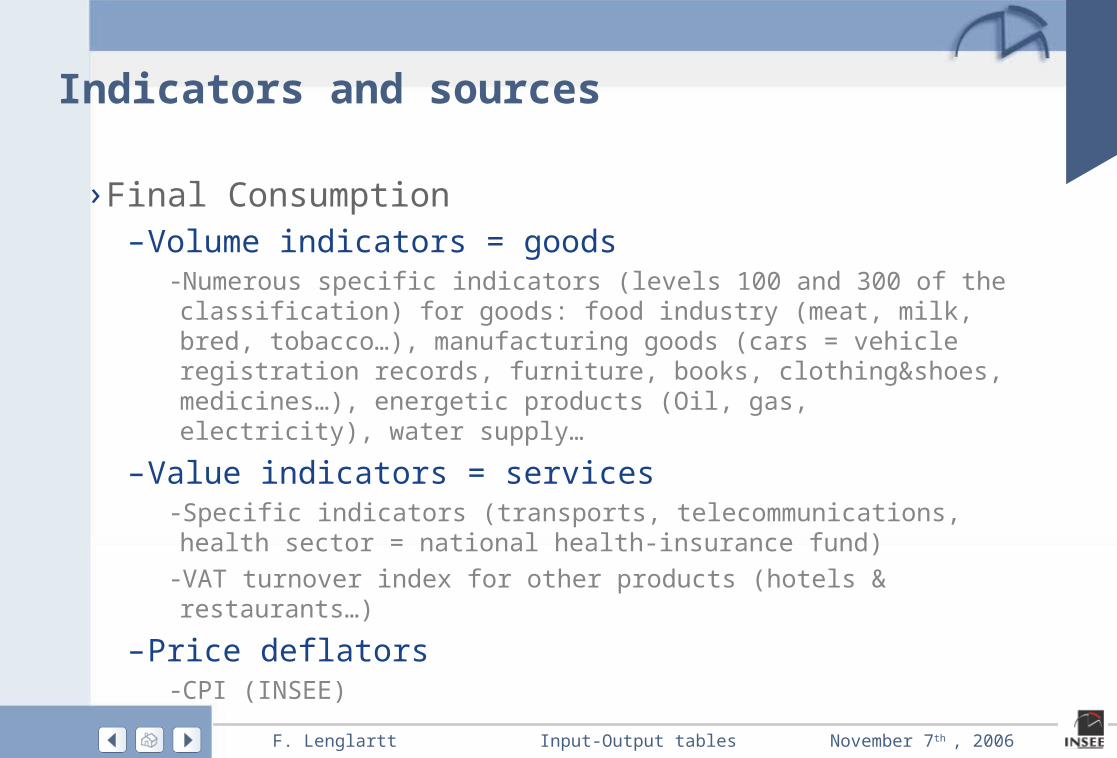
Indicators and sources
› Final Consumption–Volume indicators = goods
‐Numerous specific indicators (levels 100 and 300 of the classification) for goods: food industry (meat, milk, bred, tobacco…), manufacturing goods (cars = vehicle registration records, furniture, books, clothing&shoes, medicines…), energetic products (Oil, gas, electricity), water supply…
–Value indicators = services‐Specific indicators (transports, telecommunications, health sector = national health-insurance fund)
‐VAT turnover index for other products (hotels & restaurants…)
–Price deflators‐CPI (INSEE)
Input-Output tablesF. Lenglartt November 7th , 2006
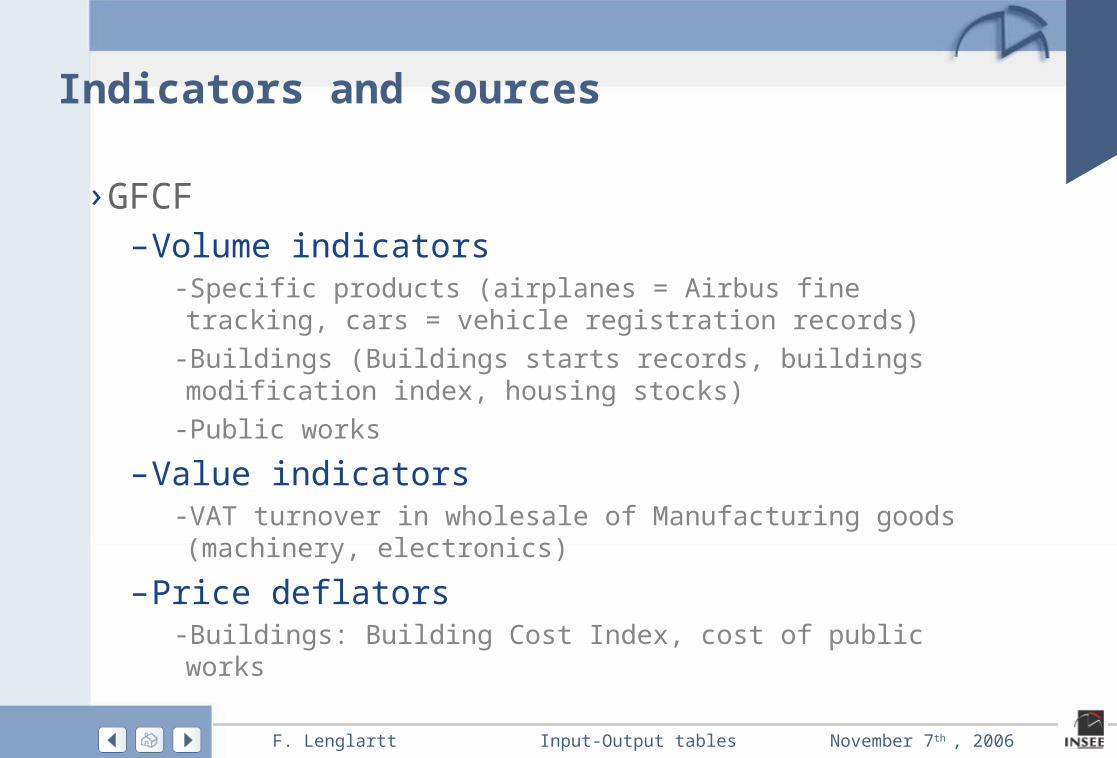
Indicators and sources
›GFCF–Volume indicators
‐Specific products (airplanes = Airbus fine tracking, cars = vehicle registration records)
‐Buildings (Buildings starts records, buildings modification index, housing stocks)
‐Public works
–Value indicators‐VAT turnover in wholesale of Manufacturing goods (machinery, electronics)
–Price deflators‐Buildings: Building Cost Index, cost of public works
Input-Output tablesF. Lenglartt November 7th , 2006
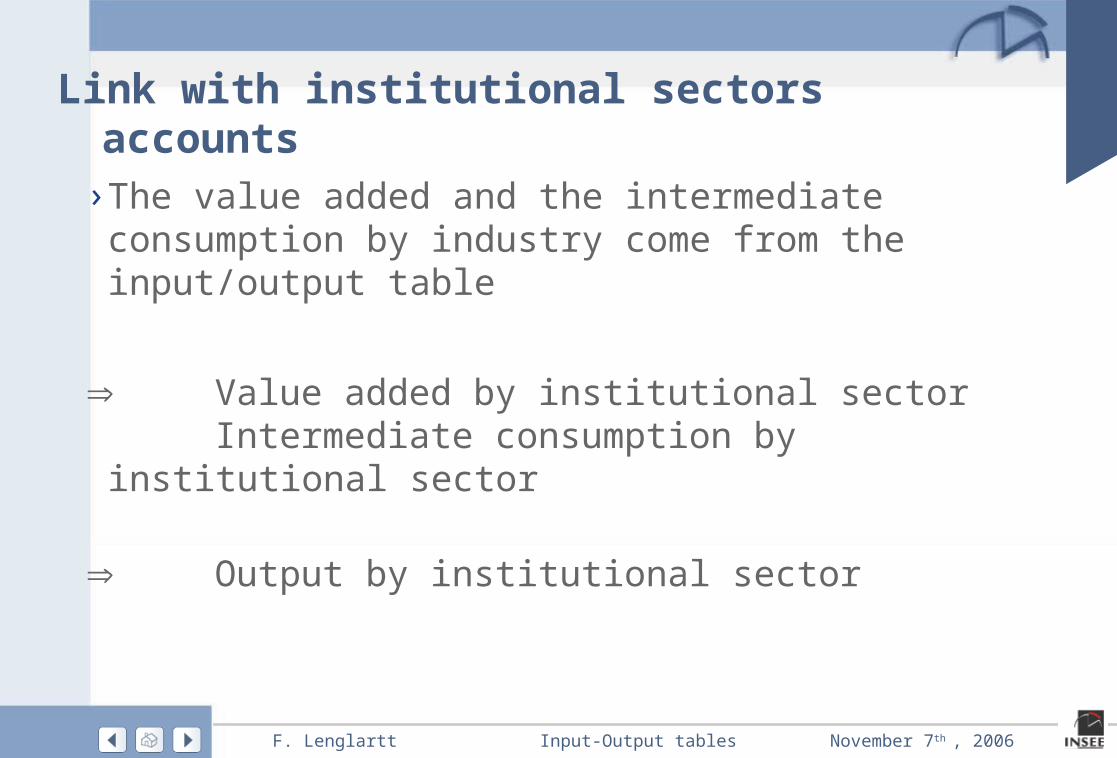
Link with institutional sectors accounts
› The value added and the intermediate consumption by industry come from the input/output table
Value added by institutional sectorIntermediate consumption by institutional sector
Output by institutional sector

Input-Output tablesF. Lenglartt November 7th , 2006
Link with institutional sectors accounts Value added by institutional sector
›Non market value added–computed by the factors’ costs for GG, HHs and NPISHs
›Market value added by institutional sector–Indicator of market value added of FCs, GG, HHs and
NIEs
= sum of VA of specific industries weighted by fixed coefficients
›Balance of the total Value added compiled in the IOT on the total VA of NFCs
Input-Output tablesF. Lenglartt November 7th , 2006
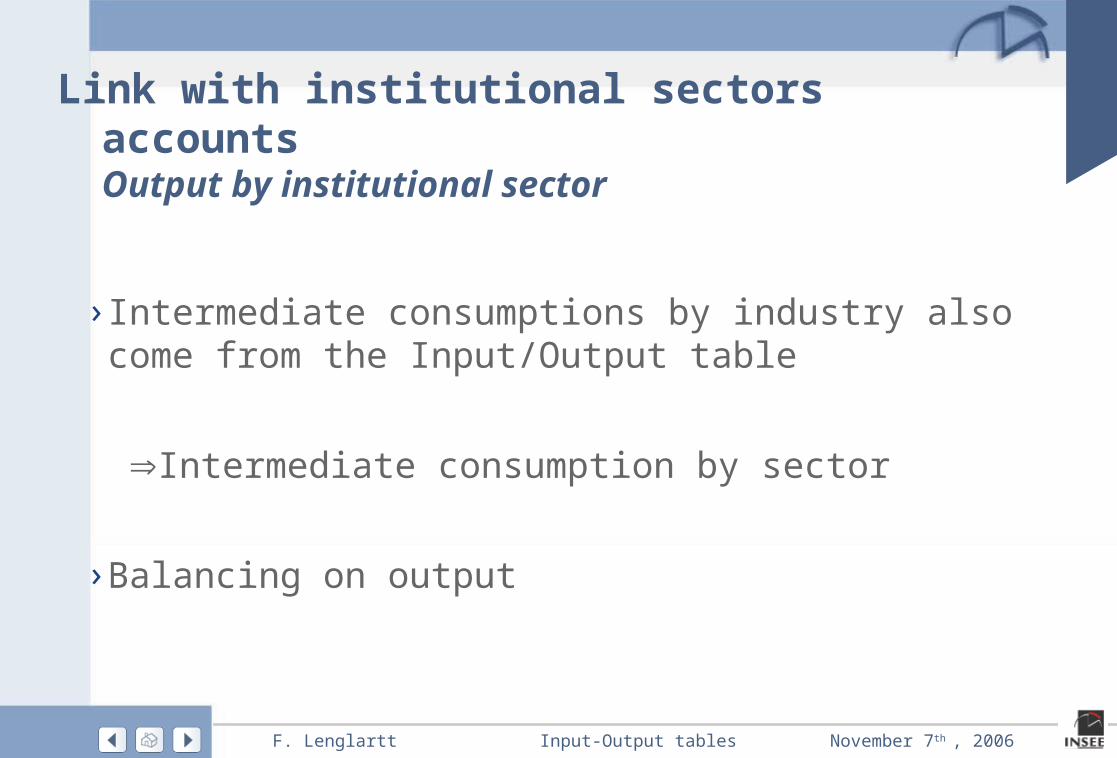
Link with institutional sectors accounts Output by institutional sector
› Intermediate consumptions by industry also come from the Input/Output table
Intermediate consumption by sector
› Balancing on output
Fabrice Lenglartnational account department
November, 7th 2006
French quaterly national accounts : Input-Output Tables methodology and indicators