Embed Size (px)
Citation preview

FREEZE-THAW DURABILITY OF CONCRETES WITH AND
WITHOUT CLASS C FLY ASH
Final Report For
MLR-94-9 - Phase I ~
January 1997
Project D~velopment Division
~ Iowa Department ~ of Transportation

FREEZE-THAW DURABILITY OF CONCRETES WITH AND WITHOUT CLASS C FLY ASH
Final Report for
MLR-94-9 - Phase l
By Chengsheng Ouyang
Transportation Engineer Associate 515-239-1088
and
John Lane Testing Engineer
515-239-123 7
FAX: 515-239-1092 Office of Materials
Project Development Division Iowa Department of Transportation
Ames~ Iowa 50010
January 1997

TECHNICAL REPORT TITLE PAGE
1 . REPORT NO.
MLR-9~-9, Phase 1
3. TITLE AND SUBTITLE
Freeze-Thaw Durability of Concretes With and Without Class c Fly Ash
5. AUTHOR (S)
Chengsheng Ouyang Transportation Engineer Assoc.
John Lane Testing Engineer
2 . REPORT DATE
January 1997
4 . TYPE OF REPORT & PERIOD COVERED
Phase 1 Final Report 12-24 to 1-97
6. PERFORMING ORGANIZATION ADDRESS
Iowa Department of Transportation Materials Department 800 Lincoln Way Ames, Iowa 50010
7. ACl'(NOWLEDGEMENT OF COOPERATING ORGANIZATIONS
Iowa State University, Lafarge, Canada Inc. and Ash Grove Cement Co.
8. ABSTRACT
The freeze-thaw resistance cf concretes was studied. Nine concrete mixes, made with five cements and cement-Class C fly ash combinations, were exposed to freeze-thaw cycling following 110 to 222 days of moist curi~g. Prior to the freeze-thaw cycling, the specime~s were examined by a low-vacuum scanning electron microscope (SEMI for their microstructure. The influence of a we/dry treatment was also studied.
I~filling of ettringite in entrained air voids was observed in the concretes tested. The extent of the infilling depends on the period of moist curing as well as the wet/dry treatment. The concretes with 15% Class c fly ash replacement show more infilling in their air voids. It was found that the influence of the infilling on the freeze-thaw durability relates to the air spacing factor. The greater the spacing factor, the more expansion under the freeze-thaw cycling. The infilling seems to decrease effective air content and to increase effective spacing factor. The infilling ·also implies that the filled air voids are water-accessible. These might lead to concrete more vulnerable to the freeze-thaw attack.
By combining the above results with field observations, one may conclude that the freeze-thaw damage is a factor related to premature deterioration of PCC pavements in Iowa.
9. KEY WORDS
Freeze-thaw durability Ettringite Fly asr. Prema~ure deterioration SEM photomicrograph Air entrained parameters
10. NO. OF PAGES
58

TABLE OF CONTENTS
Page
Introduction . . . . . . . . . . . . . . . . . . . . . . . . . . . . . . . . . . . . . . . . . . . . . . . . . . . . . . . 1
Materials, Specimens and Test Procedure · ..... ; : .................... ; .- . . . . 3 Materials and Specimens. . . . . . . . . . . . . . . . . . . . . . . . . . . . . . . . . . . . . . . . . . . . 3 Test Procedure . . . . . . . . . . . . . . . . . . . . . . . . . . . . . . . . . . . . . . . . . . . . . . . . . . . 4
Experimental Observations . . . . . . . . . . . . . . . . . . . . . . . . . . . . . . . . . . . . . . . . . . . . 6 History of Specimen Length Change . . . . . . . . . . . . . . . . . . . . . . . . . . . . . . . . . . . 6 Freeze-Thaw Response of Specimens With the Wet/Dry Treatment ........... 7 Freeze-Thaw Response of Specimens Without the Wet/Dry Treatment . . . . . . . . . 9
Discussion . . . . . . . . . . . . . . . . . . . . ............................. : . . . . . . . 10 Effect of Ettringite Infilling ............. ·. . . . . . . . . . . . . . . . . . . . . . . . . . . . . 10 Possible Mechanisms for Change of Freeze-Thaw Response . . . . . . . . . . . . . . . . . 11 Effect of Cement Chemistry on Spacing Factor . . . . . . . . . . . . . . . . . . . . . . . . . . . 13
Summary .......................................................... 14
Some Field E\'idence . . . . . . . . . . . . . . . . . . . . . . . . . . . . . . . . . . . . . . . . . . . . . . . . . 15
Ackno,vledgements . . . . . . . . . . . . . . . . . . . . . . . . . . . . . . . . . . . . . . . . . . . . . . . . . . 17
References . . . . . . . . . . . . . . . . . . . . . . . . . . . . . . . . . . . . . . . . . . . . . . . . . . . . . . . . . 18
Table Titles . . . . . . . . . . . . . . . . . . . . . . . . . . . . . . . . . . . . . . . . . . . . . . . . . . . . . . . . 20
Figure Captions . . . . . . . . . . . . . . . . . . . . . . . . . . . . . . . . . . . . . . . . . . . . . . . . . . . . . 26
Appendices Appendix l - Supplemental Results on Freeze-Thaw Durability of Concrete Mixes
With the Wet/Dry Treatment .............................. 51 Appendix 11 - Supplemental Results on Freeze-Thaw Durability of Concrete Mixes
Without the Wet/Dry Treatment ........... : . . . . . . . . . . . . . . . . 55
DISCLAIMER
The contents of this report reflect the views of the author and do not necessarily reflect the official views of the Iowa Department of Transportation. This report does not constitute any standard~ specification or regulation.

1. INTRODUCTION
Premature deterioration of some portland cement concrete (PCC) pavements in Iowa~
other than D-cracking~ has been reported for several years. Many efforts have been attempted to
identify causes leading to the premature deterioration. These proposed causes include alkali-silica
reaction! 11 and internal sulfate attackl~l.
Alkali-silica reaction (ASR) resuhs from a chemical reaction between alkali contained
in cement paste and certain reactive fonns of silica within aggregates. This reaction causes expansion
which may lead to cracking of concrete. It was reported that some Iowa sands contain up to 2.5%
of shale particles which might have potential to cause ASRl11• However, these sands, with up to 2.5%
shale particles, have good service records in many Iowa highways.
Calcium sulfoaluminate (or ettringite) is the reaction product of calciu~ aluminum and
sulfur components131• The formation of ettringite is accompanied by increase in volume of materials.
Since tricalcium aluminate (C3A) is a very active major component in cement, it reacts with sulfate
ions (SO.~. also in cement) to form ettringite within hours after mixing with water. Because the
concrete is plastic in this stage, the volume increase due to the ettringite formation might not result
in cracking. However, the formation of excessive ettringite in hardened concrete may result in
cracking. This is referred to as sulfate attack, and may happen when a mature concrete is exposed
to a sulfate-rich environment, or when the formation of ettringite is excessive in concrete.
Several mechanisms have been proposed to explain freeze-thaw damage of concretel4l.
It generally agrees that the freeze-thaw damage occurs when cement paste freezes and there is no free
space within the concrete to relieve internal osmotic and hydraulic pressure. Entrained air voids are
designed to relieve the pressure and to assure the freeze-thaw resistance of concrete.
1

Petrographic observations of cores from several concrete pavements in Iowa, using
a low-vacuum scanning electron microscope, have found that many entrained air voids in matured
and aged concrete are filled, to some extent, by sulfate-rich material which may be ettringiter21151 and
will be referred to as ettringite later in this report .. ·More infilling of ettringite was reported for the
concrete mixes which have 15% the portland cement replaced by Class C fly ash. Currently, there
are some arguments on whether or not the redeposit of ettringite in air voids of matured concrete
results in sulfate attack161l7l. It is unclear if this infilling of ettringite reduces effectivt:: entrained air
voids1"1• The infilling of ettringite in entrained air voids might lead to the aged concrete becoming
more vulnerable to the freeze-thaw attack. If this is true, the freeze-thaw resistance of concrete might
decrease when concrete becomes more mature and when a certain amount of cement is replaced by
Class C fly ash. This is because the infilling of entrained air voids is more significant for concrete with
older age and with the Class C fly ash replacement. Certain portland cements alone may also have
the potential to produce void infilling material.
Even though some contradictory results have been reported, most studies indicate that
the use of suitable amount of Class C fly ash in concrete can improve its resistance to sulfate attack
and alkali-silica reaction181. Several investigators191l 10l reported that concrete which used fly ash had
satisfactory resistance to the freeze-thaw attack. However, in most of these laboratory studies, the
concrete specimens were exposed to the freeze-thaw cycling at either 14 days or 28 days. Nasser and
Lait 111 tested the freeze-thaw resistance of concretes after 28 days·and 80 days curing, respectively.
A Class F fly ash with available alkalies (Na20 equivalent) of 1.77% was ·used. ·They reported that
concretes with 20%, 35% and 50% of fly ash had lower relative dynamic modulus and greater loss
in mass compared to the control mix without fly ash. By considering the potential effect of the
2

infilling of air Yoids by ettringite previously discussed~ more research is certainly needed to further
assess the freeze-thaw resistance of concrete after a long period of moist curing.
This research is to study the freeze.;thaw resistance of concretes with and without
replacement of cement by Class C fly ash after up to 222 days of moist curing. Nine concrete mixe~
made with five cements and cement-fly ash combinations, were exposed to the freeze-thaw cycling
following 110 to 222 days of moist curing. The length change of the specimens was continuously
monitored. from 24 hours after casting to the end of the freeze-thaw test. Prior to the freeze-thaw
cycling. the specimens were examined by a low-vacuum scanning electron microscope (SEM) for
their microstructure. The influence of a wet/dry treatment similar to that used for the Duggan Testl121
was also studied.
Although many studies have been previously conducted to evaluate the freeze-thaw
durability of concrete containing fly ash, the features of this study include: (i) testing the freeze-thaw
resistance of concretes after relatively long periods of moist curing and wet/dry cycles. (ii) relating
microstructure of concretes. which are based on their SEM photomicrographs taken immediately
prior to the freeze-thaw cycling~ to their freeze-thaw resistance.
2. MATERIALS, SPECIMENS AND TEST PROCEDURE
2.1 Materials and Specimens
The chemical propenies of five cements that were used are listed in Table 1 were used.
Chemical properties of the Class C fly ash used are given in Table 2. A total of nine mixes given in
Table 3 were produced using these cements and the fly ash. The plastic entrained air contents
3

measured during casting are shown for each mix in Table 3. Iowa Department of Transportation
Standard Mixes C-3 and C-3-C were used as indicated in Table 3.
2.2 Test Procedure
The goal of this research is to study the freeze-thaw resistance of concrete mixes after
different periods of moist curing. The test procedure used is described in Fig. 1. Four 4" x 4" x 18"
beams were cast for each ~ and stored in a standard 1000/o humidity and 73°F moist room. Sixteen
13/4"x3 1/2" cores were drilled from two of these beams at the age of 59 days. The remaining two
beams were stored in laboratory tap water and used later. At the age of 60 days, a core from each
mix was examined by a SEM to observe microstructure of the concrete.
At the age of 102 days, the remaining fifteen cores were subjected to the wet/dry
treatment. which consists of three consecutive wet (70°F in distilled water)/dry (186 F in oven)
cycles. then cured in distilled water. This wet/dry treatment is similar to that used for the Duggan
Test112l. Three of these cores were subjected to the freeze-thaw cycling at the age of 110 days. The
remaining twelve cores were cured in distilled water.
At the age of 162 days, three cores from each mix were subjected to the freeze-thaw
cycling, and one core was examined by SEM prior to the cycling. Among the remaining eight cores,
four of them were continuously cured in distilled water, whereas the other four were switched to
curing in 5% NaCl salt water. All these cores were cured until the·age of222 days. Then, for each
curing condition, after one core was examined by SEM, the other three cores were subjected to
4

freeze-thaw cycling. Samples taken from mixes 3 and 6 at the age of 222 days, which have been
subjected to the wet/dry treatment, were sent to the research laboratory of Lafarge Canada,· Inc. for
examining their microstructure.
Also at the age of 162 days, for each 'mix the two beams, which weren't subjected to
the wet/dry treatment, were taken out of the laboratory tap water. After a dike was placed on the
top surface of each beam, one bea~ was exposed to distilled water at the top surface, whereas the
other was exposed to 5% salt water. At the age of 222 days, three cores were drilled from each of
the beams. Since only the top surface of each beam were exposed to water during the period from
162 days and 222 days of age, these cores were expected to have lower degree of saturation
compared to those subjected to the wet/dry treatment. The latter are under continuously moist curing
after the treatment. While one core was examined by SEM, the other two cores were subjected to . .
the freeze-thaw cycling. Samples was cut at the age of222 days from each of these beams, which
were not subjected to the wet/dry treatment. These samples were sent to Research Laboratories of
Lafarge Canada, Inc. and Ash Grove Cement Company, respectively, for measuring entrained air
parameters by linear traverse method (ASTM C457). The obtained results are given in Table 4.
Since only empty and partially filled (by ettringite) air voids were counted in the measurement by the
two laboratories. the results obtained in such a way are referred to as effective air parameters in this
report, whose values may change in a hardened concrete as infilling progress. It is noted that these
values of the effective air parameters listed in Table 4 are for the specimens which were exposed to
extended moist curing but were not subjected to the wet/dry treatment. The samples from Mixes 4
and 6, which were subjected to both extended moist curing and the wet/dry treatment, were also sent
to the Research Laboratory of Lafarge Canada, Inc. for testing. They reported that up to 80% of air
5

voids were filled by ettringite for these samples. The effect of ettringite infilling is obviously under
estimated by the values of the air p~ameters given in Table 4 for the samples subjected to both
ex1ended moist curing and the wet/dry treatment. However, these values may provide a quantitative
means to evaluate this effect.
The freeze-thaw cycling consists of two hours of freezing in air (0°F) and one and half
hours of thawing in water (4D°F). This is similar to ASTM C 666B. The cycling continues until the
failure of the sample or after reaching 800 cycles.
3. EXPERIMENT AL OBSERVATIONS
3. l Historv of Specimen Length Change
· Length changes of all specimens (the beams and cores) were monitored during the
entire test period. The length change of Mix 4, from 24 hours after casting to the end of the freeze
thaw cycling, is sho\\n in Fig. 2. ln this figure, the solid line represents the length change of the
specimens without the wet/dry treatment. whereas the dashed line indicates the length change of the
specimens with the treatment. Although the wet/dry treatment was performed at the age of 102 days,
the length change was negligible until the freeze-thaw cycling started at the age of 222 days. The
SEM photomicrographs for the specimens with the wet/dry treatment at ages of 60 days (point A),
162 days (point B) and 222 days (point C) are presented in Figs. 3, 4 and 5, respectively. As seen
in Fig. 3~ at the age of 60 days (before the wet/dry treatment), the entrained air voids are quite clean.
The elemental scan for chemical components of the same concrete sample is shown in Fig. 3 b. The
distribution of sulfute ions is basically uniform within the cementitious matrix. On the other hand, at
the ages of 162 and 222 days, the SEM photomicrographs (Figs. 4a and Sa) indicate that the
6

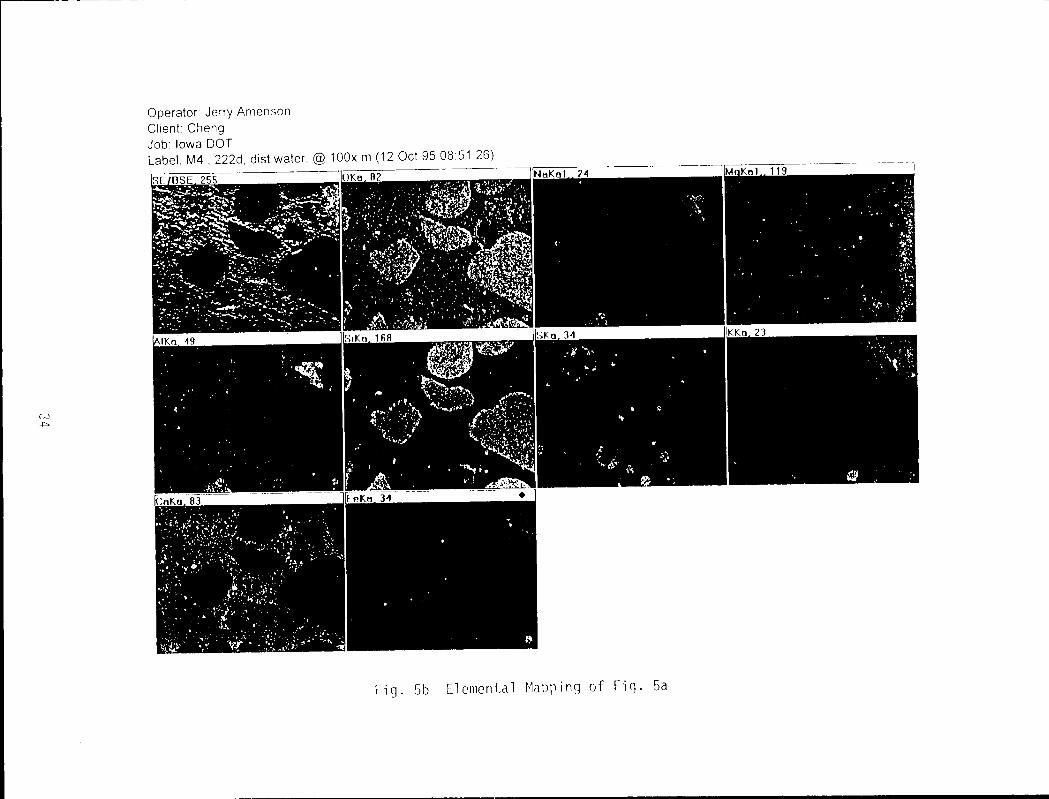
entrained air voids are panially filled by some materials after the wet/dry treatment. The elemental
scans shown in Figs. 4b and Sb indicate this infilling material is sulfate-rich, and accompanied by some
alumina and calcium. This implies that the infilling material may be calcium sulfoaluminate
compound. For easier discussion, this sulfate-rich infilling material will be regarded as ettringite
hereafter. Although it is found that ettringite is more concentrated in the air voids~ the expansion of
the specimens with the wet/dry treatment is negligible until the beginning of the freeze-thaw cycling
as shown in Fig. 2. Although some cracks are observed in Figs. 3a~ 4a and Sa, most of these cracks
pass through the interface between aggregates and the cementitious matrix. This suggests that they
may primarily result from drying shrinkage and from the preparation of the sample, instead of
expansion which usually generates three radiating cracks with approximately 120° apan'131. No
evidence of sulfate attack was noticed up to the age of 222 days. Similar results were observed for
other mixes.
3."> Freeze-Thaw Response of Specimens With the Wet/Dry Treatment
The freeze-thaw response of specimens subjected to the wet/dry treatment is discussed
in this section. The 1 3/4" x 3 1/2" cores were drilled from the 4" x 4" x 18" beams which were
stored in 100% humidity moist room until an age of S9 days. The obtained cores were cured in
laboratory tap water until the age of 102 days. All these cores were then subjected to the wet/dry
treatment. After the treatment, these cores were stored in distilled water, and exposed to the freeze
thaw cycling at the age of 110, 162 and 222 days, respectively.
The freeze-thaw expansion ofMi.xes 1 and 4 is shown in Fig. 6. As indicated in
Table 3. both mixes used Cement A. No fly ash was used in Mix 1, whereas 15% of the cement (by
7

weight) was replaced by the fly ash in Mix 4. MLx I has the air content of 5.2% and the spacing
factor of0.297 mm (see Table 4 ), whereas MLx 4 has the air content of 3.2% and the spacing factor
of0.318 mm. Unless specified, the air parameter measured by the Research Laboratory of Lafarge
will be used hereafter in this report. As shown in Fig. 6, the specimens from the -same mLx subjected
to the freeze-thaw cycling from the age of 222 days showed much greater expansion compared to
those subjected to the cycling from the age of 110 days. On the other hand, at the same curing age
Mix 4 has much greater freeze-thaw expansion than Mix 1. More discussion on the possible
mechanisms will be included later.
Similar results were observed for MLxes 3 and 6, which are shown in Fig. 1-1 (see
AppendLx I).
The freeze-thaw expansion of Mixes 2 and 5 is shown in Fig. 7. These two mixes used
Cement B. For Mix 2 without the fly ash, the specimens subjected to different ages of moist curing
prior to the freeze-thaw cycling have almost identical values of expansion. For Mix 5, the specimens
exposed to 162-day moist curing have slightly lower expansion than those subjected to 110-day and
222-day moist curing, respectively. On the other hand, Mix 5 with the fly ash replacement generally
shows slightly higher expansion compared to Mix 2 without the fly ash replacement. Similar
observations were obtained for Mixes 8 and 9 as given in Fig. 1-3 (see Appendix I).
The.results presented in this section indicate that the freeze-thaw response of mixes
using ordinary portland cements (Types I and II) may be divided into two groups. Group 1 includes
Mixes 1, 3, 4 and 6. These mixes show greater expansion for longer period of the moist curllig prior
to the freeze-thaw cycling and when the replacement of 15% cement by the fly ash. Group 2 includes
Mixes 2, 5, 8 and 9. When the period of moist curing was changed and when 15% cement was
8

replaced by the fly ash. no significant difference in the expansion was observe~ for this group.
Potential mechanisms corresponding to these two groups will be discussed later.
The expansion of Mix 7~ which used Cement D (Type IP), is presented in Fig. I-1 (see
Appendix I). It is seen again that the longer period -of moist curing prior to the ·start of the cycling,
the greater the expansion. Although the spacing factor is 0.16 mm, 3.6% of the air content (measured
by the Research Laboratory of Ash Grove Cement Company) may be somewhat responsible for
relatively large expansion for this mix.
3 .3 Freeze-Thaw Response of Specimens Without the Wet/Dry Treatment
The freeze-thaw response of specimens which were not subjected to the wet/dry
treatment is discussed in this section. Two 4" x 4" x 18" beams for each mix were continuously
stored in I 00% humidity moist room. The beams were taken from the moist room at the age of
162 days~ and a dike was placed on the top surface of each beam. Then, for each mix one beam was
exposed to continuous distilled water on the top surface, whereas the other was exposed to a
continuous 5% salt water. Cores were taken from these beams~ and subjected ~o the freeze-thaw
cycling at the age of 222 days. As afore-mentioned~ these cores probably have lower degree of
saturation than those subjected to the wet/dry treatment. This may partially explain why the former
has lo\ver freeze-thaw expansion compared to the latter.
The expansion of Mixes l and 4 without wet/dry treatment is presented in Fig. 8. Mix
4 with the fly ash replacement shows much greater expansion after approximately 500 cycles. The
specimens exposed to the distilled water have slightly more expansion than those exposed to the 5%
salt water. No significant difference was observed on the expansion values at 300 cycles for these
specimens.
9

The results for Mixes 2 and 5 are sho\.\'Il in Fig. 9. These two mixes have much lower
expansion than Mixes 1 and 4. The test results of the other mixes are presented in Appendix II. For
these mixes. no greater difference in the expansion was observed, when 15% cement was replaced
by the fly ash.
4. DISCUSSION
4.1 Effect of Ettringite Infilling
To further demonstrate the influence of Class C fly ash replacement and the wet/dry
treatment on the freeze-thaw resistance of concrete, the results of Mixes 3 and 6 are presented in
Fig. 10. The age of the specimens prior to the freeze-thaw cycling is 222 days. It is seen from
Table 4, the two mixes have the same value of the spacing factor. where Mixes 3 and 6 have the air
contents of 5.8% and 4.0%, respectively. The solid lines represent the results of Mix 3, whereas the
dashed lines are for Mix 6 \vith 15% replacement of the fly ash. Note that Mix 6 shows greater
expansion than Mix 3. This fact further confirms that the 15% replacement of cement by some
Class C fly ash may reduce the freeze-thaw resistance of concrete after long period of moist curing.
On the other hand. the specimens subjected to the wet/dry treatment show much greater freeze-thaw
expansion than those without the treatment. This difference due to the wet/dry treatment is partially
accounted for by the fact that the former has higher degree of saturation than the latter.
The SEM photomicrographs taken immediately prior to the start of the freeze-thaw
may provide some hints to better understand the freeze-thaw response observed in Fig. 10. These
photomicrographs are presented in Figs. 11, 12, 13, and 14 for Mix 3 without the wet/dry treatment,
Mix 3 with the treatment. Mix 6 without the treatment and Mix 6 with the treatment, respectively.
10

Mix 3 without the treatment has the lowest expansion. Its entrained air system is quite clean (see
Fig. 1 la) and the distribution of sulfate is basically uniform (see Fig. 1 lb). Since sulfate is a major
component of ettringite, the distribution of the sulfate component is thought to be related to the
distribution of enringite. Mix 3 with the treatment has the second lowest expansion. Minor infilling
is found in its air voids (see Fig. 12a)~ and some concentration of sulfate component in the air voids
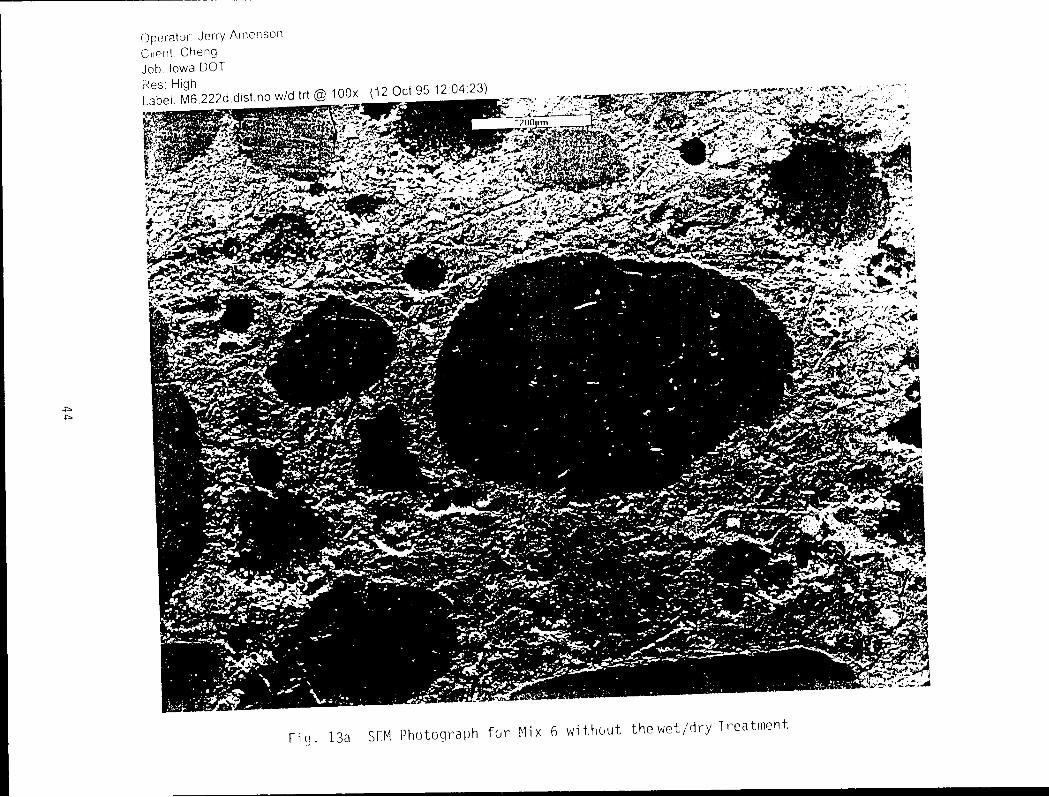
is also observed (see Fig. 12b). Mix 6 without the treatment has the second highest expansion. The
corresponding SEM photomicrograph (see Fig. 13a) shows that its air void system is partially filled.
However, the elemental scan (see Fig. 13b) indicates that the infilling material is not sulfate-rich. Mix
6 \\-ith the treatment has the highest expansion. The SEM photomicrograph (Fig. 14a) indicates that
most of its air voids have been filled by the sulfate-rich material (see Fig. 14b).
The above results seem to indicate that the freeze-thaw response of concrete is
somewhat related to the extent of infilling of entrained air voids. For the same period of the moist
curing. the extent of infilling depends on whether or not some amount of cement is replaced by
Class C fly ash. as well as on whether or not the wet/dry treatment is applied. The wet/dry treatment
accelerates the infilling of ettringite in entrained air voids. That might result in greater freeze-thaw
expansion for some concretes. Possible mechanisms to explain the above observed freeze-thaw
response are discussed in the following.
4.2 Possible Mechanisms for Change of Freeze-Thaw Response ·
As afore-mentioned, the freeze-thaw response of mixes using ordinary ponland
cements (Types I and II) may be divided into Groups 1 and 2. Group 1 includes Mixes 1, 3, 4 and
6~ which are underlined in Table 4. These mixes show greater expansion for longer period of the
11

moist curing prior to the stan of the freeze-thaw cycling and when the replacement of 15% cement
by the fly ash. Group 2 includes Mixes 2, 5, 8 and 9. For Group 2, no significant difference in the
expansion was obser\'ed when the period of the moist curing was changed.
Two possible mechanisms are proposed here to explain the above observation. First,
as indicated by Skalny61 and Matherl 14l, ettringite normally re-deposits in entrained air voids through
moisture migration. The infilling of ettringite in some air voids implies that these voids are somewhat
water-accessible. Since only dry air voids can fully function to protect concrete from freeze-thaw
attack, effectiveness of these water-accessible air voids might be already compromised before filled
by ettringite.
Secondly, the infilling may increase the effective spacing factor. Since small air voids
are usually first filled by ettringite, the infilling may has more significant effect on the spacing factor
compared to the air content. When the spacing factor is smaller for a concrete, the increase may have
negligible effect on its freeze-thaw durability. However, if a concrete has greater spacing factor, the
increase may reduce its freeze-thaw resistance. Th~t is evident by values of the spacing factor listed
in Table 4. The mixes in Group 1 generally have greater values of the spacing factor than those mixes
in Group 2 (except values of Mixes 3 and 6 measured by the Research Laboratory of Ash Grove
Cement Company). The change of the freeze-thaw expansion at 300 cycles is plotted against the
spacing factor in Fig. 15. The change of expansion is difference between the expansion of specimen
with 222-day moist curing and that of specimen with 110-day mo"ist curing. Since Mix 4 after
222-day moist curing failed far before 300 cycles (see Fig. 6), its expansion at 300 cycles is not
available. This change increases with increasing of the spacing factor, which corresponds to more
infilling. This fact indicates that a concrete with the smaller spacing factor will have less change in
the freeze-thaw expansion, and may tolerate more infilling.
12

4.3 Effect of Cement Chemistrv on Spacing Factor
The spacing factor is plotted against potassium alkali (K20) in cement in Fig. 16.
When K20 is up to approximately 0.55% in cement, the values of the spacing. factor are almost
constant. The spacing factors are much greater for Mixes I and 4 which used Cement A with K20
= 1.17%. Between K20 = 0.5 5% and 1.17%, a linear relationship for the spacing factor and K20 in
cement is assumed for simplicity.
ACI Committee 20 I proposed that the spacing factor should not exceed 0.2 mm for
freeze-thaw durable concretes1151• This requirement is also plotted in Fig. 16. This requirement leads
to that K~O in cement should not exceed 0.66%. This indicates that the requirement o~K 0 in
cement ~ 0.6% for pa,·ements by Iowa Department of Transportation is possibly suitable for the
freeze-thaw durability.
The spacing factor is plotted against sulfur trioxide (S03) in cement in Fig. 17. A trend
similar to the effect of K~O is observed. It is seen from the figure that the ACI requirement results
in that S03 in cement should not exceed 3.06%. This indicates that the requirement of S03 in cement
~ 3.0% for pavements by Iowa Department of Transportation is possibly also suitable for the freeze
thaw durability.
It is noted that the above discussion is relied on the experimental result used Cement
A, which are high in both K20 and SQ; (see Table 1 ). Although influences of J<. 0 and ~O in
cements on the spacing factors have been separately discussed above, the effects of two components
are actually coupled in the experimental data. It is difficult to completely separate influences ofK20
and S03 in cements on the spacing factor based on the available results. From the practical purpose,
13

one may establish separate limits on these two components in cements. These have been recently
properly proposed by Iowa Department of Transportation.
5. SUMMARY
The following conclusions can be reached based on this laboratory study.
(I) No significant expansion was recorded from the second day after casting until the
start of the freeze-thaw cycling (up to 222-day of the moist curing) for all the concretes tested. The
major cause of distress in these nine concretes is freeze-thaw damage after long period of the moist
curing.
(2) Entrained air system is critical for the freeze-thaw durability of the concretes tested.
Many air voids in concretes are filled by sulfate-rich component which may be ettringite. The
infilling implies that these filled air voids are water-accessible. That may comprise effectiveness of
these air voids to protect concrete from freeze-thaw attack. The infilling also increases the effective
spacing factor in concrete. These may lead to concrete more vulnerable to freeze-thaw attack.
(3) Concretes with 15% Class C fly ash replacement usually show more infilling of
ettringite in their entrained air voids~ and have greater freeze-thaw expansion compared to similar
mixes without the fly ash. The effect of fly ash is greater in some concretes than in others.
( 4) More infilling ettringite is generally found in the air voids when the specimens were
subjected to the wet/dry treatment and to the extended moist curing. ·A longer period of moist curing
normally leads to lower freeze-thaw resistance for the concretes.
( 5) The change of the concrete freeze-thaw response after different periods of the
moist curing relates to the spacing factor in the concretes. The greater values of the spacing factor,
the more change of the freeze-thaw response.
14

( 6) The amount of ettringite in a concrete depends on amounts of sulfate ions and
calcium aluminate which are available in mixture. Theses two components come from cement and
fly ash used (other external sources are also possible). A further study to quantitatively detennine
the amount of the infiHing ettringite in concrete is. :peeded so that the extent of the infilling might be
correlated to chemical compositions of the cement and fly ash used.
(7) By combining the above results with field observations discussed below, one can
conclude that the freeze-thaw damage is a factor related to premature deterioration of PCC
pavements in Iowa.
(8) Since the freeze-thaw damage is related to the infilling of ettringite in entrained air
voids. the similar freeze-thaw test should be conducted to determine the extent of the infilling for
diffeient combinations of materials used in Iowa pavements. This will be done in Phase II study.
6. SOME FIELD EVIDENCE
Some field evidence from deteriorated pavements in Iowa is discussed in this section.
This evidence may provide some correlation between the afore-discussed laboratory study and field
performance of PCC pavements.
( 1) By using a ]ow-vacuum scanning electron microscope, Schlorholtz and Amenson151
recently examined cores taken from several PCC pavements in Iowa. Their results are briefly
swnmarized in Table 4. Among six pavements with moderate or high distress, they reported that the
freeze-thaw damage is the major failure mechanism for five of them (two pavements, US 169 and
IA 25. are due to the use of freeze-thaw sensitive coarse aggregate). For Bettendorf Fast-Track
using Type III cement. evidence associated with freeze-thaw, alkali-silica reaction and sulfate attack
15

were observed. They also obsen·ed the infilling of entrained air voids by sulfate-rich component for
these deteriorated pavements.
(2) The result of a field survey for the evaluation of deterioration of US 20 in Webster
County116l is presented in Table 5. The pavement sections using cements from Lehigh Cement
Company (Mixes 1 and 3, these are different with Mixes 1 and 3 listed in Table 3) shows severe
deterioration'1"l. As indicated in Table 4, the deterioration of this pavement section was identified as
the freeze-thaw damage by ScWorholtz and Amenson1s1. This field observation coincides with the
results obtained this laboratory study which indicates that the concretes used the cement with high
potassium alkali content have lower the spacing factor and is potential vulnerable to the freeze-thaw
failure attack.
(3) Field observations indicate that deterioration is usually more severe in observable
vibrator trails and along transverse joints for PCC pavements. This can be reasonably explained by
the freeze-thaw mechanism. Concrete in the vibrator paths is sometimes over-vibrated. This results
in low entrained air content, which has been reponed in some Iowa pavements. and leads to the
concrete being more vulnerable to the freeze-thaw attack. On the other hand, more moisture is
usually present in the area next to a transverse joint. This results in the concrete more quickly
reaching a higher degree of saturation which is critical for the freeze-thaw damage.
(4) The examination of field PCC pavement cores reveals both vertical and horizontal
cracks121151. Past experience and a recent stucffl have shown that horizontal cracks are usually
associated with the freeze-thaw damage.
(5) Past field experience indicates that the use of deicing salt may accelerates the rate
of pavement deterioration. This can also be accounted for by the freeze-thaw damage. The use of
16

salt can reduce the vapor pressure of the salt saturated pore liquid. This means that pores dry slowly
or do not dl)' out at all'61 • As a result, concrete may more easily reach a higher degree of saturation
and lead to the freeze-thaw damage.
(6) Examinations of cores from Highways 14 and 34, which are durable for 45 and
67 years, respectively, indicate no concentration of ettringite in large voids of the concretes (no air
entrainment was used in these two PCC pavements). On the other hand, although cores from some
other pavements, such as 1-80 Mitchellville rest area (with fly ash, placed in 1987), US 20 at Farley
(with fly ash, placed in 1988), US 20 at Dyersville (no fly ash, placed in 1988), and the section of
Mix 2 in Table 5 (US 20 in Westber County) show some infilling of ettringite in entrained air voids,
no premature deterioration has been found in these pavements this date. This implies there may be
a threshold value of the effective entrained air content. A concrete may be freeze-thaw durable if its
effective air content is greater than this threshold value. More quantitative study will be conducted
to verify this in the Phase 2 study.
Acknowledgements
The authors appreciate the input ofB. C. Brown, C. Narotam, J. Bergren, V. Marks,
J. Grove, T. Hansen and W. Dubberke from Iowa DOT. The discussion from members oflowa DOT
Materials Quality Task Group are acknowledged. A special thank to Jerry Arnenson oflowa State
University for taking SEM photography. Thanks are also due to Robert Suderman of LaFarge,
Canada, Inc. and Greg Barger of Ash Grove Cement Company for their help on the linear traverse
measurements of air parameters.
17

References
Stark, D .. "Investigation of Pavement Cracking in US 20 and I-35, Central ·1owa," Construction Technology Laboratories, Inc., Skokie, September 1992.
2. Marks, V. J., and Dubberke, W. G., "A Different Perspective for Investigation of PCC Pavement Deterioration," Paper No. 960414, 75th Annual Meeting, Transportation Research Board, Washington, D. C., January 7-11, 1996.
3. Mindess, S., and Young, J. F., CONCRETE, Prentice-Hall, Inc., Englewood Cliffs, H.J. 07632, 1982.
4. Marchand, J., Sellevold, E.J., and Pigeon, M., "The Deicer Salt Scaling Deterioration of Concrete--an Oveniew," Durability of Concrete, Edited by Malhotra, V.M., ACI SP-145, American Concrete Institute. Detroit, 1994, pp.1-46.
5. Schlorholtz, S., and Amenson, J., "Evaluation of Microcracking and Chemical Deterioration in Concrete Pavements," Final Report, Iowa DOT Project HR-358, Engineering Research Institute, Iowa State University, October, 1995.
6. Skalny, J.P., ''Evaluation of Concrete Cores: a Report to Wisconsin Department of Transportation," Portland Cement Association, November 14, 1994.
7. Fu. Y .. Grattan-Bellew, P.E., and Beaudoin, J.J., "Cracking in Concrete Due to Delayed Ettringite Formation," 15th Annual Meeting, Transportation Research Board, Washington, D.C.,
8. Mehta, P.K., "Pozzolanic and Cementitious By-Products as Mineral Admixtures for Concrete--a Critical Re,·iew," The Use of Fly Ash, Silica Fume, Slag and Other Mineral By-Products in Concrete, Edited by Malhotra, V.m>, ACI SP-79, American Concrete Institute, Detroit, 1983, pp. 1-47.
9. Carrasquillo, P., "Durability of Concrete Containing Fly Ash for Use in Highway Applications," Concrete Durability, Edited by Scanlon, J.M., ACI SP-100, American Concret Institute, Detroit, 1987, pp.843-861.
10. Gehler, S.H., and Klieger, P., "Effect of Fly Ash on the Durability of Air-Entrained Concrete," Fly Ash, Silica Fume, Slag, and Natural Pozzolans in Concrete, Edited by Malhotra, V.M., ACI-SP 91, American Concrete Institute, Detroit, 1987, pp.483-519.
11. Nasser, K.W., and Lai, P.S.H., "Resistance of Fly ·Ash Concrete to Freezing and Thawing," Fly Ash, Silica Fume, Slag, and Natural Pozzolans in Concrete, Edited by Malhotr~ V.M., ACI SP-132, American Concrete Institute, Detroit, 1993, pp.205-226.
18
11. Grabowski, B., Czarnecki, B., Gillott, J.E., Duggan, C.R. and Scott, J.F., "Rapid Test of concrete Expanshity Due to Internal Sulfate Attach,'' ACI Materials Journal, Vol. 89, No. 4, 1992~ pp.469-385.
13. Johansen, V., ThaulO\v, N., and Skalny, J., "Chemical Degradation of Concrete." Paper No. 56, 74th Annual Meeting Transportation Research Board, Washington, D.C., January 22-28, 1995.
14. Mather, B., Private Communication, December 1996.
15. ACI Committee 201, Guide to Durable Concrete (ACI 201.2R-92). American Concrete Institute, Detroit, Michigan, 1992.
16. Jones. K. And Putherickal, J., "Evaluation of Deterioration on US 20 in Webster County,'' Final Report, Iowa DOT Project MLR-91-1, 1991.
17. Bakharev, T .. and Struble, L., "Microstructural Features ofFr_eeze-Thaw Deterioration of Concrete/' Microstructure of Cement-Based Systems/Bonding and Interfaces in Cementitious Materials. Edited by Diamond, S. et al., Materials Research Society Symposium Proceedings, Vol. 3 70, 1994, pp. 83-88.
19

TABLE TITLES
1. Chemical Properties of Cements Used
2. Chemical Properties of the Fly Ash Used
3. List of Mixes for Testing
4. Measured Entrained Air Parameters in Hardened Concretes (Linear Traverse method,
ASTM C457)
5. Summary of Observation of Cores from PCC Pavements
6. Condition of Some US 20 Pavement Sections in Webster County (Based on 1996 Survey)
20

N .......
.Cement sources
Dixon-Marquette
Lafarge
Ash Grove (Type II)
Ash Grove (Type IP)
Kaiser, California
Table I Chemical Properties of Cements Used
C:A(%) so., MgO Na:P Al,O, Fe20.1 Si02 Cao K20 (%) (%) (%) (%) (%) (%) (%) (%)
7.55 3.67 3.85 0.08 4.71 3.34 19.54 61.73 1.17
8.55 2.93 2.97 0.17 4.60 2.66 21.05 63.67 0.55
6.73 2.46 3.50 0.15 4.28 3.31 21.64 62.90 0.54
- 2.63 3.13 0.13 9.84 3.20 26.16 51.68 0.51
5.59 2.56 1.41 0.30 3.84 3.87 20.92 65.02 0.28
Table 2 Chemical Properties of Fly Ash (Ottumwa) Used
Si02 Al~O, Fe20 2 S03 Cao MgO Available Equiv. Na,O
32.3 17.1 5.4 4.5 28.3 6.2 1.35

Table 3 List of Mixes for Testing
Test No. Cement Fly Ash Plastic Air Slump Mix No. Sources (%) Content(%) (in.)
1 Dixon- 0 6.0 2.5 C-3 Marquette
2 Lafarge 0 6.0 2.0 C-3
3 Ash Grove 0 6.8 2.5 C-3 (Type II)
4 Dixon- 15 5.6 2.25 C-3-C Marquette
5 Lafanze 15 5.8 2.0 C-3-C
6 Ash Grove 15 6.8 2.5 C-3-C (Type II)
7 Ash Grove 0 5.0 1.75 C-3 (Type IP)
8 Kaiser, 0 6.5 2.25 C-3 California
9 Kaiser, 15 6.2 2.0 C-3-C California
22

Test No.
l
2 .., .:2.
:1
5
Q
7
8
9
Table 4 Measured Entrained Air Parameters in Hardened Concretes1
(Linear Traverse Method, ASTM C457)
Larfage, Canada Ash Grove
Cements Air content Spacing Air content - ·spacing (%) factor (mm) (%) factor (mm)
A 5.2 0.297 5.2 0.229
B 4.8 0.179 5.1 0.124
c 5.8 0.198 5.9 0.114
A 3.2 0.318 5.5 0.206
B 5.9 0.129 5.1 0.112
c 4.0 0.198 5.1 ~
D 5.1 0.205 3.6 0.157 (Type IP)
E 4.2 0.171 5.7 0.137
E 5.1 0.195 - -
1. Samples of the age of222 days, without the wet/dry treatment, were used for determining entrained air parameters in hardened concretes. Some of smaller voids were filled by ettringite in these samples. Only empty and partially filled (by ettringite) voids were counted in the measurement.
23

Pavements
US 20, East Bound Webster County,
F-520-3( 12)--20-94
1-35, North Bound, Story County,
IR-35-5(40) 121
US 169, Madison County, FN-169-3( 18)--21-6
IA 25, Ringgold County, F-451(9)
1-80, East Bound, Dallas County,
IR-80-3(57)106
Bettendorf Fast-Track, Scott County, (Used a
Type III Cement)
Table 5 Summary of Observation of Cores from PCC Pavements• (Schlorholtz and Amenson' 5
')
Year of Use of Infilling of IEttringite Observed Paving Fly Ash Distress
Many air voids, especially 1987 Yes voids smaller than I 00 µm, High
filled with ettringite
Many air voicl!s, especially 1985 Yes voids smaller than 100 µm, High
filled with ettringite
1977 No Many small air voids filled High with ett ringite
1964 No Many small air voids filled High with etuingite
Some small air voids filled 1989 Yes with ettringite Moderate
Ettringite fills all small voids 1987 Yes and some gap between Moderate
a.ui?regate and cement paste
Major Causes for Distress
Freeze-thaw.
Freeze-thaw.
Freeze-thaw of coarse aggregate.
Freeze-thaw of coarse aggregate.
ASR, poor mixing and over-vibration. Difficult to
identify the major cause.
Freeze-thaw, ASR and sulfate attack. Difficult to identify the major cause.
• Schlorholtz and Amenson also examined cores taken from three other PCC pavements (IA 175, County Road Band Benton FastTrack) with low distress. These results are not discussed here.

N tn
Mix Code
I
2
3
5
6a
6
Table 6 Condition of Some US 20 Pavement Sections in Webster County (Based on 1996 Survey)
Mix Material Sources K20 in so.1 in Proportion cement cement
Cement Fly Ash Sand (%) (%)
C-3WR-C Lehigh Ottumwa Croft 1.06 3.38
C-3WR Lehigh None Croft 0.65 3.50
C-3-C Lehigh Port Neal #4 Yates 1.06 3.38
C-3WR-C Northwestern Ottumwa & Port Croft 0.32 3.14 Neal #4
C-3WR-C Northwestern Nebraska City Croft 0.32 3.14
C-JWR-C Northwestern Nebraska City & Croft 0.32 3.14 Port Neal #4
Distress
Severe
None
Severe
Minor
None
Minor to None

~.
I·
·'·
FIGURE CAPTIONS
1. Flow Chart of Test Procedure
2. The History of Length Change for Mix 4
3a. SEM Photograph for Mix 4 at the Age of60 Days Before the Wet/Dry Treatment
3b. Elemental Mapping of Figure 3a
4a. SEM Photograph for Mix 4 at the Age of 162 Days After the Wet/Dry Treatment
4b. Elemental Mapping of Figure 4a
Sa. SEM Photograph for Mix 4 at the Age of 222 Days After the Wet/Dry Treatment
Sb. Elemental Mapping of Figure Sa
6. Freeze-thaw Expansion of Mixes 1 and 4
7. Freeze-thaw Expansion of Mixes 2 and S
8. Freeze-thav·l Expansion of Mixes 1 and 4, no the Wet/Dry Treatment
9. Freeze-thaw Expansion of Mixes 2 and S, no the Wet/Dry Treatment
10. Effect of Fly Ash Replacement and the Wet/Dry Treatment on Freeze-thaw Expansion
11 a. SEM Photograph for Mix 3 Without the Wet/Dry Treatment
11 b. Elemental Mapping of Figure 11 a
12a. SEM Photograph for Mix 3 With the Wet/Dry Treatment
12b. Elemental Mapping of Figure 12a
13a. SEM Photograph for Mix 6 Without the Wet/Dry Treatment
13b. Elemental Mapping of Figure 13a
14a. SEM Photograph for Mix 6 With the Wet/Dry Treatment
14b. Elemental Mapping of Figure 14a
1 S. Relationship Between Change of Expansion and Spacing Factors
16. Relationship Between K20 in Cement and Spacing Factors
17. Relationship Between S03 in Cement and Spacing Factors
26

Age of 59 days
I
' Age of 102 days
' Age of 162 days
'
Expansion of all specimens was monitored during the whole test period
1·cast four 4" x 4" x 18"] i beams for each mix
,, Sixteen 1 3/4" x 3 112"
1.--~~-;-i~~-si_M_
1 cores and 2 beams -- ..,.. t f 60 d 1 ...____ __ ___,, ___ _,, ._a age o ays I ... ____ . ______ ----- - -· ---1·-----·-- --------·-·--i
1 beam exposed to salt water
__ J __ 1 beam exposed to distilled water
! I I
•
~--'----2 beams cured in distilled water
I - .
' 4 cores cured in salt water
15 cores for the --- ----·--·--- ... · -- ··------... -.J 3 cores for freeze-thaw··\
wet/dry treatment ~,test at age of 110 days
... -- -. ··I,. ------ ------. ·- -··· · ... -- - -·-- ·-· ...... ·- . ···--···
'l· 4 cores cured in distilled water
1 core for SEM, 3 cores for the
\ freeze-thaw test
·--··· -~-~~~-~~:~~~t--= ~ 1
1 core for SEM, , Age of 222 days 2 cores for the j
freeze-thaw test '
11 core for SEM, ,
1 2 cores for the !
' ,freeze-thaw test ·
, 1 core for SEM and 'J.
[ 3 cores for the freeze-thaw test
·~-f~~-~-~-~h.J?~!l~g~~-'!d.~ti~-~-__,.
Fig. 1 Flow chart of test procedure

--:§!.. 0 -.r:. ~
Cl c Q} -0 Q} Cl c
N C\l CX> .r:.
(..)
·1-------------------------------· -·-· --··--·--. --··--·---·--- -- ---·----- .. --·· - Mix4 · Cement A
Replacement of 15% cement by fly ash · Freeze-thaw cycling starts from the age of 222-day
0.40
0.30
I J
0.20 l I
i 0.10 J
Without the wet/dry treatment
With the wet/dry treatment
Beginning of the wet/dry treatment
8 c' 0.00 -1-----------::r-~---='--=--~~,
~ A
I , Beginning of freeze-thaw cycling
-0 .1 0 -1--. -1·--,---r-T·--r--.---,-i--i---1--1--,-·- --.-T- -, ·· --, -- -1--r----r-r-r---.---i···-1----.---i-.-r......---....--~~·
.o 50 100 150 200 250 300 . 350
Age (days)
Fig. 2 The History of Len!Jth Change for Mix 4

Operator. Jerry Amenson Client Cheng Job IOWA DOT Cheng Res High
Label: Mix 4, 60 Day, 1 OOx (1 May 95 12 56 56)
Fig. 3a SEM Photvgraph for Mix 4 at the age of 60 days before the wet/dry treatment

(_,.)
C>
Operator: Jerry Amenson Client. Cheng Job IOWA DOT Cheng Label Mix 4, 60 Day, 100x (1 May 95 1447 38)
Fig. 3b Elemental Mapping of Fig. 3a

w ,_.
Operator Jerry Amenson Client Cheng Job IOWA DOT Cheng Res High Label Mix 4, 162 Day@ 100x (21 Aug 951017:07)
f~ig. 4a SEM Photograph fur r1ix 4 at the age vf 152 days after the wet/dry Treatment

w N
Operator Jerry Amenson Client Cheng Job IOWA DOT Cheng Label Mix 4, 162 Day Map@ 100x (21 Aug 95 1049 36)
Fig. 4b Elemental 111apping uf Fig. 4a

w w
Operator Jerry /\menson Client Cheng Job Iowa DOT Res High Label: M4, 222d, dist water,@ 100x (12 Oct 95 08:27 32)
Fig. 5a SCM Phut0graph fur Mix 4 at the age 0f 222 days after thewet/dry Treatment
Operator Jerry Amenson Client Cheng Job Iowa DOT Label M4, 222d, dist water.@ 100x m (12 Oct 95 08 5126)
Fig. 5b Elemental Mapping of Fig. 5a

0.25
0.20 --
-~ 0.15 -c: .Q
CJ')
c: ro 0. x
UJ 0.10
0.05
0.00
0
I
I
*
<> I 0
+ I
I
I
/
Mix 1, no fly ash, 110-day moist curing +
.Mix 1, no fly ash, 162-day moist curing I
Mix 1, no fly ash, 222-day moist curing I
Mix 4, 15% ~y ash, 110-day moist curing
Mix 4, 15%11y ash, 162-day moist curing! I
Mix 4, 15o/J fly ash, 222-day moist cur" g :
I
*
I
Cement A
Mix 1: spacing factor = 0.297 mm Mix 4: spacing factor= 0.318 mm
-- ---,-------~--------
100 200 300 400 500 600 700
Freeze-thaw cycles
Fig. 6 Freeze-thaw expansion. of mixes 1 and 4
35

0.25 - -- ··- ----- -- ---·- -------··--·------·-·-----· ----
0.20 -
~ 0.15 0 -c: 0
"(I) c: ro a.. x w 0.10
0.05
0.00
Cement B
0
Mix 2: spacing factor= 0.179 mm Mix 5: spacing factor = 0.129 mm
0
Mix 2, no fly ash, 110-day moist curing
Mix 2, no fly ash, 162-day moist curing
Mix 2, no fly ash, 222-day moist curing
- + - Mix 5, 15% fly ash, 110-day moist curing
- ~ - Mix 5, 15% fly ash, 162-day moist curing
Mix 5, 15% fly ash, 222-day moist curing
r
..... +,, .....
-+
* ,, .....
-..... +--- -+ - -· - --0 .....
~ ¥ ,,,;_:::;b::~~-
..... .....
......
,,.
100 200 300 400 500
Freeze-thaw cycl~s
..... + .....
¥ ---~
.() -
600
Fig. 7 Freeze-thaw expansion of mixes 2 and 5
36
700

0.25 - -----------·------·-----·------- ----- -- ----- ----Cement A No the wet/dry treatment
- Curing age: 222-day
·· Mix 1: spacing factor = 0.297 mm 0.20 _ Mix 4: spacing factor= 0.318 mm
~ 0.15 ........... c 0
"(j) c ro a. x
UJ 0.10
0.05
Mix 1, no fly ash, distilled water curing
Mix 1, no fly ash, 5% salt water curing
Mix 4, 15% fly ash, distilled water curing
Mix 4, 15% fly ash, 5% salt water curing
./ -
/
/ .. .. / .....
I
I
i I
I I
I
~ ,,
0.00 . . . ---:·--------.-------- -----·-'
0 100 200 300 400 500 600
Freeze-thaw cycles .
\_
I
700
Fig. 8 Freeze-thaw expansion of mixes 1 and 4, no the weVdry treatment
37

0.25 Cement B No the wet/dry treatment Curing age: 222-day
Mix 2: spacing factor = 0.179 mm 0.20 ·- Mix 5: spacing factor= 0.129 mm
~ 0.15 0 -c 0 ·w c co a. ~ 0.10 -
0.05
0.00
0
Mix 2, no fly ash, distilled water curing
Mix 2, no fly ash, 5% salt water curing
Mix 5, 15% fly ash, distilled water curing
- A - Mix 5, 15% fly ash, 5% salt water curing
100 200 300 400 500
Freeze-thaw cycles
600 700
Fig. 9 Freeze-thaw expansion of mixes 2 and 5, no the weUdry treatment
38

0.25
0.20 -··
~ 0.15 0 -c: 0
'ii) c: ro 0.
J) 0.10 .
0.05
0.00
0
·--------·-----
Mix 6, 15% fly ash, with the wet/dry treatment ..
Mix 3, no fly ash, -with the wet/dry treatment . . ., ..
-+- Mix 6, 15% fly ash, no the wet/dry treatment /
Mix 3, no fly ash, no the wet/dry treatment I
Cement C
Mix 3: spacing factor= 0.198 mm Mix 6: spacing factor= 0.198 mm
Freeze-thaw cycling starts at the age of 222-day
100 200 300
I
I
.,. I
I
I
I
.;.,
- + -+- - + +-
400 500 600
Freeze-thaw cycles
700
Fig. 10 Effect of fly ash replacement and the wet/dry treatment on freeze-thaw expansion
39

Operator Jerry Amenson Client Cheng Job Iowa DOT Res High Label M3, 222d, dist.no w/d trt@ 100x (6 Oct 95 18 06 26)
fig. lla SEM rhotugraph fur Mix 3 without the wet/dry treatment

Operator Jerry Amenson Client Cheng Job Iowa DOT Label M3, 222d, dist. no w/d trt 1 OOx m (6 Oct 95 18 26 52)
liq. llb Elernent<:1l 1110ppinC) 0f liq. lla

Orierator Jerry Arnenson
Client Cheng Job Iowa DOT
fig. 12a SU1 Phutugraph fur Mix 3 with the wet/dry Treatment

Operator Jerry Amenson Client Cheng Job Iowa DOT Label M3, 222d, distilled water, 1 OOx m (6 Oct 95 19 16 28)
Fiq. 12b Ele111cntal Marping uf Fiq. 12a
. Jerry ;\rnenson Operator Client Cheng Job Iowa DOT
Res High d. t no w/d trt @ . M6 222d, IS , Label ·
F i fJ • 13a Photograph for SEM Mix 6 without d Treatment thewet/ ry

Operator Jerry Amenson Client Cheng Job Iowa DOT
Label: M6,222d,dist, no w/d !rt@ 1 OOx m ( 12 Oct 9~) 12 25 09)
Fig. 13b Elemental Mapping uf Fig. 13a

Operator Jerry Amenson Client Cheng Job. Iowa DOT Res High Label M6,222ci,distilled water@ 100x (12 Oct 95 13 02 12)
Fig. 14a SEM Phuto9raph for '1ix 6 with the wet/dry Treatment

Operator Jerry Amenson Client Cheng Job Iowa DOT Label: M6,222d ,dist water @ 1 OOx m ( 12 Oct 95 13 25 51)
Fig. 14b Elemental Mar1ping of Fig. 14a

c o-"'(/) ~ c: -co CJ) a. Q) x-Q) ~
...... u 00 Q) 0 C>M c: ...... co co £. ()
0.30 -----""'.
0.25 -
0.20 --
0.15
0.10
0.05 -
Change of expansion= expansion of specimens with 222-day moist curing
- expansion of specimens'with 110-day moist curing
<>
0 00 -~- -- .. --·· _.o .. . . --·---------,---;---,-. -----, ~~~---
0.10 0.15 0.20 0.25 0.30
Spacing factor (mm)
Fig. 15 Relationship between change of expan~ion and spacing factors (the spacing factor measured by Lafarge)
48

-E E -L...
0 t5 ~ C> c ·u ro 0.
Cf)
0.4 Results based on mixes with
_! * Plastic air content= 5.6-6.Bo/o * Hardened air content= 3.2-5.9%
0.3
-.. ACI requirement: . Spacing factor < 0.2 mm
0.2 -o -- - - _f} <>· -· <>
<> 0.1
0.0 - - -- -- --- .... -- . --- --- .. -· -- -----· --- ------- -----~ -------- ---------------0.66
0.2 0.4 0.6 0.8 1.0 1.2
K20 in cement (o/o)
Fig. 16 Relationship between KP in cement and spacing factors (the spacing factor measured by Lafarge)
49

-E E -L..
0 13 $ 0) c '(3 ro a.
Cl)
0.4 ---·-- - -------·· -· Results based on mixes with - * Plastic air content= 5.6-6.8% ·- * Hardened air content= 3.2-5.9%
0.3 --·
ACI requirement: Spacing factor< 0.2 mm
0.2 -· - o·- <> <>
<>
0.1
3.06 0.0 -- ... ··----- ----- -·---------~- ----~·
2.4 2.6 2.8 3.0 3.2 3.4 3.6 3.8
SQ3 in Cement (0/o)
Fig. 17 Relationship between S03 in cement and spacing factors (the spacing factor measured by Lafarge)
50

APPENDIX I
Supplemental Results on Freeze-Thaw Durability of
Concrete Mixes with the Wet/Dry Treatment
51

0.25
0.20
~ 0.15 0 -c: 0
"Ci) c m 0. x w 0.10
0.05
0.00
I Mix 3, no fly ash, 110-day moist curing . --,,,
e Mix 3, no fly ash, 162-day moist curing I
Mix 3, no fly ash, 222-day moist cu~ing I
-+- Mix 6, 15% fly ash, 110-day moist curing I ? - .
-~ Mix 6, 15% fly ash, 162-day moist curing I
I I
- - - Mix 6, 15% fly ash, 222-day moist curing I I
:;.: -- Mix 3: spacing factor = O. 198 mm
Mix 6: spacing factor= 0.198 mm I'
,, ,, I
I I
I I /:>
I ~
I I
; I
? -+
Cement C ~--.--- ---- -- . - ~-: -;-·; .. -·: ----- - ...
0 100 200 300 400 500 600
Freeze-thaw cycles
Fig. 1-1 Freeze-thaw expansion of mixes 3 and 6
52
p. I
I
700

0.25 - ---- -------- --
0.20 -
~ 0.15 0 ........ c 0
"ii) c ro 0. x ... n1n
y,.J W • I 'ffJ
0.05
0.00
0 100
0
Cement D (Type IP)
Spacing factor = 0.205 mm
Mix 7, no fly ash, 110-day moist curing
Mix 7, no fly ash, 162-day moist curing
Mix 7, no fly ash, 222-day moist curing
; "'l' •• ·•·. ··- -·--: •• ·-T -:···· • ··---:---·
200 300 400 500 600
Freeze-thaw cycles
Fig. 1-2 Freeze-thaw expansion of mix 7
53
700

-';:f!?. 0 -c: 0 ·c;; c: ro a. x w
0 .25 .... ··- --------------
0 20 . J .
0.15
0.10
0.05
0.00
0
------------, Cement E
0
-+--~
Mix 8, no fly ash, 110-day moist curing
Mix 8, no fly ash, 162-day moist curing
Mix 8, no fly ash, 222-day moist curing
Mix 9, 15% fly ash, 110-day moist curing
Mix 9, 15% fly ash, 162-day moist curing
- - - Mix 9, 15% fly ash, 22~-day moist curing
Mix 8: spacing factor= 0.171 mm Mix 9: spacing factor= 0.195 mm
....
.... ¥ /
/ ,,.+
-·
+ /. !
• • • • •• 0 •I" " ·-I - • •• ••• •
-~----- ; -; - - !- ~---,---- T -j ·-· -~--;- .. ·; ... ~ -.- ~ - ;
100 200 300 400 500 600 700
Freeze-thaw cycles.
Fig. 1-3 Freeze-thaw expansion of mixes 8 and 9
54

APPENDIX II
Supplemental Results on Freeze-Thaw Durability of
Concrete Mixes without the Wet/Dry Treatment
55

-~ 0 -c: 0
"Ci)
0.25 - .... -·- ·- -·---·-· -- --- -------
0.20 ·-
-·
--
0.15
Cement C No the wet/dry treatment Curing age: 222-day
Mix 3, no fly ash, distilled water curing
• Mix 3, no fly ash, 5% salt water curing
- - - Mix 6, 15% fly ash, distilled water curing -· Mix 6, 15% fly ash, 5% salt water curing
Mix 3: spacing factor = 0.198 mm Mix 6: spacing factor = 0.198 mm
c ro a. x w 0.10
0.05 -.---;..----._ - Jc"
~-
0.00 - - -··-~ ------.-----;--;--;;·--,.----··-;·-~--,-:--0----:-·--,-,--r-i
0 100 200 300 400 500 600 700
Freeze-thaw cycles
Fig. 11-1 Freeze-thaw expansion of mixes 3 and 6, no the weVdry treatment
56

0.25 . -·-· --·--·. -- ----------------.--- Mix 7, no fly ash, distilled water curing
Mix 7, no fly ash, 5% salt water curing
0.20 Cement D (Type IP) .. No the wet/dry treatment _ Curing age: 222-day
Spacing factor = 0.205 mm
~ 0.15 ---0 -c:: 0
'Ci) c:: ro a. Lri 0.10 .
0.05
0.00
0
- ····- - .. -··-· -:--:·---.,.·-·-··-- -·· --··: -.,.----,:~· - --------. -·---:---:
100 200 300 400 500 600 700
Freeze-thaw cycles
Fig. 11-2 Freeze-thaw expansion of mix 7, no the weUdry treatment
57

0.25 . ----- --- --- . --------·
Cement E - No the wet/dry treatment
' Curing age: 222-day
0.20 Mix 8, no fly ash, distilled water curing
• Mix 8, no fly ash, 5% salt water curing
- - ' - Mix 9, 15% fly ash, distilled water curing
·- -· Mix 9, 15% fly ash, 5% salt water curing - 0.15 :::.!:?. 0 Mix 8: spacing factor = 0.171 mm -c: Mix 9: spacing factor = 0.195 mm 0
"Ci) c: ro 0.. x
0.10 w
0.05
0.00
0 100 200 300 400 500 600 700
Freeze-thaw cycles
Fig. 11-3 Freeze-thaw expansion of mixes 8 and 9; no the weUdry treatment
58