Embed Size (px)
Citation preview
Framework for Evaluating Clustering Algorithms inDuplicate Detection∗
Oktie HassanzadehUniversity of Toronto
Fei Chiang†University of [email protected]
Hyun Chul LeeThoora Inc.
Renee J. MillerUniversity of Toronto
ABSTRACTThe presence of duplicate records is a major data quality concern inlarge databases. To detect duplicates, entity resolution also knownas duplication detection or record linkage is used as a part of thedata cleaning process to identify records that potentially refer tothe same real-world entity. We present the Stringer system thatprovides an evaluation framework for understanding what barriersremain towards the goal of truly scalable and general purpose du-plication detection algorithms. In this paper, we use Stringer toevaluate the quality of the clusters (groups of potential duplicates)obtained from several unconstrained clustering algorithms used inconcert with scalable approximate join techniques. Our work ismotivated by the recent significant advancements that have madeapproximate join algorithms highly scalable. Our extensive evalu-ation reveals that some clustering algorithms that have never beenconsidered for duplicate detection, perform extremely well in termsof both accuracy and scalability.
1. INTRODUCTIONThe presence of duplicates is a major concern for data qual-
ity in large databases. To detect duplicates, entity resolution alsoknown as duplication detection or record linkage, is used to iden-tify records that potentially refer to the same entity. Despite thelarge, and growing, number of duplicate detection techniques, theresearch literature comparing their quality is surprisingly sparse.There are studies and surveys comparing the similarity measuresused within these techniques [16, 29, 31]. However, to the best ofour knowledge there are no comprehensive empirical studies thatevaluate the quality of the grouping or clustering employed by thesetechniques. This is the case, despite the large number and variety ofclustering techniques that have been proposed for duplicate detec-tion within the Information Retrieval, Data Management, Theory,and Machine Learning communities. These clustering algorithmsare quite diverse in terms of their properties, their complexity, andtheir scalability. This diversity cries out for a study comparing theeffectiveness of the different clustering approaches for the duplicate∗Supported in part by NSERC.†Supported in part by the Walter C. Sumner Foundation.
Permission to copy without fee all or part of this material is granted providedthat the copies are not made or distributed for direct commercial advantage,the VLDB copyright notice and the title of the publication and its date appear,and notice is given that copying is by permission of the Very Large DataBase Endowment. To copy otherwise, or to republish, to post on serversor to redistribute to lists, requires a fee and/or special permission from thepublisher, ACM.VLDB ‘09, August 24-28, 2009, Lyon, FranceCopyright 2009 VLDB Endowment, ACM 000-0-00000-000-0/00/00.
detection task. In this paper, we present a thorough experimentalcomparison of clustering approaches from all these areas.
Our work is motivated by the recent exciting advancements thathave made approximate join algorithms highly scalable [3, 7, 15,41, 43]. These innovations lend hope to the idea that duplicate de-tection can be made sufficiently scalable and general purpose to beintroduced as a generic, data-independent operator within a DBMS.In this paper, we describe the Stringer system1 that provides anevaluation framework for understanding what barriers remain to-wards the goal of truly scalable and general purpose duplicationdetection algorithms. Our focus in this paper is on using Stringerto understand which clustering algorithms can be used in concertwith scalable approximate join algorithms to produce duplicate de-tection algorithms that are robust with respect to the threshold usedfor the approximate join, and various data characteristics includingthe amount and distribution of duplicates.
1.1 Stringer Duplicate Detection FrameworkIn Stringer, we are interested in scalable algorithms that do not
rely on a specific structure in the data. So while there are dupli-cate detection algorithms that can take advantage of co-citation orco-occurrence information in data such as author co-citation dataor social networks, we do not consider these specialized algorithms[8, 9].2 Our reasons are two-fold. First, such information is notalways, and in fact not often available. Hence, in considering theintegration of bibliographic databases, our techniques can matchtables on publication titles, person names, or any set of attributesabout the publications, but will not take advantage of a social net-work relationship between the authors. While such social networkinformation is common for data about people, it is less common forother types of data. Even when additional information is available,it may not be shared or may be represented differently. Therefore,in evaluating general purpose techniques, we focus on duplicationdetection algorithms that match two relations (on one or more at-tributes). Second, we believe that this study, with its strict focus ongeneral purpose techniques, will provide results that can be usedto inform empirical studies of the more specialized models that re-quire specific properties of the data.
To ensure scalability, we consider clustering approaches whichcan use as input the new state-of-the-art scalable approximate jointechniques to find similar items. The input to the clustering is theoutput of the approximate join which can be modeled as a similar-ity graph G(U, V ), where a node u ∈ U in the graph representsa record in the data and an edge (u, v) ∈ V exists only if the tworecords are deemed similar. In these join techniques, two records
1http://dblab.cs.toronto.edu/project/stringer/2These techniques are sometimes called relational, but we avoidthis term due to the obvious confusion with the relational model.
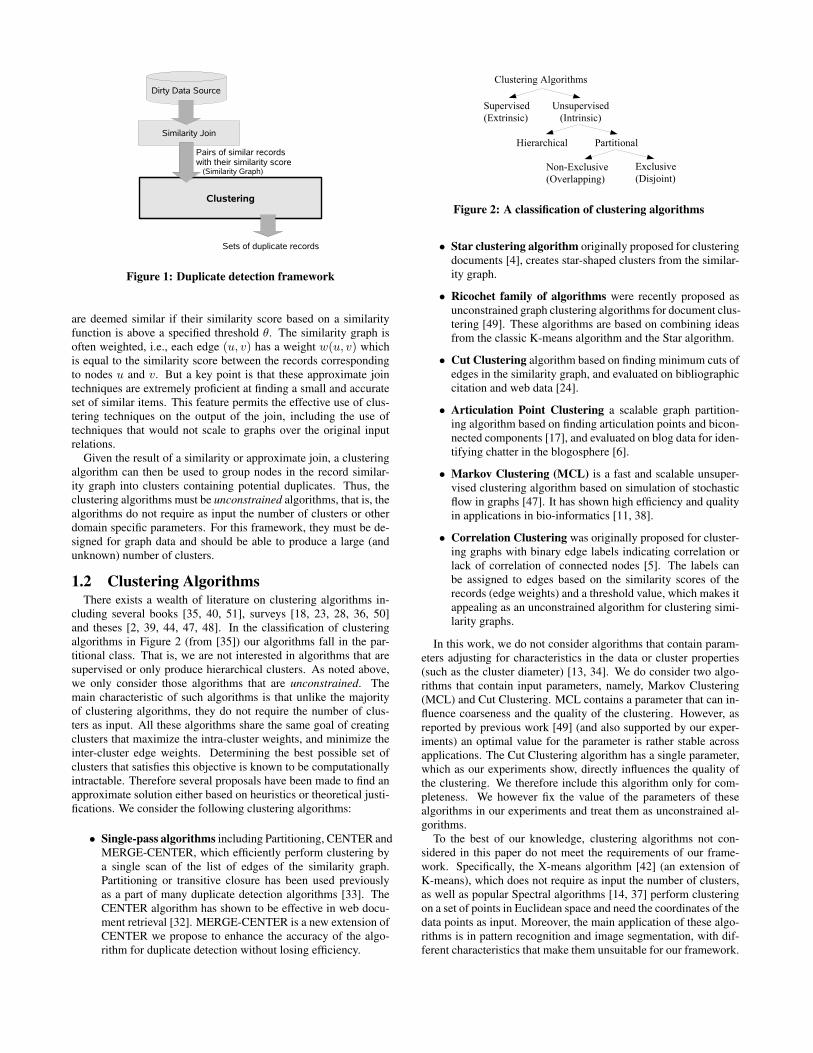
Figure 1: Duplicate detection framework
are deemed similar if their similarity score based on a similarityfunction is above a specified threshold θ. The similarity graph isoften weighted, i.e., each edge (u, v) has a weight w(u, v) whichis equal to the similarity score between the records correspondingto nodes u and v. But a key point is that these approximate jointechniques are extremely proficient at finding a small and accurateset of similar items. This feature permits the effective use of clus-tering techniques on the output of the join, including the use oftechniques that would not scale to graphs over the original inputrelations.
Given the result of a similarity or approximate join, a clusteringalgorithm can then be used to group nodes in the record similar-ity graph into clusters containing potential duplicates. Thus, theclustering algorithms must be unconstrained algorithms, that is, thealgorithms do not require as input the number of clusters or otherdomain specific parameters. For this framework, they must be de-signed for graph data and should be able to produce a large (andunknown) number of clusters.
1.2 Clustering AlgorithmsThere exists a wealth of literature on clustering algorithms in-
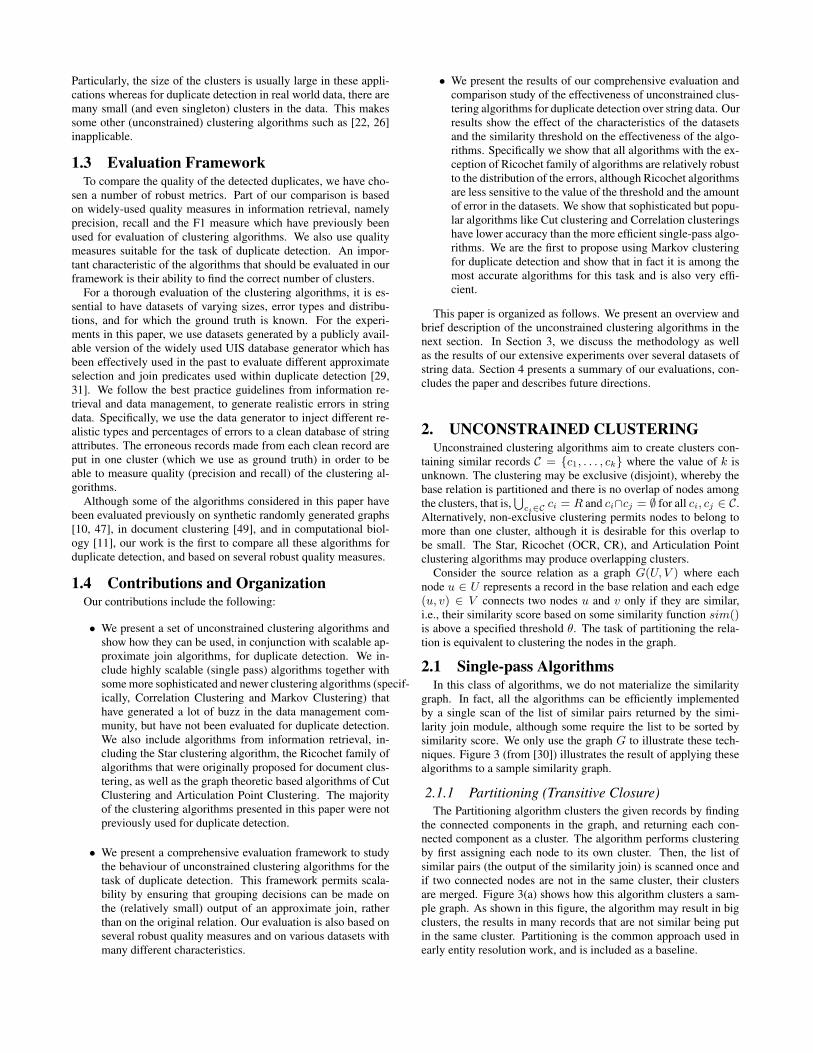
cluding several books [35, 40, 51], surveys [18, 23, 28, 36, 50]and theses [2, 39, 44, 47, 48]. In the classification of clusteringalgorithms in Figure 2 (from [35]) our algorithms fall in the par-titional class. That is, we are not interested in algorithms that aresupervised or only produce hierarchical clusters. As noted above,we only consider those algorithms that are unconstrained. Themain characteristic of such algorithms is that unlike the majorityof clustering algorithms, they do not require the number of clus-ters as input. All these algorithms share the same goal of creatingclusters that maximize the intra-cluster weights, and minimize theinter-cluster edge weights. Determining the best possible set ofclusters that satisfies this objective is known to be computationallyintractable. Therefore several proposals have been made to find anapproximate solution either based on heuristics or theoretical justi-fications. We consider the following clustering algorithms:
• Single-pass algorithms including Partitioning, CENTER andMERGE-CENTER, which efficiently perform clustering bya single scan of the list of edges of the similarity graph.Partitioning or transitive closure has been used previouslyas a part of many duplicate detection algorithms [33]. TheCENTER algorithm has shown to be effective in web docu-ment retrieval [32]. MERGE-CENTER is a new extension ofCENTER we propose to enhance the accuracy of the algo-rithm for duplicate detection without losing efficiency.
Figure 2: A classification of clustering algorithms
• Star clustering algorithm originally proposed for clusteringdocuments [4], creates star-shaped clusters from the similar-ity graph.
• Ricochet family of algorithms were recently proposed asunconstrained graph clustering algorithms for document clus-tering [49]. These algorithms are based on combining ideasfrom the classic K-means algorithm and the Star algorithm.
• Cut Clustering algorithm based on finding minimum cuts ofedges in the similarity graph, and evaluated on bibliographiccitation and web data [24].
• Articulation Point Clustering a scalable graph partition-ing algorithm based on finding articulation points and bicon-nected components [17], and evaluated on blog data for iden-tifying chatter in the blogosphere [6].
• Markov Clustering (MCL) is a fast and scalable unsuper-vised clustering algorithm based on simulation of stochasticflow in graphs [47]. It has shown high efficiency and qualityin applications in bio-informatics [11, 38].
• Correlation Clustering was originally proposed for cluster-ing graphs with binary edge labels indicating correlation orlack of correlation of connected nodes [5]. The labels canbe assigned to edges based on the similarity scores of therecords (edge weights) and a threshold value, which makes itappealing as an unconstrained algorithm for clustering simi-larity graphs.
In this work, we do not consider algorithms that contain param-eters adjusting for characteristics in the data or cluster properties(such as the cluster diameter) [13, 34]. We do consider two algo-rithms that contain input parameters, namely, Markov Clustering(MCL) and Cut Clustering. MCL contains a parameter that can in-fluence coarseness and the quality of the clustering. However, asreported by previous work [49] (and also supported by our exper-iments) an optimal value for the parameter is rather stable acrossapplications. The Cut Clustering algorithm has a single parameter,which as our experiments show, directly influences the quality ofthe clustering. We therefore include this algorithm only for com-pleteness. We however fix the value of the parameters of thesealgorithms in our experiments and treat them as unconstrained al-gorithms.
To the best of our knowledge, clustering algorithms not con-sidered in this paper do not meet the requirements of our frame-work. Specifically, the X-means algorithm [42] (an extension ofK-means), which does not require as input the number of clusters,as well as popular Spectral algorithms [14, 37] perform clusteringon a set of points in Euclidean space and need the coordinates of thedata points as input. Moreover, the main application of these algo-rithms is in pattern recognition and image segmentation, with dif-ferent characteristics that make them unsuitable for our framework.
Particularly, the size of the clusters is usually large in these appli-cations whereas for duplicate detection in real world data, there aremany small (and even singleton) clusters in the data. This makessome other (unconstrained) clustering algorithms such as [22, 26]inapplicable.
1.3 Evaluation FrameworkTo compare the quality of the detected duplicates, we have cho-
sen a number of robust metrics. Part of our comparison is basedon widely-used quality measures in information retrieval, namelyprecision, recall and the F1 measure which have previously beenused for evaluation of clustering algorithms. We also use qualitymeasures suitable for the task of duplicate detection. An impor-tant characteristic of the algorithms that should be evaluated in ourframework is their ability to find the correct number of clusters.
For a thorough evaluation of the clustering algorithms, it is es-sential to have datasets of varying sizes, error types and distribu-tions, and for which the ground truth is known. For the experi-ments in this paper, we use datasets generated by a publicly avail-able version of the widely used UIS database generator which hasbeen effectively used in the past to evaluate different approximateselection and join predicates used within duplicate detection [29,31]. We follow the best practice guidelines from information re-trieval and data management, to generate realistic errors in stringdata. Specifically, we use the data generator to inject different re-alistic types and percentages of errors to a clean database of stringattributes. The erroneous records made from each clean record areput in one cluster (which we use as ground truth) in order to beable to measure quality (precision and recall) of the clustering al-gorithms.
Although some of the algorithms considered in this paper havebeen evaluated previously on synthetic randomly generated graphs[10, 47], in document clustering [49], and in computational biol-ogy [11], our work is the first to compare all these algorithms forduplicate detection, and based on several robust quality measures.
1.4 Contributions and OrganizationOur contributions include the following:
• We present a set of unconstrained clustering algorithms andshow how they can be used, in conjunction with scalable ap-proximate join algorithms, for duplicate detection. We in-clude highly scalable (single pass) algorithms together withsome more sophisticated and newer clustering algorithms (specif-ically, Correlation Clustering and Markov Clustering) thathave generated a lot of buzz in the data management com-munity, but have not been evaluated for duplicate detection.We also include algorithms from information retrieval, in-cluding the Star clustering algorithm, the Ricochet family ofalgorithms that were originally proposed for document clus-tering, as well as the graph theoretic based algorithms of CutClustering and Articulation Point Clustering. The majorityof the clustering algorithms presented in this paper were notpreviously used for duplicate detection.
• We present a comprehensive evaluation framework to studythe behaviour of unconstrained clustering algorithms for thetask of duplicate detection. This framework permits scala-bility by ensuring that grouping decisions can be made onthe (relatively small) output of an approximate join, ratherthan on the original relation. Our evaluation is also based onseveral robust quality measures and on various datasets withmany different characteristics.
• We present the results of our comprehensive evaluation andcomparison study of the effectiveness of unconstrained clus-tering algorithms for duplicate detection over string data. Ourresults show the effect of the characteristics of the datasetsand the similarity threshold on the effectiveness of the algo-rithms. Specifically we show that all algorithms with the ex-ception of Ricochet family of algorithms are relatively robustto the distribution of the errors, although Ricochet algorithmsare less sensitive to the value of the threshold and the amountof error in the datasets. We show that sophisticated but popu-lar algorithms like Cut clustering and Correlation clusteringshave lower accuracy than the more efficient single-pass algo-rithms. We are the first to propose using Markov clusteringfor duplicate detection and show that in fact it is among themost accurate algorithms for this task and is also very effi-cient.
This paper is organized as follows. We present an overview andbrief description of the unconstrained clustering algorithms in thenext section. In Section 3, we discuss the methodology as wellas the results of our extensive experiments over several datasets ofstring data. Section 4 presents a summary of our evaluations, con-cludes the paper and describes future directions.
2. UNCONSTRAINED CLUSTERINGUnconstrained clustering algorithms aim to create clusters con-
taining similar records C = {c1, . . . , ck} where the value of k isunknown. The clustering may be exclusive (disjoint), whereby thebase relation is partitioned and there is no overlap of nodes amongthe clusters, that is,
⋃ci∈C ci = R and ci∩cj = ∅ for all ci, cj ∈ C.
Alternatively, non-exclusive clustering permits nodes to belong tomore than one cluster, although it is desirable for this overlap tobe small. The Star, Ricochet (OCR, CR), and Articulation Pointclustering algorithms may produce overlapping clusters.
Consider the source relation as a graph G(U, V ) where eachnode u ∈ U represents a record in the base relation and each edge(u, v) ∈ V connects two nodes u and v only if they are similar,i.e., their similarity score based on some similarity function sim()is above a specified threshold θ. The task of partitioning the rela-tion is equivalent to clustering the nodes in the graph.
2.1 Single-pass AlgorithmsIn this class of algorithms, we do not materialize the similarity
graph. In fact, all the algorithms can be efficiently implementedby a single scan of the list of similar pairs returned by the simi-larity join module, although some require the list to be sorted bysimilarity score. We only use the graph G to illustrate these tech-niques. Figure 3 (from [30]) illustrates the result of applying thesealgorithms to a sample similarity graph.
2.1.1 Partitioning (Transitive Closure)The Partitioning algorithm clusters the given records by finding
the connected components in the graph, and returning each con-nected component as a cluster. The algorithm performs clusteringby first assigning each node to its own cluster. Then, the list ofsimilar pairs (the output of the similarity join) is scanned once andif two connected nodes are not in the same cluster, their clustersare merged. Figure 3(a) shows how this algorithm clusters a sam-ple graph. As shown in this figure, the algorithm may result in bigclusters, the results in many records that are not similar being putin the same cluster. Partitioning is the common approach used inearly entity resolution work, and is included as a baseline.
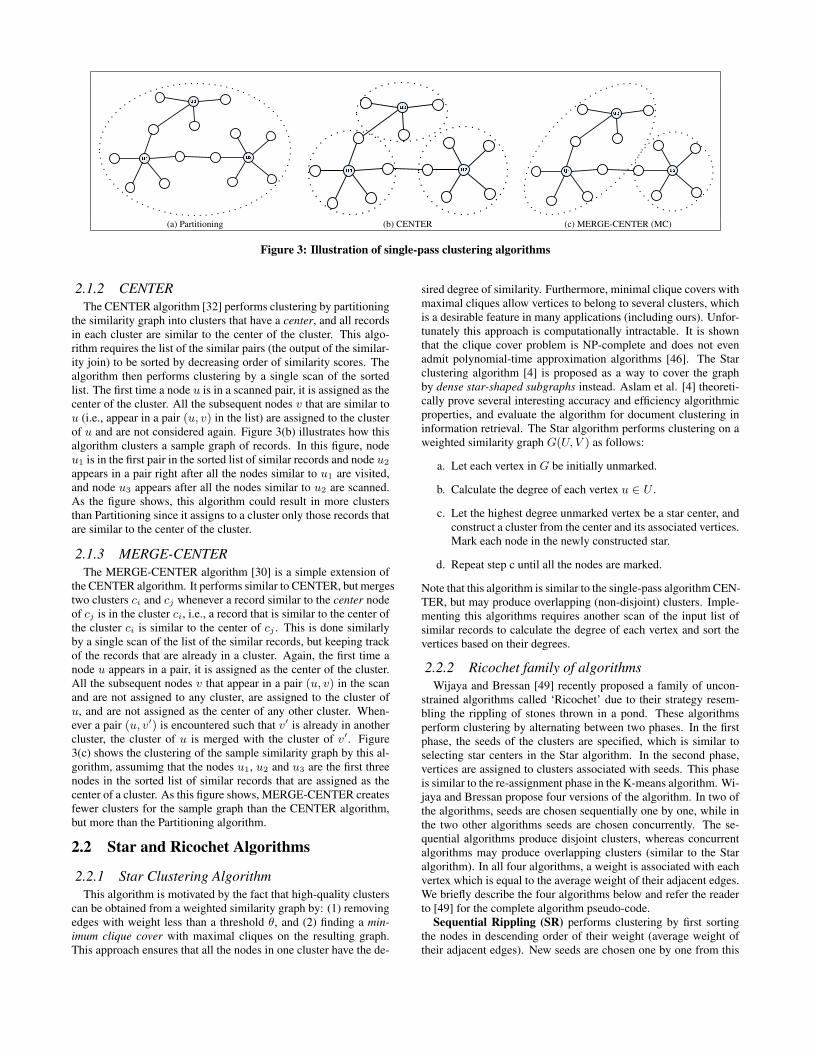
(a) Partitioning (b) CENTER (c) MERGE-CENTER (MC)
Figure 3: Illustration of single-pass clustering algorithms
2.1.2 CENTERThe CENTER algorithm [32] performs clustering by partitioning
the similarity graph into clusters that have a center, and all recordsin each cluster are similar to the center of the cluster. This algo-rithm requires the list of the similar pairs (the output of the similar-ity join) to be sorted by decreasing order of similarity scores. Thealgorithm then performs clustering by a single scan of the sortedlist. The first time a node u is in a scanned pair, it is assigned as thecenter of the cluster. All the subsequent nodes v that are similar tou (i.e., appear in a pair (u, v) in the list) are assigned to the clusterof u and are not considered again. Figure 3(b) illustrates how thisalgorithm clusters a sample graph of records. In this figure, nodeu1 is in the first pair in the sorted list of similar records and node u2
appears in a pair right after all the nodes similar to u1 are visited,and node u3 appears after all the nodes similar to u2 are scanned.As the figure shows, this algorithm could result in more clustersthan Partitioning since it assigns to a cluster only those records thatare similar to the center of the cluster.
2.1.3 MERGE-CENTERThe MERGE-CENTER algorithm [30] is a simple extension of
the CENTER algorithm. It performs similar to CENTER, but mergestwo clusters ci and cj whenever a record similar to the center nodeof cj is in the cluster ci, i.e., a record that is similar to the center ofthe cluster ci is similar to the center of cj . This is done similarlyby a single scan of the list of the similar records, but keeping trackof the records that are already in a cluster. Again, the first time anode u appears in a pair, it is assigned as the center of the cluster.All the subsequent nodes v that appear in a pair (u, v) in the scanand are not assigned to any cluster, are assigned to the cluster ofu, and are not assigned as the center of any other cluster. When-ever a pair (u, v′) is encountered such that v′ is already in anothercluster, the cluster of u is merged with the cluster of v′. Figure3(c) shows the clustering of the sample similarity graph by this al-gorithm, assumimg that the nodes u1, u2 and u3 are the first threenodes in the sorted list of similar records that are assigned as thecenter of a cluster. As this figure shows, MERGE-CENTER createsfewer clusters for the sample graph than the CENTER algorithm,but more than the Partitioning algorithm.
2.2 Star and Ricochet Algorithms
2.2.1 Star Clustering AlgorithmThis algorithm is motivated by the fact that high-quality clusters
can be obtained from a weighted similarity graph by: (1) removingedges with weight less than a threshold θ, and (2) finding a min-imum clique cover with maximal cliques on the resulting graph.This approach ensures that all the nodes in one cluster have the de-
sired degree of similarity. Furthermore, minimal clique covers withmaximal cliques allow vertices to belong to several clusters, whichis a desirable feature in many applications (including ours). Unfor-tunately this approach is computationally intractable. It is shownthat the clique cover problem is NP-complete and does not evenadmit polynomial-time approximation algorithms [46]. The Starclustering algorithm [4] is proposed as a way to cover the graphby dense star-shaped subgraphs instead. Aslam et al. [4] theoreti-cally prove several interesting accuracy and efficiency algorithmicproperties, and evaluate the algorithm for document clustering ininformation retrieval. The Star algorithm performs clustering on aweighted similarity graph G(U, V ) as follows:
a. Let each vertex in G be initially unmarked.
b. Calculate the degree of each vertex u ∈ U .
c. Let the highest degree unmarked vertex be a star center, andconstruct a cluster from the center and its associated vertices.Mark each node in the newly constructed star.
d. Repeat step c until all the nodes are marked.
Note that this algorithm is similar to the single-pass algorithm CEN-TER, but may produce overlapping (non-disjoint) clusters. Imple-menting this algorithms requires another scan of the input list ofsimilar records to calculate the degree of each vertex and sort thevertices based on their degrees.
2.2.2 Ricochet family of algorithmsWijaya and Bressan [49] recently proposed a family of uncon-
strained algorithms called ‘Ricochet’ due to their strategy resem-bling the rippling of stones thrown in a pond. These algorithmsperform clustering by alternating between two phases. In the firstphase, the seeds of the clusters are specified, which is similar toselecting star centers in the Star algorithm. In the second phase,vertices are assigned to clusters associated with seeds. This phaseis similar to the re-assignment phase in the K-means algorithm. Wi-jaya and Bressan propose four versions of the algorithm. In two ofthe algorithms, seeds are chosen sequentially one by one, while inthe two other algorithms seeds are chosen concurrently. The se-quential algorithms produce disjoint clusters, whereas concurrentalgorithms may produce overlapping clusters (similar to the Staralgorithm). In all four algorithms, a weight is associated with eachvertex which is equal to the average weight of their adjacent edges.We briefly describe the four algorithms below and refer the readerto [49] for the complete algorithm pseudo-code.
Sequential Rippling (SR) performs clustering by first sortingthe nodes in descending order of their weight (average weight oftheir adjacent edges). New seeds are chosen one by one from this
sorted list. When a new seed is added, vertices are re-assigned to anew cluster if they are closer to the new seed than they were to theseed of their current cluster. If there are no re-assignments, thenno new cluster is created. If a cluster is reduced to singleton, itis reassigned to its nearest cluster. The algorithm stops when allnodes are considered.
Balanced Sequential Rippling (BSR) is similar to the sequen-tial rippling in selecting the first seed, and has a similar secondphase. However its first phase differs whereby it chooses the nextseed to maximize the ratio of its weight to the sum of its similarityto the seeds of existing clusters. This strategy is employed to selecta node with a high weight but is far enough from other seeds as thenew seed.
Concurrent Rippling (CR) initially marks every vertex as aseed. In each iteration, the algorithm picks for each seed the edgewith highest weight. If the edge connects the seed to a vertex thatis not a seed, the vertex is assigned to the cluster of the seed. Ifthe vertex is a seed, it is assigned to the cluster of the other seedonly if its weight is smaller than the weight of the seed. This it-eration (propagation of ripple) is performed at equal speed for allseeds. This requires sorting of the edges in descending order oftheir weights, finding the minimum value of the weight of the edgespicked in each iteration of the algorithm, and processing all theedges that have a weight above the minimum weight value.
Ordered Concurrent Rippling (OCR) performs clustering sim-ilar to concurrent rippling but removes the requirement that the rip-pling propagates at equal speeds. Therefore this algorithm is rela-tively more efficient and also could possibly create higher qualityclusters by favoring heavy seeds.
2.3 Correlation ClusteringSuppose we have a graph G on n nodes, where each edge (u, v)
is labeled either + or − depending on whether u and v have beendeemed to be similar or different. Correlation clustering, originallyproposed by [5], refers to the problem of producing a partition (aclustering) of G that agrees as much as possible with the edge la-bels. More precisely, correlation clustering solves a maximizationproblem where the goal is to find a partition that maximizes thenumber of + edges within clusters and the number of − edges be-tween clusters. Similarly, correlation clustering can also be for-mulated as a minimization problem where the goal is to minimizethe number of − edges inside clusters and the number of + edgesbetween clusters.
Correlation clustering is a NP-hard problem[5]. Thus, severalattempts have been made to approximate both the maximizationand minimization formulations [5, 12, 19, 45]. Most of them aredifferent ways of approximating its linear programming formula-tion. For the maximation formulation, Bansal et al. give a polyno-mial time approximation scheme. For the minimization formula-tion, Bansal et al. give a constant factor approximation. They alsopresent a result which states that any constant factor approximationfor the minimization problem in {+,−}-graphs can be extendedas a constant factor approximation in general weighted graphs. Forthe purpose of our application, we implemented and evaluated thealgorithm Cautius in [5]. Using a notion of “δ-goodness”, the algo-rithm Cautius expands a cluster associated with an arbitrary nodeby adding its neighbors that are δ-good into the cluster while re-moving its neighbors that are δ-bad from the given cluster.
2.4 Markov Clustering (MCL)The Markov Cluster Algorithm (MCL), proposed by Stijn van
Dongen [47], is an algorithm based on simulation of (stochastic)flow in graphs. MCL clusters the graph by performing random
walks on a graph using a combination of simple algebraic oper-ations on its associated stochastic matrix. Similar to other algo-rithms considered in our paper, it does not require any priori knowl-edge about an underlying cluster structure. The algorithm is basedon a simple intuition that a region with many edges inside forms acluster and therefore the amount of flow within a cluster is strong.On the other hand, there exist a few edges between such producedregions (clusters) and therefore the amount of flow between suchregions (clusters) is weak. Random walks (or flow) within thewhole graph are used to strengthen flow where it is already strong(e.g. inside a cluster), and weaken it where it is weak (e.g. be-tween clusters). By continuing with such random walks an under-lying cluster structure will eventually become visible. Therefore,such random walks are finally ended when we find regions (clus-ters) with strong internal flow that are separated by boundaries withhardly any flow.
The flow simulation in the MCL algorithm is as an alternate ap-plication of two simple algebraic operations on stochastic matrixassociated with the given graph. The first algebraic operation iscalled expansion, which coincides with normal matrix multiplica-tion of a random walk matrix. Expansion models the spreadingout of flow as it becomes more homogeneous. The second alge-braic operation is called inflation, which is a Hadamard power fol-lowed by a diagonal scaling of another random walk matrix. Infla-tion models the contraction of flow, becoming thicker in regions ofhigher current and thinner in regions of lower current. The sequen-tial application of expansion and inflation causes flow to spread outwithin natural clusters and evaporate in between different clusters.By varying the inflation parameter of the algorithm, clusterings ondifferent scales of granularity can be found. Therefore, the numberof clusters cannot and need not be specified in advance, and thealgorithm can be adapted to different contexts.
2.5 Cut ClusteringGiven a directed graph G = (U, V ) with edge capacities c(u, v) ∈
Z+ , and two vertices s, t, the s − t maximum flow problem is tofind a maximum flow path from the source s to the sink t that re-spects the capacity constraints.3 Intuitively, if the edges are roads,the max flow problem determines the maximum flow rate of carsbetween two points. The max flow-min cut theorem proven by Fordand Fulkerson [25] states that finding the maximum flow of a net-work is equivalent to finding the minimum cut that separates s andt. Specifically, this involves finding a non-trivial partition of thevertices into two sets, where s and t are in different sets, such thatthe cut weight (the sum of edge weights in the cut) is minimal.There are many applications of this theorem to areas such as net-work reliability theory, routing, transportation planning, and clusteranalysis.
We implemented and evaluated the Cut Clustering algorithm basedon minimum cuts proposed by Flake, Tarjan, and Tsioutsiouliklis[24]. The goal is to find clusters with small inter-cluster cuts so thatthe intra-cluster weights are maximized giving strong connectionswithin the clusters. The algorithm is based on inserting an artificialsink t into G and finding the minimum cut between each vertexu ∈ U (the source) and t. Removing the edges in the minimumcut yields two sets of clusters. Vertices participating in a clusterare not considered as a source in subsequent evaluations. Multipleiterations of finding minimum cuts yields a minimum cut tree, andafter removing the sink t, the resulting connected components arethe clusters of G.
There have been many algorithms proposed for finding the min-
3Undirected graphs are modeled with bi-directional edges.
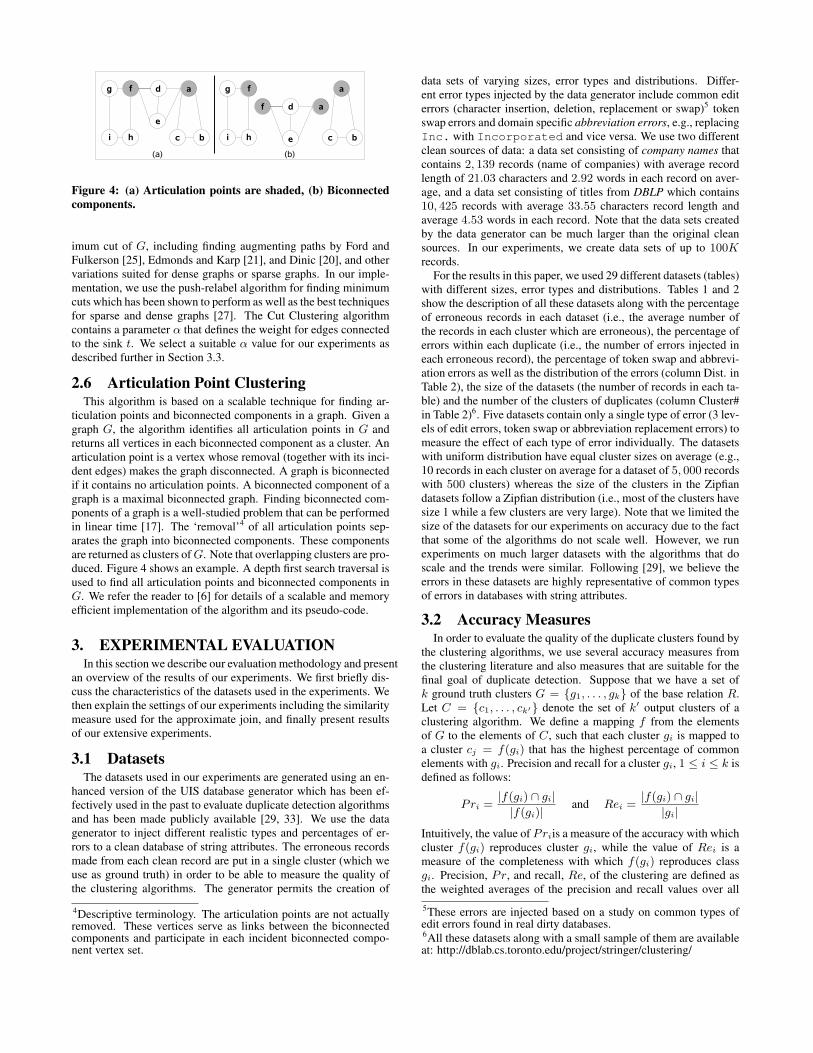
Figure 4: (a) Articulation points are shaded, (b) Biconnectedcomponents.
imum cut of G, including finding augmenting paths by Ford andFulkerson [25], Edmonds and Karp [21], and Dinic [20], and othervariations suited for dense graphs or sparse graphs. In our imple-mentation, we use the push-relabel algorithm for finding minimumcuts which has been shown to perform as well as the best techniquesfor sparse and dense graphs [27]. The Cut Clustering algorithmcontains a parameter α that defines the weight for edges connectedto the sink t. We select a suitable α value for our experiments asdescribed further in Section 3.3.
2.6 Articulation Point ClusteringThis algorithm is based on a scalable technique for finding ar-
ticulation points and biconnected components in a graph. Given agraph G, the algorithm identifies all articulation points in G andreturns all vertices in each biconnected component as a cluster. Anarticulation point is a vertex whose removal (together with its inci-dent edges) makes the graph disconnected. A graph is biconnectedif it contains no articulation points. A biconnected component of agraph is a maximal biconnected graph. Finding biconnected com-ponents of a graph is a well-studied problem that can be performedin linear time [17]. The ‘removal’4 of all articulation points sep-arates the graph into biconnected components. These componentsare returned as clusters of G. Note that overlapping clusters are pro-duced. Figure 4 shows an example. A depth first search traversal isused to find all articulation points and biconnected components inG. We refer the reader to [6] for details of a scalable and memoryefficient implementation of the algorithm and its pseudo-code.
3. EXPERIMENTAL EVALUATIONIn this section we describe our evaluation methodology and present
an overview of the results of our experiments. We first briefly dis-cuss the characteristics of the datasets used in the experiments. Wethen explain the settings of our experiments including the similaritymeasure used for the approximate join, and finally present resultsof our extensive experiments.
3.1 DatasetsThe datasets used in our experiments are generated using an en-
hanced version of the UIS database generator which has been ef-fectively used in the past to evaluate duplicate detection algorithmsand has been made publicly available [29, 33]. We use the datagenerator to inject different realistic types and percentages of er-rors to a clean database of string attributes. The erroneous recordsmade from each clean record are put in a single cluster (which weuse as ground truth) in order to be able to measure the quality ofthe clustering algorithms. The generator permits the creation of
4Descriptive terminology. The articulation points are not actuallyremoved. These vertices serve as links between the biconnectedcomponents and participate in each incident biconnected compo-nent vertex set.
data sets of varying sizes, error types and distributions. Differ-ent error types injected by the data generator include common editerrors (character insertion, deletion, replacement or swap)5 tokenswap errors and domain specific abbreviation errors, e.g., replacingInc. with Incorporated and vice versa. We use two differentclean sources of data: a data set consisting of company names thatcontains 2, 139 records (name of companies) with average recordlength of 21.03 characters and 2.92 words in each record on aver-age, and a data set consisting of titles from DBLP which contains10, 425 records with average 33.55 characters record length andaverage 4.53 words in each record. Note that the data sets createdby the data generator can be much larger than the original cleansources. In our experiments, we create data sets of up to 100Krecords.
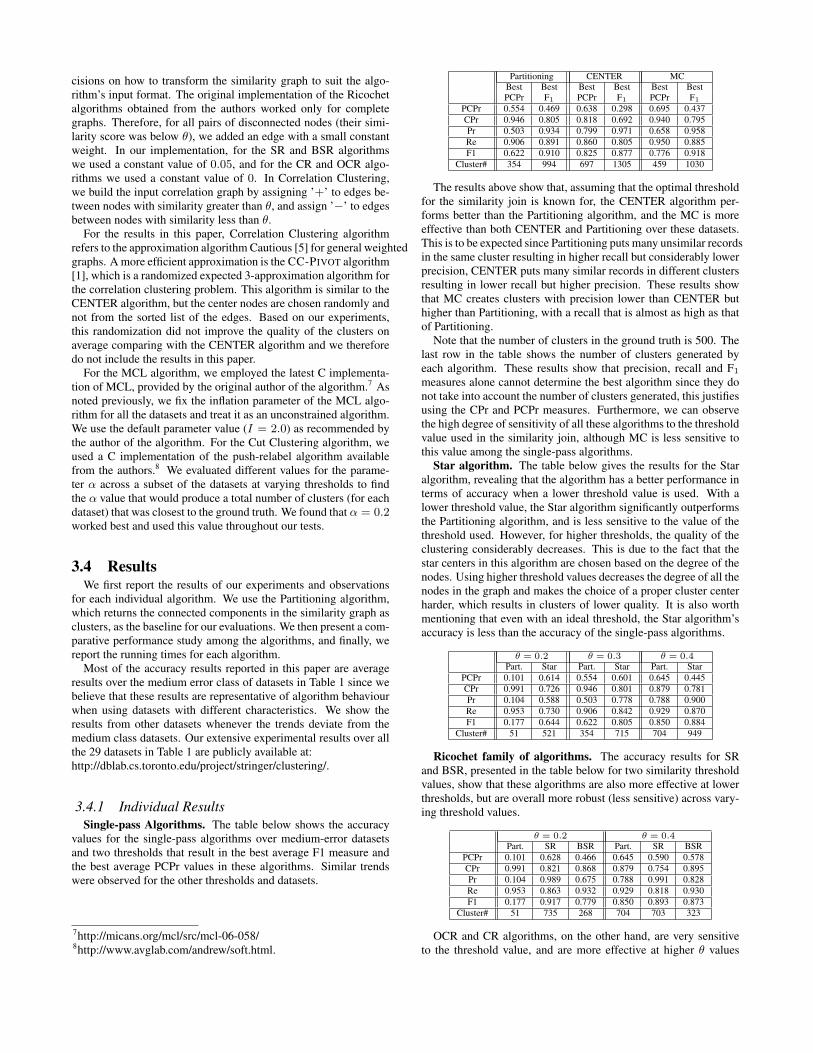
For the results in this paper, we used 29 different datasets (tables)with different sizes, error types and distributions. Tables 1 and 2show the description of all these datasets along with the percentageof erroneous records in each dataset (i.e., the average number ofthe records in each cluster which are erroneous), the percentage oferrors within each duplicate (i.e., the number of errors injected ineach erroneous record), the percentage of token swap and abbrevi-ation errors as well as the distribution of the errors (column Dist. inTable 2), the size of the datasets (the number of records in each ta-ble) and the number of the clusters of duplicates (column Cluster#in Table 2)6. Five datasets contain only a single type of error (3 lev-els of edit errors, token swap or abbreviation replacement errors) tomeasure the effect of each type of error individually. The datasetswith uniform distribution have equal cluster sizes on average (e.g.,10 records in each cluster on average for a dataset of 5, 000 recordswith 500 clusters) whereas the size of the clusters in the Zipfiandatasets follow a Zipfian distribution (i.e., most of the clusters havesize 1 while a few clusters are very large). Note that we limited thesize of the datasets for our experiments on accuracy due to the factthat some of the algorithms do not scale well. However, we runexperiments on much larger datasets with the algorithms that doscale and the trends were similar. Following [29], we believe theerrors in these datasets are highly representative of common typesof errors in databases with string attributes.
3.2 Accuracy MeasuresIn order to evaluate the quality of the duplicate clusters found by
the clustering algorithms, we use several accuracy measures fromthe clustering literature and also measures that are suitable for thefinal goal of duplicate detection. Suppose that we have a set ofk ground truth clusters G = {g1, . . . , gk} of the base relation R.Let C = {c1, . . . , ck′} denote the set of k′ output clusters of aclustering algorithm. We define a mapping f from the elementsof G to the elements of C, such that each cluster gi is mapped toa cluster cj = f(gi) that has the highest percentage of commonelements with gi. Precision and recall for a cluster gi, 1 ≤ i ≤ k isdefined as follows:
Pri =|f(gi) ∩ gi||f(gi)| and Rei =
|f(gi) ∩ gi||gi|
Intuitively, the value of Priis a measure of the accuracy with whichcluster f(gi) reproduces cluster gi, while the value of Rei is ameasure of the completeness with which f(gi) reproduces classgi. Precision, Pr, and recall, Re, of the clustering are defined asthe weighted averages of the precision and recall values over all5These errors are injected based on a study on common types ofedit errors found in real dirty databases.6All these datasets along with a small sample of them are availableat: http://dblab.cs.toronto.edu/project/stringer/clustering/
Table 1: Datasets used in the experimentsPercentage of
Group Name Erroneous Errors in Token Abbr.Duplicates Duplicates Swap Error
High H1 90 30 20 50Error H2 50 30 20 50
Medium M1 30 30 20 50Error M2 10 30 20 50
M3 90 10 20 50M4 50 10 20 50
Low L1 30 10 20 50Error L2 10 10 20 50
AB 50 0 0 50Single TS 50 0 20 0Error EDL 50 10 0 0
EDM 50 20 0 0EDH 50 30 0 0
Zipfian ZH1 90 30 20 50High ZH2 50 30 20 50
Zipfian ZM1 30 30 20 50Medium ZM2 10 30 20 50
Error ZM3 90 10 20 50ZM4 50 10 20 50
Zipfian ZL1 30 10 20 50Low ZL2 10 10 20 50
DBLP DH1 90 30 20 0High DH2 50 30 20 0
DBLP DM1 30 30 20 0Medium DM2 10 30 20 0
Error DM3 90 10 20 0DM4 50 10 20 0
DBLP DL1 30 10 20 0Low DL2 10 10 20 0
Table 2: Size, distribution and source of the datasetsGroup Source Dist. Size Cluster#
High Error, Company Uniform 5K 500Medium Error, Names
Low Error,Single ErrorZipfian High Company Zipfian 1.5K 1K
Zipfian Medium NamesZipfian LowDBLP High DBLP Uniform 5K 500
DBLP Medium TitlesDBLP Low
ground truth clusters. More precisely:
Pr =
k∑i=1
|gi||R|Pri and Re =
k∑i=1
|gi||R|Rei
F1-measure is defined as the harmonic mean of precision and recall,i.e.,
F1 =2× Pr ×Re
Pr + Re.
We use precision, recall and F1-measure as indicative values ofthe ability of an algorithm to reconstruct the indicated clusters inthe dataset. However, in our framework, the number of clusterscreated by the clustering algorithms is not fixed and depends on thedatasets and the threshold value used in the similarity join. There-fore, we define two other measures specifically suitable for ourframework. Let CPri be the number of pairs (of records) in eachcluster ci that are in the same ground truth cluster gj : ci = f(gj),i.e.,
CPri =|(t, s) ∈ ci × ci|t 6= s ∧ ∃j ∈ 1 . . . k, (t, s) ∈ gj × gj |(
k′2
)
We define Clustering Precision, CPr, to be the average of CPri
for all clusters of size greater than or equal to 2. The value of CPrindicates the ability of the clustering algorithm to assign recordsthat should be in the same cluster to a single cluster, regardlessof the number and the size of the clusters produced. In order topenalizes those algorithms that create greater or fewer clusters thanthe ground truth, we define Penalized Clustering Precision, PCPr,and compute it as CPr multiplied by the percentage of extra ormissing clusters in the result, i.e.,
PCPr =
{kk′CPr k < k′
k′k
CPr k ≥ k′
3.3 SettingsSimilarity Function There are a large number of similarity mea-
sures for string data that can be used in the similarity join. Based onthe comparison of several such measures in [31], we use weightedJaccard similarity along with q-gram tokens (substrings of lengthq of the strings) as the measure of choice due to its relatively highefficiency and accuracy compared with other measures. Jaccardsimilarity is the fraction of tokens in r1 and r2 that are present inboth. Weighted Jaccard similarity is the weighted version of Jac-card similarity, i.e.,
simWJaccard(r1, r2) =
∑t∈r1∩r2 w(t, R)∑t∈r1∪r2 w(t, R)
(1)
where w(t, R) is a weight function that reflects the commonalityof the token t in the relation R. We choose the commonly-usedInverse Document Frequency (IDF) weights, with a slight modifi-cation based on the RSJ (Robertson/Sparck Jones) weights whichwas shown to make the weight values more effective [29]:
w(t, R) = log
(N − nt + 0.5
nt + 0.5
)(2)
where N is the number of tuples in the base relation R and nt is thenumber of tuples in R containing the token t. The similarity valuereturned is between 0 (for strings that do not share any q-grams)and 1 (for equal strings).
Note that this similarity predicate can be implemented declar-atively and used as a join predicate in a standard RDBMS engine[29], or used with some of the specialized, high performance, state-of-the-art approximate join algorithms [3, 7]. In our experimentswe used q-grams of size 2 and the q-gram generation techniqueproposed by [29]: strings are first padded with whitespaces at thebeginning and the end, then all whitespaces are replaced with q−1special symbols (e.g., $).
Implementation Details of the Clustering Algorithms. To com-pare the clustering algorithms, we have either implemented or ob-tained an implementation of the algorithms from their authors. No-tably, not all of these algorithms have previously been implementednor evaluated (even on their own), so we created some new im-plementations. For other algorithms where the authors providedus with an implementation, their implementation may have beenin a different language and used different data structures from ourown implementation. As a result, the time taken by different al-gorithms is not directly comparable. We report running times, butthey should be taken as an upper bound on the computation time.All the implementations (our own and those of others) could be op-timized further and, more notably for our study, we have not triedto ensure the time optimization is equitable. Rather, we are focus-ing on comparing the quality of the duplicates detected by eachapproach.
Some of the clustering algorithms were not originally designedfor an input similarity graph and therefore we needed to make de-
cisions on how to transform the similarity graph to suit the algo-rithm’s input format. The original implementation of the Ricochetalgorithms obtained from the authors worked only for completegraphs. Therefore, for all pairs of disconnected nodes (their simi-larity score was below θ), we added an edge with a small constantweight. In our implementation, for the SR and BSR algorithmswe used a constant value of 0.05, and for the CR and OCR algo-rithms we used a constant value of 0. In Correlation Clustering,we build the input correlation graph by assigning ’+’ to edges be-tween nodes with similarity greater than θ, and assign ’−’ to edgesbetween nodes with similarity less than θ.
For the results in this paper, Correlation Clustering algorithmrefers to the approximation algorithm Cautious [5] for general weightedgraphs. A more efficient approximation is the CC-PIVOT algorithm[1], which is a randomized expected 3-approximation algorithm forthe correlation clustering problem. This algorithm is similar to theCENTER algorithm, but the center nodes are chosen randomly andnot from the sorted list of the edges. Based on our experiments,this randomization did not improve the quality of the clusters onaverage comparing with the CENTER algorithm and we thereforedo not include the results in this paper.
For the MCL algorithm, we employed the latest C implementa-tion of MCL, provided by the original author of the algorithm.7 Asnoted previously, we fix the inflation parameter of the MCL algo-rithm for all the datasets and treat it as an unconstrained algorithm.We use the default parameter value (I = 2.0) as recommended bythe author of the algorithm. For the Cut Clustering algorithm, weused a C implementation of the push-relabel algorithm availablefrom the authors.8 We evaluated different values for the parame-ter α across a subset of the datasets at varying thresholds to findthe α value that would produce a total number of clusters (for eachdataset) that was closest to the ground truth. We found that α = 0.2worked best and used this value throughout our tests.
3.4 ResultsWe first report the results of our experiments and observations
for each individual algorithm. We use the Partitioning algorithm,which returns the connected components in the similarity graph asclusters, as the baseline for our evaluations. We then present a com-parative performance study among the algorithms, and finally, wereport the running times for each algorithm.
Most of the accuracy results reported in this paper are averageresults over the medium error class of datasets in Table 1 since webelieve that these results are representative of algorithm behaviourwhen using datasets with different characteristics. We show theresults from other datasets whenever the trends deviate from themedium class datasets. Our extensive experimental results over allthe 29 datasets in Table 1 are publicly available at:http://dblab.cs.toronto.edu/project/stringer/clustering/.
3.4.1 Individual ResultsSingle-pass Algorithms. The table below shows the accuracy
values for the single-pass algorithms over medium-error datasetsand two thresholds that result in the best average F1 measure andthe best average PCPr values in these algorithms. Similar trendswere observed for the other thresholds and datasets.
7http://micans.org/mcl/src/mcl-06-058/8http://www.avglab.com/andrew/soft.html.
Partitioning CENTER MCBest Best Best Best Best BestPCPr F1 PCPr F1 PCPr F1
PCPr 0.554 0.469 0.638 0.298 0.695 0.437CPr 0.946 0.805 0.818 0.692 0.940 0.795Pr 0.503 0.934 0.799 0.971 0.658 0.958Re 0.906 0.891 0.860 0.805 0.950 0.885F1 0.622 0.910 0.825 0.877 0.776 0.918
Cluster# 354 994 697 1305 459 1030
The results above show that, assuming that the optimal thresholdfor the similarity join is known for, the CENTER algorithm per-forms better than the Partitioning algorithm, and the MC is moreeffective than both CENTER and Partitioning over these datasets.This is to be expected since Partitioning puts many unsimilar recordsin the same cluster resulting in higher recall but considerably lowerprecision, CENTER puts many similar records in different clustersresulting in lower recall but higher precision. These results showthat MC creates clusters with precision lower than CENTER buthigher than Partitioning, with a recall that is almost as high as thatof Partitioning.
Note that the number of clusters in the ground truth is 500. Thelast row in the table shows the number of clusters generated byeach algorithm. These results show that precision, recall and F1
measures alone cannot determine the best algorithm since they donot take into account the number of clusters generated, this justifiesusing the CPr and PCPr measures. Furthermore, we can observethe high degree of sensitivity of all these algorithms to the thresholdvalue used in the similarity join, although MC is less sensitive tothis value among the single-pass algorithms.
Star algorithm. The table below gives the results for the Staralgorithm, revealing that the algorithm has a better performance interms of accuracy when a lower threshold value is used. With alower threshold value, the Star algorithm significantly outperformsthe Partitioning algorithm, and is less sensitive to the value of thethreshold used. However, for higher thresholds, the quality of theclustering considerably decreases. This is due to the fact that thestar centers in this algorithm are chosen based on the degree of thenodes. Using higher threshold values decreases the degree of all thenodes in the graph and makes the choice of a proper cluster centerharder, which results in clusters of lower quality. It is also worthmentioning that even with an ideal threshold, the Star algorithm’saccuracy is less than the accuracy of the single-pass algorithms.
θ = 0.2 θ = 0.3 θ = 0.4Part. Star Part. Star Part. Star
PCPr 0.101 0.614 0.554 0.601 0.645 0.445CPr 0.991 0.726 0.946 0.801 0.879 0.781Pr 0.104 0.588 0.503 0.778 0.788 0.900Re 0.953 0.730 0.906 0.842 0.929 0.870F1 0.177 0.644 0.622 0.805 0.850 0.884
Cluster# 51 521 354 715 704 949
Ricochet family of algorithms. The accuracy results for SRand BSR, presented in the table below for two similarity thresholdvalues, show that these algorithms are also more effective at lowerthresholds, but are overall more robust (less sensitive) across vary-ing threshold values.
θ = 0.2 θ = 0.4Part. SR BSR Part. SR BSR
PCPr 0.101 0.628 0.466 0.645 0.590 0.578CPr 0.991 0.821 0.868 0.879 0.754 0.895Pr 0.104 0.989 0.675 0.788 0.991 0.828Re 0.953 0.863 0.932 0.929 0.818 0.930F1 0.177 0.917 0.779 0.850 0.893 0.873
Cluster# 51 735 268 704 703 323
OCR and CR algorithms, on the other hand, are very sensitiveto the threshold value, and are more effective at higher θ values
as shown in the table below. This is again due to different way ofchoosing cluster seeds (or centers) used in these algorithms. Mark-ing all the nodes as seeds and gradually merging the clusters, asdone in OCR and CR, results in higher quality clusters when thethreshold value is high (i.e., the similarity graph is not dense) butdoes not work well when the threshold value is low (i.e., the simi-larity graph is very dense). On the other hand, when the seeds arechosen sequentially based on the weight of the nodes, as done in SRand BSR, a lower threshold value (i.e., a dense similarity graph) re-sults in more accurate weight values and therefore better choice ofcluster seeds and higher quality clusters.
θ = 0.2 θ = 0.5Part. CR OCR Part. CR OC
PCPr 0.101 0.494 0.351 0.469 0.402 0.687CPr 0.991 0.967 0.981 0.805 0.782 0.817Pr 0.104 0.434 0.299 0.934 0.958 0.862Re 0.953 0.869 0.952 0.891 0.869 0.883F1 0.177 0.567 0.454 0.910 0.910 0.872
Cluster# 51 258 180 994 1079 593
Cut Clustering (MinCut). Clustering the similarity graph basedon minimum cuts improves the quality of the clustering when com-pared to the Partitioning algorithm, as shown in the table below.This improvement is significant as we increase the threshold up to0.4. For θ > 0.4, MinCut Clustering produces the same clustersas the Partitioning algorithm, since as the input graph becomes lessdense, only significantly related records remain connected and fur-ther cutting the edges does not improve the quality of the clusters.
θ = 0.2 θ = 0.3 θ = 0.4Part. MinCut Part. MinCut Part. MinCut
PCPr 0.101 0.105 0.554 0.683 0.645 0.689CPr 0.991 0.509 0.946 0.891 0.879 0.875Pr 0.104 0.833 0.503 0.672 0.788 0.827Re 0.953 0.564 0.906 0.908 0.929 0.926F1 0.177 0.671 0.622 0.771 0.850 0.873
Clstr# 51 2450 354 665 704 735
Articulation Point Clustering (ArtPt). As the results show inthe following table, the Articulation Point clustering slightly en-hances the Partitioning algorithm by splitting some of the compo-nents in the graph into a few more clusters. This makes the algo-rithm only slightly less sensitive to the threshold value. The al-gorithm works best with the optimal threshold for the Partitioningalgorithm (the θ value that creates partitions of highest quality inthe Partitioning algorithm).
θ = 0.2 θ = 0.3 θ = 0.4Part. ArtPt. Part. ArtPt. Part. ArtPt.
PCPr 0.101 0.169 0.554 0.655 0.645 0.680CPr 0.991 0.988 0.946 0.941 0.879 0.871Pr 0.104 0.157 0.503 0.581 0.788 0.825Re 0.953 0.920 0.906 0.891 0.929 0.925F1 0.177 0.251 0.622 0.693 0.850 0.871
Cluster# 51 86 354 428 704 754
Markov Clustering (MCL). As shown in the table below, theMCL algorithm produces clusters of increased quality than thosecreated by the Partitioning algorithm. The MCL algorithm is alsomost effective when used with the optimal threshold value, althoughit is much less sensitive overall across varying θ values. This showsthe effectiveness of the flow simulation process using random walkson the graph, and that unlike the Star and SR algorithms, pruningthe edges with low weights does not affect the quality of the clus-ters significantly, and unlike Partitioning and CR, a dense similar-ity graph (i.e., not pruning the low-weight edges) does not result inclusters with low precision.
θ = 0.2 θ = 0.3 θ = 0.4Part. MCL Part. MCL Part. MCL
PCPr 0.101 0.599 0.554 0.768 0.645 0.644CPr 0.991 0.934 0.946 0.921 0.879 0.866Pr 0.104 0.571 0.503 0.754 0.788 0.888Re 0.953 0.951 0.906 0.952 0.929 0.925F1 0.177 0.712 0.622 0.841 0.850 0.906
Cluster# 51 323 354 528 704 777
Correlation Clustering (CCL) This algorithm performs bestwhen using lower threshold values, producing clusters with muchhigher quality than those created by the Partitioning algorithm. Thequality of the produced clusters degrade at higher θ values. This isto be expected since the algorithm performs clustering based oncorrelation information between the nodes and a higher θ means aloss of this information.
θ = 0.2 θ = 0.3 θ = 0.4Part. CCL Part. CCL Part. CCL
PCPr 0.101 0.612 0.554 0.542 0.645 0.406CPr 0.991 0.711 0.946 0.762 0.879 0.748Pr 0.104 0.596 0.503 0.803 0.788 0.914Re 0.953 0.750 0.906 0.822 0.929 0.844F1 0.177 0.659 0.622 0.808 0.850 0.876
Cluster# 51 538 354 753 704 1000
3.4.2 Overall ComparisonSensitivity to the value of the threshold. Table 3 shows the ac-
curacy results of all the algorithms for different thresholds over themedium-error class of datasets. These results can be used to com-pare different algorithms when using a fixed threshold, i.e., withthe same similarity graph as input. Among all the algorithms, SRand BSR are least sensitive to the threshold value. However theiraccuracy does not always outperform the other algorithms. In otheralgorithms, those that use the weight and degree of the edges forthe clustering perform relatively better using lower threshold vlues,when the similarity graph is more dense. Therefore, CENTER,Star, Correlation Clustering and MCL algorithms perform betterwith low threshold values comparing with the other algorithms.The single-pass algorithms along with Articulation Point and Min-Cut algorithms are generally more sensitive to the threshold valueand are considerably more effective when used with the optimalthreshold (when the number of components in the graph is closeto the number of ground truth clusters), with MERGE-CENTERbeing the least sensitive among them.
Effect of the amount of errors. The results in Table 4 show thebest accuracy values obtained by the algorithms on datasets withdifferent amounts of error, along with the difference (Diff.) be-tween the value obtained for the high error and low error groupsof datasets. Note that the accuracy numbers in this table cannotbe used to directly compare the algorithms since they are basedon different thresholds and therefore the input similarity graph isdifferent for each algorithm. We use these results to compare theeffect of the amount of error on different algorithms. These resultssuggest that the Ricochet group of algorithms and MCL algorithmare relatively more robust on datasets with different amounts of er-rors, i.e., they perform equally well on the three groups of datasetswith lowest drop in the quality of the clusters on high error datasetscomparing with low error groups of datasets.
Sensitivity to the distribution of the errors. Table 5 shows thebest accuracy values obtained for the algorithms on medium-errordatasets with uniform and Zipfian distributions. Note that in Zip-fian datasets, there are many records with no duplicates (singletonclusters) and only a few records with many duplicates. Due to thefact that the PCPr measure is the average CPr value for all the clus-ters and is calculated for clusters of size 2 or more, this accuracymeasure is less indicative of the performance of the algorithms onthis class of datasets. These results show that all the algorithms are
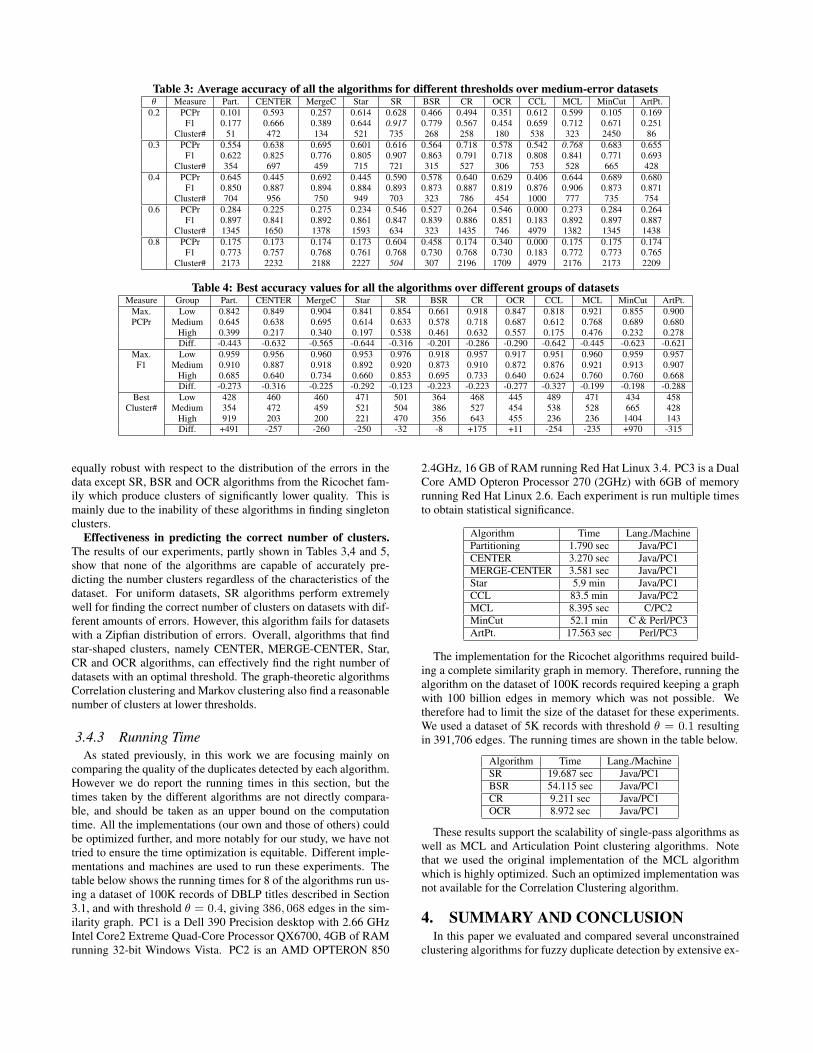
Table 3: Average accuracy of all the algorithms for different thresholds over medium-error datasetsθ Measure Part. CENTER MergeC Star SR BSR CR OCR CCL MCL MinCut ArtPt.
0.2 PCPr 0.101 0.593 0.257 0.614 0.628 0.466 0.494 0.351 0.612 0.599 0.105 0.169F1 0.177 0.666 0.389 0.644 0.917 0.779 0.567 0.454 0.659 0.712 0.671 0.251
Cluster# 51 472 134 521 735 268 258 180 538 323 2450 860.3 PCPr 0.554 0.638 0.695 0.601 0.616 0.564 0.718 0.578 0.542 0.768 0.683 0.655
F1 0.622 0.825 0.776 0.805 0.907 0.863 0.791 0.718 0.808 0.841 0.771 0.693Cluster# 354 697 459 715 721 315 527 306 753 528 665 428
0.4 PCPr 0.645 0.445 0.692 0.445 0.590 0.578 0.640 0.629 0.406 0.644 0.689 0.680F1 0.850 0.887 0.894 0.884 0.893 0.873 0.887 0.819 0.876 0.906 0.873 0.871
Cluster# 704 956 750 949 703 323 786 454 1000 777 735 7540.6 PCPr 0.284 0.225 0.275 0.234 0.546 0.527 0.264 0.546 0.000 0.273 0.284 0.264
F1 0.897 0.841 0.892 0.861 0.847 0.839 0.886 0.851 0.183 0.892 0.897 0.887Cluster# 1345 1650 1378 1593 634 323 1435 746 4979 1382 1345 1438
0.8 PCPr 0.175 0.173 0.174 0.173 0.604 0.458 0.174 0.340 0.000 0.175 0.175 0.174F1 0.773 0.757 0.768 0.761 0.768 0.730 0.768 0.730 0.183 0.772 0.773 0.765
Cluster# 2173 2232 2188 2227 504 307 2196 1709 4979 2176 2173 2209
Table 4: Best accuracy values for all the algorithms over different groups of datasetsMeasure Group Part. CENTER MergeC Star SR BSR CR OCR CCL MCL MinCut ArtPt.
Max. Low 0.842 0.849 0.904 0.841 0.854 0.661 0.918 0.847 0.818 0.921 0.855 0.900PCPr Medium 0.645 0.638 0.695 0.614 0.633 0.578 0.718 0.687 0.612 0.768 0.689 0.680
High 0.399 0.217 0.340 0.197 0.538 0.461 0.632 0.557 0.175 0.476 0.232 0.278Diff. -0.443 -0.632 -0.565 -0.644 -0.316 -0.201 -0.286 -0.290 -0.642 -0.445 -0.623 -0.621
Max. Low 0.959 0.956 0.960 0.953 0.976 0.918 0.957 0.917 0.951 0.960 0.959 0.957F1 Medium 0.910 0.887 0.918 0.892 0.920 0.873 0.910 0.872 0.876 0.921 0.913 0.907
High 0.685 0.640 0.734 0.660 0.853 0.695 0.733 0.640 0.624 0.760 0.760 0.668Diff. -0.273 -0.316 -0.225 -0.292 -0.123 -0.223 -0.223 -0.277 -0.327 -0.199 -0.198 -0.288
Best Low 428 460 460 471 501 364 468 445 489 471 434 458Cluster# Medium 354 472 459 521 504 386 527 454 538 528 665 428
High 919 203 200 221 470 356 643 455 236 236 1404 143Diff. +491 -257 -260 -250 -32 -8 +175 +11 -254 -235 +970 -315
equally robust with respect to the distribution of the errors in thedata except SR, BSR and OCR algorithms from the Ricochet fam-ily which produce clusters of significantly lower quality. This ismainly due to the inability of these algorithms in finding singletonclusters.
Effectiveness in predicting the correct number of clusters.The results of our experiments, partly shown in Tables 3,4 and 5,show that none of the algorithms are capable of accurately pre-dicting the number clusters regardless of the characteristics of thedataset. For uniform datasets, SR algorithms perform extremelywell for finding the correct number of clusters on datasets with dif-ferent amounts of errors. However, this algorithm fails for datasetswith a Zipfian distribution of errors. Overall, algorithms that findstar-shaped clusters, namely CENTER, MERGE-CENTER, Star,CR and OCR algorithms, can effectively find the right number ofdatasets with an optimal threshold. The graph-theoretic algorithmsCorrelation clustering and Markov clustering also find a reasonablenumber of clusters at lower thresholds.
3.4.3 Running TimeAs stated previously, in this work we are focusing mainly on
comparing the quality of the duplicates detected by each algorithm.However we do report the running times in this section, but thetimes taken by the different algorithms are not directly compara-ble, and should be taken as an upper bound on the computationtime. All the implementations (our own and those of others) couldbe optimized further, and more notably for our study, we have nottried to ensure the time optimization is equitable. Different imple-mentations and machines are used to run these experiments. Thetable below shows the running times for 8 of the algorithms run us-ing a dataset of 100K records of DBLP titles described in Section3.1, and with threshold θ = 0.4, giving 386, 068 edges in the sim-ilarity graph. PC1 is a Dell 390 Precision desktop with 2.66 GHzIntel Core2 Extreme Quad-Core Processor QX6700, 4GB of RAMrunning 32-bit Windows Vista. PC2 is an AMD OPTERON 850
2.4GHz, 16 GB of RAM running Red Hat Linux 3.4. PC3 is a DualCore AMD Opteron Processor 270 (2GHz) with 6GB of memoryrunning Red Hat Linux 2.6. Each experiment is run multiple timesto obtain statistical significance.
Algorithm Time Lang./MachinePartitioning 1.790 sec Java/PC1CENTER 3.270 sec Java/PC1MERGE-CENTER 3.581 sec Java/PC1Star 5.9 min Java/PC1CCL 83.5 min Java/PC2MCL 8.395 sec C/PC2MinCut 52.1 min C & Perl/PC3ArtPt. 17.563 sec Perl/PC3
The implementation for the Ricochet algorithms required build-ing a complete similarity graph in memory. Therefore, running thealgorithm on the dataset of 100K records required keeping a graphwith 100 billion edges in memory which was not possible. Wetherefore had to limit the size of the dataset for these experiments.We used a dataset of 5K records with threshold θ = 0.1 resultingin 391,706 edges. The running times are shown in the table below.
Algorithm Time Lang./MachineSR 19.687 sec Java/PC1BSR 54.115 sec Java/PC1CR 9.211 sec Java/PC1OCR 8.972 sec Java/PC1
These results support the scalability of single-pass algorithms aswell as MCL and Articulation Point clustering algorithms. Notethat we used the original implementation of the MCL algorithmwhich is highly optimized. Such an optimized implementation wasnot available for the Correlation Clustering algorithm.
4. SUMMARY AND CONCLUSIONIn this paper we evaluated and compared several unconstrained
clustering algorithms for fuzzy duplicate detection by extensive ex-
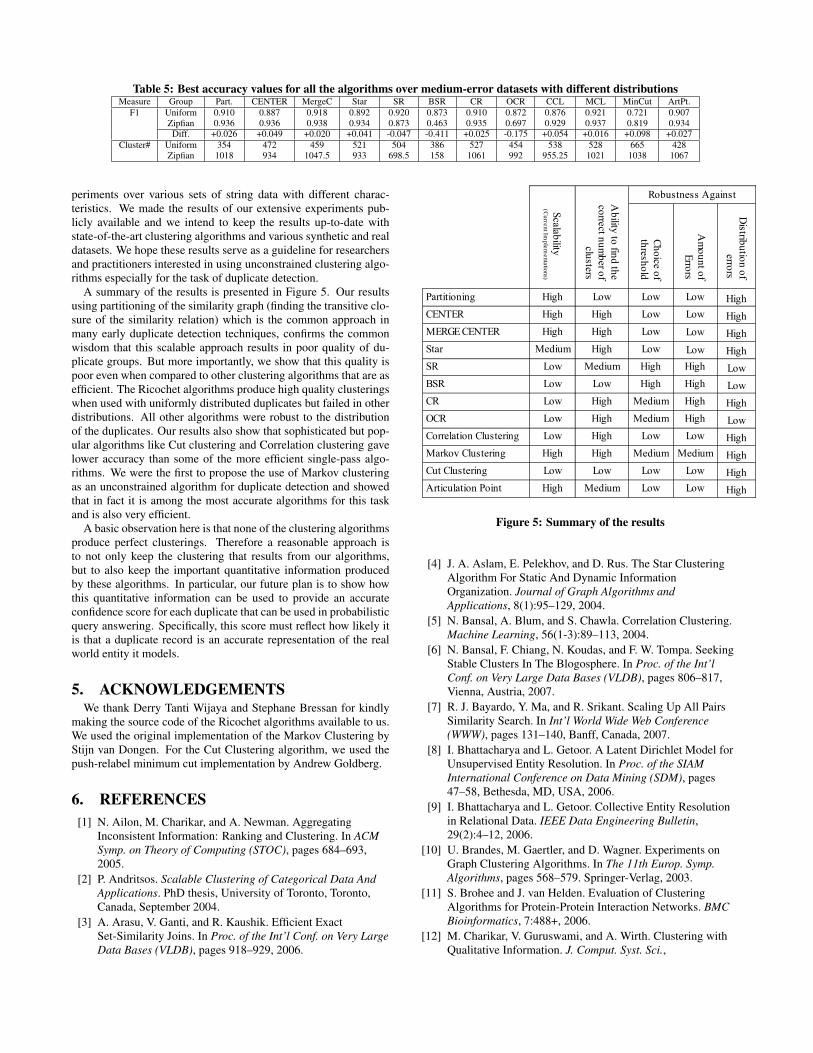
Table 5: Best accuracy values for all the algorithms over medium-error datasets with different distributionsMeasure Group Part. CENTER MergeC Star SR BSR CR OCR CCL MCL MinCut ArtPt.
F1 Uniform 0.910 0.887 0.918 0.892 0.920 0.873 0.910 0.872 0.876 0.921 0.721 0.907Zipfian 0.936 0.936 0.938 0.934 0.873 0.463 0.935 0.697 0.929 0.937 0.819 0.934Diff. +0.026 +0.049 +0.020 +0.041 -0.047 -0.411 +0.025 -0.175 +0.054 +0.016 +0.098 +0.027
Cluster# Uniform 354 472 459 521 504 386 527 454 538 528 665 428Zipfian 1018 934 1047.5 933 698.5 158 1061 992 955.25 1021 1038 1067
periments over various sets of string data with different charac-teristics. We made the results of our extensive experiments pub-licly available and we intend to keep the results up-to-date withstate-of-the-art clustering algorithms and various synthetic and realdatasets. We hope these results serve as a guideline for researchersand practitioners interested in using unconstrained clustering algo-rithms especially for the task of duplicate detection.
A summary of the results is presented in Figure 5. Our resultsusing partitioning of the similarity graph (finding the transitive clo-sure of the similarity relation) which is the common approach inmany early duplicate detection techniques, confirms the commonwisdom that this scalable approach results in poor quality of du-plicate groups. But more importantly, we show that this quality ispoor even when compared to other clustering algorithms that are asefficient. The Ricochet algorithms produce high quality clusteringswhen used with uniformly distributed duplicates but failed in otherdistributions. All other algorithms were robust to the distributionof the duplicates. Our results also show that sophisticated but pop-ular algorithms like Cut clustering and Correlation clustering gavelower accuracy than some of the more efficient single-pass algo-rithms. We were the first to propose the use of Markov clusteringas an unconstrained algorithm for duplicate detection and showedthat in fact it is among the most accurate algorithms for this taskand is also very efficient.
A basic observation here is that none of the clustering algorithmsproduce perfect clusterings. Therefore a reasonable approach isto not only keep the clustering that results from our algorithms,but to also keep the important quantitative information producedby these algorithms. In particular, our future plan is to show howthis quantitative information can be used to provide an accurateconfidence score for each duplicate that can be used in probabilisticquery answering. Specifically, this score must reflect how likely itis that a duplicate record is an accurate representation of the realworld entity it models.
5. ACKNOWLEDGEMENTSWe thank Derry Tanti Wijaya and Stephane Bressan for kindly
making the source code of the Ricochet algorithms available to us.We used the original implementation of the Markov Clustering byStijn van Dongen. For the Cut Clustering algorithm, we used thepush-relabel minimum cut implementation by Andrew Goldberg.
6. REFERENCES[1] N. Ailon, M. Charikar, and A. Newman. Aggregating
Inconsistent Information: Ranking and Clustering. In ACMSymp. on Theory of Computing (STOC), pages 684–693,2005.
[2] P. Andritsos. Scalable Clustering of Categorical Data AndApplications. PhD thesis, University of Toronto, Toronto,Canada, September 2004.
[3] A. Arasu, V. Ganti, and R. Kaushik. Efficient ExactSet-Similarity Joins. In Proc. of the Int’l Conf. on Very LargeData Bases (VLDB), pages 918–929, 2006.
Figure 5: Summary of the results
[4] J. A. Aslam, E. Pelekhov, and D. Rus. The Star ClusteringAlgorithm For Static And Dynamic InformationOrganization. Journal of Graph Algorithms andApplications, 8(1):95–129, 2004.
[5] N. Bansal, A. Blum, and S. Chawla. Correlation Clustering.Machine Learning, 56(1-3):89–113, 2004.
[6] N. Bansal, F. Chiang, N. Koudas, and F. W. Tompa. SeekingStable Clusters In The Blogosphere. In Proc. of the Int’lConf. on Very Large Data Bases (VLDB), pages 806–817,Vienna, Austria, 2007.
[7] R. J. Bayardo, Y. Ma, and R. Srikant. Scaling Up All PairsSimilarity Search. In Int’l World Wide Web Conference(WWW), pages 131–140, Banff, Canada, 2007.
[8] I. Bhattacharya and L. Getoor. A Latent Dirichlet Model forUnsupervised Entity Resolution. In Proc. of the SIAMInternational Conference on Data Mining (SDM), pages47–58, Bethesda, MD, USA, 2006.
[9] I. Bhattacharya and L. Getoor. Collective Entity Resolutionin Relational Data. IEEE Data Engineering Bulletin,29(2):4–12, 2006.
[10] U. Brandes, M. Gaertler, and D. Wagner. Experiments onGraph Clustering Algorithms. In The 11th Europ. Symp.Algorithms, pages 568–579. Springer-Verlag, 2003.
[11] S. Brohee and J. van Helden. Evaluation of ClusteringAlgorithms for Protein-Protein Interaction Networks. BMCBioinformatics, 7:488+, 2006.
[12] M. Charikar, V. Guruswami, and A. Wirth. Clustering withQualitative Information. J. Comput. Syst. Sci.,
71(3):360–383, 2005.[13] S. Chaudhuri, V. Ganti, and R. Motwani. Robust
Identification of Fuzzy Duplicates. In IEEE Proc. of the Int’lConf. on Data Eng., pages 865–876, Washington, DC, USA,2005.
[14] D. Cheng, R. Kannan, S. Vempala, and G. Wang. On aRecursive Spectral Algorithm for Clustering from PairwiseSimilarities. Technical Report MIT-LCS-TR-906, MIT LCS,2003.
[15] F. Chierichetti, A. Panconesi, P. Raghavan, M. Sozio,A. Tiberi, and E. Upfal. Finding Near Neighbors ThroughCluster Pruning. In Proc. of the ACM Symp. on Principles ofDatabase Systems (PODS), pages 103–112, Beijing, China,2007.
[16] W. W. Cohen, P. Ravikumar, and S. E. Fienberg. AComparison of String Distance Metrics for Name-MatchingTasks. In Proceedings of IJCAI-03 Workshop on InformationIntegration on the Web (IIWeb-03), pages 73–78, Acapulco,Mexico, 2003.
[17] T. H. Cormen, C. E. Leiserson, and R. L. Rivest. Introductionto Algorithms. McGraw Hill and MIT Press, 1990.
[18] W. H. Day and H. Edelsbrunner. Efficient Algorithms forAgglomerative Hierarchical Clustering Methods. Journal ofClassification, 1(1):7–24, 1984.
[19] E. D. Demaine, D. Emanuel, A. Fiat, and N. Immorlica.Correlation Clustering In General Weighted Graphs. Theor.Comput. Sci., 361(2):172–187, 2006.
[20] E. A. Dinic. Algorithm for Solution of a Problem OfMaximum Flow in Networks with Power Estimation. SovietMath. Dokl, 11:1277–1280, 1970.
[21] J. Edmonds and R. M. Karp. Theoretical Improvements inAlgorithmic Efficiency for Network Flow Problems. J. ACM,19(2):248–264, 1972.
[22] P. F. Felzenszwalb and D. P. Huttenlocher. EfficientGraph-Based Image Segmentation. Int. J. Comput. Vision,59(2):167–181, 2004.
[23] M. Filippone, F. Camastra, F. Masulli, and S. Rovetta. ASurvey of Kernel and Spectral Methods for Clustering.Pattern Recognition, 41(1):176–190, 2008.
[24] G. W. Flake, R. E. Tarjan, and K. Tsioutsiouliklis. GraphClustering and Minimum Cut Trees. Internet Mathematics,1(4):385–408, 2004.
[25] L. Ford and D. Fulkerson. Maximal Flow Through aNetwork. Canadian J. Math, 8:399–404, 1956.
[26] D. Gibson, R. Kumar, and A. Tomkins. Discovering LargeDense Subgraphs in Massive Graphs. In Proc. of the Int’lConf. on Very Large Data Bases (VLDB), pages 721–732,2005.
[27] A. V. Goldberg and R. E. Tarjan. A New Approach to theMaximum-Flow Problem. Journal of the ACM,35(4):921–940, 1988.
[28] M. Halkidi, Y. Batistakis, and M. Vazirgiannis. On clusteringvalidation techniques. journal, 17(2-3):107–145, 2001.
[29] O. Hassanzadeh. Benchmarking Declarative ApproximateSelection Predicates. Master’s thesis, University of Toronto,February 2007.
[30] O. Hassanzadeh and R. J. Miller. Probabilistic Managementof Duplicated Data. Technical Report CSRG-568, Universityof Toronto, October 2007.
[31] O. Hassanzadeh, M. Sadoghi, and R. J. Miller. Accuracy ofApproximate String Joins Using Grams. In Proc. of the
International Workshop on Quality in Databases (QDB),pages 11–18, Vienna, Austria, 2007.
[32] T. H. Haveliwala, A. Gionis, and P. Indyk. ScalableTechniques for Clustering the Web. In Proc. of the Int’lWorkshop on the Web and Databases (WebDB), pages129–134, Dallas, Texas, USA, 2000.
[33] M. A. Hernandez and S. J. Stolfo. Real-world Data is Dirty:Data Cleansing and The Merge/Purge Problem. Data Miningand Knowledge Discovery, 2(1):9–37, 1998.
[34] L. J. Heyer, S. Kruglyak, and S. Yooseph. ExploringExpression Data: Identification and Analysis of CoexpressedGenes. Genome Res., 9(11):1106–1115, 1999.
[35] A. Jain and R. Dubes. Algorithms for Clustering Data.Prentice Hall, 1988.
[36] A. K. Jain, M. N. Murty, and P. J. Flynn. Data Clustering: AReview. ACM Computing Surveys, 31(3):264–323, 1999.
[37] R. Kannan, S. Vempala, and A. Vetta. On clusterings: Good,bad and spectral. Journal of the ACM, 51(3):497–515, 2004.
[38] Y. J. Kim and J. M. Patel. A Framework for Protein StructureClassification and Identification of Novel Protein Structures.BMC Bioinformatics, 7:456+, 2006.
[39] A. D. King. Graph Clustering with RestrictedNeighbourhood Search. Master’s thesis, University ofToronto, 2004.
[40] J. Kogan. Introduction to Clustering Large andHigh-Dimensional Data. Cambridge Univ. Press, 2007.
[41] C. Li, B. Wang, and X. Yang. VGRAM: ImprovingPerformance of Approximate Queries on String CollectionsUsing Variable-Length Grams. In Proc. of the Int’l Conf. onVery Large Data Bases (VLDB), pages 303–314, Vienna,Austria, 2007.
[42] A. M. D. Pelleg. X-Means: Extending K-Means withEfficient Estimation of the Number of Clusters. InProceedings of the Seventeenth International Conference onMachine Learning, pages 727–734, San Francisco, CA,USA, 2000.
[43] S. Sarawagi and A. Kirpal. Efficient Set Joins On SimilarityPredicates. In ACM SIGMOD Int’l Conf. on the Mgmt. ofData, pages 743–754, Paris, France, 2004.
[44] N. Slonim. The Information Bottleneck: Theory AndApplications. PhD thesis, The Hebrew University, 2003.
[45] C. Swamy. Correlation Clustering: Maximizing AgreementsVia Semidefinite Programming. In Proceedings of the AnnualACM-SIAM Symposium on Discrete Algorithms (SODA),pages 526–527, New Orleans, Louisiana, USA, 2004.
[46] C. Umans. Hardness of Approximating Sigma2p
Minimization Problems. In Symp. on Foundations ofComputer Science (FOCS), pages 465–474, 1999.
[47] S. van Dongen. Graph Clustering By Flow Simulation. PhDthesis, University of Utrecht, 2000.
[48] J. A. Whitney. Graph Clustering With Overlap. Master’sthesis, University of Toronto, 2006.
[49] D. T. Wijaya and S. Bressan. Ricochet: A Family ofUnconstrained Algorithms for Graph Clustering. In Proc. ofthe Int’l Conf. on Database Systems for AdvancedApplications (DASFAA), pages 153–167, Brisbane, Australia,2009.
[50] R. Xu and I. Wunsch. Survey of clustering algorithms. IEEETransactions on Neural Networks, 16(3):645–678, 2005.
[51] J. Zupan. Clustering of Large Data Sets. Research StudiesPress, 1982.


![Oktie Hassanzadeh Mariano Consens - Linked dataevents.linkeddata.org/ldow2009/slides/ldow2009-slides-hassanzadeh... · [Tutorial-VLDB05] Approximate Joins: Concepts and Techniques](https://img.dokumen.tips/doc/110x75/5b3fe8497f8b9a3a138ca90d/oktie-hassanzadeh-mariano-consens-linked-tutorial-vldb05-approximate-joins.jpg)