Embed Size (px)
Citation preview

Smallholder Farmer Market Segmentation ToolkitHow and why the Toolkit was developed, and lessons learnt from its
application in the Mopani and Umkhanyakude districts in South Africa
FOSTERING COLLABORATION AND INNOVATION

SMALLHOLDER FARMER MARKET SEGMENTATION TOOLKITii
Title: Smallholder Farmer Market Segmentation Toolkit: How and why the Toolkit was developed, and lessons learnt from its application in the Mopani and Umkhanyakude districts in South Africa
Published: August 2016 by the Southern Africa Food Lab
Authors: Candice Kelly, Anri Manderson, and Thulisile Khoza
Copy editing: Dick Cloete
Design: BrandFoundry.co.za
Please cite this document as follows: The Southern Africa Food Lab (SAFL). 2016. Smallholder Farmer Market Segmentation Toolkit: How and why the Toolkit was developed, and lessons learnt from its application in the Mopani and Umkhanyakude districts in South Africa. University of Stellenbosch, Faculty of AgriSciences: SAFL’s Supporting Smallholder Agriculture Programme.
Copyright: The Southern African Food Lab gives permission for excerpts from this report to be photocopied or reproduced provided that the source is clearly and properly acknowledged.
The Toolkit is also freely available. Please contact the Southern Africa Food Lab to discuss the terms and conditions linked to its usage.
More information: A graphic animation about the Toolkit is also available at: www.youtube.com/watch?v=DLDtAvrvtPQ.

SMALLHOLDER FARMER MARKET SEGMENTATION TOOLKIT 1
Abbreviations
LFPM local farm produce market
NAMC National Agricultural Marketing Council
NFPM national farm produce market
SAFL Southern Africa Food Lab
Table of ContentsIntroduction 2
The Research Process that Led to Developing the Toolkit 4
Results from the Surveys 11
Smallholder Farmer Profiles 12
Recommendations & Conclusions 16
References 17
SMALLHOLDER FARMER MARKET SEGMENTATION TOOLKIT2
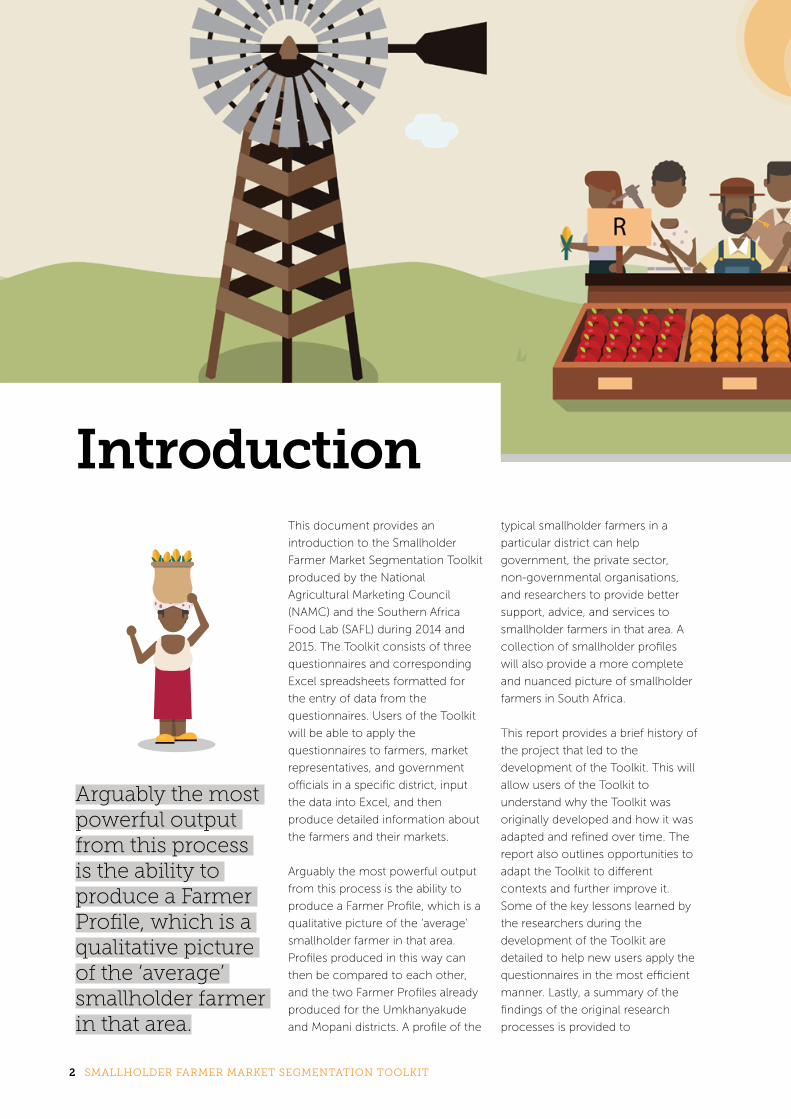
This document provides an
introduction to the Smallholder
Farmer Market Segmentation Toolkit
produced by the National
Agricultural Marketing Council
(NAMC) and the Southern Africa
Food Lab (SAFL) during 2014 and
2015. The Toolkit consists of three
questionnaires and corresponding
Excel spreadsheets formatted for
the entry of data from the
questionnaires. Users of the Toolkit
will be able to apply the
questionnaires to farmers, market
representatives, and government
officials in a specific district, input
the data into Excel, and then
produce detailed information about
the farmers and their markets.
Arguably the most powerful output
from this process is the ability to
produce a Farmer Profile, which is a
qualitative picture of the ‘average’
smallholder farmer in that area.
Profiles produced in this way can
then be compared to each other,
and the two Farmer Profiles already
produced for the Umkhanyakude
and Mopani districts. A profile of the
typical smallholder farmers in a
particular district can help
government, the private sector,
non-governmental organisations,
and researchers to provide better
support, advice, and services to
smallholder farmers in that area. A
collection of smallholder profiles
will also provide a more complete
and nuanced picture of smallholder
farmers in South Africa.
This report provides a brief history of
the project that led to the
development of the Toolkit. This will
allow users of the Toolkit to
understand why the Toolkit was
originally developed and how it was
adapted and refined over time. The
report also outlines opportunities to
adapt the Toolkit to different
contexts and further improve it.
Some of the key lessons learned by
the researchers during the
development of the Toolkit are
detailed to help new users apply the
questionnaires in the most efficient
manner. Lastly, a summary of the
findings of the original research
processes is provided to
Introduction
Arguably the most powerful output from this process is the ability to produce a Farmer Profile, which is a qualitative picture of the ‘average’ smallholder farmer in that area.

SMALLHOLDER FARMER MARKET SEGMENTATION TOOLKIT 3
demonstrate the Farmer Profiles that
can be produced via the application
of the Toolkit. It is vital that the
Toolkit is not seen as a finalised
entity, but rather as the starting
point for collaboration and
innovation between researchers
across the country. This report
could thus also be read as a case
study.
Motivation for Developing the ToolkitThe impetus for the development of
the Toolkit was twofold. Firstly
market access for market-orientated
smallholder farmers is poorly
understood. There is a wealth of
analysis on the barriers that
smallholder farmers face in trying to
access formal markets, like national
retailers1, but very little information
on which markets they currently
penetrate and what their relationship
with these markets are. There are
also few studies about alternative
and informal markets that may offer
There is a wealth of analysis on the barriers that smallholder farmers face in trying to access formal markets, like national retailers, but very little information on which markets they currently penetrate and what their relationship with these markets are.
further opportunity for growth, and
be more appropriate for
smallholders. The Toolkit was thus
designed to collect more data about
smallholder farmers’ market
segmentation.
Secondly, both the SAFL and the
NAMC are working to understand
how best to support market-
orientated smallholder farmers to
improve their livelihoods, yet very
little synthesised and comparable
data exists about these farmers.
Available information about
smallholder farmers held by
commodity organisations or
government entities is often
disjointed and normally limited to
small capitalist farmers, or what
Cousins and Chikazunga (2013)
define as small-scale capitalist
farmers. Therefore it became clear
that the first step in understanding
how best to support smallholder
farmers to increase their market
access was to collect more data
about them.
1 Ortman and King (2010) provide a good summary of research prior to 2010.

SMALLHOLDER FARMER MARKET SEGMENTATION TOOLKIT4
Category 1: Subsistence- oriented smallholders
Category 2: Market-oriented smallholders in loose value chains
Category 3: Market-oriented smallholders in tight value chains
Category 4: Small-scale capitalist farmers
Objective of production
Household consumption Household consumption + cash income
Cash income + some home consumption
Profit
Proportion of marketed output
None or insignificant 50% or more 75% or more 100%
Contribution to household income
Reduces expenditure on food
Variable – from small to significant
Significant Very significant
Labour Family Family + some hired Family + significant
numbers hired Hired
Mechanisation Very low Low Medium to high High
Capital intensity Very low Low Medium to high High
Access to finance Absent Some Significant Very significant
Numbers in SA 2–2.5 million hh 200–250 000 hh 5 000? 5 000?2
Table 1: Typology of smallholders in South Africa
The Research Process that Led to Developing the Toolkit
The SAFL has focused on supporting smallholders for a number of years
and learned there was a lack of clear information about the numbers of
smallholder farmers and few attempts to categorise them. The SAFL thus
embarked on a project with the Institute for Poverty, Land and Agrarian
Studies (PLAAS) at the University of the Western Cape. One of the outcomes
of this project was a categorisation of smallholder farmers (Cousins and
Chikazunga 2013), which is shown below in Table 1. These categories
inform all the smallholder work of the SAFL.
...there was a lack of clear information about the numbers of smallholder farmers...
For the market segmentation study
the SAFL decided to focus on
smallholders who fit into categories
2 and 3, essentially combining them
to form a new category called
‘market-oriented smallholder
farmers in loose and tight value
chains’. The reason for choosing
this group was because those in
category 1 are subsistence farmers
and currently consuming most of
Source: Cousins and Chikazunga, 2013
2 Cousins has since updated the farmer numbers suggesting that those in each of the two most market oriented categories number an estimated 5 000 farmers.
their produce within the household,
while those in category 4 are
already moderately successful
commercial farmers. In other words,
categories 2 and 3 would arguably
request the most assistance in
accessing markets.
At the same time, government had
requested the NAMC to provide
information about smallholder
farmers and markets. Since both the
SAFL and NAMC were attempting to
produce more data on smallholder
farmer market access, they agreed
to collaborate in this undertaking.
The NAMC would be able to include
the SAFL research in Umkhanyakude
in policy briefs to the Department of
Agriculture, Forestry, and Fisheries
(DAFF), whilst the SAFL gained

SMALLHOLDER FARMER MARKET SEGMENTATION TOOLKIT 5
valuable knowledge from the NAMC
on how to best design and present
research to influence policy.
As is their policy, the NAMC
established a research reference
group comprised of the SAFL,
independent scholars, and
consultants. This group reviewed
three draft questionnaires developed
by the SAFL: one each for farmers,
government officials and markets.
These questionnaires asked mostly
open-ended questions.
Due to time constraints, the NAMC
then applied the farmer
questionnaire in the Mopani district
of Limpopo, whilst the SAFL used
the three questionnaires in a pilot
study in the Umkhanykude district of
KwaZulu-Natal to collect data to
refine the questionnaires to the
closed-ended questions now in the
questionnaires. Nevertheless, the
kinds of information sought via the
questionnaires have remained
largely unchanged.
1. The farmer questionnaire asks
farmers for some basic
demographic information, as well
as information on their farm, the
crops they grow, the challenges
they face in production, and then
on the markets they currently
serve, and the challenges they
face in marketing their produce.
2. The government questionnaire is
aimed at government officials
who work with smallholder
farmers, and asks about the type
of assistance they provide to
smallholders, before zooming in
to ask more specifically about
market access of smallholders.
Officials are asked to express
their opinions on the challenges
smallholders face and potential
market segments that could be
further developed.
3. The market questionnaire
samples any market actor selling
fresh produce. Market actors are
asked what percentage of their
products comes from various
types of suppliers and the
requirements they use to
determine which suppliers to buy
from. They are asked about the
contract types and payment
terms they apply to commercial
and smallholder farmers, as well
as their opinions on the
challenges that smallholders face
in supplying markets.
A NAMC reference group reviewed three draft questionnaires developed by the SAFL: one each for farmers, government officials and markets.

SMALLHOLDER FARMER MARKET SEGMENTATION TOOLKIT6
The SAFL and NAMC decided that,
for this first round of data collection,
they would only apply the draft
questionnaires to smallholder
farmers growing a variety of fresh
produce (fruit and vegetables). The
largest number of market-orientated
smallholder farmers in loose and
tight value chains tend to farm with
a variety of fresh produce instead of
focusing on just one crop. The
questionnaire allowed farmers to
indicate if they farmed with
livestock, but of those interviewed,
very few did. In future, it would be
possible to adapt the questionnaires
to profile farmers who focus on
specific crops, for example
potatoes, or to profile livestock
farmers.
The SAFL applied the questionnaires
in Umkhanyakude district in
KwaZulu-Natal over seven months
from October 2014 to April 2015.
The SAFL chose Umkhanyakude
district, because it already had links
there with the Lima Rural
Development Foundation. A Lima
representative initially applied the
draft questionnaire from the NAMC
reference group to eight
smallholder farmers, five market
representatives and two government
officials.
Data collected during this pilot study
phase picked up a number of issues
with the sampling criteria used to
identify smallholder farmers eligible
for the study, as well as categories
missing from the available answers
in the questionnaire. Lima and the
SAFL refined the questionnaire and
more enumerators were trained in
how to administer it, before the
main data collection phase began.
These refined questionnaires took a
survey-type approach, where most
questions had various categories of
answers that farmers, officials or
market actors could choose from,
and a more open-ended category
(usually called ‘Other’) if they had an
answer that did not fit into a
predetermined category. The
purpose of creating more closed
answer options was to simplify data
capturing and analysis later during
the research process. Users will find
that the Excel spreadsheets that are
included in the Toolkit have been
structured to speed up and
streamline data capture.
In the main phase of data collection,
the following interviews took place:
161 smallholders from Jozini and
Mtubatuba, 24 market
representatives from Ingwavuma,
Jozini, and Mtubatuba; as well as
five government officials (including
two extension officers). The data
were collected and analysed in
Excel.
Due to time constraints, the NAMC
skipped a pilot study and chose to
apply the draft questionnaires in the
Giyani and Tzaneen areas of the
Mopani district in Limpopo. Data
collection started in August 2014
and the final report was completed
in June 2015. They interviewed 135
smallholder farmers, collecting the
data in Excel before transferring it
into the data analysis software,
STATA (Version 13). The NAMC also
interviewed ten agricultural
extension staff and two economists,
and collected market survey data
from 20 market representatives in
two municipalities. They chose to
apply the market and government
questionnaires more loosely,
following the questions as an
interview guideline instead of
completing the questionnaires.
Although the NAMC and SAFL
applied the questionnaires slightly
differently, the two organisations
have since spent a large amount of
time comparing their approaches
and results, in order to create
profiles of ‘typical’ smallholder
farmers for each area studied. They
have also adjusted the
questionnaires and Excel database
templates based on their learning
during the research process. The
Toolkit now includes the
questionnaires and Excel database
templates that were refined and
agreed on by the NAMC and SAFL.
The largest number of market-orientated smallholder farmers in loose and tight value chains tend to farm with a variety of fresh produce instead of focusing on just one crop.

SMALLHOLDER FARMER MARKET SEGMENTATION TOOLKIT 7
Given the lack of
information
about the total number of
smallholders in a district, it is
extremely difficult to draw a profile
of a ‘typical’ farmer that could be
said to represent the whole
population of farmers in a particular
district. This would require drawing
a representative sample based on
statistical significance, which would
require knowledge of the total
number of farmers in the district
who fall into the sampling criteria.
In situations
where the total
number of smallholders in a district
is not known, farmer profiles
created via the questionnaires can
only be regarded as typical of the
particular sample of farmers that
were interviewed in each area within
that district. Users of the Toolkit
must not try to draw inferences for
the entire smallholder population of
the districts they survey without the
participation of a statistician and
they must ensure that users of the
profiles understand that non-
representative profiles cannot be
generalised across an entire district.
Trying to apply a
‘strict’ definition
of ‘market-oriented smallholders in
loose and tight value chains’ would
leave too many smallholders out of
the sample. In Umkhanyakude, the
SAFL tried to ascertain whether
smallholders fitted into this category
before the questionnaire could be
applied. Many smallholders
identified themselves as farmers
when asked, but failed on the
criteria of ‘selling half (or more) of
their produce’. This was because
many of them had not planted
anything recently, for various
reasons including the drought, but
had been farming with the aim of
selling half their produce in the
recent past. Realising that the
criteria had to be relaxed the SAFL
changed them to whether
smallholders had intended to sell
over half their produce any time in
the last 36 months.
Users of the
Toolkit should be
sensitive to possibly relaxing
sampling criteria if necessary,
although it would be advisable to
consult the SAFL and NAMC when
considering this option. It is also
important to be explicit about
sampling criteria in final research
reports.
Lessons learnt during the sampling process
Identifying
smallholder
farmers to participate in the survey
can be challenging. Most local
government structures do not have
updated records of the number of
smallholders in the area, nor their
contact details.
Users of the
Toolkit should
first approach local government
structures to find out if there are any
records of smallholder farmers in
the area. However, if these records
do not exist, local organisations that
work with smallholders could be
approached. These organisations
can provide information on the
location of smallholder farmers in a
particular area, and may also be able
to facilitate introductions. In some
districts, secondary or tertiary
cooperatives may also be able to
link researchers to smallholder
farmers.
Lesson 1: Lesson 2: Lesson 3:
Implications:
Implications:
Implications:
Most local government structures do not have updated records of the number of smallholders in the area, nor their contact details.

SMALLHOLDER FARMER MARKET SEGMENTATION TOOLKIT8
Because
smallholder
farmers are diverse, users of the
Toolkit may choose to use Cousins
and Chikazunga’s (2013) categories
during the sampling process, or to
categorise smallholder farmer data
once collected.
Depending on
the user’s
research question, these categories
could be used to determine which
category of smallholder farmers to
target – noting that the largest
categories are subsistence farmers
and those in loose value chains. If
the user wants to test the validity of
these categories, or determine the
number of farmers belonging to
each category in a specific district
or specified area, the categories will
be helpful to organise the data
during analysis.
During both the
pilot phase of
the study and the main data
collection with smallholders, users
can ask smallholders which are the
best areas for selling their produce,
or for names and contact details of
market representatives they have
worked with before.
It is also necessary to conduct
interviews with market
representatives who do not
currently purchase produce from
smallholder farmers. The views of
these representatives are useful in
understanding the market access
challenges faced by local
smallholder farmers. The market
questionnaire is set up to
accommodate both types of market
representatives.
Remember that the types of markets
can include national retailers, local
retailers, spaza shop owners, bakkie
traders, hawkers, the hospitality
sector, and even government-
related activities like feeding
schemes (schools and hospitals)
and food parcels.
In certain
districts, many
smallholder farmers may in fact be
women. These female farmers may
not always be the head of a
household, and the household head
may not always be the primary
farmer.
When visiting
residential
dwellings to find smallholders to
interview, users of the Toolkit should
ensure they insist on speaking with
the farmer, and avoid asking to
interview the ‘head of the
household’.
Smallholder
farmers can help
to identify the right market
representatives to interview. The
SAFL found it challenging to find
market representatives willing to be
interviewed and had to use a
‘convenience sampling’ approach –
interviewing whoever was willing.
Lesson 4:
Lesson 5:
Implications:
Implications:
Implications:
Lesson 6:
...users can ask smallholders which are the best areas for selling their produce, or for names and contact details of market representatives they have worked with before.

SMALLHOLDER FARMER MARKET SEGMENTATION TOOLKIT 9
Enumerators
should be
capable of explaining questions in
ways that allow interviewees to
understand what is being asked of
them and express their answers
clearly. For example, the Lima
representative who conducted
surveys for the SAFL study found
that some farmers struggled to
express what percentage of their
total produce they supply to each
type of market. He found that using
ten rocks to represent the total
produce allowed interviewees to
show how much they produced of
each crop (such as tomatoes or
onions) and how much of it they
directed to each market. It would
also be useful to produce a resource
pack of visual aids for enumerators
including small cut out drawings on
cardboard of various crops for
example maize and pumpkins.
Again, a pilot
study could be
useful to help identify the particular
questions that may require
additional methods of explanation.
Additional notes on pilot
questionnaires proved especially
useful for discussing these issues.
Enumerators need not only to be
fluent in the local language, but
must also be sensitised to the need
for adaptability. Daily
communication between
enumerators and the study leader
should be scheduled to allow
enumerators to raise issues with
questions and share ideas about
how to explain questions in ways
that farmers can understand.
Sometimes,
interviewees give
answers that do not fit neatly into a
category. In these cases, the
enumerator may choose the ‘Other’
option, but should be careful to
record as much additional
information as possible to explain
the interviewee’s answer. This
makes it much easier for the next
stage of the process, namely
entering the data into the Excel
spreadsheet for analysis. It could
potentially also inform the
development of an additional
answer category to a specific
question.
Enumerators
should always
add as much commentary to survey
response forms as possible, to assist
those capturing responses into
Excel to make sense of the data,
and to alert them to the possibility
that the question may have been
handled differently to normal.
Lessons learnt during the data collection process
Doing a pilot
survey is a very
useful exercise. The SAFL discovered
that the sampling criteria needed to
be relaxed to ensure enough
smallholders would be included.
They also discovered certain
categories of answers had to be
added to particular questions to
enable easier data capturing and
analysis later. For anyone wishing to
profile smallholder farmers focused
on specific commodities such as
livestock, it would be essential to do
a pilot study and adapt the
questionnaires accordingly.
Ensure that a
small pilot survey
is conducted before launching into
larger-scale data collection. If users
feel that the questionnaire may
need to be adapted, they then have
the opportunity to consult with the
NAMC and SAFL before doing so. It
also provides an opportunity to train
enumerators properly to deal with
context-specific issues in
administering the questionnaires.
Lesson 1:
Lesson 2: Lesson 3:
Implications:
Implications:
Sometimes, interviewees give answers that do not fit neatly into a category.
Implications:
SMALLHOLDER FARMER MARKET SEGMENTATION TOOLKIT10
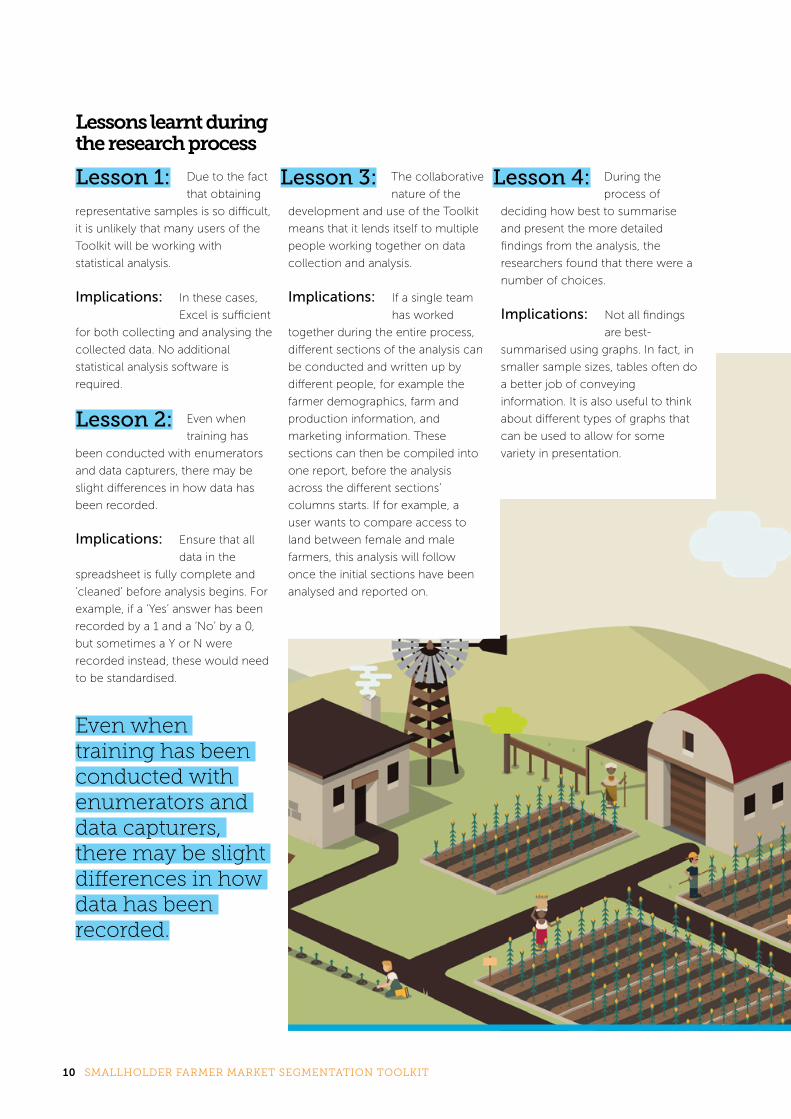
Lessons learnt during the research process
Due to the fact
that obtaining
representative samples is so difficult,
it is unlikely that many users of the
Toolkit will be working with
statistical analysis.
In these cases,
Excel is sufficient
for both collecting and analysing the
collected data. No additional
statistical analysis software is
required.
Even when
training has
been conducted with enumerators
and data capturers, there may be
slight differences in how data has
been recorded.
Ensure that all
data in the
spreadsheet is fully complete and
‘cleaned’ before analysis begins. For
example, if a ‘Yes’ answer has been
recorded by a 1 and a ‘No’ by a 0,
but sometimes a Y or N were
recorded instead, these would need
to be standardised.
The collaborative
nature of the
development and use of the Toolkit
means that it lends itself to multiple
people working together on data
collection and analysis.
If a single team
has worked
together during the entire process,
different sections of the analysis can
be conducted and written up by
different people, for example the
farmer demographics, farm and
production information, and
marketing information. These
sections can then be compiled into
one report, before the analysis
across the different sections’
columns starts. If for example, a
user wants to compare access to
land between female and male
farmers, this analysis will follow
once the initial sections have been
analysed and reported on.
During the
process of
deciding how best to summarise
and present the more detailed
findings from the analysis, the
researchers found that there were a
number of choices.
Not all findings
are best-
summarised using graphs. In fact, in
smaller sample sizes, tables often do
a better job of conveying
information. It is also useful to think
about different types of graphs that
can be used to allow for some
variety in presentation.
Lesson 1: Lesson 3: Lesson 4:
Lesson 2:
Implications: Implications:Implications:
Implications:
Even when training has been conducted with enumerators and data capturers, there may be slight differences in how data has been recorded.
SMALLHOLDER FARMER MARKET SEGMENTATION TOOLKIT 11
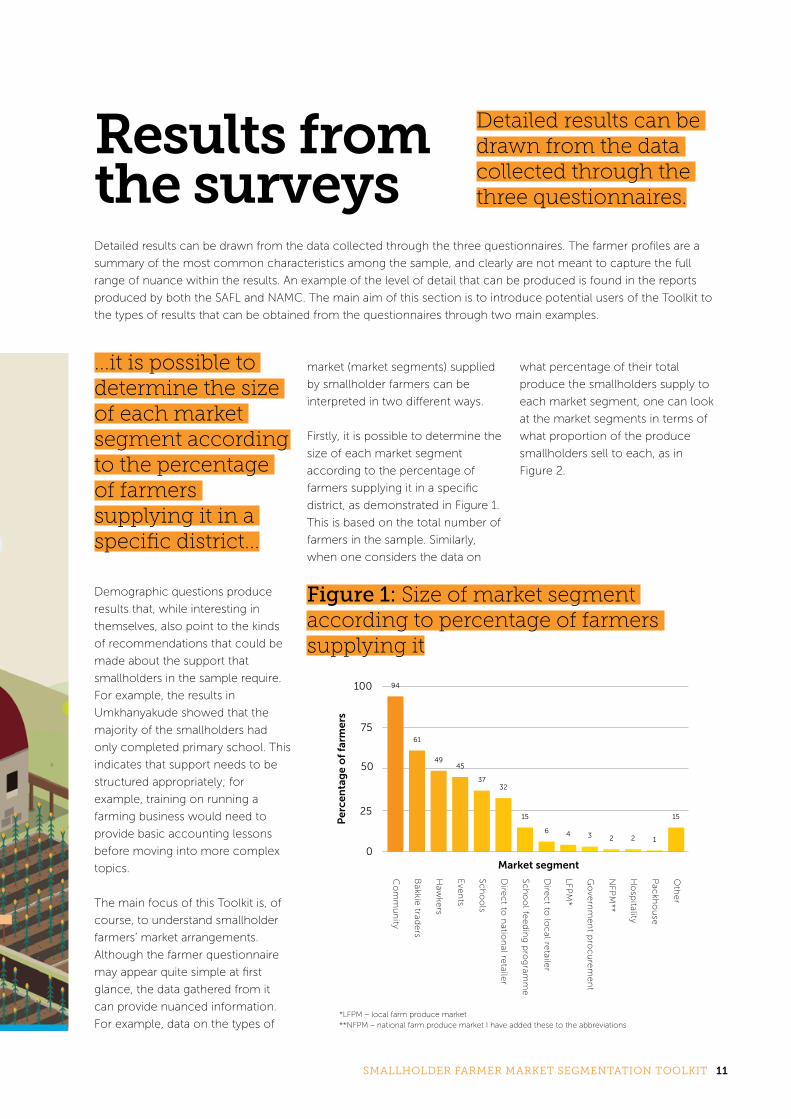
Results from the surveysDetailed results can be drawn from the data collected through the three questionnaires. The farmer profiles are a
summary of the most common characteristics among the sample, and clearly are not meant to capture the full
range of nuance within the results. An example of the level of detail that can be produced is found in the reports
produced by both the SAFL and NAMC. The main aim of this section is to introduce potential users of the Toolkit to
the types of results that can be obtained from the questionnaires through two main examples.
Demographic questions produce
results that, while interesting in
themselves, also point to the kinds
of recommendations that could be
made about the support that
smallholders in the sample require.
For example, the results in
Umkhanyakude showed that the
majority of the smallholders had
only completed primary school. This
indicates that support needs to be
structured appropriately; for
example, training on running a
farming business would need to
provide basic accounting lessons
before moving into more complex
topics.
The main focus of this Toolkit is, of
course, to understand smallholder
farmers’ market arrangements.
Although the farmer questionnaire
may appear quite simple at first
glance, the data gathered from it
can provide nuanced information.
For example, data on the types of
...it is possible to determine the size of each market segment according to the percentage of farmers supplying it in a specific district...
Detailed results can be drawn from the data collected through the three questionnaires.
market (market segments) supplied
by smallholder farmers can be
interpreted in two different ways.
Firstly, it is possible to determine the
size of each market segment
according to the percentage of
farmers supplying it in a specific
district, as demonstrated in Figure 1.
This is based on the total number of
farmers in the sample. Similarly,
when one considers the data on
what percentage of their total
produce the smallholders supply to
each market segment, one can look
at the market segments in terms of
what proportion of the produce
smallholders sell to each, as in
Figure 2.
Figure 1: Size of market segment according to percentage of farmers supplying it
*LFPM – local farm produce market **NFPM – national farm produce market I have added these to the abbreviations

SMALLHOLDER FARMER MARKET SEGMENTATION TOOLKIT12
Figure 2: Size of market segments according to produce supplied by farmers
Reading these interpretations
together provides interesting
insights. Such as the fact that, while
direct sales to national retailers is
the sixth largest segements in terms
of the number of farmers supplying
it (see Figure 1), when looking at
Figure 2, one can see that the total
amount of produce being sold
directly to national retailers make it
the third largest segment. Fewer
smallholder farmers thus have
access to national retailers, yet sell
significant quantities of produce to
this segment. Recommendations on
how to support farmers need to be
made with a full view of the
nuances within the data.
In their report on the results of the
Mopani and Umkhanyakude
research, the SAFL and NAMC
produced the following profiles of
the ‘typical’ farmer in their particular
samples in each district:
Smallholder Farmer Profiles
A smallholder farmer in Mopani typically does not have access to formal loans.
Recommendations on how to support farmers need to be made with a full view of the nuances within the data.
Farmer Profile: Mopani District (developed by NAMC)A typical smallholder farmer in
Mopani is a male between the ages
of 40 and 60. He has completed
primary school and has a bit of
secondary education with five or
less years of farming experience.
He has a permission to occupy an
average of 12 ha of which he uses
1.5 ha to 5 ha for producing fruits
and vegetables. He employs family
labour as general workers to reduce
labour costs. He does not pay for
water rights, but has access to
irrigation water. Without irrigation
infrastructure the irrigation water is
useless to him, and so he chooses
to use a borehole as a source of
water for watering.
The farmer does not have access to
formal loans. He uses his own
savings and government grants for
purchasing production inputs for his
farm. The main objective for
production is income, although a
The detailed results obtained can be
used for different purposes, and the
SAFL and NAMC used them to
produce the profiles of ‘typical’
smallholder farmers in their
respective samples, as well as to
produce a set of recommendations
on how best to support
smallholders to better access
markets.

SMALLHOLDER FARMER MARKET SEGMENTATION TOOLKIT 13
requirements such as food safety
standards. The informal market also
improves his cash flow. He aspires
to supply retailers, school feeding
programmes, and hospitals.
He is not part of any commodity
association because he feels there is
no link between these associations
and new markets. Other than the
production challenges mentioned
earlier and no formal commodity
representation, other barriers to
more formal market segments
include lack of transportation, and
stringent standard and quantity
requirements.
The average Mopani farmer has completed primary school and has a bit of secondary education with five or less years of farming experience.
little is also consumed by his
household. He generates a gross
annual farm income of between
R30 000 and R50 000, which he
uses to support a household of six
people. He is not necessarily the
breadwinner of this household.
He is dependent on government
departments for institutional support
such as technical production
information, conducting research,
food safety information, and
marketing information. Government
extension officers are thus his main
source of information and support.
He experiences an average loss of
20 per cent on vegetables and 7 per
cent on fruit production with
weather being the main reason for
loss.
He markets 50 to 75 per cent of
what he produces. The farmer
sends a larger portion of his
produce to the informal market
(bakkie traders, hawkers and local
community), but also some to
national fresh produce markets
(NFPMs). He only has formal
agreements in place with the
NFPMs. He prefers selling his
produce to the NFPMs when he can
collectively market to them with
other smallholder farmers.
Nevertheless, to reduce transaction
costs, he also sells to the informal
market that does not have stringent
Farmer Profile: Umkhanyakude District (developed by SAFL)A typical smallholder farmer in
Umkhanyakude is female and
between the ages of 40 and 60. She
is the breadwinner of a household
with approximately 10 people of
whom four are under 18 years. She
has most likely completed at least
primary school and has one to five
years farming experience.
She has permission to farm on a
plot of 0.5 ha or smaller that forms
part of tribal land. The plot is
primarily used for farming on a
full-time basis for cash income first,
and then to provide supplementary
food to her household. By farming
on her plot the farmer annually
earns less than R30 000. She has
access to informal loans, including
her own savings and to receiving
financial support through
government grants.
The farmer most likely grows
vegetables for commercial
purposes, of which maize makes up
a large quantity. Water is most likely
accessed from a river without an
irrigation system (including pumps),
but if accessed from a dam, she is
more likely to use an irrigation
system. She experiences annual
crop losses due to insect, irrigation,
and weather challenges, in that
order. Generally, the farmer employs
temporary female labour and family
members, including children when
they are not in school.
The female farmer does not belong
to a commodity organisation, but
most likely forms part of a primary
co-operative, which provides her
with opportunities to share
information, market and sell
collectively, and buy inputs in bulk.
She will only receive support in the
form of inputs and advice if she
really needs it. This support
generally comes from government

SMALLHOLDER FARMER MARKET SEGMENTATION TOOLKIT14
extension officers, although the
quality and consistency of said
support is undetermined.
Together with most of her fellow
farmers, she sells her produce to
neighbours or local communities
followed by bakkie traders, hawkers
and directly to retailers. In terms of
quantities, however, she sells most
vegetables to neighbours or local
communities and bakkie traders.
She thus mostly engages with the
informal sector, and only sometimes
with the formal sector when selling
directly to supermarkets and
government initiatives. Her markets
consider quality and price to be the
main considerations when buying
from any supplier, and buy
specifically from her because she
offers quality produce at
competitive prices, and because she
is flexible. She may, however, be
exploited in terms of pricing, as she
sells her produce in crates and not
by weight.
Whether with formal or informal
market segments, the market
arrangements she has are mostly
driven by flexibility, distances from
markets, and having established
relationships with specific markets.
The arrangements are generally
informal including a variety of
transport methods. The reason for
not having formal arrangements is
due to small, inconsistent
production outputs of vegetables of
limited variety. She may have formal
arrangements, which would most
likely be through a mediator such as
a government extension officer,
who is also likely to provide her with
marketing support. She is paid cash
on delivery.
She markets her vegetables by
producing better quality produce
and actively trying to convince
buyers to buy from her. She also
does market research by speaking
to neighbouring farmers and
government representatives. Her
preparation of produce for markets
involves a combination of washing,
grading, and packing produce. She
is aware of food safety standards
and complies with them by using
responsible and/or agro-ecological
methods on her farm. Although she
has received training in certification
standards, she is most likely not
certified, because she lacks
knowledge and/or sufficient training
to reach full compliance with all
official standards.
Her markets buy most of their
produce from intermediaries,
including bakkie traders and
hawkers, and only then from her. As
she sells significant quantities of her
vegetables to bakkie traders, it can
be argued that market segments
supporting intermediaries are buying
indirectly from her, although she
benefits less than if she was selling
to them directly. Her markets buy
more produce from her and her
peers than from distribution centres
or commercial farmers.
She would like to sell to the
hospitality sector, government
procurement, and distribution
centres in that order. As a fourth
category, she would also like to sell
to feeding schemes, which could
arguably be categorised with
government initiatives. In that case,
government initiatives would
become a larger desired alternative
market than the hospitality sector.
Her extension officer also thinks
government procurement is a viable
alternative market for her, but feels
that her sales to bakkie traders,
hawkers, the local community, and
direct sales to national and local
retailers could be increased. The
official also thinks she should sell
her produce at monthly government
grant pay points (such as pension
and child grant pay outs). The
saturation of the markets she would
like to sell to is still undetermined.
Whether selling more produce to
her current markets, or accessing
new markets, the farmer is
experiencing severe production
limitations and a lack of transport to
markets. Her key production
challenges include a range of water
issues, inadequate capital to
purchase inputs, and lack of farming
tools and equipment. Her lack of
irrigation infrastructure, including
pumps, is her major water-related
challenge. These limitations force
her to grow limited varieties of
vegetables in small quantities and
prevent her from producing
consistently. Her informal enterprise
and lack of business skills also close
alternative markets for her.
Whether with formal or informal market segments, the market arrangements she has are mostly driven by flexibility, distances from markets, and having established relationships with specific markets.

SMALLHOLDER FARMER MARKET SEGMENTATION TOOLKIT 15
Similarities Differences
Demographics
• 40–60 years of age
• Primary school as highest qualification
• A typical smallholder farmer in Mopani is a male while in Umkhanyakude a typical farmer is a female.
• Smallholder farmers in Umkhanyakude are typically breadwinners with approximately 10 people per household, while in Mopani the farmer is not necessarily the breadwinner and shares the household with 5 other people.
Production
• Farming experience of 1 to 5 years
• Grow vegetables
• Employ family labour
• Mostly depend on government for technical and financial support
• Main production challenges include limited capital to invest in infrastructure to source water and irrigate
• Smallholder farmers in Umkhanyakude also produce fruit for commercial purposes
• A typical smallholder farmer in Mopani has permission to occupy an average farm land of 12 ha compared to Umkhanyakude where the farmer has permission to farm a plot of 0.5 ha or less.
• Mopani farmers use only their own savings to purchase farming inputs, whilst some Umkhanyakude farmers have access to loans in addition to own savings, as well as government support.
Marketing
• Producing mainly for income and some for consumption
• Don’t belong to any commodity associations
• Sell the largest share of their produce to the informal market
• Prefer informal marketing arrangements
• Aspire to sell in hospitality sector, government procurement, and to supermarket distribution centres
• Main market challenges are inability to meet formal market requirements and standards (no certification), and a lack of transportation
• Annual gross income for a smallholder farmer in Mopani ranges between R30 000 and R50 000. A smallholder farmer in Umkhanyakude generates an annual gross income of less than R30 000.
Table 2: Similarities and differences between farmer profiles
Farmer Profile Comparisons
Of course, one of the main aims of distributing the Toolkit is the ability to
compare the results across districts. Table 2 presents the key similarities and
differences between the farmer profiles in Umkhanyakude and Mopani.
Table 2 presents the key similarities and differences between the farmer profiles...

SMALLHOLDER FARMER MARKET SEGMENTATION TOOLKIT16
The NAMC and SAFL were able to create a number of recommendations from their research findings about how best to support the smallholder farmers they studied.
It is not surprising that so many support interventions fail when one considers the shocking lack of information about smallholders.
Recommendations & conclusions
Recommendations Drawn from the Toolkit ResearchThe NAMC and SAFL were able to
create a number of
recommendations from their
research findings about how best to
support the smallholder farmers
they studied. This section lists the
key recommendations to serve as
an indication of the usefulness of
the process for potential users of
the Toolkit.
Both studies found that smallholder
farmers largely supply informal
markets and, although they would
like to increase their sales, are
unable to increase their output
largely due to production
challenges. Formal markets that
engaged with smallholder farmers
did so because of the quality of their
produce, potentially as a result of
shorter transport distances, and
because of the flexibility of the
Conclusions
The development of this
Smallholder Farmer Market
Segmentation Toolkit represents an
exciting leap forward in attempts to
better support smallholder farmers
in South Africa. It is not surprising
that so many support interventions
fail when one considers the
shocking lack of information about
smallholders, and the apparent key
differences in their situations and
needs (see Table 2). But the Toolkit
can only assist in improving support
if it is widely used across the
country.
It is vital that the Toolkit is not seen
as a finalised entity, but rather as the
starting point for collaboration and
innovation between researchers
across the country. It should be a
constantly evolving tool, and
provoke robust debate as
researchers operationalise it across
the districts of South Africa. The
more it is used to collect data about
smallholders, the better we can
ensure that these same smallholders
receive appropriate and targeted
support.
marketing relationships with
smallholder farmers. The key
recommendations made here were
for smallholders to receive more
production support and to establish
organised groups such as
cooperatives or commodity
associations to assist farmers to
access new markets.
Increasing their production levels,
and producing consistently, is one
of the main limiting factors for
smallholders. This challenge is
mainly related to a lack of capital to
invest in their farming operations;
the key recommendation made
here was for more financing
opportunities to be made available
(through government, the private
sector and so on). Organised groups
could assist with the financing
challenge, either by facilitating
access to finance or by providing
access to shared infrastructure. The
benefits of organised groups extend
to many of the other challenges
smallholders face; such as bulk
discounts on inputs and access to
market information.
Local communities in
Umkhanyakude and Mopani were
significant markets for both groups
of smallholders. It is clear that trying
to move all smallholder farmers into
formal markets could significantly
affect access to nutritious fresh
produce for these communities.
Informal markets have an important
role and should thus be the focus of
support, such as determining
appropriate traceability and food
safety standards, and ensuring fair
trade practices.

References1. Cousins B. and Chikazunga D. 2013. Defining smallholder farmers in
South Africa. In Supporting smallholders into commercial agriculture: A social dialogue and learning project. Proceedings of the First Innovation Lab. Southern Africa Food Lab (SAFL) and the Institute for Poverty, Land and Agrarian Studies (PLAAS).
2. Ortmann, G.F. and King, R.P. 2010. Research on agri-food supply chains in Southern Africa involving small-scale farmers: current status and future possibilities. Agrekon, 49(4): 397–417.
SMALLHOLDER FARMER MARKET SEGMENTATION TOOLKIT 17

SMALLHOLDER FARMER MARKET SEGMENTATION TOOLKIT18
Southern Africa Food Lab
www.southernafricafoodlab.org