Embed Size (px)
Citation preview


FORMULATION OF GIS BASED MASTER PLANS FOR AMRUT CITIES
Design and Standards
Town & Country Planning Organisation
Ministry of Urban Development Government of India
& National Remote Sensing Centre
Deptt. Of Space Government of India
March 2016

© Ministry of Urban Development

Formulation of GIS based Master Plan for AMRUT Cities – Design & Standards
Table of Contents
List of Figures List of Tables List of Annexures List of Appendix Authoring Team Committee for Revision of NUIS Guidelines & Design Standards Acronyms
1.0.0 Introduction 1 2.0.0 Need for the revision of existing NUIS Design and Standards 2 2.1.0 Formulation of GIS based Master Plan for AMRUT Cities 2 3.0.0 Elements of Standards 3 3.1.0 Remote Sensing Image Standards 3 3.1.1 Raw Image Standards 4 3.1.2 Ground Control Points (GCPs) Standards required for
photogrammetric block adjustment and ortho-rectification of satellite data
5
3.1.3 Ortho-Rectification of Satellite Data Standards 6 3.2.0 Spatial Reference Standards 6 3.2.1 Co- ordinate System 7 3.2.2 Map sheet frame for hard copy prints 7 3.3.0 Geo-Spatial Feature Content and GIS Data structure Standards 9 3.3.1 Geo-Spatial Data Content 9 3.3.2 Feature Geometry 10 3.3.3 GIS Data Structure 11 3.3.4 Coding Scheme 11 3.3.5 Layer wise Data content, Classification and GIS data Structure 11 3.3.6 Accuracy Standards 45 3.4.0 Quality Assurance/Quality Check 45 3.5.0 GIS database dissemination to ULBs for Master Plan formulation 46 3.6.0 Metadata standards 49 4.0.0 Map Symbology 51 5.0.0 Indicative Format for Urban Data Collection 51 References 52
Formulation of GIS based Master Plan for AMRUT Cities – Design & Standards
LIST OF FIGURES Figure 1: Schematic Representation of Map Frame and Tie Points 8 Figure 2: Bhuvan-AMRUT architecture for GIS database dissemination to ULBs in
compliance to OGC standards 48
LIST OF TABLES Table 1 Raw Image Standards 4 Table 2 Ground Control Points (GCPs) Standards 5 Table 3 Ortho-rectification of Satellite data Standards 6 Table 4 Spatial Reference Standards 7 Table 5 Geo-Spatial Data Content 9 Table 6 Road: Geo-Spatial Data Content 12 Table 6a Road Centre Line GIS Data Structure 12 Table 6b Road Polygon GIS Data Structure 13 Table 7 Rail - Geo-Spatial Data Content 13 Table 7a Rail Line GIS Data Structure 14 Table 8 Bridges/Flyovers - Geo-Spatial Data Content 14 Table 8a Bridges & Flyovers GIS Data Structure 14 Table 9 Water bodies - Geo-Spatial Data Content 15 Table 9a Water bodies Line (Stream, Canal, Drain) GIS Data Structure 15 Table 9b Water bodies Polygon GIS Data Structure 16 Table 10 Urban Land use - Geo-Spatial Data Content 16 Table 10a Urban Land use Polygon GIS Data Structure 23 Table 10b Community Toilet GIS Data Structure 23 Table 10c Fire Station GIS Data Structure 24 Table 10d Garbage Collection Points/Dumper GIS Data Structure 24 Table 10e Landfill Sites and Dumping Yard GIS Data Structure 25 Table 10f Cell Towers, Wi-Fi Hotspots & Public Telephone Booth GIS
Data Structure 25
Table 10g Slums GIS Data Structure 26 Table 10h Bus Stop GIS Data Structure 26 Table 10i Tree GIS Data Structure 26 Table 10j Other Urban Landuse Points: ATM, Meteorological Station,
Dairy Booth, Light House and Other if any GIS Data Structure 27
Table 11 Building Footprint - Geo-Spatial Data Content 27 Table 11a Buildings GIS Data Structure 31 Table 12 Water Supply Network - Geo-Spatial Data Content 32 Table 12a Water Supply Network Line GIS Data Structure 33 Table 12b Water Supply Network Points GIS Data Structure 33 Table 13 Storm Water Drainage Network - Geo-Spatial Data Content 34 Table 13a Storm water Drainage Network Line GIS Data Structure 34 Table 13b Storm water Drainage Network Points GIS Data Structure 35 Table 14 Sewerage Network - Geo-Spatial Data Content 35
Formulation of GIS based Master Plan for AMRUT Cities – Design & Standards
Table 14a Sewerage Network Line GIS Data Structure 36 Table 14b Sewerage Network Points GIS Data Structure 36 Table 15 Power Supply Network - Geo-Spatial Data Content 37 Table 15a Power Supply Network Line GIS Data Structure 37 Table 15b Power Supply Network Points GIS Data Structure 38 Table 16 Gas Distribution Network - Geo-Spatial Data Content 38 Table 16a Gas Distribution Network Line GIS Data Structure 39 Table 16b Gas Distribution Network Points GIS Data Structure 39 Table 17 DEM Layer 40 Table 18 Contour - Geo-Spatial Data Content 40 Table 18a Contour Layer GIS Data Structure 40 Table 19 Ground Control Points (GCPs) Layer - Geo-Spatial Data Content 40 Table 19a Ground Control Points GIS Data Structure 41 Table 20 Cadastral Layer - Geo-Spatial Data Content 41 Table 20a Cadastral Layer GIS Data Structure 41 Table 21 Administrative Boundaries - Geo-Spatial Data Content 42 Table 21a Administrative Boundaries GIS Data Structure 42 Table 22 Planning Boundaries - Geo-Spatial Data Content 42 Table 22a Planning Boundaries GIS Data Structure 43 Table 23 Municipal Boundaries - Geo-Spatial Data Content 43 Table 23a Municipal Boundaries GIS Data Structure 43 Table 24 Other Boundaries (EB, UFS, Mining area) - Geo-Spatial Data
Content 43
Table 24a Boundaries (EB, UFS, Mining area) GIS Data Structure 44 Table 25 Hazard Prone Areas - Geo-Spatial Data Content 44 Table 25a Hazard prone Areas GIS Data Structure 44
LIST OF ANNEXURES
Annexure I: Constitution of Committee for Revision of NUIS Guidelines and Design Standards 53
Annexure IIA: Approval of Design & Standards document by Chairman of Committe for Revision of NUIS Guidelines and Design Standards 55
Annexure IIB: Approval of Design & Standards document by Ministry of Urban Development, Govt. of India 56
Annexure III: Brief of DGPS survey method 57 Annexure IV: Indicative Format for Urban data collection 59
LIST OF APPENDIX
Appendix I: Guidelines for Filling the Format 84

Formulation of GIS based Master Plan for AMRUT Cities – Design & Standards
AUTHORING TEAM
NRSC 1. Dr. P. G. Diwakar, Deputy Director (Applications) 2. Dr. K. Venugopala Rao, Group Head, Urban Studies & Geoinformatics Group 3. Ms. S.V.L Bhavani, Scientist 4. Ms. J. Kamini, Scientist TCPO 1. Shri K. K. Joadder, Chief Planner 2. Shri Sompalle Surendra, Town & Country Planner 3. Shri Mohd. Monis Khan, Town & Country Planner 4. Ms. Anjali Pancholy, Associate Town & Country Planner 5. Ms. Maitreyee Banerjee, Research Assistant COMMITTEE FOR REVISION OF NUIS GUIDELINES & DESIGN STANDARDS 1. Dr. P. G. Diwakar, Deputy Director(Applications), NRSC, ISRO/DOS, Hyderabad 2. Shri S. V. Singh, Director, GIS & RS, IISM, Hyderabad 3. Prof. Mahavir, SPA, New Delhi 4. Dr. K. Venugopala Rao, Group Head, USGIG, NRSC, Hyderabad 5. Dr. Vinod Bothale, Group Head, GWS, NRSC, Hyderabad 6. Dr. Rajeev Kumar Jaiswal, Scientist, EOS, ISRO HQs, Bangalore 7. Shri B. D. Bharat, Scientist, IIRS, Dehradun 8. Dr. Vivek Katare, Head, Landuse & Urban Studies, MAPCOST, Bhopal 9. Shri Iftikhar Ahmed hakim, CTP, TPO, Kashmir 10. Smt. Anjali Goswami, Director, DTCP , Assam 11. Shri P. Thimma Reddy, Director, DTCP, Andhra Pradesh 12. Shri S. Surendra, Town & Country Planner, TCPO, New Delhi 13. Shri Mohd. Monis Khan, Town & Country Planner, TCPO, New Delhi (Member-
Convener) Co-Opted Members:
1. Shri K. Anand Babu, Director, DTCP, Govt. of Telangana 2. Ms. S.V.L Bhavani, Scientist, USGIG, NRSC, Hyderabad 3. Ms. J. Kamini, Scientist, USGIG, NRSC, Hyderabad

Formulation of GIS based Master Plan for AMRUT Cities – Design & Standards
ACRONYMS
AMRUT Atal Mission for Rejuvenation and Urban Transformation Admin Adminstrative AOI Area of Interest ASPRS American Society for Photogrammetry and Remote Sensing ATM Automated Teller Machine BOD Biological Oxygen Demand BPL Below Poverty Level BRTS Bus Rapid Transit System CBR Crude Birth Rate CE Circular Error CFL Compact fluorescent lamp CGWB Central Ground Water Board CHC Community Health Centre Cline Central Line CNG Compressed Natural Gas CO Carbon Monoxide D.P Development Plan DD Date DEM Digital Elevation Model DGPS Differential Global Positioning System Dia Diameter DIC District Industries Centre DoS Department of Space Drain Drainage DTM Digital Terrain Model DU Dwelling Unit EB Enumeration Block EO Earth Observation GCP Ground Control Point GDOP Geometric Dilution of Precision GIS Geographic Information System GLR Ground Level Reservoir GoI Government of India GPS Global Positioning System GSI Geological Survey of India HH Household HHI Household Industry

Formulation of GIS based Master Plan for AMRUT Cities – Design & Standards
HP Horse Power HPMV High Pressure Mercury Vapour HQ Head quarters HRIDAY Heritage City Development and Augmentation Yojana hrs Hours HT High Tension ID Identification Number IGS International Ground Station IMR Infant Mortality Rate IR Infra-red IRC Indian Roads Congress ISO International Organization for Standardization ISRO Indian Space Research Organisation IT Information Technology ITRF International Terrestrial Reference Frame LE Linear Error LFDC Large Format Digital Camera LISS Linear Imaging Self-Scanner LPCD Litre per Capita per Day LPG Liquefied Petroleum Gas LT Low Tension Mat Material mg/L Milligrams per Litre MILMA Brand household name of The Kerala Co-operative Milk Marketing Federation MKWH Million KiloWatt per Hour MLD Mega Litter per Day = 10*6 L/day (unit of water storage in dams and
reservoirs) MMTS Multi-Modal Transport System MoUD Ministry of Urban Development MRTS Metro Rapid Transit System MSL Mean Sea Level MW MegaWatt NAS Network Attached Storage NCC Natural Colour Composite NDMA National Disaster Management Authority NGO Non-Government Organization NHAI National Highway Authority of India NMP National Map Policy NNRMS National Natural Resource Management System
Formulation of GIS based Master Plan for AMRUT Cities – Design & Standards
NO Nitric Oxide also known as Nitrogen Monoxide NRSC National Remote Sensing Centre NSDI National Spatial Data Infrastructure NSSO National Sample Survey Organisation NUIS National Urban Information System OGC Open Geospatial Consortium PAN Panchromatic pH Potential of Hydrogen PHC Primary Health Care PPP Public Private Partership QA Quality Assurance QC Quality Check R & B Dept.
Roads and Buildings Department
RGI Registrar General of India RMSE Root Mean Square Error RPC Rational Polynomial Coefficient RWA Resident Welfare Association SEZ Special Economic Zone SO2 Sulphur di-oxide SPM Suspended Particulate Matter STPD State Town Planning Department TCPO Town & Country Planning Organisation TV Telivision UA Urban Agglomeration UFS Urban Framework Survey ULB Urban Local Body ULU Urban landuse/landcover URDPFI Urban and Regional Development Plans Formulation and Implementation UT Union Territory UTM Universal Transverse Mercator VHRS Very High Resolution Satellite WBM Water Bound Macadam WFPR Workforce Participaticate Rate WGS84 World Geodetic System (WGS) established in 1984 SHG Self Help Group LCS Low Cost Sanitation WTP Water Treatment Plant

Formulation of GIS based Master Plan for AMRUT Cities – Design & Standards

Formulation of GIS based Master Plan for AMRUT Cities – Design & Standards 1
1.0.0 INTRODUCTION The urban settlements of the country have experienced relatively rapid population growth and the percentage of India’s population living in urban areas has more than doubled from 14% at the time of independence to 31.8 % in 2011 (Census of India). This is expected to increase even further to nearly 40% by 2026 and is expected to be more than 50% by 2051. The class-wise distribution of statutory towns/cities as per Census 2011 is as follows.
S.No Class Population Range
No. of Statutory
Towns 2011 Census
1 Metro 10 lakh plus 53 2 Class I 1-9.99 lakhs 430 3 Class II 50,000- 99,999 546 4 Class III 20,000- 49,999 1321 5 Class IV 10,000-19,999 1091 6 Class V 5000-9,999 474 7 Class VI Below 5000 133 Total 4041
Most of the urban settlements, especially smaller urban settlements, are characterized by haphazard and unplanned growth, non-conforming land uses, mushrooming unauthorized colonies, and land conversion from agriculture to urban resulting in environmental degradation and poor quality of life. The proper management of urban areas calls for accurate and vital information to be available on a regular basis.
Master Plan/Development Plan is the major tool for urban land management, providing detailed landuse allocation for the sustainable development of city/town. Most master/development plans are made for 20-year periods, in phases of five years for periodic review and revision. Formulation of master plans start with base map preparation, existing land use surveys and collection of socio-economic data necessary for reviewing the existing situation and proposing the future land use plan. With the advances in remote sensing and geographic information system, the plan making process can be expedited with integration of both spatial and attribute data, which enables detailed assessment of spatial growth of towns/cities, landuse status, physical infrastructure facilities, etc. in anticipation of the projected population growth. The most crucial information for formulation of Master Plan is an accurate and updated Base Map of the planning area, showing roads and building layouts, spatial extent of development and information on the use of each parcel of land etc. Preparation of base maps from Very High Resolution Satellite (VHRS) Images and Geographic Information System (GIS) technology can be time and cost effective solution. Under the National Urban Information System (NUIS) Scheme, urban GIS database for 152 towns was prepared using 2.5m

Formulation of GIS based Master Plan for AMRUT Cities – Design & Standards 2
(Cartosat-1+LISS-IV) remote sensing images. This GIS database has been hosted on ISRO's geo-spatial platform Bhuvan and a web-based GIS (Bhuvan-NUIS) for accessing, editing and managing the database was developed. NUIS Scheme has provided the basic foundation for understanding and experiencing the utilisation of remote sensing & GIS technologies for urban base and thematic mapping and GIS database creation. 2.0.0 NEED FOR REVISION OF EXISTING NUIS DESIGN AND
STANDARDS Although State Town and Country Planning Departments (STPDs) had initiated the utilisation of NUIS database at 1:10000 scale for Master Plan formulation on Bhuvan, it was felt that 1:10000 scale database content and accuracy was inadequate for this purpose. During an Interactive Workshop with Chief Town Planners/Directors of the States/UTs conducted by Town & Country Planning Organisation/Ministry of Urban Development (TCPO/MoUD) on 17th February 2015, the following technical criteria were suggested for generation of comprehensive GIS database for Master Plan formulation:
1. Utilisation of Very High Resolution Satellite (VHRS) Data for preparing large scale urban base map at 1: 4000 scale or better.
2. Use of GIS based Master Plan formulation approach as per URDPFI, 2014 Guidelines.
3. Existing NUIS Design and Standards are pertinent to 1:10000 scale mapping. This may not be appropriate for large scale mapping in terms of the input satellite data, map content, geometry, accuracy, etc.
4. It was also observed that various Town & Country Planning Organisation/Departments are following different methods and procedures for base map preparation and GIS database generation using remote sensing & GIS technology which calls for national standards.
5. Hence, the existing NUIS Design and Standards are to be revised to support generation of comprehensive GIS databases to meet the requirements of mapping under National flagship schemes like Smart Cities, AMRUT, HRIDAY and also other State level urban development projects.
2.1.0 Formulation of GIS based Master Plan for AMRUT Cities
Government of India launched Atal Mission for Rejuvenation and Urban Transformation (AMRUT) in 2015 as Centrally Sponsored Scheme with the objectives to (i) ensure that every household has access to a tap with assured supply of water and a sewerage connection; (ii) increase the amenity value of cities by developing greenery and well maintained open spaces (e.g. parks); and (iii) reduce pollution by switching to public transport or constructing facilities for non-motorized transport (e.g. walking and cycling). One purpose of the Mission is to improve governance through a set of Reforms. During the Mission period, 11 reforms are being implemented.

Formulation of GIS based Master Plan for AMRUT Cities – Design & Standards 3
Formulation of GIS-based Master/Development Plans for 500 AMRUT Cities is one of the important reforms under AMRUT, which has been approved as a 100% centrally funded sub-scheme with budget outlay of Rs. 515.00 crores. The major objectives of the sub-scheme are: • To develop common digital geo-referenced base maps and land use maps using
Geographical Information System (GIS) and • Master Plan Formulation for 500 cities that are selected as AMRUT Cities. In order to develop national level Design and Standards, Ministry of Urban Development constituted a Committee with the members from ISRO, central and STPDs (Annexure I). The Committee held detailed deliberations and interactions with Central and State Town Planning departments and experts and recommended that mapping at 1:4000 scale is ideal for formulation of Master Plans/Development Plans as per currently available satellite data. The Design & Standards has been prepared for geo-spatial database creation as per the requirement.The approval of the Design and Standards document from the Chairman of the Committee for Revision of NUIS Guidelines and Design Standards and Ministry of Urban Development is at Annexure II A&B. Since base map preparation and master plan formulation is to be done by different States as per their respective acts, for a wide variety of cities and towns, if required, State Governments may add to the Design and Standards as per their requirements under intimation to Chief Planner, TCPO.
3.0.0 ELEMENTS OF STANDARD Remote Sensing data, Base map & Urban Land use GIS database including spatially linked socio-economic attribute information and administrative boundaries are important datasets for the formulation of Master Plans. Development of uniform design and standards is necessary to enable the central and state level departments to adopt the implementation of national/state urban schemes. The main elements of Standards are given below.
1. Remote Sensing Image Standards 2. Spatial Reference Standards 3. Geo-spatial Data Content and GIS Database Standards 4. Quality Assurance/Quality Check 5. GIS database dissemination to ULBs for Master Plan formulation 6. Metadata standards
3.1.0 Remote Sensing Image Standards
Very High Resolution satellite images or Aerial Large Format Digital Camera (LFDC) multi-spectral photography data are the best input sources for large scale mapping. The following tables describe the input image standards-
1. Raw image standards- required for satellite data procurement

Formulation of GIS based Master Plan for AMRUT Cities – Design & Standards 4
2. Ground Control Points (GCPs) – for geo-referencing/ortho-rectification of satellite image
3. Geo-referenced/Ortho-rectified image – the final image used for feature extraction. 3.1.1 Raw Image Standards
Table 1: Raw Image Standards S. No
Description Value Remarks
1 Spatial Resolution 0.5 metres or Better
2 Spectral Resolution PAN Sharpened (Bands: Panchromatic, Red, Green, Blue and Near Infrared)
IR band is optional
3 Band to Band registration
Less than 1/4th of pixel size
4 Radiometry 10 bit or better 5 Image Resampling Nearest Neighbourhood
6 a. Monoscopic/Stereoscopic
Plain Areas: Monoscopic Highly Hilly areas: Stereoscopic
Need of Stereoscopic to be reviewed case by case. If the city is built on the terrain slope more than 15 degrees.
b. Monoscopic data View angle
Less than 10 degree from nadir In specific cases, maximum upto 15 degrees view angle shall be allowed
c. Stereoscopic One of the stereo image view angle should be less than 10 degrees from nadir
Base to Height(B/H) ratio: 0.6<B/H< 0.8
7 Vantage imaging Fresh acquisition: Within 6 months Archived Data: Less than 1 year
If one town/city is covered by multiple scenes, the time difference among the scenes should be less than 3 months.
8 Product type Image data should be associated with corresponding Rational Polynomial Coefficients (RPCs) Format: 1. image data: Geo-tiff
Ortho-kit data with RPCs

Formulation of GIS based Master Plan for AMRUT Cities – Design & Standards 5
S. No Description Value Remarks
2. RPCs : Open standards 9 Spatial Reference Datum : WGS84
Projection : UTM
10 Cloud Coverage Zero % in the core town/city, Less than 10% in the periphery of town/city limits
Cloud free data is preferable
3.1.2 Ground Control Points (GCPs) Standards required for Photogrammetric Block Adjustment and Ortho-rectification of satellite data
Table 2: Ground Control Points (GCPs) Standards
(Brief DGPS survey method is given Annexure-II)
S. No Description Value Remarks
1 Survey method used for GCPs
Differential GPS Survey (DGPS) DGPS survey points should be processed using closed network traverse. The reference station coordinate shall be computed using ITRF (International Terrestrial Reference Frame)
2 Accuracy Positional accuracy (X,Y): better than 0.5mts Height accuracy (Z) : better than 0.5mts
With reference to absolute accuracy of Reference station coordinates in ITRF
3 Spatial reference
Horizontal Datum : WGS84 Projection : UTM Vertical Datum : WGS84 or MSL Units : Meters
Towns for which Stereo data is selected: The GCPs vertical Datum must be MSL.
4 No. of GCPs
a. Uniform Distribution for the entire city/town planning area
b. At least one GCP for every 5 sq. km. c. At the overlap of images GCPs should
be available d. The position of GCPs should be on the
non-variable features
GCPs must be clearly visible in the Satellite image. GPS reference station shall be a monument in Cement concrete and embedded brass-plate to ensure station revisit, whenever the need arises.
Formulation of GIS based Master Plan for AMRUT Cities – Design & Standards 6
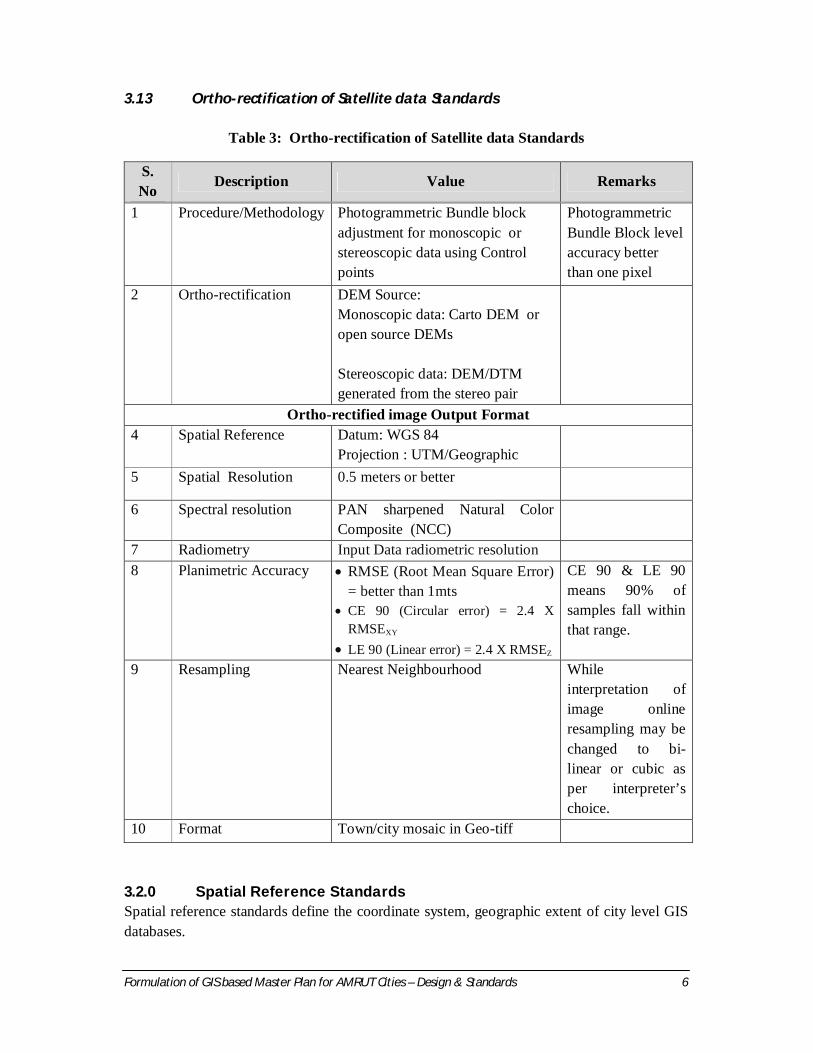
3.1.3 Ortho-rectification of Satellite data Standards
Table 3: Ortho-rectification of Satellite data Standards
S. No Description Value Remarks
1 Procedure/Methodology Photogrammetric Bundle block adjustment for monoscopic or stereoscopic data using Control points
Photogrammetric Bundle Block level accuracy better than one pixel
2 Ortho-rectification DEM Source: Monoscopic data: Carto DEM or
open source DEMs
Stereoscopic data: DEM/DTM generated from the stereo pair
Ortho-rectified image Output Format 4 Spatial Reference Datum: WGS 84
Projection : UTM/Geographic
5 Spatial Resolution 0.5 meters or better
6 Spectral resolution PAN sharpened Natural Color Composite (NCC)
7 Radiometry Input Data radiometric resolution 8 Planimetric Accuracy RMSE (Root Mean Square Error)
= better than 1mts CE 90 (Circular error) = 2.4 X
RMSEXY LE 90 (Linear error) = 2.4 X RMSEZ
CE 90 & LE 90 means 90% of samples fall within that range.
9 Resampling Nearest Neighbourhood While interpretation of image online resampling may be changed to bi-linear or cubic as per interpreter’s choice.
10 Format Town/city mosaic in Geo-tiff 3.2.0 Spatial Reference Standards Spatial reference standards define the coordinate system, geographic extent of city level GIS databases.

Formulation of GIS based Master Plan for AMRUT Cities – Design & Standards 7
3.2.1 Coordinate System
Spatial reference is selected as per National Map Policy (NMP) 2006, accordingly spatial reference standards are given below:
Table 4: Spatial Reference Standards
S. No Description Value Remarks
1 Datum WGS84
2 Projection For mapping/printing maps/publishing =UTM, if city falls in more than one UTM zone, the maximum covered zone will be considered.
For GIS database, storing
&management = Geographic
Data will be stored in Geographic co-ordinate system and will be projected to UTM online for mapping/interpretation, analysis & printing.
3 Extent Extent of each town = Minimum bounding box to Planning area boundary with 5 km. buffer
Additional 5 km. buffer is selected to cater to accommodate the near future increase in Planning Area.
3.2.2 Map sheet frame for hardcopy prints
With the advancements in GIS, the utilisation of hard copy maps is limited to the field work and field verification of data. The digital GIS environment can be used for spatial and attribute data analysis and GIS based Master plan formulation. The proposed 1:4000 scale under this scheme is not compatible to National Scheme of Map series. In view of this, it is proposed to use the existing National Map Scheme which was developed and adopted in NUIS Scheme. Whenever required hard copy maps can be printed for visualisation purpose at different scale for example at 1: 10000 for town/city map; 1:2000 or 1:1000 for field verification and data collection purpose. The Schematic Representation of Map Frame and Tie Points is given in Figure 1. To enable the compatibility of cadastral map scales, it is proposed to adopt State specific cadastral map sheet series at 1:4000 scale, 1:8000 scale or any other specific scale. The extent of the Map sheet, Map sheet number and size shall be according to the scale adopted by the respective State/UT.

Formulation of GIS based Master Plan for AMRUT Cities – Design & Standards 8
Figure 1: Schematic Representation of Map Frame and Tie Points
Formulation of G
IS based Master Plan for AM
RUT Cities – D
esign & Standards
8

Formulation of GIS based Master Plan for AMRUT Cities – Design & Standards 9
3.3.0 Geo-Spatial Data Content and GIS Data Structure Standards
3.3.1. Geo-Spatial Data Content
Existing Urban Land use/Land cover, base map and utilities network data at 1: 4000 scale and city local data in GIS format are the important inputs for formulation of GIS based Master Plan and Infrastructure Development Plan. These geo-spatial data layers and their basic source are given in Table - 5.
Table 5: Geo-Spatial Data Content
Sl No.
Spatial Layers Source for Spatial data generation
Classification based on Use & Attributes
Classes Sub Classes I Base layers
Very High Resolution satellite data
5 46
1. Road 2. Rail 3. Bridges 4. Flyovers 5. Water bodies II Urban Land Use/Land
cover Very High Resolution satellite data 28 220
III Building Footprints Very High Resolution satellite data 22 144
IV Utilities 1. Water Supply Network
Urban Local Bodies
1 12 2. Storm Water Drainage
Network 1 2
3. Sewerage Network 1 8 4. Power Supply Network 1 8 5. Gas Distribution
Network 1 6
V Hypsography 1. Digital Elevation
Model(DEM) Type : Digital Terrain Model (DTM)
Topographic Survey; existing DEMs or contour maps.
1 1
2. Contour 1 1 3. Ground Control Points 1 2 VI Cadastral Layer Urban Local Bodies
/State Revenue Department
1 -

Formulation of GIS based Master Plan for AMRUT Cities – Design & Standards 10
Totally there are 69 major classes and 475 sub-classes for 1:4000 scale urban geo-spatial data for GIS based Master Plan formulation under AMRUT scheme. Details of classification and sub-classification are given in the subsequent Tables 6 to 25.
3.3.2. Feature Geometry
The size, shape and scale at which the geo-spatial feature is mapped define its geometric representation in GIS. Area features like water bodies are represented in polygon geometry; line features like water supply network are represented in line geometry; point features like Electric Pole are represented in point geometry. Some of the area features like roads are represented in both polygon and line geometry. For example, the width of road is represented in polygon and road centreline is represented in line geometry. In such cases attributes are associated with line feature. The basic criteria to define the geometry of geo-spatial features are given below:
Features having an area more than of 5 pixels by 5 pixels (as per image standards 6.25 sq. mt.) shall be represented as polygons. Inother cases, where the features have area less than 5 pixels by 5 pixels, defined as point or line based on the feature type.
Sl No.
Spatial Layers Source for Spatial data generation
Classification based on Use & Attributes
Classes Sub Classes VII Boundaries 1. Administrative
boundaries State Revenue Department 1 7
2. Planning boundaries Urban Local Bodies 1 8
3. Municipal boundaries Urban Local Bodies 1 4 4. Other Boundaries –
Enumeration Block(EB), Urban Framework Survey(UFS) & Mining Area
EB from Registrar General Of India (RGI), UFS from National Sample Survey Organisation (NSSO) & Mining area boundary from concerned State Departments.
1 3
VIII Hazard Prone Areas Information from NRSC, ISRO, GSI, NDMA, Other State & Central Government Dept.
1 3

Formulation of GIS based Master Plan for AMRUT Cities – Design & Standards 11
In the Road layer, Roads having width of 7.5m and more will be captured as polygon and the road centre as line. Roads having width of less than 7.5m will be captured only as line.
Rail feature, shall be captured as line. Railway track area shall be captured as polygon.
All utility network layers are defined as lines and the nodes (starting point, intersections, valves, end points etc.) defined as points.
Features such as garbage collection point, electric poles, cell towers etc., are defined as point.
3.3.3. GIS Data Structure
Geographic/urban feature is classified and further sub-classified based on its use & attributes. Cities in plain terrain or rolling terrain, ortho-rectified satellite image is used to capture the features in 2-dimention. As mentioned in image standards (Table 1), the cities in high relief hilly areas, the stereo data is used to capture the features in 3-dimension. In 3D mapping, x,y,z of the each vertex is stored in the feature geometry. According to the feature dimensionality (2D or 3D), the GIS data structure of polygon, line or point features can be 2 dimension or 3-dimension. OGC compliant GIS database models like shape file, geodatabase, oracle spatial data model, Postgres data model etc., may be implemented for generation of GIS layer data structure for storing spatial & attribute data. 3.3.4. Coding Scheme
Each GIS feature is assigned with a unique four character alphanumeric code. The code is unique with respect to the feature, irrespective of its geometry and layer. The first two characters of the code represent the Class and next two characters represent the Sub Class. For example, Code: 01-02; 01 represents Road Class; 02 represents the Road Sub-class State Highway. 3.3.5. Layer wise Data content, Classification and GIS data Structure
Table 6 to Table 25 describes Layer wise geo-spatial data content with class & sub-class and GIS data structure with nomenclature of the geo-spatial layer, attributes, fields and field properties to be implemented using OGC compliant GIS software. For example, Table 6 gives the Road: Geo-spatial data content, Table 6a & 6b gives the GIS Data Structure for Road centreline and Road polygon respectively.
I. BASE LAYERS:
The road feature will be captured as both Polygon and Line. Road area is represented as polygon and Road centreline as Line.

Formulation of GIS based Master Plan for AMRUT Cities – Design & Standards 12
Table 6: Road: Geo-Spatial Data Content S.No CODE CLASS SUB-CLASS GEOMETRY SYMBOL
1
01-01
Road
National Highway Polygon / Line 01-02 State Highway Polygon / Line
01-03 Major District Road Polygon / Line
01-04 Other District Road Polygon / Line
01-05 Expressway Polygon / Line 01-06 Bypass Polygon / Line 01-07 Ring Road Polygon / Line 01-08 Service Road Polygon / Line 01-09 Major City Road# Polygon / Line 01-10 Minor City Road# Polygon / Line 01-11 Other Public Road Polygon / Line
01-12 Other Private Road Polygon / Line
01-13 BRTS Polygon / Line 01-14 Cycle Track Polygon / Line 01-15 Village road Polygon / Line 01-16 Foot path Line 01-17 Cart track Line 01-18 Ropeway Line 01-19 Carriageway* Line 01-20 Right of way* Line
#Roads having width of 10.5m/11m and more will be called Major City Road and less than 10.5m/11m as Minor City Road (for information, the road widths mentioned are as per IRC standards) *Source for Carriageway and Right of way: Revenue records.
Table 6a: Road Line GIS Data Structure
Geo-spatial Layer Name: Road_CLine Attribute
Name Attribute
Field Name Attribute
Field Type Attribute
Field Width Description/Value
Road Id Rd_ID Alphanumeric 15 Unique Id Code Code Alphanumeric 10 Code as given in Table 6 Sub-Class Sub_Class Text 20 Sub Class as given in Table 6
Length in km. Length_km. Double 10 Up to 4 decimals
Length (in km.)
Ward Number Ward_No Alphanumeric 10 Ward Number
Road Name Rd_Name Text 30 Specific Name of the feature, if any

Formulation of GIS based Master Plan for AMRUT Cities – Design & Standards 13
All the railway lines will be captured as lines in Base layer and the railway track area shall be captured as polygon in Urban Land Use layer.
Attribute Name
Attribute Field Name
Attribute Field Type
Attribute Field Width Description/Value
Road Construction Material
Cons_Mat Text 10 Concrete/Asphalt/WBM/Any Other
Carriage Width (in mt.)
CW_Width Double 10 Up to 4 decimals
Carriage Width in metres
Right of Way Width (in mt.) ROW_Width Double
10 Up to 4 decimals
Right of Way Width in metres
Maintained By Maintain Text 15 Municipal body/NHAI/R & B Dept./Other
Foot Path FP Text 3 Yes/No Foot path width (in mt. in case Yes)
FP_Width Double 10 Up to 2 decimals
Footpath Width in metres
Foot Path Construction material
FP_Cons_Ma Text 15 Shabad/Tiles/Concrete/Other Stone
Table 6b: Road Polygon GIS Data Structure
Geo-spatial Layer Name: Road_Poly
Attribute Name
Attribute Field Name
Attribute Field Type
Attribute Field
Width Description/Value
Code Code Alphanumeric 10 Code as given in Table 6 Sub-Class Sub_Class Text 50 Sub Class as given in Table 6 Road Name Rd_Name Text 30
Specific Name of the road, if any
Table 7: Rail – Geo-Spatial Data Content
S.No CODE CLASS SUB-CLASS GEOMETRY SYMBOL
2
02-01
Rail
Broad Gauge Line 02-02 Narrow Gauge Line 02-03 Meter Gauge Line 02-04 Metro/MRTS Line 02-05 MMTS Line

Formulation of GIS based Master Plan for AMRUT Cities – Design & Standards 14
Table 7a: Rail Line GIS Data Structure Geo-spatial Layer Name: Rail_Line
Attribute Name
Attribute Field Name
Attribute Field Type
Attribute Field
Width Description/Value
Rail Id Rail_ID Alphanumeric 15 Unique Id Code Code Alphanumeric 10 Code as given in Table 7 Sub-Class Sub_Class Text 50 Sub Class as given in Table 7 Railway Line Name
Rly_Name Text 30 Specific Name of the railway line, if any
Table 8: Bridges/Flyovers –Geo-Spatial Data Content
S.No CODE CLASS SUB-CLASS GEOMETRY SYMBOL
3
03-01
Bridges
Culvert Line 03-02 Tunnel Line 03-03 Bridge across river Line 03-04 Over Bridge Line 03-05 Under Pass Line 03-06 Road Bridge across
Rail Line
03-07 Subway Line 03-08 Foot over bridge Line 03-09 Rope bridge Line
4 04-01 Flyovers Flyover Line
Table 8a: Bridges & Flyovers GIS Data Structure Geo-spatial Layer Name: Bridge_Flyover_Line
Attribute Name Attribute
Field Name
Attribute Field Type
Attribute Field
Width Description/Value
Bridge & Flyover ID Br_Fly_ID Alphanumeric 15 Unique Id Code Code Alphanumeric 10 Code as given in Table 8 Sub-Class Sub_Class Text 20 Sub Class as given in Table 8
Road ID Rd_ID Alphanumeric 15 Road ID same as in Road_C Line
Road Name Rd_Name Text 30 Road Name same as in Road_C Line
Rail Id Rail_ID Alphanumeric 15 Rail ID same as in Rail_Line Railway Line Name Rly_Name Text 30
Railway Line Name same as in Rail_Line
Ward Number Ward_No Alphanumeric 10 Ward Number
Formulation of GIS based Master Plan for AMRUT Cities – Design & Standards 15
Attribute Name Attribute
Field Name
Attribute Field Type
Attribute Field
Width Description/Value
Locality Name Locality Text 50 Locality Name Bridge/Flyover Width (in mt.) Width Double
10 Upto 2 decimals
Width in metres
Bridge/Flyover Length (in mt.) Length Double
10 Upto 2 decimals
Length in metres
Construction Material Cons_Mat Text 15
Iron/Masonry/Concrete/Any Other
Construction Year Cons_Yr Text 4 Year of Construction
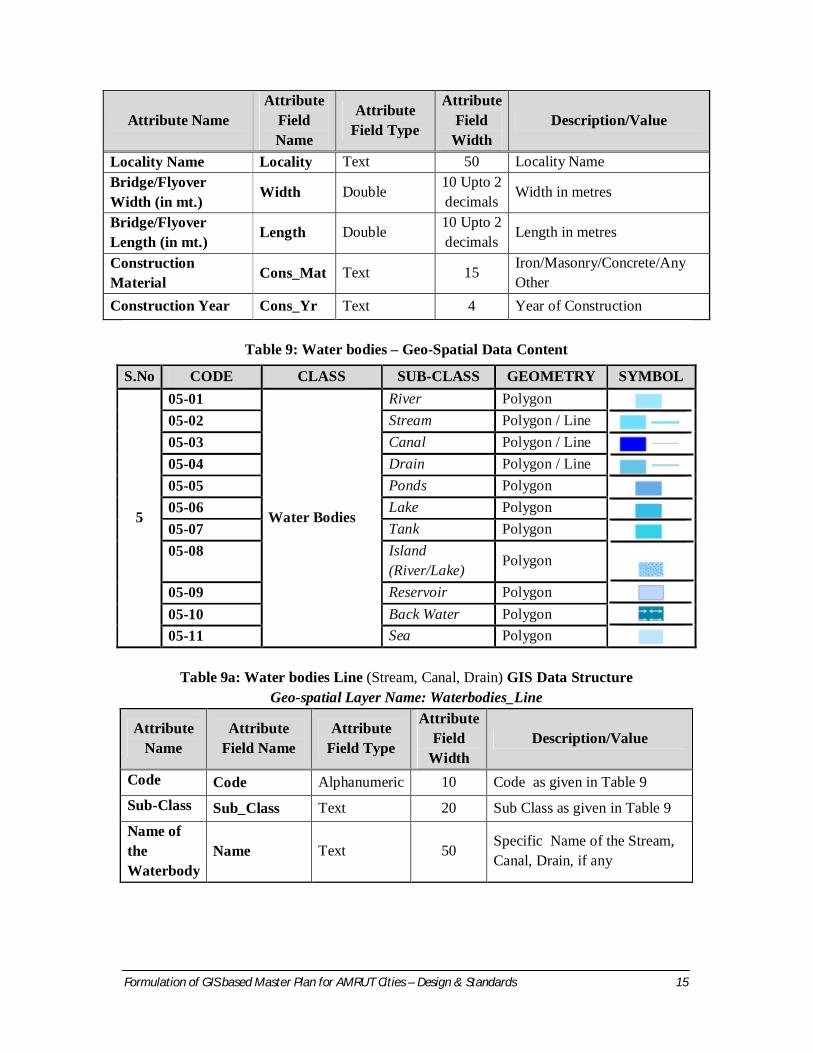
Table 9: Water bodies – Geo-Spatial Data Content
Table 9a: Water bodies Line (Stream, Canal, Drain) GIS Data Structure
Geo-spatial Layer Name: Waterbodies_Line
Attribute Name
Attribute Field Name
Attribute Field Type
Attribute Field
Width Description/Value
Code Code Alphanumeric 10 Code as given in Table 9 Sub-Class Sub_Class Text 20 Sub Class as given in Table 9 Name of the Waterbody
Name Text 50 Specific Name of the Stream, Canal, Drain, if any
S.No CODE CLASS SUB-CLASS GEOMETRY SYMBOL
5
05-01
Water Bodies
River Polygon 05-02 Stream Polygon / Line
05-03 Canal Polygon / Line
05-04 Drain Polygon / Line
05-05 Ponds Polygon 05-06 Lake Polygon 05-07 Tank Polygon 05-08 Island
(River/Lake) Polygon
05-09 Reservoir Polygon 05-10 Back Water Polygon 05-11 Sea Polygon

Formulation of GIS based Master Plan for AMRUT Cities – Design & Standards 16
All the urban land uses are extracted as polygons, except a few, such as Community Toilet, Fire Station, Garbage Collection points, Landfill sites & Dumping yard, Cell towers, Slums, Bus Stops, Trees etc, which are extracted as points. Out of these urban land use point features, some of them have feature specific attributes which are provided in the following respective attribute and GIS structure tables.
Table 9b: Water bodies Polygon GIS Data Structure Geo-spatial Layer Name: Waterbodies_Poly
Attribute Name
Attribute Field Name
Attribute Field Type
Attribute Field
Width Description/Value
Code Code Alphanumeric 10 Code as given in Table 9 Sub-Class Sub_Class Text 20 Sub Class as given in Table 9 Name of the Waterbody
Name Text 50 Specific Name of the waterbody, if any
II. URBAN LAND USE/LAND COVER:
Table 10: Urban Land use/Land cover - Geo-Spatial Data Content
S.No CODE CLASS SUB-CLASS GEOMETRY SYMBOL
1
06-01
Residential
Residential Area/Colony Polygon
06-02 Township Polygon 06-03 Housing scheme Polygon
2
07-01
Commercial
Retail Polygon 07-02 Wholesale Polygon 07-03 General Business Polygon 07-04 Hotel / Lodge /
Restaurant Polygon
07-05 Shopping Centre / Mall Polygon
07-06 Multiplex / Cinema Polygon 07-07 Function Hall /
Marriage Garden Polygon
07-08 Warehouse Polygon 07-09 Storage Godown Polygon 07-10 Resort Polygon 07-11 Petrol Pump / LPG
filling station Polygon
07-12 Informal Shop Polygon

Formulation of GIS based Master Plan for AMRUT Cities – Design & Standards 17
S.No CODE CLASS SUB-CLASS GEOMETRY SYMBOL 07-13 Hostel Polygon 07-14 Market (Daily &
Weekly) / Mandi Polygon
3
08-01
Industrial
Manufacturing Polygon 08-02 Service Polygon 08-03 Chemical Polygon 08-04 Pharmaceutical Polygon 08-05 Textile Polygon 08-06 IT Parks Polygon 08-07 Industrial Estate /
SEZ Polygon
08-08 Agro based & Food Processing
Polygon
08-09 Obnoxious Polygon 08-10 Cottage and
Household Polygon
08-11 Other Industries Polygon
4
09-01
Mixed
Residential & Commercial Polygon
09-02 Residential & Household Industry
Polygon
09-03 Residential & Educational Polygon
09-04 Residential & Health Services Polygon
09-05 Commercial & Industrial Polygon
09-06 Commercial & Health Services
Polygon
09-07 Commercial & Educational Polygon
09-08 Commercial & Recreational Polygon
09-09 Residential & Commercial & Institutional
Polygon
5
10-01
Educational
School Polygon 10-02 College Polygon 10-03 University Polygon 10-04 Vocational Institute Polygon

Formulation of GIS based Master Plan for AMRUT Cities – Design & Standards 18
S.No CODE CLASS SUB-CLASS GEOMETRY SYMBOL 10-05 Anganwari Polygon 10-06 Training Institute Polygon
6
11-01
Health Services
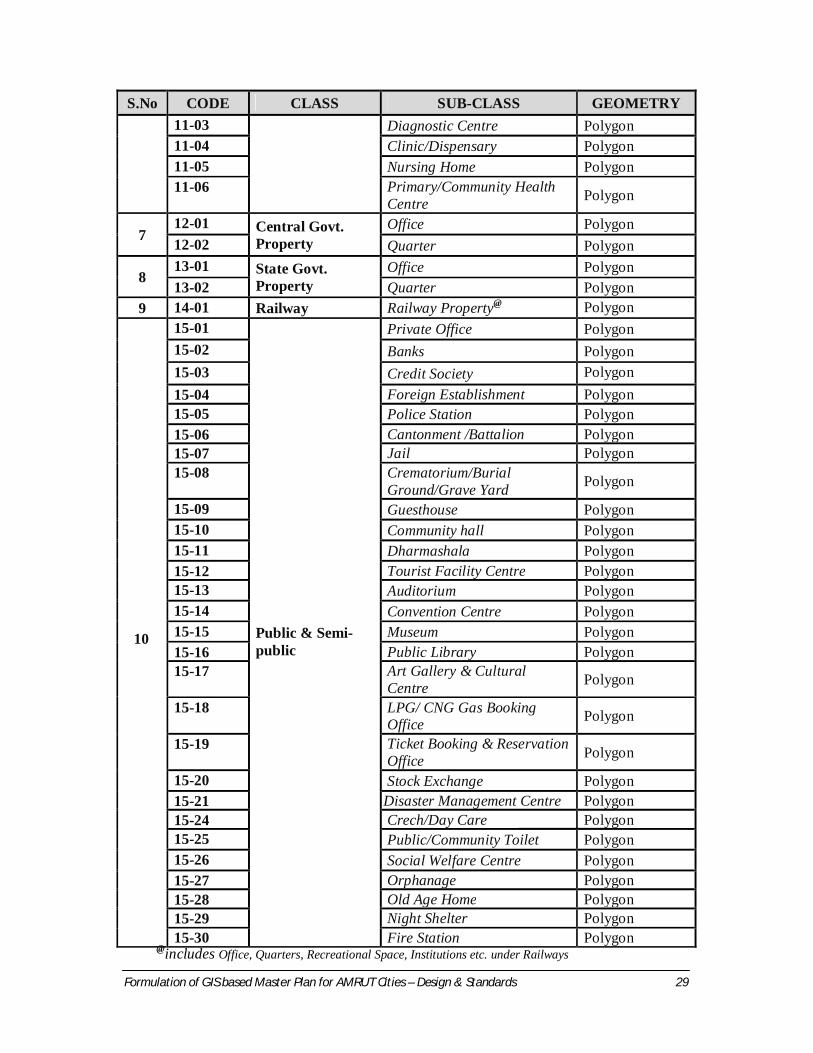
Govt. Hospital Polygon 11-02 Private Hospital Polygon 11-03 Diagnostic Centre Polygon 11-04 Clinic/Dispensary Polygon 11-05 Nursing Home Polygon 11-06 Primary/Community
Health Centre Polygon
7 12-01 Central Govt.
Property Office Polygon
12-02 Quarter Polygon
8 13-01 State Govt. Property
Office Polygon 13-02 Quarter Polygon
9 14-01 Railway Railway Property@ Polygon
10 15-01
Public& Semi-public
Private Office Polygon 15-02 Banks Polygon 15-03 Credit Society Polygon 15-04 Foreign
Establishment Polygon
15-05 Police Station Polygon 15-06 Cantonment/Battalion Polygon 15-07 Jail Polygon 15-08 Crematorium Burial
Groun /Grave Yard Polygon
15-09 Guesthouse Polygon 15-10 Community hall Polygon 15-11 Dharmashala Polygon 15-12 Tourist Facility
Centre Polygon
15-13 Auditorium Polygon 15-14 Convention Centre Polygon 15-15 Museum Polygon 15-16 Public Library Polygon 15-17 Art Gallery &
Cultural Centre Polygon
15-18 LPG/CNG Gas Booking Office Polygon
15-19 Ticket Booking & Reservation Office Polygon
15-20 Stock Exchange Polygon 15-21 Disaster Management
Centre Polygon @includes Office, Quarters, Recreational Space, Institutions etc. under Railways
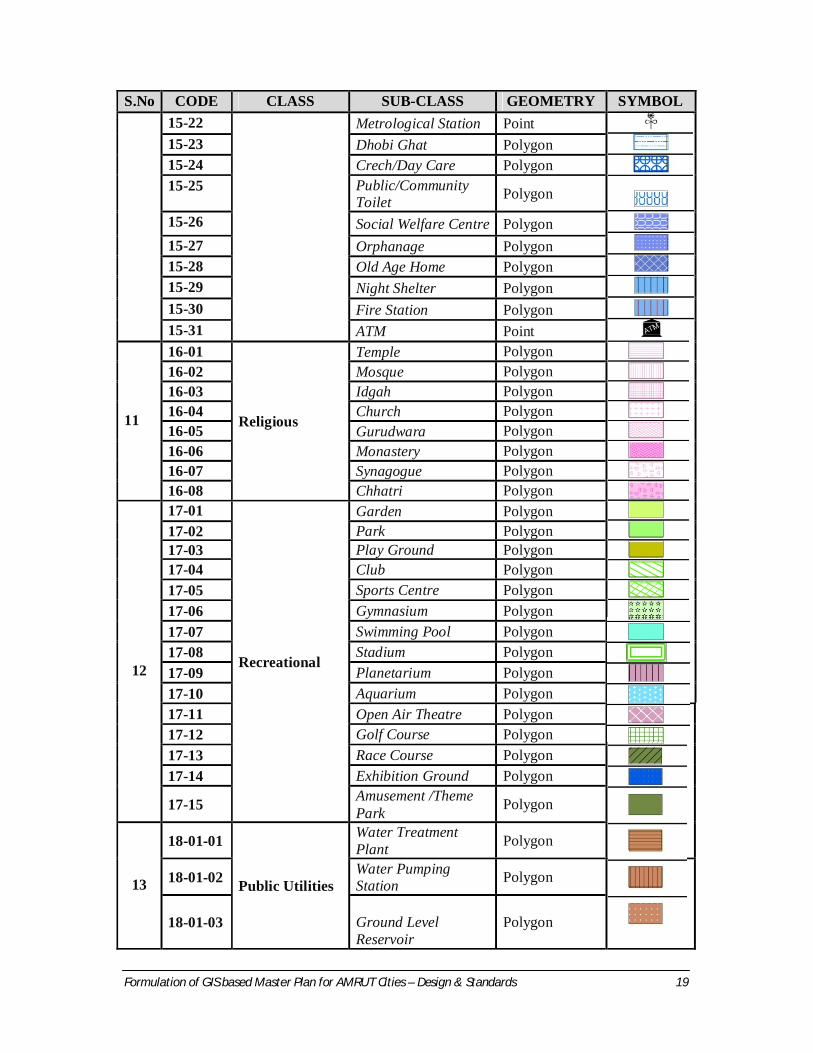
Formulation of GIS based Master Plan for AMRUT Cities – Design & Standards 19
S.No CODE CLASS SUB-CLASS GEOMETRY SYMBOL 15-22 Metrological Station Point 15-23 Dhobi Ghat Polygon 15-24 Crech/Day Care Polygon 15-25 Public/Community
Toilet Polygon
15-26 Social Welfare Centre Polygon 15-27 Orphanage Polygon 15-28 Old Age Home Polygon 15-29 Night Shelter Polygon 15-30 Fire Station Polygon 15-31 ATM Point
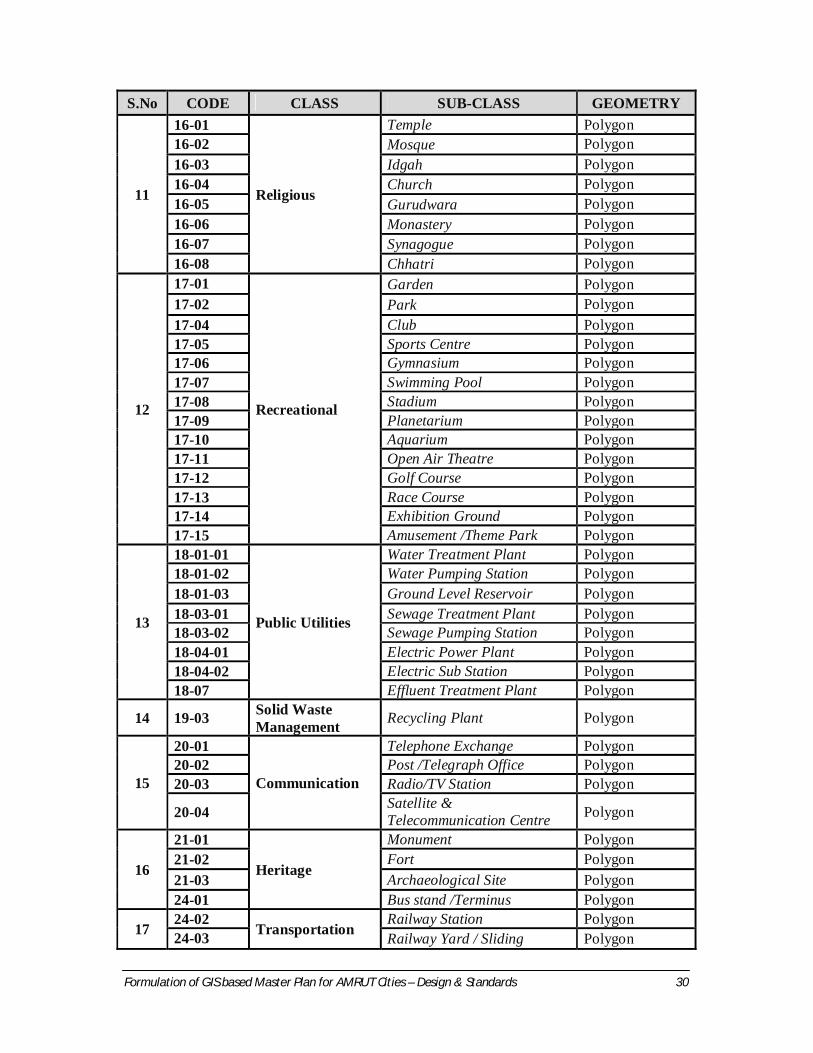
11
16-01
Religious
Temple Polygon 16-02 Mosque Polygon 16-03 Idgah Polygon 16-04 Church Polygon 16-05 Gurudwara Polygon 16-06 Monastery Polygon 16-07 Synagogue Polygon 16-08 Chhatri Polygon
12
17-01
Recreational
Garden Polygon 17-02 Park Polygon 17-03 Play Ground Polygon 17-04 Club Polygon 17-05 Sports Centre Polygon 17-06 Gymnasium Polygon 17-07 Swimming Pool Polygon 17-08 Stadium Polygon 17-09 Planetarium Polygon 17-10 Aquarium Polygon 17-11 Open Air Theatre Polygon 17-12 Golf Course Polygon 17-13 Race Course Polygon 17-14 Exhibition Ground Polygon
17-15 Amusement /Theme Park Polygon
13
18-01-01
Public Utilities
Water Treatment Plant Polygon
18-01-02 Water Pumping Station Polygon
18-01-03 Ground Level Reservoir
Polygon

Formulation of GIS based Master Plan for AMRUT Cities – Design & Standards 20
S.No CODE CLASS SUB-CLASS GEOMETRY SYMBOL
18-03-01 Sewage Treatment Plant Polygon
18-03-02 Sewage Pumping Station Polygon
18-04-01 Electric Power Plant Polygon
18-04-02 Electric Sub-Station Polygon
18-05-01 City Gate Metering Stations
Polygon
18-05-02 Area Regulator Stations
Polygon
18-06 Rain Water Harvesting System Polygon
18-07 Effluent Treatment Plant Polygon
14
19-01
Solid Waste Management
Land Fill Site Polygon 19-02 Dumping Yard Polygon 19-03 Recycling Plant Polygon
19-04 Garbage Collection Point/Dumper Point
15
20-01
Communication
Telephone exchange Polygon 20-02 Post/Telegraph Office Polygon 20-03 Radio/TV Station Polygon
20-04 Satellite & Telecommunication Centre
Polygon
20-05 Public Telephone Booth Point
20-06 Cell Tower Point
20-07 WiFi Hotspot Point
16 21-01
Heritage Monument Polygon
21-02 Fort Polygon 21-03 Archaeological Site Polygon
17
22-01
Slum
Notified Slum Polygon 22-02 Non- notified Slum Polygon 22-03 Squatter / Kachibasti Polygon
18
23-01
Vacant Land
Private Vacant Polygon 23-02 Municipal Asset Polygon 23-03 Government Asset Polygon 23-04 Reclaimed Land Polygon 23-05 Layout / Plotted Polygon
19 24-01 Transportation Bus stand /Terminus Polygon

Formulation of GIS based Master Plan for AMRUT Cities – Design & Standards 21
S.No CODE CLASS SUB-CLASS GEOMETRY SYMBOL 24-02 Railway Station Polygon 24-03 Railway Yard / Siding Polygon 24-04 Railway Track Area Polygon 24-05 Airport / Airstrip Polygon 24-06 Helipad Polygon 24-07 Port Polygon 24-08 Harbour Polygon 24-09 Jetty Polygon 24-10 Truck Terminus Polygon 24-11 Freight Complex Polygon 24-12 Taxi Stand Polygon 24-13 Auto Stand Polygon 24-14 Cycle rickshaw/Cycle
/Cart stand Polygon
24-15 Bus Bay Polygon 24-16 Bus Stop Polygon/Point 24-17 Transport Nagar Polygon
20 25-01
Traffic related Traffic Island Polygon
25-02 Median / Divider Polygon 25-03 Parking Space / Area Polygon
21 26-01 Rural Village / Abadi Area Polygon
22
27-01
Green Areas
Reserved Forest Polygon 27-02 Protected Forest /
Notified Forest Polygon
27-03 Social Polygon Green belt Polygon 27-04 Tree Clad Area Polygon 27-05 Tree Point
23
28-01
Agricultural Land
Cropland Polygon 28-02 Fallow land Polygon 28-03 Plantations Polygon 28-04 Orchard Polygon 28-05 Horticulture Polygon 28-06 Plant nursery Polygon
24
29-01
Wetlands
Waterlogged Polygon 29-02 Low lying area Polygon 29-03 Marshy Polygon 29-04 Swampy Polygon 29-05 Mudflat Polygon 29-06 Creek Polygon

Formulation of GIS based Master Plan for AMRUT Cities – Design & Standards 22
S.No CODE CLASS SUB-CLASS GEOMETRY SYMBOL
25
30-01
Wastelands
Scrubland Polygon 30-02 Barren Polygon 30-03 Rocky Polygon 30-04 Sandy area Polygon 30-05 Salt affected Polygon 30-06 Gullied Polygon
26
31-01
Specific Land Use
Hill / Mountain Polygon 31-02 Snow covered area Polygon 31-03 Mining Area Polygon 31-04 Grazing land Polygon 31-05 Pastures Polygon 31-06 Meadows Polygon 31-07 Tea/Coffee Garden Polygon 31-08 Ghats Polygon 31-09 Coral Reef Polygon 31-10 Sand Dunes Polygon
27
32-01
Eco-Sensitive Areas
Bird Sanctuary Polygon 32-02 Bio-diversity Park Polygon 32-03 Botanical Garden Polygon 32-04 Zoo Polygon 32-05 National Park Polygon 32-06 Mangrove Polygon 32-07 Oxbow Lakes Polygon 32-08 Paleo channels Polygon
28
33-01
Others
Salt pan Polygon 33-02 Aquaculture Polygon 33-03 Brick kiln Polygon 33-04 Quarry Polygon 33-05 Dam Polygon 33-06 Barrage Polygon 33-07 Aqueduct Polygon 33-08 Weir Polygon 33-09 Farm house Polygon 33-10 Dairy farm Polygon 33-11 Poultry farm Polygon 33-12 Nursery Polygon 33-13 Slaughter House Polygon 33-14 Dairy Booth Polygon/Point 33-15 Lighthouse Point 33-16 Beach Polygon

Formulation of GIS based Master Plan for AMRUT Cities – Design & Standards 23
Table 10a: Urban Land use/Landcover Polygon GIS Data Structure Geo-spatial Layer Name: ULU_Poly
Attribute Name
Attribute Field Name
Attribute Field Type
Attribute Field
Width Description/Value
Code Code Alphanumeric 10 Code as given in Table 10
Class Class Text 25 Class as given in Table 10
Sub-Class Sub_Class Text 50 Sub Class as given in Table 10
Area in sq. mt. Area Double
10 Up to 4 decimals
Area of corresponding feature in sq. mt.
Name Name Text 50 Name of the Landmark
Table 10b: Community Toilet GIS Data Structure Geo-spatial Layer Name: Community_toilet
Attribute Name
Attribute Field Name
Attribute Field Type
Attribute Field
Width Description/Value
Toilet ID CT_Pnt_ID Alphanumeric 15 Unique Id
Code Code Alphanumeric 10 Code as given in Table 10 Ward Number Ward_No Alphanumeric 10 Ward Number
Road ID Rd_ID Alphanumeric 15 Road ID same as in Road_C Line
Road Name Rd_Name Text 30 Road Name same as in Road_C Line
Locality Name Locality Text 50 Locality Name
Toilet Status Status Text 15 Working/Not working
Toilet Type Type Text 15 Eco-friendly/General Mode of Construction Mode Text 5 Public/PPP

Formulation of GIS based Master Plan for AMRUT Cities – Design & Standards 24
Table 10c: Fire Station GIS Data Structure Geo-spatial Layer Name: Fire_Station
Attribute Name Attribute
Field Name Attribute
Field Type
Attribute Field
Width Description/Value
Fire Station ID FS_Pnt_ID Alphanumeric 15 Unique Id
Code Code Alphanumeric 10 Code as given in Table 10
Ward Number Ward_No Alphanumeric 10 Ward Number
Road ID Rd_ID Alphanumeric 15 Road ID same as in Road_C Line
Road Name Rd_Name Text 30 Road Name same as in Road_C Line
Locality Name Locality Text 50 Locality Name
Fire Station Status
Status Text 15 Working/Not working
Table 10d: Garbage Collection Points/Dumper GIS Data Structure
Geo-spatial Layer Name: Garb_Coll_Pnt
Attribute Name Attribute
Field Name
Attribute Field Type
Attribute Field
Width Description/Value
Garbage collection point ID
GC_Pnt_ID
Alphanumeric 15 Unique Id
Code Code Alphanumeric 10 Code as given in Table 10
Ward Number Ward_No Alphanumeric 10 Ward Number
Road ID Rd_ID Alphanumeric 15 Road ID same as in Road_C line
Road Name Rd_Name Text 30 Road Name same as in Road_C line
Locality Name Locality Text 50 Locality Name
Type of garbage Garb_Type
Text 30 Domestic/Biomedical/Kitchen/Construction/Mixed
Status of Garbage collection point
Status Text 30 Temporary/Permanent and Collection point/Transfer point
Coverage area of a collection point
Cov_area Double 10 Up to 4 decimals
Coverage area (No of houses or colonies covered by a point)

Formulation of GIS based Master Plan for AMRUT Cities – Design & Standards 25
Table 10e: Landfill Sites and Dumping Yard GIS Data Structure Geo-spatial Layer Name: Landfill_Dumpyard_Pnt
Attribute Name
Attribute Field Name
Attribute Field Type
Attribute Field
Width Description/Value
Landfill site/Dumping Yard point ID
LD_Pnt_ID Alphanumeric 15 Unique Id
Code Code Alphanumeric 10 Code as given in Table 10 Sub-Class Sub_Class Text 50 Sub Class as given in Table 10 Ward Number Ward_No Alphanumeric 10 Ward Number
Road ID Rd_ID Alphanumeric 15 Road ID same as in Road_CLine
Road Name Rd_Name Text 30 Road Name same as in Road_CLine
Locality Name Locality Text 50 Locality Name
Name of the Landfill site/Dumping Yard
Name Text 30 Specific Name of the landfill site or dumping yard, if any
Table 10f: Cell Towers, Wi-Fi Hotspots & Public Telephone Booth GIS Data Structure
Geo-spatial Layer Name: Communication_Pnt
Attribute Name Attribute Field Name
Attribute Field Type
Attribute Field
Width Description/Value
Communication Point ID Com_Pnt_ID Alphanumeric 15 Unique Id
Code Code Alphanumeric 10 Code as given in Table 10
Sub-Class Sub_Class Text 20 Sub Class as given in Table 10
Ward Number Ward_No Alphanumeric 10 Ward Number
Road ID Rd_ID Alphanumeric 15 Road ID same as in Road_CLine
Road Name Rd_Name Text 30 Road Name same as in Road_CLine
Locality Name Locality Text 50 Locality Name
Description Descr Text 15 On Building/On ground
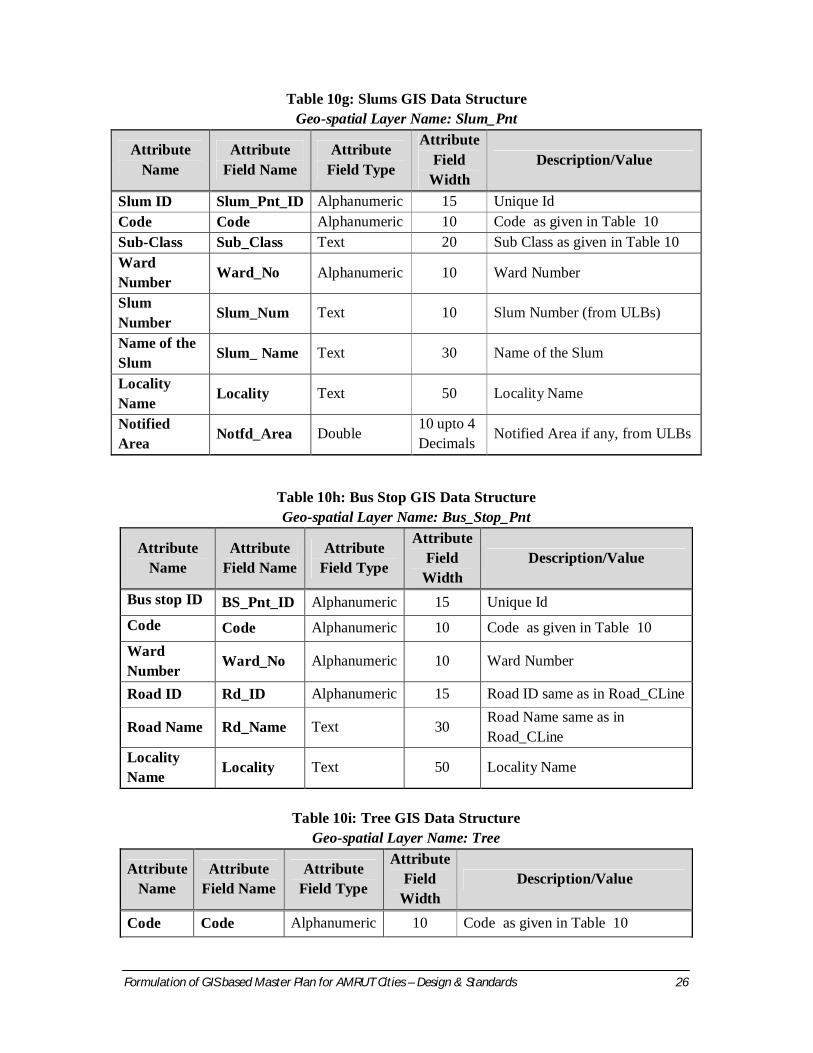
Formulation of GIS based Master Plan for AMRUT Cities – Design & Standards 26
Table 10g: Slums GIS Data Structure Geo-spatial Layer Name: Slum_Pnt
Attribute Name
Attribute Field Name
Attribute Field Type
Attribute Field
Width Description/Value
Slum ID Slum_Pnt_ID Alphanumeric 15 Unique Id Code Code Alphanumeric 10 Code as given in Table 10 Sub-Class Sub_Class Text 20 Sub Class as given in Table 10 Ward Number Ward_No Alphanumeric 10 Ward Number
Slum Number Slum_Num Text 10 Slum Number (from ULBs)
Name of the Slum Slum_ Name Text 30 Name of the Slum
Locality Name Locality Text 50 Locality Name
Notified Area Notfd_Area Double
10 upto 4 Decimals
Notified Area if any, from ULBs
Table 10h: Bus Stop GIS Data Structure Geo-spatial Layer Name: Bus_Stop_Pnt
Attribute Name
Attribute Field Name
Attribute Field Type
Attribute Field
Width Description/Value
Bus stop ID BS_Pnt_ID Alphanumeric 15 Unique Id Code Code Alphanumeric 10 Code as given in Table 10 Ward Number Ward_No Alphanumeric 10 Ward Number
Road ID Rd_ID Alphanumeric 15 Road ID same as in Road_CLine
Road Name Rd_Name Text 30 Road Name same as in Road_CLine
Locality Name Locality Text 50 Locality Name
Table 10i: Tree GIS Data Structure
Geo-spatial Layer Name: Tree
Attribute Name
Attribute Field Name
Attribute Field Type
Attribute Field
Width Description/Value
Code Code Alphanumeric 10 Code as given in Table 10

Formulation of GIS based Master Plan for AMRUT Cities – Design & Standards 27
Table 10j: Other Urban Landuse Points: ATM, Meteorological Station, Dairy Booth, Light House and Other if any GIS Data Structure
Geo-spatial Layer Name: ULU_Pnt
Attribute Name
Attribute Field Name
Attribute Field Type
Attribute Field
Width Description/Value
Point ID Pnt_ID Alphanumeric 15 Unique Id Code Code Alphanumeric 10 Code as given in Table 10
Class Class Text 25 Class as given in Table 10
Sub-Class Sub_Class Text 50 Sub Class as given in Table 10 Ward Number Ward_No Alphanumeric 10 Ward Number
Road ID Rd_ID Alphanumeric 15 Road ID same as in Road_CLine Road Name
Rd_Name Text 30 Road Name same as in Road_CLine
Locality Name Locality Text 50 Locality Name
II. BUILDING FOOTPRINT:
Table 11: Building Footprint – Geo-Spatial Data Content S.No CODE CLASS SUB-CLASS GEOMETRY
1 06-04
Residential House Polygon
06-05 Group of Houses Polygon 06-06 Apartment Polygon
2
07-01
Commercial
Retail Polygon 07-02 Wholesale Polygon 07-03 General Business Polygon 07-04 Hotel/Lodge/Restaurant Polygon 07-05 Shopping Centre/Mall Polygon 07-06 Multiplex/Cinema Polygon
Buildings falling within each of the Class/Sub-class of urban land use/land cover shall be represented in the same Sub-class of Building Footprint Layer. For example, buildings falling within ‘Commercial Retail’ urban landuse/land cover area will be represented as ‘Commercial Retail’ buildings. The building footprints shall overlap with urban landuse/land cover.
A single symbol shall be used for representation of all buildings. The Sub-Class details for each building will be provided as an attribute.

Formulation of GIS based Master Plan for AMRUT Cities – Design & Standards 28
S.No CODE CLASS SUB-CLASS GEOMETRY 07-07 Function Hall/ Marriage
Garden Polygon
07-08 Warehouse Polygon 07-09 Storage Godown Polygon 07-10 Resort Polygon 07-11 Petrol Pump/LPG filling
station Polygon
07-12 Informal Shop Polygon 07-13 Hostel Polygon
3
08-01
Industrial
Manufacturing Polygon 08-02 Service Polygon 08-03 Chemical Polygon 08-04 Pharmaceutical Polygon 08-05 Textile Polygon 08-06 IT Parks Polygon 08-07 Industrial Estate/SEZ Polygon 08-08 Agro based & Food
Processing Polygon
08-09 Obnoxious Polygon 08-10 Cottage & Household Polygon 08-11 Other Industries Polygon
4
09-01
Mixed
Residential & Commercial Polygon 09-02 Residential & Household
Industry Polygon
09-03 Residential & Educational Polygon 09-04 Residential & Health Services Polygon 09-05 Commercial &
Industrial Polygon
09-06 Commercial & Health Services Polygon
09-07 Commercial and Educational Polygon 09-08 Commercial and Recreational Polygon 09-09 Residential & Commercial &
Institutional Polygon
5
10-01
Educational
School Polygon 10-02 College Polygon 10-03 University Polygon 10-04 Vocational Institute Polygon 10-05 Anganwari Polygon 10-06 Training Institute Polygon
6 11-01
Health Services Govt. Hospital Polygon
11-02 Private Hospital Polygon
Formulation of GIS based Master Plan for AMRUT Cities – Design & Standards 29
S.No CODE CLASS SUB-CLASS GEOMETRY 11-03 Diagnostic Centre Polygon 11-04 Clinic/Dispensary Polygon 11-05 Nursing Home Polygon 11-06 Primary/Community Health
Centre Polygon
7 12-01 Central Govt.
Property Office Polygon
12-02 Quarter Polygon
8 13-01 State Govt.
Property Office Polygon
13-02 Quarter Polygon 9 14-01 Railway Railway Property@ Polygon
10 15-01
Public & Semi-public
Private Office Polygon 15-02 Banks Polygon 15-03 Credit Society Polygon 15-04 Foreign Establishment Polygon 15-05 Police Station Polygon 15-06 Cantonment /Battalion Polygon 15-07 Jail Polygon 15-08 Crematorium/Burial
Ground/Grave Yard Polygon
15-09 Guesthouse Polygon 15-10 Community hall Polygon 15-11 Dharmashala Polygon 15-12 Tourist Facility Centre Polygon 15-13 Auditorium Polygon 15-14 Convention Centre Polygon 15-15 Museum Polygon 15-16 Public Library Polygon 15-17 Art Gallery & Cultural
Centre Polygon
15-18 LPG/ CNG Gas Booking Office Polygon
15-19 Ticket Booking & Reservation Office Polygon
15-20 Stock Exchange Polygon 15-21 Disaster Management Centre Polygon 15-24 Crech/Day Care Polygon 15-25 Public/Community Toilet Polygon 15-26 Social Welfare Centre Polygon 15-27 Orphanage Polygon 15-28 Old Age Home Polygon 15-29 Night Shelter Polygon 15-30 Fire Station Polygon
@includes Office, Quarters, Recreational Space, Institutions etc. under Railways
10
Formulation of GIS based Master Plan for AMRUT Cities – Design & Standards 30
S.No CODE CLASS SUB-CLASS GEOMETRY
11
16-01
Religious
Temple Polygon 16-02 Mosque Polygon 16-03 Idgah Polygon 16-04 Church Polygon 16-05 Gurudwara Polygon 16-06 Monastery Polygon 16-07 Synagogue Polygon 16-08 Chhatri Polygon
12
17-01
Recreational
Garden Polygon 17-02 Park Polygon 17-04 Club Polygon 17-05 Sports Centre Polygon 17-06 Gymnasium Polygon 17-07 Swimming Pool Polygon 17-08 Stadium Polygon 17-09 Planetarium Polygon 17-10 Aquarium Polygon 17-11 Open Air Theatre Polygon 17-12 Golf Course Polygon 17-13 Race Course Polygon 17-14 Exhibition Ground Polygon 17-15 Amusement /Theme Park Polygon
13
18-01-01
Public Utilities
Water Treatment Plant Polygon 18-01-02 Water Pumping Station Polygon 18-01-03 Ground Level Reservoir Polygon 18-03-01 Sewage Treatment Plant Polygon 18-03-02 Sewage Pumping Station Polygon 18-04-01 Electric Power Plant Polygon 18-04-02 Electric Sub Station Polygon 18-07 Effluent Treatment Plant Polygon
14 19-03 Solid Waste Management Recycling Plant Polygon
15
20-01
Communication
Telephone Exchange Polygon 20-02 Post /Telegraph Office Polygon 20-03 Radio/TV Station Polygon
20-04 Satellite & Telecommunication Centre Polygon
16
21-01
Heritage
Monument Polygon 21-02 Fort Polygon 21-03 Archaeological Site Polygon 24-01 Bus stand /Terminus Polygon
17 24-02
Transportation Railway Station Polygon
24-03 Railway Yard / Sliding Polygon

Formulation of GIS based Master Plan for AMRUT Cities – Design & Standards 31
S.No CODE CLASS SUB-CLASS GEOMETRY 24-05 Airport / Airstrip Polygon 24-07 Port Polygon 24-08 Harbour Polygon 24-10 Truck Terminus Polygon 24-11 Freight Complex Polygon 24-17 Transport Nagar Polygon
18 25-04 Traffic related Multi-level Parking Polygon
19 26-02
Rural House Polygon
26-03 Group of Houses Polygon 26-04 Apartment Polygon
20 31-07 Specific Land use Tea/Coffee Garden Polygon
21
32-01
Eco-Sensitive Areas
Bird Sanctuary Polygon 32-02 Bio-diversity Park Polygon 32-03 Botanical Garden Polygon 32-04 Zoo Polygon 32-05 National Park Polygon
22
33-09
Others
Farm house Polygon 33-10 Dairy farm Polygon 33-11 Poultry farm Polygon 33-13 Slaughter House Polygon 33-14 Dairy Booth Polygon
Table 11a: Buildings GIS Data Structure
Geo-spatial Layer Name: Building_footprint Attribute
Name Attribute
Field Name Attribute
Field Type Attribute
Field Width Description/Value
Code Code Alphanumeric 10 Code as given in Table 11
Class Class Text 25 Class as given in Table 11
Sub-Class Sub_Class Text 50 Sub Class as given in Table 11
Ward Number Ward_No Alphanumeric 10 Ward Number
Road ID Rd_ID Alphanumeric 15 Road ID same as in Road_CLine
Road Name Rd_Name Text 30 Road Name same as in Road_CLine
Locality Name Locality Text 50 Locality Name

Formulation of GIS based Master Plan for AMRUT Cities – Design & Standards 32
Utility Layers:
All utility layers like Water Supply Network, Drainage Network, Sewage Network, Electricity Supply Network, Natural Gas Distribution Network database will be prepared from the data collected by ULBs from the concerned engineering and line departments.
All network lines are represented as lines and the nodes (starting point, intersections, valves, end points etc.) are represented as points.
Attribute Name
Attribute Field Name
Attribute Field Type
Attribute Field Width Description/Value
Colony Name Colony Text 50 Colony Name
Number of floors No_floors Numeric 5
Number of floors in a building
Construction Type Cons_type Text 15
Pucca/Semi Pucca/Kutcha Area in sq. mt. Area Double
10 Up to 4 decimals
Area of corresponding building footprint
Description Descr Text 50 Name of building and Details, if any
IV. UTILITIES:
Table 12: Water Supply Network – Geo-Spatial Data Content
S.No CODE CLASS SUB-CLASS GEOMETRY SYMBOL
1
18-01-01
Water Supply
Network
Water Treatment Plant Point 18-01-02 Water Pumping Station Point 18-01-03 Ground Level Reservoir Point 18-01-04 Raw Water Main
Pipeline Line
18-01-05 Pumping Line Line 18-01-06 Distribution Pipeline Line 18-01-07 Service Pipeline Line 18-01-08 Supply Valve Point 18-01-09 Over Head Tank Point 18-01-10 Public Stand Post Point 18-01-11 Tube Well Point 18-01-12 Hand Pump Point

Formulation of GIS based Master Plan for AMRUT Cities – Design & Standards 33
Table 12a: Water Supply Network Line GIS Data Structure Geo-spatial Layer Name: Water_NW_Line
Attribute Name
Attribute Field Name
Attribute Field Type
Attribute Field
Width Description/Value
Water Supply ID
WS_Line_ID
Alphanumeric
15 Unique Id
Code Code Alphanumeric
10 Code as given in Table 12
Sub-Class Sub_Class Text 50 Sub Class as given in Table 12 Ward Number Ward_No
Alphanumeric
10 Ward Number
Road ID Rd_ID Alphanumeric
15 Road ID same as in Road_CLine
Road Name Rd_Name Text 30 Road Name same as in Road_CLine
Locality Name Locality Text 50 Locality Name
Distance from road (in mt.)
Dis_frm_rd
Double 10 Upto 2 Decimals
Distance from road in meters
Construction Material
Cons_Mat Text 10
PSC/DI/HDPE/MS/RCC/Others/GI/AC/CI/PVC
Pipe Dia in mt. Pipe_Dia Numeric 5 Pipe Diameter in meters
Table 12b: Water Supply Network Points GIS Data Structure
Geo-spatial Layer Name: Water_NW_Pnt
Attribute Name
Attribute Field Name
Attribute Field Type
Attribute Field
Width Description/Value
Water Supply ID WS_Pnt_ID Alphanumeric 15 Unique Id
Code Code Alphanumeric 10 Code as given in Table 12 Sub_Class Sub_Class Text 50 Sub Class as given in Table 12 Ward Number Ward_No Alphanumeric 10 Ward Number
Road ID Rd_ID Alphanumeric 15 Road ID same as in Road_CLine
Road Name Rd_Name Text 30 Road Name same as in Road_CLine

Formulation of GIS based Master Plan for AMRUT Cities – Design & Standards 34
Attribute Name
Attribute Field Name
Attribute Field Type
Attribute Field
Width Description/Value
Locality Name Locality Text 50 Locality Name
Capacity Capacity Text 10
Capacity of Treatment plant, Pumping station, GLR, overhead tank in the respective units
Table 13: Storm Water Drainage Network – Geo-Spatial Data Content
S.No CODE CLASS SUB-CLASS GEOMETRY SYMBOL
2 18-02-01
Storm water Drainage
Storm Water Drain Line
18-02-02 Storm Water Vent Point
Table 13a: Storm water Drainage Network Line GIS Data Structure Geo-spatial Layer Name: Str_Drain_NW_Line
Attribute Name
Attribute Field Name
Attribute Field Type
Attribute Field
Width Description/Value
Storm Water Drainage ID Dr_Line_ID Alphanumeric 15 Unique Id
Code Code Alphanumeric 10 Code as given in Table 13
Sub-Class Sub_Class Text 50 Sub Class as given in Table 13
Ward Number Ward_No Alphanumeric 10 Ward Number
Road ID Rd_ID Alphanumeric 15 Road ID same as in Road_CLine
Road Name Rd_Name Text 30 Road Name same as in Road_CLine
Locality Name Locality Text 50 Locality Name Distance from road (in mt.) Dis_frm_rd Double
10 Upto 2 Decimals
Distance from road in meters
Depth in mt. Depth Double 10 Upto 2 Decimals
Depth of Drainage in meters
Construction Type Cons_Type Text 10 Box/Open Channel
Network Line Type NW_Type Text 15 Mainline/Service/Pumping

Formulation of GIS based Master Plan for AMRUT Cities – Design & Standards 35
Attribute Name
Attribute Field Name
Attribute Field Type
Attribute Field
Width Description/Value
Name of the Storm water drain
Name Text 50 Specific Name if any
Table 13b: Storm water Drainage Network Points GIS Data Structure
Geo-spatial Layer Name: Str_Drain_NW_Pnt
Attribute Name
Attribute Field Name
Attribute Field Type
Attribute Field
Width Description/Value
Storm Water Drainage ID
Dr_Pnt_ID Alphanumeric 15 Unique Id
Code Code Alphanumeric 10 Code as given in Table 13
Sub-Class Sub_Class Text 50 Sub Class as given in Table 13 Ward Number Ward_No Alphanumeric 10 Ward Number
Road ID Rd_ID Alphanumeric 15 Road ID same as in Road_CLine
Road Name Rd_Name Text 30 Road Name same as in Road_CLine
Locality Name Locality Text 50 Locality Name
Distance from road(in mt.)
Dis_frm_rd Double 10 Upto 2 Decimals
Distance from road in meters
Table 14: Sewerage Network – Geo-Spatial Data Content
S.No CODE CLASS SUB-CLASS GEOMETRY SYMBOL
1
18-03-01
Sewerage Network
Sewage Treatment Plant Point 18-03-02 Sewage Pumping Station Point 18-03-03 Pumping Line Line 18-03-04 Main Sewer Line Line 18-03-05 Branch Sewer Line Line 18-03-06 Service Sewer Line Line 18-03-07 Manhole Point 18-03-08 Vent Valve Point
Formulation of GIS based Master Plan for AMRUT Cities – Design & Standards 36
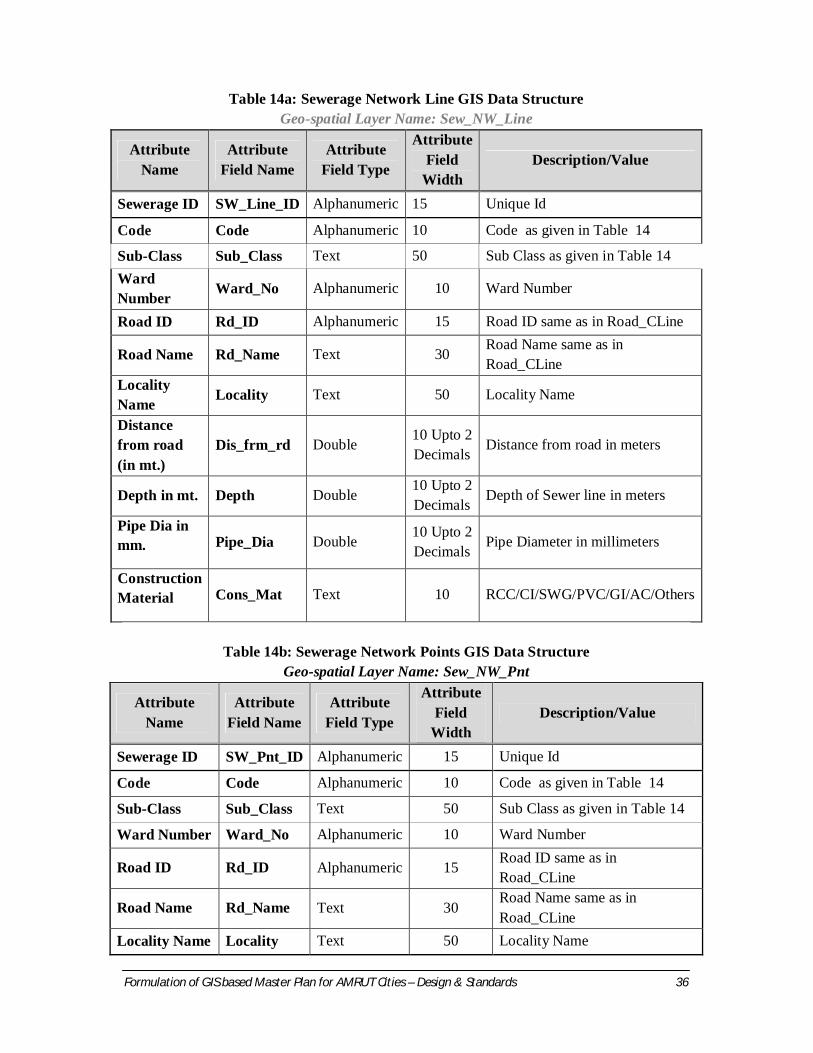
Table 14a: Sewerage Network Line GIS Data Structure Geo-spatial Layer Name: Sew_NW_Line
Attribute Name
Attribute Field Name
Attribute Field Type
Attribute Field
Width Description/Value
Sewerage ID SW_Line_ID Alphanumeric 15 Unique Id
Code Code Alphanumeric 10 Code as given in Table 14
Sub-Class Sub_Class Text 50 Sub Class as given in Table 14 Ward Number Ward_No Alphanumeric 10 Ward Number
Road ID Rd_ID Alphanumeric 15 Road ID same as in Road_CLine
Road Name Rd_Name Text 30 Road Name same as in Road_CLine
Locality Name Locality Text 50 Locality Name
Distance from road (in mt.)
Dis_frm_rd Double 10 Upto 2 Decimals
Distance from road in meters
Depth in mt. Depth Double 10 Upto 2 Decimals
Depth of Sewer line in meters
Pipe Dia in mm. Pipe_Dia Double
10 Upto 2 Decimals
Pipe Diameter in millimeters
Construction Material Cons_Mat Text 10 RCC/CI/SWG/PVC/GI/AC/Others
Table 14b: Sewerage Network Points GIS Data Structure
Geo-spatial Layer Name: Sew_NW_Pnt
Attribute Name
Attribute Field Name
Attribute Field Type
Attribute Field
Width Description/Value
Sewerage ID SW_Pnt_ID Alphanumeric 15 Unique Id
Code Code Alphanumeric 10 Code as given in Table 14
Sub-Class Sub_Class Text 50 Sub Class as given in Table 14
Ward Number Ward_No Alphanumeric 10 Ward Number
Road ID Rd_ID Alphanumeric 15 Road ID same as in Road_CLine
Road Name Rd_Name Text 30 Road Name same as in Road_CLine
Locality Name Locality Text 50 Locality Name

Formulation of GIS based Master Plan for AMRUT Cities – Design & Standards 37
Attribute Name
Attribute Field Name
Attribute Field Type
Attribute Field
Width Description/Value
Distance from road (in mt.) Dis_frm_rd Double
10 Upto 2 Decimals
Distance from road in meters
Table 15: Power Supply Network – Geo-Spatial Data Content
S.No CODE CLASS SUB-CLASS GEOMETRY SYMBOL
1
18-04-01
Power
Electric Power Plant Point
18-04-02 Electric Sub-Station Point
18-04-03 Transmission Tower Point
18-04-04 Transformer Point 18-04-05 33 Kv Line Line 18-04-06 11 Kv Line Line 18-04-07 Pole Point 18-04-08 Street Light Point
Table 15a: Power Supply Network Line GIS Data Structure
Geo-spatial Layer Name: Power_NW_Line
Attribute Name
Attribute Field Name
Attribute Field Type
Attribute Field
Width Description/Value
Power Supply ID
PS_Line_ID Alphanumeric 15 Unique Id
Code Code Alphanumeric 10 Code as given in Table 15
Sub-Class Sub_Class Text 50 Sub Class as given in Table 15 Ward Number Ward_No Alphanumeric 10 Ward Number
Road ID Rd_ID Alphanumeric 15 Road ID same as in Road_CLine Road Name Rd_Name Text 30
Road Name same as in Road_CLine
Locality Name Locality Text 50 Locality Name
Name of Power Line
Pow_Name Text 30 Power Line Name if any

Formulation of GIS based Master Plan for AMRUT Cities – Design & Standards 38
Table 15b: Power Supply Network Points GIS Data Structure Geo-spatial Layer Name: Power_NW_Pnt
Attribute Name
Attribute Field Name
Attribute Field Type
Attribute Field
Width Description/Value
Power Supply ID PS_Pnt_ID Alphanumeric 15 Unique Id
Code Code Alphanumeric 10 Code as given in Table 15
Sub-Class Sub_Class Text 50 Sub Class as given in Table 15 Ward Number Ward_No Alphanumeric 10 Ward Number
Road ID Rd_ID Alphanumeric 15 Road ID same as in Road_CLine Road Name Rd_Name Text 30
Road Name same as in Road_CLine
Locality Name Locality Text 50 Locality Name
Capacity Capacity Text 10 Capacity of Power Plant, Sub-station and Transformer, in the respective units
Street Light-ID St_Lt_ID Alphanumeric 5 Unique Id for Street Light
Type of Street Light Pole
Pole_Type Text 15 Iron/Concrete/Other
Type of Street Light
St_Lt_Ty Text 15 HPMV/Sodium/Tube Light/CFL/High Mast/Others
Source of Energy
Sou_ Energy
Text 15 Electricity/Others/Solar
Table 16: Gas Distribution Network- Geo-Spatial Data Content
S.No CODE CLASS SUB-CLASS GEOMETRY SYMBOL
1
18-05-01
Natural Gas
City Gate Metering Station Point
18-05-02 Area Regulator Station Point 18-05-03 Main Distribution Line Line 18-05-04 Branch Distribution Line Line 18-05-05 Regulator Point 18-05-06 Flow Meter Point
Formulation of GIS based Master Plan for AMRUT Cities – Design & Standards 39
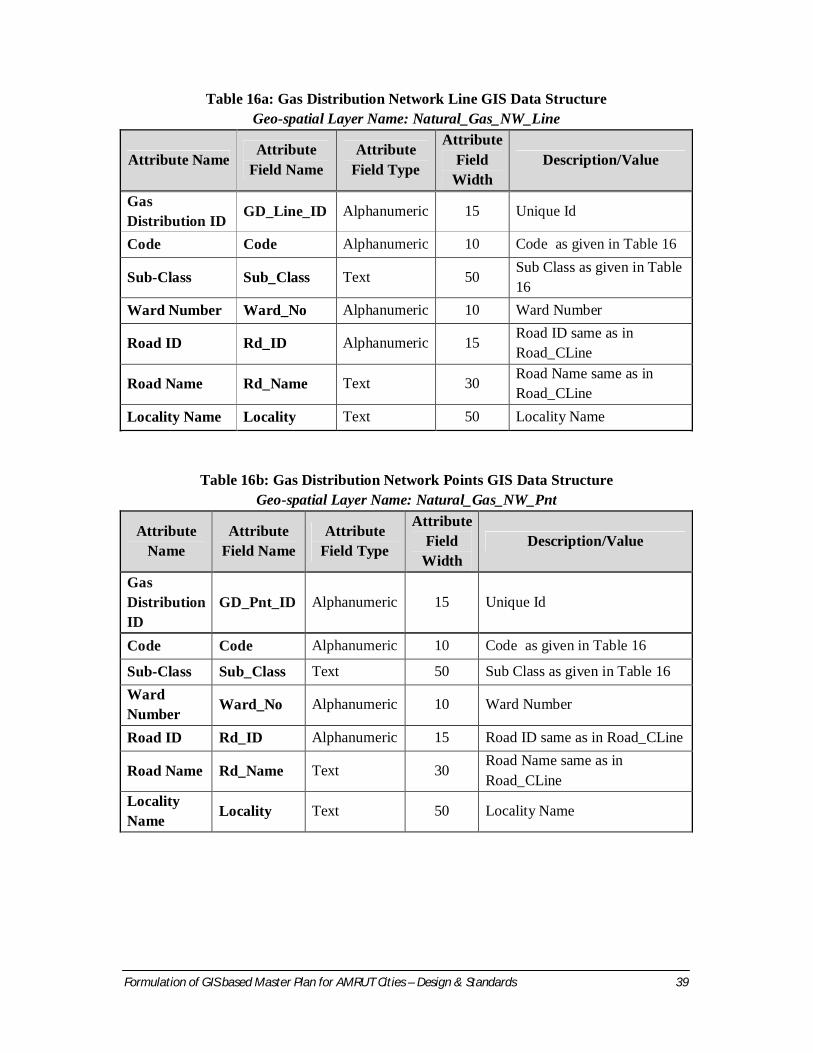
Table 16a: Gas Distribution Network Line GIS Data Structure Geo-spatial Layer Name: Natural_Gas_NW_Line
Attribute Name Attribute
Field Name Attribute
Field Type
Attribute Field
Width Description/Value
Gas Distribution ID GD_Line_ID Alphanumeric 15 Unique Id
Code Code Alphanumeric 10 Code as given in Table 16
Sub-Class Sub_Class Text 50 Sub Class as given in Table 16
Ward Number Ward_No Alphanumeric 10 Ward Number
Road ID Rd_ID Alphanumeric 15 Road ID same as in Road_CLine
Road Name Rd_Name Text 30 Road Name same as in Road_CLine
Locality Name Locality Text 50 Locality Name
Table 16b: Gas Distribution Network Points GIS Data Structure
Geo-spatial Layer Name: Natural_Gas_NW_Pnt
Attribute Name
Attribute Field Name
Attribute Field Type
Attribute Field
Width Description/Value
Gas Distribution ID
GD_Pnt_ID Alphanumeric 15 Unique Id
Code Code Alphanumeric 10 Code as given in Table 16
Sub-Class Sub_Class Text 50 Sub Class as given in Table 16 Ward Number Ward_No Alphanumeric 10 Ward Number
Road ID Rd_ID Alphanumeric 15 Road ID same as in Road_CLine
Road Name Rd_Name Text 30 Road Name same as in Road_CLine
Locality Name Locality Text 50 Locality Name

Formulation of GIS based Master Plan for AMRUT Cities – Design & Standards 40
Towns for which monoscopic data is selected, the DEM shall be generated by Total Station survey and Towns for which stereo data is selected, the DEM shall be generated from stereo data. The DEM is a DTM which represent bare earth surface.
V. HYPSOGRAPHY: Table 17: DEM Layer
S.No CLASS ACCURACY PIXEL VALUE GEOMETRY
1 Digital Terrain Model (DTM)
0.5 m Height in metres Raster
Table 18: Contour- Geo-Spatial Data Content
Table 18a: Contour Layer GIS Data Structure
Geo-spatial Layer Name: Contour_Line
Attribute Name
Attribute Field Name
Attribute Field Type
Attribute Field
Width Description/Value
Code Code Alphanumeric 10 Code as given in Table 18 Contour Value Cntr_Val Numeric 5 Height in metres
Table 19: Ground Control Points (GCPs) Layer- Geo-Spatial Data Content
S.No CODE CLASS SUB-CLASS GEOMETRY SYMBOL
1 35-01
GCP Reference station Point (X,Y,Z)
35-02 Rover Station Point (X,Y,Z)
S.No CODE CLASS CONTOUR INTERVAL GEOMETRY SYMBOL
1 34-01 Contour 1 m Line
Contour shall be generated from the DTM.
DGPS survey is used for generation of GCPs. DGPS survey data shall be processed using closed network traverse and the reference station coordinate shall be computed using ITRF reference frame.
Formulation of GIS based Master Plan for AMRUT Cities – Design & Standards 41
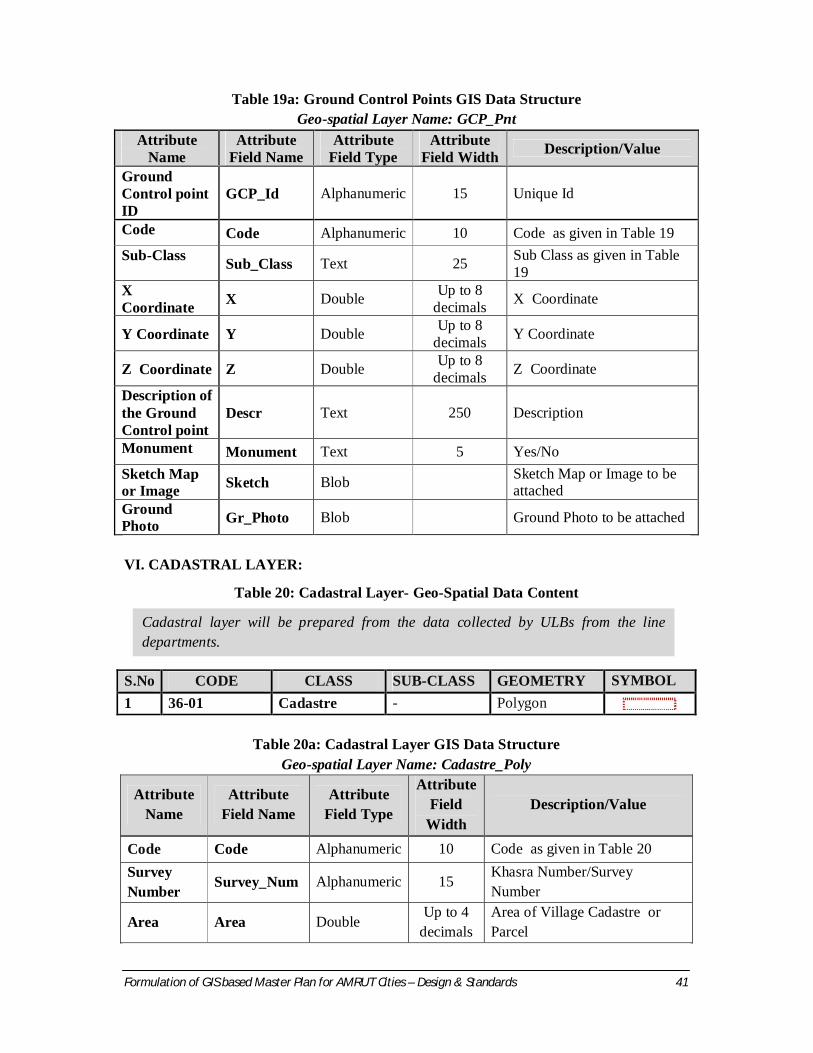
Table 19a: Ground Control Points GIS Data Structure Geo-spatial Layer Name: GCP_Pnt
Attribute Name
Attribute Field Name
Attribute Field Type
Attribute Field Width Description/Value
Ground Control point ID
GCP_Id Alphanumeric 15 Unique Id
Code Code Alphanumeric 10 Code as given in Table 19 Sub-Class Sub_Class Text 25 Sub Class as given in Table
19 X Coordinate X Double Up to 8
decimals X Coordinate
Y Coordinate Y Double Up to 8 decimals Y Coordinate
Z Coordinate Z Double Up to 8 decimals Z Coordinate
Description of the Ground Control point
Descr Text 250 Description
Monument Monument Text 5 Yes/No Sketch Map or Image Sketch Blob Sketch Map or Image to be
attached Ground Photo Gr_Photo Blob Ground Photo to be attached
VI. CADASTRAL LAYER:
Table 20: Cadastral Layer- Geo-Spatial Data Content
Table 20a: Cadastral Layer GIS Data Structure
Geo-spatial Layer Name: Cadastre_Poly
Attribute Name
Attribute Field Name
Attribute Field Type
Attribute Field
Width Description/Value
Code Code Alphanumeric 10 Code as given in Table 20 Survey Number Survey_Num Alphanumeric 15
Khasra Number/Survey Number
Area Area Double Up to 4
decimals Area of Village Cadastre or Parcel
S.No CODE CLASS SUB-CLASS GEOMETRY SYMBOL 1 36-01 Cadastre - Polygon
Cadastral layer will be prepared from the data collected by ULBs from the line departments.

Formulation of GIS based Master Plan for AMRUT Cities – Design & Standards 42
VII. BOUNDARIES:
Table 21: Administrative Boundaries – Geo-Spatial Data Content S.No CODE CLASS SUB-CLASS GEOMETRY SYMBOL
1
37-01
Administrative Boundaries
International Boundary Polygon 37-02 State Boundary Polygon 37-03 District Boundary Polygon 37-04 Tehsil / Mandal / Block
Boundary Polygon
37-05 Village Boundary Polygon 37-06 Forest Boundary Polygon 37-07 Revenue Boundary Polygon
Table 21a: Administrative Boundaries GIS Data Structure
Geo-spatial Layer Name: Admin_Bnd_Poly
Attribute Name
Attribute Field Name
Attribute Field Type
Attribute Field
Width Description/Value
Code Code Alphanumeric 10 Code as given in Table 21 Sub-Class Sub_Class Text 50 Sub Class as given in Table 21
Area in sq. km. Area Double
Up to 4 decimals
Area of corresponding Admin boundary
Name Name Text 50 Name of the Admin Boundary
Table 22: Planning Boundaries – Geo-Spatial Data Content
S.No CODE CLASS SUB-CLASS GEOMETRY SYMBOL
2
38-01
Planning Boundaries
Planning Area Boundary Polygon 38-02 Highway Corridor
Development Zone Polygon
38-03 Peripheral Control belt boundary
Polygon
38-04 Controlled Area boundary Polygon 38-05 Urbanisable Area Boundary Polygon 38-06 Industrial Zone / Area Polygon 38-07 Special Economic Zone Polygon 38-08 National Park / Sanctuary /
Conservation Area Polygon

Formulation of GIS based Master Plan for AMRUT Cities – Design & Standards 43
Table 22a: Planning Boundaries GIS Data Structure Geo-spatial Layer Name: Planning_Bnd_Poly
Attribute Name
Attribute Field Name
Attribute Field Type
Attribute Field
Width Description/Value
Code Code Alphanumeric 10 Code as given in Table 22 Sub-Class Sub_Class Text 50 Sub Class as given in Table 22
Area in sq. km. Area Double
Up to 4 decimals
Area of corresponding Planning boundary
Name Name Text 50 Name of the Planning Boundary
Table 23: Municipal Boundaries – Geo-Spatial Data Content S.No CODE CLASS SUB-CLASS GEOMETRY SYMBOL
3
39-01 Municipal Boundaries
Municipal Boundary Polygon 39-02 Zone Boundary Polygon 39-03 Ward Boundary Polygon 39-04 Taxzone Boundary Polygon
Table 23a:Municipal Boundaries GIS Data Structure
Geo-spatial Layer Name: Municipal_Bnd_Poly
Attribute Name
Attribute Field Name
Attribute Field Type
Attribute Field
Width Description/Value
Code Code Alphanumeric 10 Code as given in Table 23 Sub-Class Sub_Class Text 50 Sub Class as given in Table 23
Area in sq. km. Area Double
Up to 4 decimals
Area of corresponding Municipal boundary
Name Name Text 50 Name of the Municipal Boundary Ward Number Ward_No Numeric 5
Ward Number in case of Ward boundary
Taxzone Number
Taxzone_No Numeric 5 Tax zone Number in case of Tax zone boundary
Table 24: Other Boundaries (EB, UFS, Mining area) – Geo-Spatial Data Content
S.No CODE CLASS SUB-CLASS GEOMETRY SYMBOL
4
40-01
Other Boundaries
Urban Frame Survey Boundary Polygon
40-02 Enumeration Block Boundary Polygon
40-03 Mining Area Boundary Polygon

Formulation of GIS based Master Plan for AMRUT Cities – Design & Standards 44
Table 24a: Boundaries (EB, UFS, Mining area) GIS Data Structure Geo-spatial Layer Name: Other_Bnd_Poly
Attribute Name
Attribute Field Name
Attribute Field Type
Attribute Field
Width Description/Value
Code Code Alphanumeric 10 Code as given in Table 24
Sub-Class Sub_Class Text 50 Sub Class as given in Table 24 Area in sq. km. Area Double
Up to 4 decimals
Area of corresponding Admin boundary
Enumeration Block Number EB_No Numeric 5 Enumeration Block Number
Urban Frame Survey Number
UFS_No Numeric 5 Urban Frame Survey Number
Table 25: Hazard Prone Areas – Geo-Spatial Data Content
Table 25a: Hazard prone Areas - GIS Data Structure
Geo-spatial Layer Name: Hazard_poly
Attribute Name
Attribute Field Name
Attribute Field Type
Attribute Field
Width Description/Value
Code Code Alphanumeric 10 Code as given in Table 25
Sub-Class Sub_Class Text 50 Sub Class as given in Table 25
S.No CODE CLASS SUB-CLASS GEOMETRY SYMBOL
1 41-01
Hazard
Flood Polygon 41-02 Earthquake Polygon 41-03 Landslide Polygon
Database available with NRSC/ISRO, GSI, NDMA, Other State & Central Government Departments will be incorporated into the final database.
Formulation of GIS based Master Plan for AMRUT Cities – Design & Standards 45
3.3.6. Accuracy Standards
The geo-spatial data has to meet the feature’s Planimetric accuracy and thematic accuracy in compliance to the 1:4000 scale databases. Planimetric Accuracy Large scale Base maps and thematic databases, at 1:4000 scale, shall be incompliance to 0.25mm of the scale (as per ASPRS, NNRMS standards). Thematic Accuracy of Classification Urban Landuse classification is based on attribute data and therefore it has to be done based on the latest attribute data. 3.4.0 Quality Assurance/Quality Check Quality Assurance and Quality Check (QA/QC) shall be carried out at all levels of project execution. The main products covered under QA/QC are (i) Input high resolution satellite data (ii) Geo-referenced/Ortho-rectified satellite data (iii) GIS Feature extraction from high resolution data (iv) Final GIS database (v) Supply of the GIS database to the respective ULBs for Master Plan formulation. QA/QC is carried out at two different stages - (1) In-progress/Internal QA/QC and (2) External QA/QC for each of the product. (1) In-progress/Internal QA/QC: In-progress QA/QC shall be carried out during the
generation of the product by the product generation team. The Internal quality check is carried out for each product as per the prescribed product specifications/standards, by the identified QA/QC expert of the product generation team. In-progress/Internal QA/QC shall ensure 100% quality check and accord certification.
(2) External QA/QC: Expert in the respective product domain and outside the product generation team shall carry out the random quality check, up to maximum of 15% of product quantity and accord certification. The non-compliance products as per the specifications shall be rejected. Rejected products will be regenerated by the product generation team within the stipulated time.
Apart from the product specifications and standards the following parameters are important in assuring the final GIS database product quality.
a. Completeness: Entire study area should be covered – (i) There should not be any gaps within the study area/AOI (ii) Ensure that all features are mapped, as per the feature content, which are present in the study area/AOI.
Formulation of GIS based Master Plan for AMRUT Cities – Design & Standards 46
b. Correctness : (i) Feature extraction should ensure correct interpretation, shape of the feature as per the image and feature geometry definition (ii) The feature classification as per the ground truth and attribute data.
c. Conformity: GIS database should conform to the specifications i.e. Classification
of the features should conform to the Geo-Spatial Data content and GIS Data Structure tables given in the Section 3.3.5 (Table 6 - 25). Also, the classification of features should be as per the Attribute data, verified and certified by the ULBs.
d. Consistency: Interpretation, feature extraction/digitization, its geometry should
be consistent in all parts of the Study area.
e. GIS Compatibility: The Geo-Spatial Data should conform to the co-ordinate system and extent as given in section 3.2.1 (Table 4) and conform to the GIS data structures given in section 3.3.5 (Table 6 - 25). It should be topological clean, free from errors such as sliver polygons, duplicates, overlaps and gaps.
Attribute Data Quality Check: Attribute data is collected from field and line departments and shall be verified and certified by the respective Urban Local Bodies with the Time stamp.
Note: Each product specification and standards are given in the respective sections of the document. The project execution team may design appropriate QA/QC forms for carrying out the In-progress/Internal, External QA/QC and certification.
3.5.0 GIS database Dissemination to ULBs for Master Plan Formulation
Maintenance of GIS database at ULBs for GIS based Master Plan formulation demands the basic pre-requisites such as computer hardware infrastructure like workstations and error resistance storage like NAS, GIS software packages and IT experts at ULB level. In view of this, NRSC/ISRO and TCPO/MOUD has developed web based application “Bhuvan-NUIS for GIS based Master Plan formulation” and imparted the nationwide training & capacity building for Town Planning personnel. The main features/advantages of Bhuvan-NUIS are: Databases Ortho-rectified Satellite image Existing Urban GIS database (Layer wise) including attribute information, Admin
boundaries. Older versions of databases 1:4000 Scale GIS database for Formulation of Master Plan Meta data GIS Tools for Master Plan formulation for the ULBs GIS data can be edited/modified and updated with latest Satellite images/ground
information

Formulation of GIS based Master Plan for AMRUT Cities – Design & Standards 47
Local attribute data can be updated or new attributes can be added
GIS analysis (both Spatial and attribute) tools required for Master Plan formulation
On line approval and governance for creation, updating database within the ULB according to the approval procedure
Access control and Management
Authorised personnel at ULB level can only access the specific city data
Authorised personnel at State Town Planning Directorate level can view and read the status of cities within the particular state
Authorised personnel at TCPO/MoUD level can view and read the status of all the cities.
Advantages No need of maintaining any spatial computer systems and commercial software for
Remote Sensing data processing and GIS analysis. Complete database storage, management including backup at Bhuvan-NUIS server. No cost to ULBs.
Only desktop system with internet facility can enable GIS database creation, updating and GIS based Master Plan preparation at ULB.
Avoid the database redundancy, duplicate work in different divisions of State and Central government departments
Data can be shared with line departments; which would enable updating of database in near real time.
Enable the investment protection and facilitate cost & time effective revision of Master plans periodically.

Formulation of GIS based Master Plan for AMRUT Cities – Design & Standards 48
Figure 2: Bhuvan-NUIS based architecture for GIS database dissemination to ULBs in compliance to OGC standards
Each city GIS data would be maintained as individual database unit and respective town ULB shall own the responsibility of secured access control and updating data for Master Plan formulation.
Secured Access Control
TCPO/MoUD
Administrator
State1
………..
……..
State 29/UT 7
Administrator Administrator
Data Approver
Data Creator
ULB-1
………..
…...
……..
ULB-500

Formulation of GIS based Master Plan for AMRUT Cities – Design & Standards 49
3.6.0 Metadata Standards
Meta data describes data characteristics of content, quality, access, format, scale, when, who, where, how data generated and availability of the data. Meta data standard is required to enable the users to be aware of method, accuracy, exchange of data and limitations of the data for the intended purpose. NSDI ver 2.0 Metadata standards are proposed to be adopted. The following are main Metadata Elements as per OGC compliance standard. I. Data Identification Information
S. No.
NAME OF THE ELEMENT
FORMAT WIDTH
1 Name of the Dataset Text 250 2 Theme Text 250 3 Keywords Text 250 4 Access Constraints Text 250 5 Use Constraints Text 250 6 Purpose of creating data Text 250 7 Data Type Text 128 8 Edition Text 128 9 Status Text 250
II. Contact Information
S. No.
NAME OF THE ELEMENT
VALUE WIDTH
1 Contact Person Text 250 2 Organisation Text 250 3 Mailing Address Text 250 4 City/Locality Text 250 5 Country Text 250 6 Contact Telephone Text 250 7 Contact Fax Text 250 8 Contact Email Text 250
III. Geographic Location
S.No NAME OF THE ELEMENT
VALUE WIDTH
1 Datum Text 128

Formulation of GIS based Master Plan for AMRUT Cities – Design & Standards 50
IV. Coverage S.No NAME OF THE
ELEMENT VALUE WIDTH
1 Upper left Double 128 2 Upper right Double 128 3 Lower right Double 128 4 Lower left Double 128
V. Citation
S.No NAME OF THE ELEMENT
VALUE WIDTH
1 Data Prepared by Text 250 2 Original Source Text 250 3 Source Date Text 250 4 Lineage
State: City: Area of Interest (sq. km.): Scale:
Text Text Double Text
250
VI. Metadata Stamp
S.No NAME OF THE ELEMENT VALUE 1 Metadata Date Stamp Date (DD/MM/YYYY)
VII. Dataset Topic Category
S.No NAME OF THE ELEMENT
VALUE WIDTH
1 Data Identification topic category
Text 250
VIII. Language
S.No NAME OF THE ELEMENT
VALUE WIDTH
1 Language ISO 0639-2Bsh Text 250
IX. Abstract describing the data
S.No NAME OF THE ELEMENT
VALUE WIDTH
1 Data Identification abstract Text 250
Formulation of GIS based Master Plan for AMRUT Cities – Design & Standards 51
4.0.0 MAP SYMBOLOGY For cartographic representation/visualisation of the GIS database or to generate a hard copy/soft copy maps, appropriate symbols have to be used. In urban applications, it is also important to choose appropriate symbols as a statutory requirement in the States/UTs Town Planning Act. To facilitate uniform symbology across all the cities of different States/UTs, this section provides proposed symbols for the feature data content given in the Tables 6 to 25. However, the symbols can be customised as per the States/UTs Town Planning Act and can be adopted accordingly for representation/visualisation of maps.
5.0.0 INDICATIVE FORMAT FOR URBAN DATA COLLECTION
Master Plan formulation requires a variety of data at different stages of the planning process as a diagnostic tool for the health of the city, assessment of existing conditions in a settlement, spatial variations within the city, time series information, etc. as well as analysis and projections for future requirements in respect of various activities. While primary data collection involves time-consuming surveys, most socio-economic data may be obtained from published or un-published secondary sources. In order to streamline the process and diminish delays in the plan preparation process, a standardized data collection format has been provided as an effort to simplify and speed up the process. Most of data collection can be taken up as a separate research/survey before plan formulation to provide processed data inputs.
This format for urban data collection at town/ward level consists of 25 tables which cover key areas such as demography, physical & locational aspects, physical and social infrastructure, environment, housing and slums, governance, etc. which are vital for study of existing situation and framing of proposals for master plan formulation.
The format is an indicative format. Town planning is a State subject and a great variety of legislations exist which specify requirements for master/development plan formulation, and different State Town Planning Acts may specify different requirements of data to be collected. Further, since the cities vary in size from megalopolitan to Class VI cities, with a great variety of topographic settings, functional specializations, etc., the data requirement for plan formulation cannot be uniform. Therefore, the format may be modified suitably by the State Nodal Agencies as per their requirement depending on size and other characteristics of the urban settlement.
The indicative format for urban data collection is given at Annexure-III. Guidelines to fill the proforma are at Appendix-1.

Formulation of GIS based Master Plan for AMRUT Cities – Design & Standards 52
REFERENCES
1. NNRMS Standards: A National Standard for EO images, Thematic & Cartographic Maps, GIS Databases and Spatial Outputs, July 2005, ISRO: NNRMS: TR: 112: 2005 committee report.
2. NUIS Design & Standards, July 2006, TCPO/MoUD, New Delhi.
3. Urban And Regional Development Plans Formulation And Implementation (URDPFI)
Guidelines, January 2015, MoUD, New Delhi.
4. Andhra Pradesh Municipal Development Project (APMDP), Terms of Reference, 2013, Govt. of AP.
5. For more details on AMRUT may visit Mission website http://amrut.gov.in/
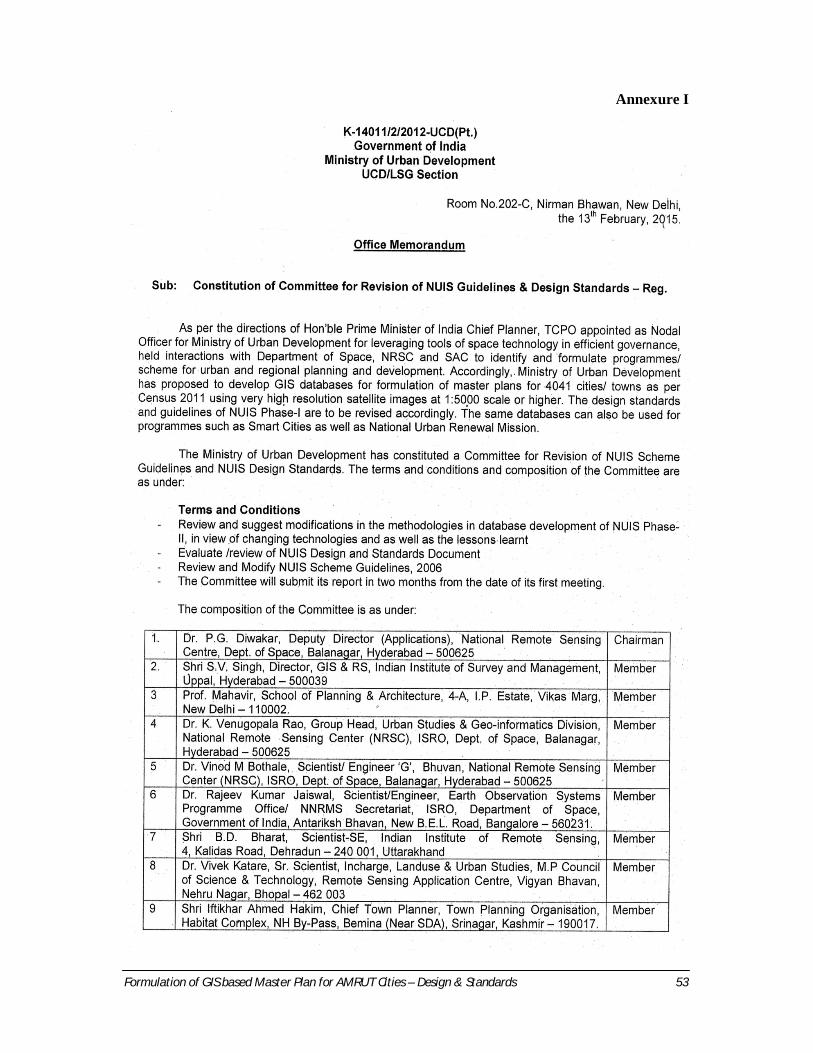
Formulation of GIS based Master Plan for AMRUT Cities – Design & Standards 53
Annexure I

Formulation of GIS based Master Plan for AMRUT Cities – Design & Standards 54

Formulation of GIS based Master Plan for AMRUT Cities – Design & Standards 55
Annexure IIA

Formulation of GIS based Master Plan for AMRUT Cities – Design & Standards 56
Annexure IIB

Formulation of GIS based Master Plan for AMRUT Cities – Design & Standards 57
Annexure III DGPS Survey for GPS points for
Geo-referencing/ortho-rectification of Satellite Image
ESTABLISHING GEODETIC REFERENCE FRAME FOR ULBS USING GNSS TECHNIQUES
GPS provides accurate and uniform reference frame for the geospatial data. DGPS techniques are required for geo-referencing of high resolution image data which essentially needs positional accuracy that matches the spatial resolution. The satellite image shall cover the entire ULB area and sufficient no of GCPs shall be planned to geo-referenced the satellite image data as well as to check the accuracy parameters of the corrected image datasets with the aid of check points. The GCP configuration and density of the GCPs are key parameters to be implemented suitably to achieve high quality data product after for geo-referencing process. Spatial distribution of the GCPs over the study area and type of features that are being selected as GCPs, play an important role in this process. The DGPS survey procedure involves:
o Establishment of Monumented Reference station
o Data collection and processing procedures
o Upkeep of the reference station for future surveys A permanent station shall be established which can be used as a reference station for the GPS surveys. A location, preferably in the central part of the ULB area, which is clear to sky without obstructions like tree canopy, high-raised building, HT electrical lines, shall be identified, either on ground or on the top of a building for constructing the reference station. A cement concrete structure of 2 ft x 2 ft x 2ft shall be made and a brass plate marked with dot and circle shall be embedded on the top of the monument. A survey-grade dual frequency GPS receiver shall be operated with Tripod in static mode at this reference monument for a period of 3 consecutive days with a minimum of 12 hrs per day with 15 sec epoch rate and the 3 days data shall be processed with Single Point Positioning or Precise Point Positioning technique to derive the geodetic coordinates of the reference station in ITRF reference frame. Establishing reference station coordinates in ITRF reference frame serves multiple benefits to the geospatial data in terms of maintaining uniform reference frame in future updates and also to use other datasets in GIS environment. ITRF reference frame can be implemented in two ways either linking the reference station to a IGS station nearby or processing using Precise Point Positioning technique using IGS data precise ephemeris and clock files. The derived Reference station geodetic coordinate shall be recorded properly and is documented in the records for future use by the ULB authorities. Each GCP shall be identified with suitable permanent feature which is seen on the ground as well as on the image data. The location where GPS is being operated shall be clear to sky without obstruction to track GPS signals. Geodetic survey grade GPS receivers shall be

Formulation of GIS based Master Plan for AMRUT Cities – Design & Standards 58
employed to collect the data. Base station and rover stations shall be operated at 15 sec epoch rate and observation period of min. 1 hr shall be adopted for base line length of 10 km. Baseline distances of 10 km. - 20 km. shall be observed with minimum of 2 hrs time period. Survey parameters like Receiver and Antenna make and model no., Antenna height, Observation time session, GDOP value, epoch time, Making of Sketches, filed photographs in all direction shall be documented properly on the field log sheet for every GCP location. Geometric Dilution of Precision (GDOP) shall be monitored and recorded, and should not exceed 2.5 nominally. Observations shall be made using dual-frequency GPS receivers and L1/L2 geodetic ground plane antennas tripods with bubble levels shall be used to minimize setup errors. Post processing of the data shall be carried out on daily basis using broadcast ephemeris and post-processing software. Validity checks shall be documented with analysis of base line vector solutions and loop closure errors. All the data produced shall pass ambiguity resolved vector solutions and loop closure exceeding one part per million relative positioning accuracy. GPS antenna shall be mounted on tripod during survey for reference station as well at GCP location during data collection. The GCP location shall be marked with paint to ensure relocation at later data and it shall be post-pointed on the image. A detailed description of the GCP location shall be written in the field log sheet with a neat sketch. Data quality parameters like cycle slips, no of satellite tracked, observed GDOP values shall be checked soon after the survey to ensure good quality of the data collected at reference station as well as at rover stations before data processing. Data processing shall be carried out with baseline processing for each session and network adjustment for all the sessions and ensure that loop closure accuracy results shall be better than 1 on 50000 which is the geodetic standard for static surveys. The final adjusted coordinates shall be in Geographic coordinate system and also in WGS-84 coordinate system and UTM projection. A project report shall be submitted with the details about GCP planning diagram, GPS equipment details and manuals, reference station details and its geodetic coordinate in ITRF latest epoch, data collection parameters, field photographs of all the locations, processing results, GCP network diagram and list of adjusted coordinates.
************
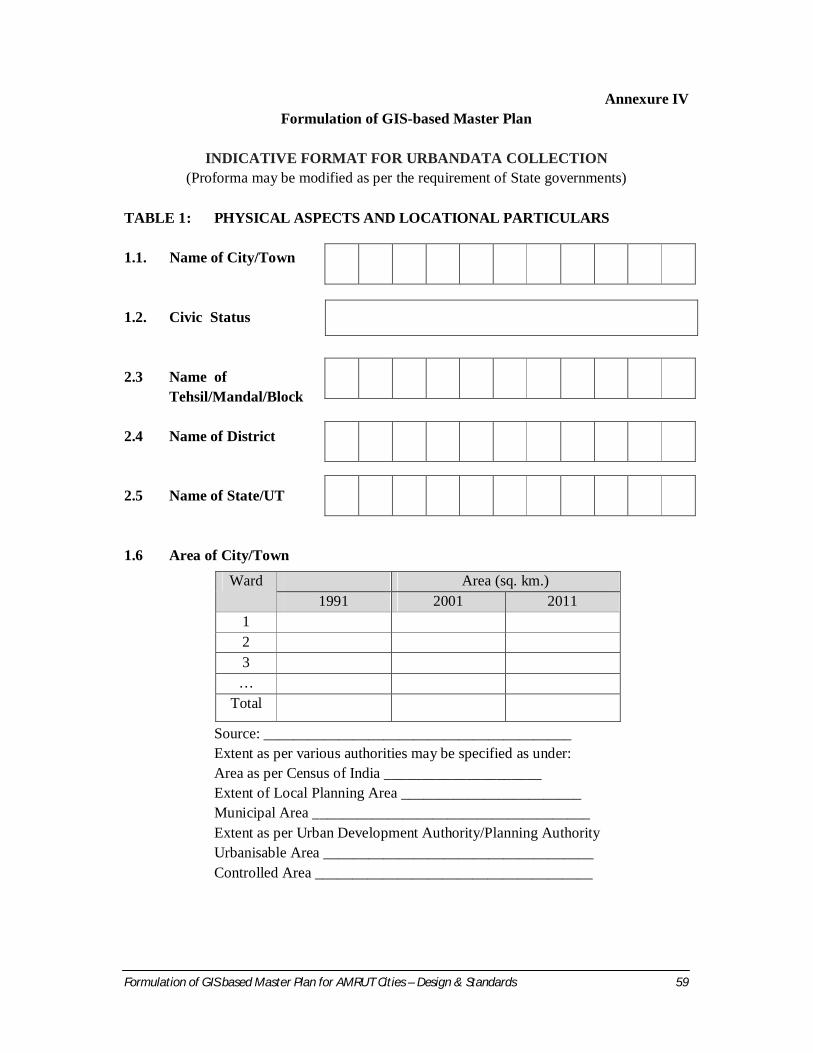
Formulation of GIS based Master Plan for AMRUT Cities – Design & Standards 59
Annexure IV Formulation of GIS-based Master Plan
INDICATIVE FORMAT FOR URBANDATA COLLECTION
(Proforma may be modified as per the requirement of State governments)
TABLE 1: PHYSICAL ASPECTS AND LOCATIONAL PARTICULARS 1.1. Name of City/Town 1.2. Civic Status
2.3 Name of Tehsil/Mandal/Block
2.4 Name of District 2.5 Name of State/UT 1.6 Area of City/Town Source: _________________________________________ Extent as per various authorities may be specified as under: Area as per Census of India _____________________ Extent of Local Planning Area ________________________ Municipal Area _____________________________________ Extent as per Urban Development Authority/Planning Authority Urbanisable Area ____________________________________ Controlled Area _____________________________________
Ward Area (sq. km.) 1991 2001 2011
1 2 3 …
Total

Formulation of GIS based Master Plan for AMRUT Cities – Design & Standards 60
1.7 Distance from Town Source: _________________________________________ 1.8 Nearness/Distance of Major River/Canal/coastline from Town
S. No.
River name & distance
(km.)
Canal name & distance
(km.)
Distance of Big Drains
Distance of major
Dams & Reservoirs
Distance from Coast lines
Indicate High/Low
Flood Levels
(meters)
Indicate high/Low tide Lines (meters)
Source: _________________________________________ TABLE 2: DEMOGRAPHIC & BASIC SOCIO-ECONOMIC DATA Note: Please attach Primary Census Abstract 2011, District Census Handbook (for whichever Census it is available), Housing Tables, Slum Tables and Economic Tables of Census of India. Also any Report by Bureau of Economics and Statistics or any other State Government Report 2.1 Population and Growth Rates
1961 1971 1981 1991 2001 2011 Total population Decadal Growth rate
Source: _____________________________________
S. No.
Description Name Distance (km.)
i State Head Quarters ii District Headquarters iii Tahsil/Taluk/Mandal Headquarters iv Nearest city (having 1 lakh & above
population)
v Nearest Railway Station/s vi Nearest Airport/Air strip vii Nearest Port viii Nearest Bus Stand (govt/private)

Formulation of GIS based Master Plan for AMRUT Cities – Design & Standards 61
2.2 Primary Census Abstract 2011
Source: _____________________________ 2.3 Housing Data(For Ward/Town) Source: ______________________________________ 2.4 Vital Statistics (Townwise) Year: __________
S. No.
Vital Statistics Male Female Total
1 Birth rate (%) 2 Death Rate (%) 3 Infant Mortality (%) 4 Life Expectancy at birth
(years)
Source: _________________________________________
2.5 Persons below Poverty Line Year _____________ Source: _______________ Note: Poverty Line defined as: ______________________________
Ward Population Child Pop (0-6)
SC Pop. ST Pop. Literates
T M F M F T M F T M F T M F T 1 2 … Total
Ward Population 2011
No. of Households
Occupied residential houses
Houseless population
1 2 …
Total
Ward No. of BPL Families Population
1 2 … Total

Formulation of GIS based Master Plan for AMRUT Cities – Design & Standards 62
TABLE 3: OCCUPATIONAL CLASSIFICATION 3.1.1 Workforce 2001 – 2011
Ward Main Workers
Marginal Workers
Other workers
Total Workers
Non-workers
M F T M F T M F T M F T M F T 1 2 … Total
Source: ______________________________________ Note: Separate Table can be made for 2001 and 2011 Workforce Participation Rate (WFPR) 2001: _______________________ Workforce Participation Rate (WFPR) 2011: _______________________

Formulation of GIS based Master Plan for AMRUT Cities – Design & Standards 63
3.2 Occupational Classification of Main Workers, 2001 A, B, C D E F G H I J&K L to Q
War
d
Cul
tivat
ors
Agr
icul
tura
l la
bour
ers
Plan
tatio
n,
Live
stoc
k,
Fore
stry
, Fis
hing
, H
untin
g &
alli
ed
activ
ities
HH
I
Non
HH
I
Elec
trici
ty, G
as
and
Wat
er S
uppl
y
Con
stru
ctio
n
Who
lesa
le a
nd
Ret
ail T
rade
Hot
els a
nd
Res
taur
ants
Tran
spor
t, St
orag
e an
d C
omm
unic
atio
ns
Fina
ncia
l In
term
edia
tion,
R
eal E
state
, R
entin
g &
B
usin
ess
M F T M F T M F T M F T M F T M F T M F T M F T M F T M F T M F T M F T 1
2
…
Total
Source: ______________________________________ Note: Separate Table can be made for 2001 and 2011 Industrial Categories as per Census 2001 INDUSTRIAL CATEGORIES: A – Agriculture, Hunting and Forestry; B – Fishing; C – Mining and Quarrying; D – Manufacturing ; E – Electricity, Gas and Water Supply; F – Construction; G – Wholesale and Retail Trade; H – Hotels and Restaurants; I – Transport, Storage and Communications; J – Financial Intermediation; K – Real Estate, Renting and Business Activities; L – Public Administration and Defence, Compulsory Social Security; M – Education; N – Health and Social Work; O – Other Community, Social and Personal Service Activities; P – Private Households with Employed Persons; Q – Extra-Territorial Organisations and Bodies. Industrial Categories as per Census 2011 If data is available in above categories, please provide. If not, then provide in 4 categories for which it is available: cultivators, agricultural workers, household industry and other services.
Formulation of G
IS based Master Plan for AM
RUT Cities – D
esign & Standards
63

Formulation of GIS based Master Plan for AMRUT Cities – Design & Standards 64
Table 4: INDUSTRIAL ASPECTS (Town level)
Source: ________________________________ Definitions: (as per ------------------------- Act) 4.1: Industries details Year: ________________ S. No. Types of Industries No. of units No. of workers Run by Manual/HP H.P
1 Large 2 Medium 3 Small 4 House hold 5 Hazardous
Source: ____________________________________ 4.2: TRADITIONAL INDUSTRIES (Year _________________) S. No.
Type of Traditional Industries
No. of units associated with each industry
No. of employees associated with each industry
Raw materials
used
Commodities manufactured
1 Handicrafts 2 Pottery … Source: __________________________________________________ 4.3. Most important commodities imported 4.4 Most important commodities manufactured 4.5 Most important commodities exported 4.6 Most Important agricultural produce Note: Please attach Lead Bank Report, DIC Report, and any other industrial report
S. No. Type of Industries
Up to 2005
2006 2007 2008 2009 2010 2011
1 Large 2 Medium 3 Small 4 Household 5 Hazardous

Formulation of GIS based Master Plan for AMRUT Cities – Design & Standards 65
TABLE 5: LAND USE (in Hectares)
Source: _________________________________________ TABLE 6: AVAILABILITY OF DRINKING WATER 6.1 Important sources of drinking water Year ____________________________ Ward No. of Households covered by
Tap water Well Hand Pump
Tube well
Tanks/ Ponds/Lake
Spring River/canal Others from
treated source
from un-
treated source
1 2 … Total Main source of drinking water ________________________ Distance from source _______________________________ Treatment Plant (nos & names) ____________________________ Source: ____________________________________________
S. No. Type of Land 1991 2001 2011 Proposed 2021 1 Residential 2 Commercial 3 Industrial 4 Recreational 5 Public and
semipublic
6 Transportation 7 Public Utilities 8 Reclaimed land 9 Vacant land 10 Agricultural land 11 Built Up area (Rural) 12 Forest 13 Wastelands 14 Wetlands 15 Water bodies 16 Others Present Land use Notified ------------------- on date ------------------------------

Formulation of GIS based Master Plan for AMRUT Cities – Design & Standards 66
6.2 Water Supply Details Year ________________
Ward
Qua
ntity
of
Wat
er
Supp
lied
(MLD
)
Tim
es/H
ours
of
supp
ly p
er
day
No.
of
Con
nect
ions
Per C
apita
C
onsu
mpt
ion
(LPC
D)
Are
a C
over
ed
(sq.
km
.)
Met
erin
g A
chie
ved
(%)
Effic
ienc
y in
co
llect
ion
of
char
ges
1 2 … Total Source: ________________________ 6.3 Supply Infrastructure:
Ward No of Over Head Tanks/Reservoirs
& Capacity
Capacity of WTPs
Treated supply as % of total water supplied
Source: _____________________________________ 6.3.1 Is there any scheme for recycling of waste water in the town? 6.3.2 Is the ground water table receding in the city?
If yes, please give present water table (Please attach any available report of CGWB/State Govt)
6.3.3 Is there any separate water supply line for non-drinking purposes such as industry,
parks etc. If yes, give area covered under the scheme.
6.3.4 Details of ongoing and committed projects under water supply with agency TABLE 7: ELECTRICITY (Town wise) Year _______________________
Source of Power
Distance (km.)
Total Electricity
Demand (MW)
Total electricity
Supply (MW)
Total Consumption
(MKWH)
Source: _________________________________________
Yes No
Yes No

Formulation of GIS based Master Plan for AMRUT Cities – Design & Standards 67
Type Residential Commercial Industrial Agricultural Others Total No. of Electric Connections
Electric Consumption (KWH)
Source: __________________________ Proposed power projects to be taken up in the city TABLE 8: POST &TELECOMMUNICATIONS (Town wise) Year__________
No. of telephone Exchanges No. of telephone connections (land line) No. of Public Telephone booths No. of Mobile Connections No of Mobile Towers No. of Post/telegraph office No of Internet Connections No. of Wi-fi hotspots
Source: __________________________ TABLE 9: EDUCATIONAL FACILITIES Year_____________________ Type of Institutions No. of Institutions No. of Class Rooms Enrolment No. of teachers Educational Institution
Govt. Private Govt. Private Govt. Private Govt. Private
Anganwadi Primary Middle Secondary
Senior Secondary School for Special Needs Colleges
General Medical Engineering Law
Others Vocational Training Adult Education program Others Source: _________________________________________

Formulation of GIS based Master Plan for AMRUT Cities – Design & Standards 68
TABLE 10: MEDICAL FACILITIES Year_____________________ 10.1 Number of hospitals, dispensaries, etc., doctors, nurses, paramedical staff and
total number of beds available therein
Source: _______________________________ Note: Please follow standard classification if specified by Govt/Local Authority and give data in that format, namely Sub-Centre, PHC, CHC, District Hospital, Super Specialty Hospital, Nursing Home, etc.
Type of Hospital
No. of Units
No. of Beds
No. of Doctors
No. of Nurses
No. of Paramedical staff
Patients Treated
Hospital Govt Pvt Govt Pvt Govt Pvt Govt Pvt Govt Pvt Govt Pvt Allopathic Ayurvedic Homeopathic Unani Family welfare & maternity center
Others Dispensary Allopathic Ayurvedic Unani Homeopathic Others Primary Health Centres
Nursing Home

Formulation of GIS based Master Plan for AMRUT Cities – Design & Standards 69
10.2 Epidemiological Details (Period from ________ to __________)
Name of Predominant Diseases
No. of persons Affected
Leprosy Phylaria Tuberculosis Cholera Dengue Chikungunya Malaria Others (Specify)
Source: _______________________________ TABLE 11: AVAILABILITY OF SANITARY FACILITIES What is the major sanitary system in the town: Sewerage/Septic Tank/LCS (please tick) Does the Town have a sewerage system: ______________________ If yes, Combined or Separate: _______________________________ Length (km.) __________________________________________________ Area Covered: ________________________sq. km. ___________________% Population covered _______________________(nos) __________________ % 11.1 Household Sanitary Facilities (Town/Ward wise) Year ____________________ Ward Households having following sanitary facility (%)
Water Closet Pit Latrine
Other Latrine
No Latrine within the premises
Piped sewer system
Septic tank
Other system
Public latrine Open
1 2
… Total Source: ___________________________(Please attach relevant Census Reports) 11.2 Network Details Year ____________________
Open surface drains
Covered drains Underground sewerage
Others
Length in km.
Area served (sq. km.)
Source: _____________________________

Formulation of GIS based Master Plan for AMRUT Cities – Design & Standards 70
11.3 Estimated quantity of sewage generated (MLD) _______________________ 11.4 Quantity treated (MLD) ___________________________ 11.5 No. of sewage treatment plants (with capacity) ___________________________ 11.6 Disposal of treated sewage (river, nala, open land) _______________ 11.7 Disposal of untreated sewage (river, nala, open land)__________________ 11.8 Disposal Industrial wastewater (treated/untreated) (river, nala, open
land)___________ 11.9 Public Toilets
Public toilets (in no.) No of Toilets Pay & Use Users per toilet daily (in No) Average User Charge Average yearly expenditure on maintenance (Rs. in Lakh)
Source: _____________________________ 11.10: Major Storm Water Drains
S. No. Name of the Drain
Wards coverage
Length (km.)
Capacity Open/Covered
1 2 …
Total Source: _____________________________ TABLE 12: SOLID WASTE MANAGEMENT (Ward/Town wise data) Is there door to door collection system: ___________________________ Is there municipal disposal of waste: _____________________________ 12.1 Solid waste generation Year _____________________________
Ward Average generation (Tons/day)
Average collection (Tons/day)
No. of Houses covered for House to House Collection
Total Area Used for Sanitary Land Fill (sq. km.)
Manpower deployed
No. of Sites used for Land Fill
1 2 … Total
Source: _____________________________

Formulation of GIS based Master Plan for AMRUT Cities – Design & Standards 71
12.2 Disposal method of solid waste (Put a tick mark on appropriate column) Year __
Sanitary land fill
Incinerated Open dump
Recycled Burned openly
Others
Source: _____________________________ 12.3 Vehicles deployed for Collection and Disposal of Solid waste, Year ___________
Type of Vehicles deployed
Trucks/Lorry Tippers Dumpers/Placers Tricycle Others
Source: _____________________________ 12.4 Employees details Year _____________________
No. of Sanitary supervisors
No. of Health Assistant
No. of Health workers
Others
Source: _____________________________ 12.5 Is there any system of segregation of solid waste?
If yes, please furnish following details (% age of quantum)
Degradable Biodegradable Hospital waste
Others
Source: _____________________________
12.6 Details of ongoing and committed projects under solid waste disposal management
Yes No

Formulation of GIS based Master Plan for AMRUT Cities – Design & Standards 72
TABLE 13: AVAILABILITY OF RECREATIONAL, CULTURAL, BANKING AND CREDIT FACILITIES 13.1 Community & other Facilities Year_____________
S. No. Facilities Numbers 1 Corporation Gardens 2 Community Hall 3 Swimming Pool 4 Corporation Playgrounds 5 Gymnasia 6 Corporation Stadium 7 Cinemas 8 Open Air Theatres 9 Zoo
10 Public libraries 11 Art Galleries 12 Museum 13 Other (specify) 14 Fire Services
No. of Fire stations No. of fire tenders Personnel
15 Cremation/Burial Ground 16 Petrol/Gas Station 17 Hotels and Eating Places 18 Others
Source: _____________________________ 13.2 Number of banks and credit societies Year______________________
No. of Banks
No of ATMs
Agricultural credit societies
Non-agricultural credit societies
Source: _____________________________
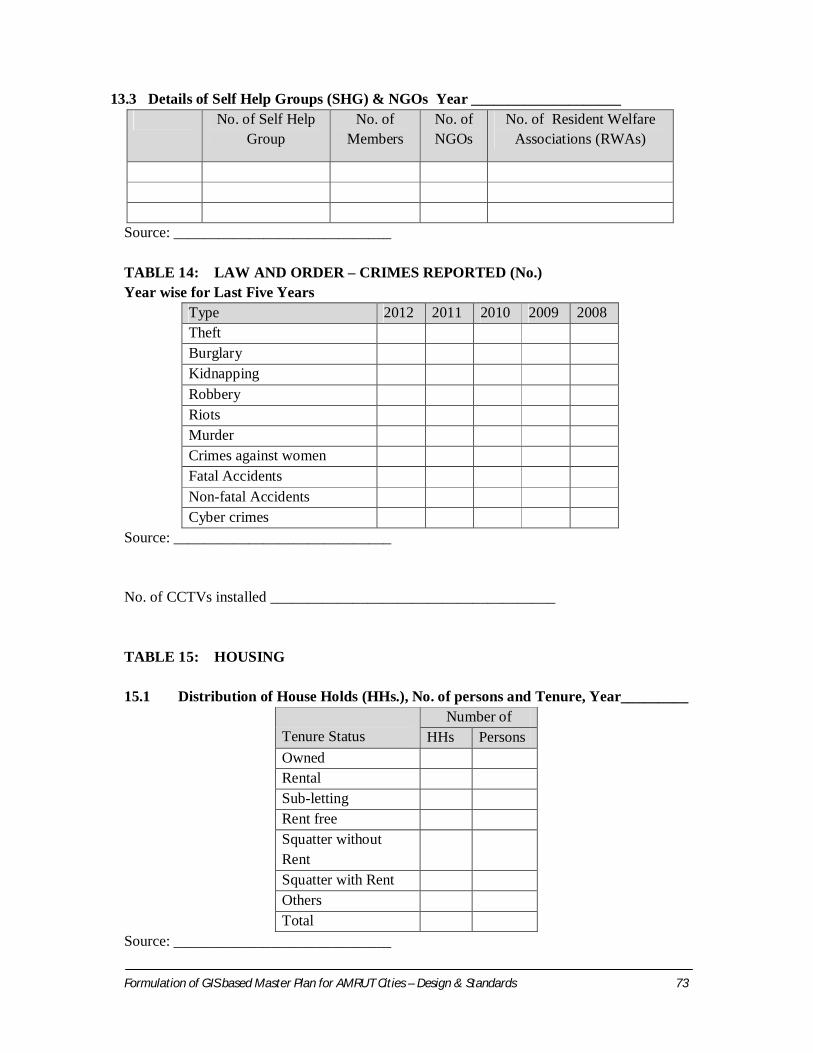
Formulation of GIS based Master Plan for AMRUT Cities – Design & Standards 73
13.3 Details of Self Help Groups (SHG) & NGOs Year ____________________ No. of Self Help
Group No. of
Members No. of NGOs
No. of Resident Welfare Associations (RWAs)
Source: _____________________________ TABLE 14: LAW AND ORDER – CRIMES REPORTED (No.) Year wise for Last Five Years
Type 2012 2011 2010 2009 2008 Theft Burglary Kidnapping Robbery Riots Murder Crimes against women Fatal Accidents Non-fatal Accidents Cyber crimes
Source: _____________________________ No. of CCTVs installed ______________________________________ TABLE 15: HOUSING 15.1 Distribution of House Holds (HHs.), No. of persons and Tenure, Year_________
Tenure Status
Number of HHs Persons
Owned Rental Sub-letting Rent free Squatter without Rent
Squatter with Rent Others Total
Source: _____________________________

Formulation of GIS based Master Plan for AMRUT Cities – Design & Standards 74
Distribution of Persons by living rooms
Number of
HHs Persons
One room Two rooms Three rooms Four rooms Five & above Total
Source: _____________________________ 15.2 Categories of Houses
Type of Houses No. of Houses Age of Building Pucca with RCC Roof and flooring
Pucca with Tiles Roof and Kaccha floor
Semi pucca Kaccha Others Total
Source: _____________________________ Note: For Housing Data, please attach relevant abstract of Housing Tables TABLE 16: LAND OWNERSHIP AND COST (Ward wise) 16.1 Land Ownership Pattern Year_______________________
Type of ownership No. of Dwelling Units (DU)
Area covered (sq. km.)
Average cost of DU per sq. mt (Rs.)
Public Private
Developers & Promoters
Authorized Individuals
Unauthorized Individuals
Others (Specify) Total
Source: _____________________________

Formulation of GIS based Master Plan for AMRUT Cities – Design & Standards 75
16.2 Land Prices (Ward wise), Year ___________________ Source: _____________________________ TABLE 17: DISASTERS Are there any structures which have been damaged by disaster during last ten years? Yes/No If yes, please give following details
(Year ________________) Type of Disaster
Year of disaster
No. of Houses
damaged
Persons affected
Property Loss (Rs.
Lakhs)
Action Taken
Earthquake Floods Cyclone Landslides Tsunami Fire Others (specify)
Source: _____________________________
Ward Land Price in Planned Area (Rs./sq. mt.)
Land Price in Unplanned
Area (Rs./sq. mt.)
Annual Rent of Dwelling Unit
(Rs.)
1 2 … Total

Formulation of GIS based Master Plan for AMRUT Cities – Design & Standards 71
TABLE 18: PUBLIC-PRIVATE-PARTNERSHIPPROJECTS IMPLEMENTED IN THE TOWN (PPP) Agency No. of
Housing units (area in sq. km.)
Water supply (MLD)
Solid Waste (area
covered in sq. km.)
Sew
erag
e (k
m.)
Roa
ds
(km
.)
Electricity Community Development City Beautification
& Park maintenance (Area in sq.
km.)
Others
Gen
erat
ion
(MW
)
Dis
tribu
tion
Mai
nten
ance
(R
s.)
Improvement of Slum (Area
in sq. km.)
Slums and Squatters
resettlement (Area in sq.
km.)
Public Private PPP Source: _____________________________ TABLE 19: SLUMS 19.1 Slum Concentration, Year ___________________
Notified Slum Non-notified Slum Squatters Total land Public Private Public Private Public Private Public Private
No. of Slum HH units
Population Area covered (sq. km.)
Source: _____________________________
Formulation of G
IS based Master Plan for AM
RUT Cities – D
esign & Standards
76

Formulation of GIS based Master Plan for AMRUT Cities – Design & Standards 77
19.2 Availability of Basic Amenities in Slums Ward wise Source: _____________________________ Note: Please attach relevant extract of Slum Tables of Census of India with year. 19.3 Houseless Population
Is there any scheme functioning for promotion of housing for houseless population? If yes, please give details as under
Name of Scheme
Dwellings constructed during last five years
Size of the dwelling unit in sq. mt.
Price of house
Mode of payment
No. of households benefited
Source: _____________________________ Note: Please attach relevant extract of Houseless Tables of Census of India with year.
Type of Amenity
No. of HHs covered
Water Supply Electricity Community toilets
Other (specify)
Yes No

Formulation of GIS based Master Plan for AMRUT Cities – Design & Standards 78
TABLE 20: TRAFFIC & TRANSPORTATION- Time Series Yearly Data 20.1 Registered Vehicles
Type of Vehicles No. of Vehicles Heavy vehicles:
Trucks Public Private Buses Public Private
Light Vehicles:
Two wheeler Car Jeep Three wheeler Omni Buses Taxies/Cabs
Non-motorized
Cycle Rickshaw Tonga Others
Source: _____________________________
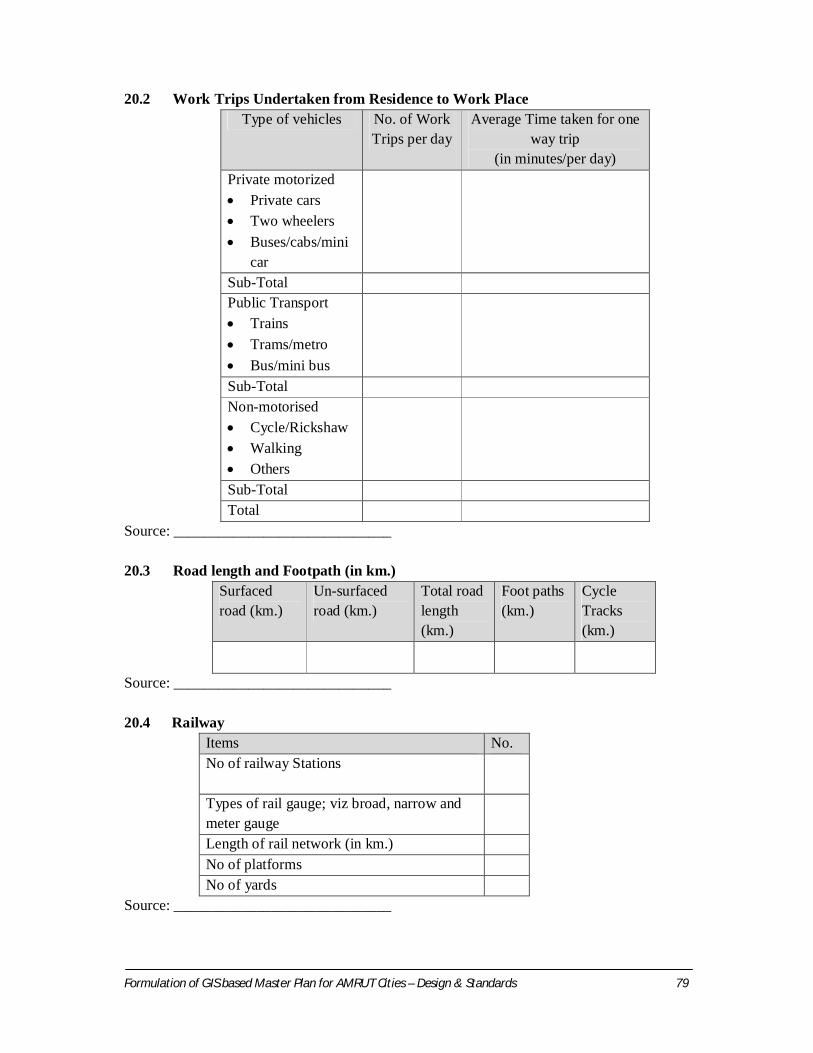
Formulation of GIS based Master Plan for AMRUT Cities – Design & Standards 79
20.2 Work Trips Undertaken from Residence to Work Place Type of vehicles No. of Work
Trips per day Average Time taken for one
way trip (in minutes/per day)
Private motorized Private cars Two wheelers Buses/cabs/mini
car
Sub-Total Public Transport Trains Trams/metro Bus/mini bus
Sub-Total Non-motorised Cycle/Rickshaw Walking Others
Sub-Total Total
Source: _____________________________ 20.3 Road length and Footpath (in km.)
Surfaced road (km.)
Un-surfaced road (km.)
Total road length (km.)
Foot paths (km.)
Cycle Tracks (km.)
Source: _____________________________
20.4 Railway Items No. No of railway Stations
Types of rail gauge; viz broad, narrow and meter gauge
Length of rail network (in km.) No of platforms No of yards
Source: _____________________________

Formulation of GIS based Master Plan for AMRUT Cities – Design & Standards 80
20.5 Inland Water ways Items No. No. of major and minor ports Length of the coastline (in km.) No. of navigable rivers and canals Total no. of boats Ships Oil tankers Vessels Total tonnage of goods carried by ships/tankers etc
No. of shipping yards
Source: _____________________________ 20.6 Air
Items No. No. of Airports (Domestic & International) Traffic volume and passenger data
Source: _____________________________ TABLE 21: ENVIRONMENT Does the town have Air Quality Monitoring Station _____________________ 21.1 Air Pollution Concentration (µg/m3) (Date ______________)
Type of pollutant
Area Residential Industrial
Commercial
Others
SO2 NO SPM CO
Source: _____________________________ 21.2 Level of Noise Pollution (Db) (Date ______________)
Residential Commercial Industrial
Silence zone
Source: _____________________________

Formulation of GIS based Master Plan for AMRUT Cities – Design & Standards 81
21.3 Water Pollution (Mg/l) (Date ______________)
BOD level Coliform level PH value
Source: _____________________________ Please attach any report of Pollution Control Board, etc. if available.
TABLE22: Animal Husbandry details Year ________________
S. No. Description Number 1 No. of Veterinary Hospital or dispensary or clinic
2 No. of Dairy outlets & collection centers ( Milk Co- Operative Societies) (MILMA)
3 No. of Dairy Farm 4 No. of Poultry Farm 5 No. of Slaughter Houses 6 No. of Hatcheries 7 No. of Broiler Farm 8 Others ( Specify)
Source: _____________________________ Table 23: TRAVEL AND TOURISM Year ________________
S. No. Description No. of Units 1 Tourism Destination Centers 2 Tourism Information Centers 3 Tourism Season 4 Average No. of Foreign Tourist 5 Average No. of Domestic Tourist 6 No. of Star hotels 7 No. of House boats 8 No. of Travel Agencies 9 No. of Tourism Promotion Councils 10 Other institutions promoting Tourism Source: _____________________________

Formulation of GIS based Master Plan for AMRUT Cities – Design & Standards 82
TABLE 24: GOVERNANCE 24.1 Civic Status of the Town: 24.2 Size & Class of the Town: 24.3 Status of Master Plan/Development Plan Whether town has a statutory Master/Development Plan? Details
1st D.P. & Date Date of latest revision D.P D.P implementation percentage
Source: _____________________________ 24.4 Name & Address (with Phone, Fax & e-mail) of Commissioner/Executive Officer of ULB:
S. No.
Name (with Designation) Address (with Phone, Fax & e-mail)
Source: _____________________________ 24.5 Name & Address (with Phone, Fax & e-mail) of Mayor/Chairperson of ULB:
S. No.
Name (with Designation) Address (with Phone, Fax & e-mail)
Source: _____________________________ 24.6 Total Staff Strength of ULB (in Nos.) :

Formulation of GIS based Master Plan for AMRUT Cities – Design & Standards 83
24.7 Division-wise breakup of Staff Strength: S. No. Name of Division Sanctioned Post No. of Posts
filled Posts Vacant
1. Administration 2. Education 3. Finance 4. Engineering 5. Agriculture/Horticulture 6. Environment/Conservation 7. Housing 8. Public Health & Utilities 9. Social Services 10. Transportation 11. Security including Fire
Services
12 Other, if any Source: _____________________________ 24.8 Is the local body elected? If yes, state the year of last election. 24.9 Functions entrusted to local bodies as per 12th Schedule appended to 74th
Constitutional Amendment Act, 1992. 24.10 List of Government Offices 25: Revenue and Receipt of Local Body: Year______________
(Rs. in Lakh) Source: _____________________________ 25.1 Proposed Large Projects
Proposed Capital Projects Source of Finance
Investment Project period
Upgradation New Infrastructure Expansion/Diversification
Source: _____________________________
Yes No
Revenue Receipt Revenue Expenditure Revenue less expenditure Resource Mobilization Debt service charges Revenue and Receipt of Local Body or Department of state Government
Detailed Revenue Receipt heads

Formulation of GIS based Master Plan for AMRUT Cities – Design & Standards 84
Appendix I Guidelines for Filling the Format
Introduction The format for collection of town level data consists of 25tables which cover key areas such as demography, physical & locational aspects, physical and social infrastructure, environment, housing and slums, governance, etc. This data is to be collected by the Nodal Agency at city/town level, in most cases the Urban Local Bodies.
Census Town As per the Census definition, Towns comprise the following: (a) All statutory towns, i.e., all places with a municipality, corporation, cantonment board, or
a notified town area committee, etc. (b) All other places which satisfy the following criteria:
a minimum population of 5,000 ; at least 75% of the male working population engaged in non-agricultural
activities; and a density of population of at least 400 persons per sq. km.
The city/town which do not have an urban local body as per (a) above, but satisfy conditions given in (b), are called by Census of India as Census Towns. Urban Agglomerations Urban Agglomerations represent a continuous urban spread constituting a town and its adjoining urban outgrowths or two or more physically contiguous towns having a common boundary together with continuous well-recognised urban outgrowths, if any, of such towns. Very often, around a core city or statutory town, there are come up fairly large well recognized railway colonies, university campuses, etc. Even though these places lie outside the precincts of a statutory city or town or within the revenue limits of the village(s) which (are) contiguous to the town, such areas may not be themselves qualify to be treated as towns. But if they form a continuous spread with the town, they are outgrowths of the town and deserve to be treated as urban. Such towns, together with their outgrowths, have been treated as one urban unit called `Urban Agglomeration’. Thus, an urban agglomeration may constitute: (a) A city or a town with continuous outgrowth, the outgrowth being outside the statutory
limits but falling within the boundaries of the adjoining village or villages; or (b) Two or more adjoining towns with their outgrowths, if any, or (c) A city and one or more adjoining towns with or without outgrowths all of which form a
continuous spread
Definitions, explanations of the parameters (including abbreviations) used in different Tables of the Proforma are as follows:

Formulation of GIS based Master Plan for AMRUT Cities – Design & Standards 85
TABLE 1: PHYSICAL ASPECTS AND LOCATIONAL PARTICULARS 1.1 Name of City/Town Names of the city/town selected under the Scheme 1.2 Civic Status
The civic administration status is a determinant for categorization of a place as urban which is to be indicated using the following abbreviations:
Civic Status Abbreviation Municipal Corporation/Corporation M.Corp. Municipal Committee/Municipal Town Committee MC Municipality M Municipal Board MB Municipal Council/Town Municipal Council/ City Municipal Council
M Cl
Cantonment Board/Cantonment CB Notified Area/Notified Area Committee/ Notified Committee/Notified Town Area Committee
NAC
Industrial Notified Area INA Town Committee/Town Area Committee TC Town Area TA Municipal Township MTS Township TS Town Board TB Panchayat Township PTS Gram Panchayat/Village Panchayat GP Mandal Panchayat MP Nagar Panchayat/Town Panchayat NP Panchayat P Sanitary Board SB Special Area SA Special Area Development Authority SADA Estate Office EO Census Town/Non-Municipal Census Town CT Non-Municipal/Non-Municipal Area NM
1.3 Name of the Tehsil/Mandal/Block 1.4 Name of the District Name of the district where the city/town is located 1.5 Name of the State State name

Formulation of GIS based Master Plan for AMRUT Cities – Design & Standards 86
1.6 Area of the City/town The area figures of statutorily notified towns are given by the civic bodies/municipal committees based on available records. Area figures are also given in the Census Town Directory/District Census Handbook is the municipal/UA area. However, the Planning Area of the city/town may be much larger. Further, for purposes of planning, urbanisable and controlled areas may have been defined by the development authorities. These are vital, because master plan is to be prepared for the urbanisable area. 1.7 Distance from Town in km.
State HQs., District HQs., Tahsil/Taluk/Mandal HQs., nearest city (having 1 lakh and above population) and nearest Railway Station along with distances These columns provide details on locational particulars of the town with reference to names of the State Hqs., District Hqs., Tahsil/Taluk/Mandal Hqs., nearest city (having 1 lakh and above population) and nearest Railway Station, indicating their distances in km., from the town. In case the nearest city or the railway station is situated in a state other than the state to which the town belongs, name of the nearest city or nearest railway station alongwith the name of the state may be indicated. In some north-eastern states, namely, Arunachal Pradesh, Assam and Nagaland where `Circle’ is equivalent to Tahsil, etc., names of Circle Hqs., have to be reported whereas in Manipur and Sikkim, Sub-Division is the equivalent to Tahsil, names of Sub-Division Hqs., have to be indicated. Apart from these in some states, Community Block/Rural Development Block is the equivalent of Tahsil, in both cases Block of Police Station may be indicated as Tahsil. 1.8 Nearness/Distance of Major River/Canal This column provides details of navigable river/canal passing nearby (within a distance of 10 km.), or through the town. TABLE 2: DEMOGRAPHIC DATA& BASIC SOCIO-ECONOMIC DATA 2.1 Population and Growth Rates Population of the City/town in time series from Census of India. This is available in Town Directory published by Census of India. Growth rates may be given or calculated.

Formulation of GIS based Master Plan for AMRUT Cities – Design & Standards 87
2.2 Primary Census Abstract 2011 This information may be derived from PCA and extract from PCA could also be provided for the city/town and if the plan formulation is to be done for planning/urbanisable area, then other administrative units covered. For example, the planning area for a particular city may cover one or more revenue villages, census towns, outgrowths, etc. 2.3 Housing Data This table covers basic housing data from Housing (H-series) Tables from Census of India. Number of households: In Census, a household is defined as a group of persons who commonly live together and take their meals from a common kitchen. Number of occupied residential houses: This Table gives the number of occupied residential houses in respect of each town. A Census house is a building or a part of building having a separate main entrance from the road or common courtyard or staircase etc., used or recognized as a separate unit. 2.4 Vital Statistics
Crude Birth Rate: The Crude Birth Rate (CBR) is defined as the number of live births in a year per 1,000 of the midyear population.
Infant Mortality Rate : Infant Mortality Rate (or IMR) is defined as the number of infant deaths in a year per 1,000 live births during the year
Life expectancy at birth = Total child births - death of Children at the time of birth.
2.6 Persons below Poverty line Households whose total income is below the poverty line as defined by the national/state/local standards. Poverty line is defined by the State Governments and records will be available with State Departments of Economics & Statistics or other sources. TABLE 3: OCCUPATIONAL CLASSIFICATION 3.1 Workforce 2001-2011 – Definitions as per Census of India Workers and Non-workers A ‘worker’ is a person who mainly participates in any economically productive activity either physically or mentally. Work not only involves actual work but effective supervision and direction of work as well. Total workers Total workers = Main workers + Marginal workers

Formulation of GIS based Master Plan for AMRUT Cities – Design & Standards 88
Main workers Main workers were those who had worked for the major part of the year preceding the date of enumeration i.e., those who were engaged in any economically productive activity for 183 days or six months or more during the year.
Marginal workers Those who worked any time in the year preceding the date of enumeration but did not work for a major part of the year i.e., those who worked for less than 183 days or six months were classified as Marginal workers.
Non-workers Those who had not worked any time at all during the year preceding the date of enumeration are non-workers. Non-workers include (i) those engaged in household duties at home, (ii) students, (iii) dependents, (iv) retired persons (v) beggars, (vi) inmates of institutions and (vii) other non-workers. 3.2 Occupational Classification of Main Workers
Main workers classified into 9 major categories are given in Census of India B-series tables. This is called the Functional Classification and helps in understanding the functional classification of the city/town. This data may be provided for the Census year for which it is available. TABLE 4: INDUSTRIAL ASPECTS Number of units of different type of industrial units (Large, Medium, Small House Hold, Hazardous etc) of the town/ward for the last five years to be furnished. 4.1 Industries – provide latest details for the year available. 4.2 Traditional Industries: details may be provided for the types of traditional industries
found in the city/town. Some towns specialize in certain traditional industry, often at household level, for which special provisions are to be made in Master Plan.
4.3 Most important commodities imported The names of the most important commodities decided in terms of estimated volume of commodities imported are to be indicated. 4.4 Most important commodities manufactured The names of the most important commodities manufactured are to be indicated. This is decided in terms of the volume of total output of the commodities concerned.
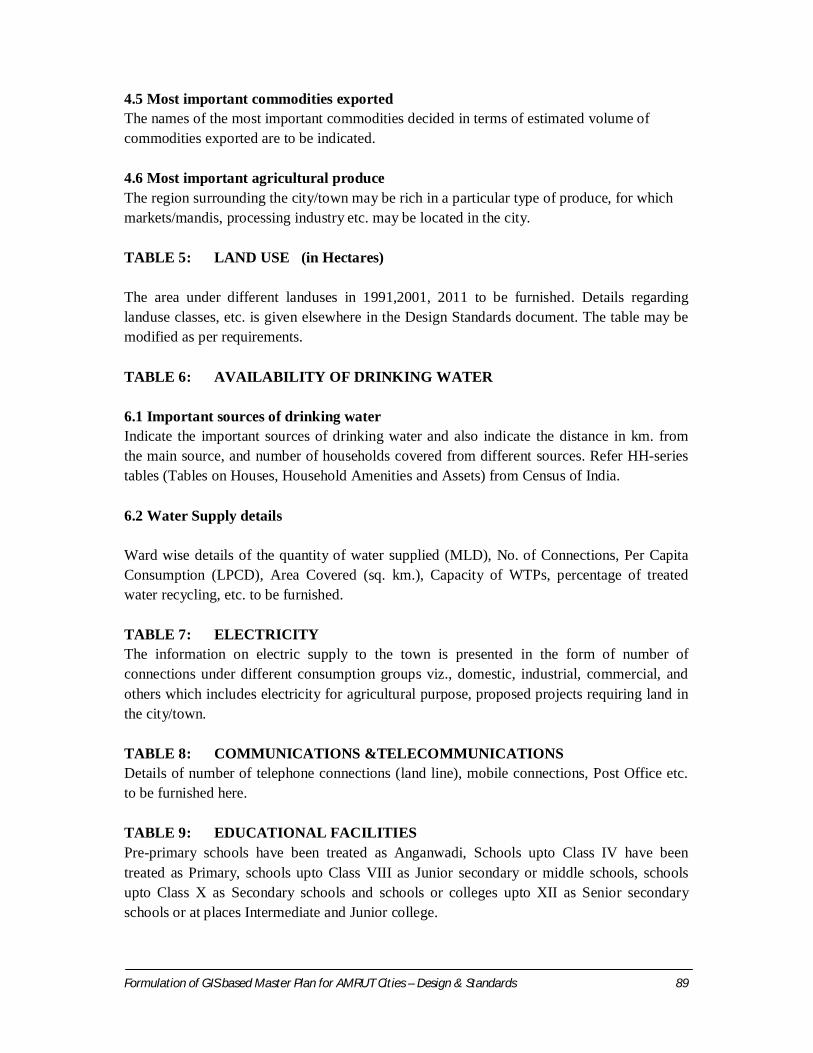
Formulation of GIS based Master Plan for AMRUT Cities – Design & Standards 89
4.5 Most important commodities exported The names of the most important commodities decided in terms of estimated volume of commodities exported are to be indicated. 4.6 Most important agricultural produce The region surrounding the city/town may be rich in a particular type of produce, for which markets/mandis, processing industry etc. may be located in the city. TABLE 5: LAND USE (in Hectares) The area under different landuses in 1991,2001, 2011 to be furnished. Details regarding landuse classes, etc. is given elsewhere in the Design Standards document. The table may be modified as per requirements. TABLE 6: AVAILABILITY OF DRINKING WATER 6.1 Important sources of drinking water Indicate the important sources of drinking water and also indicate the distance in km. from the main source, and number of households covered from different sources. Refer HH-series tables (Tables on Houses, Household Amenities and Assets) from Census of India. 6.2 Water Supply details Ward wise details of the quantity of water supplied (MLD), No. of Connections, Per Capita Consumption (LPCD), Area Covered (sq. km.), Capacity of WTPs, percentage of treated water recycling, etc. to be furnished. TABLE 7: ELECTRICITY The information on electric supply to the town is presented in the form of number of connections under different consumption groups viz., domestic, industrial, commercial, and others which includes electricity for agricultural purpose, proposed projects requiring land in the city/town. TABLE 8: COMMUNICATIONS &TELECOMMUNICATIONS Details of number of telephone connections (land line), mobile connections, Post Office etc. to be furnished here. TABLE 9: EDUCATIONAL FACILITIES Pre-primary schools have been treated as Anganwadi, Schools upto Class IV have been treated as Primary, schools upto Class VIII as Junior secondary or middle schools, schools upto Class X as Secondary schools and schools or colleges upto XII as Senior secondary schools or at places Intermediate and Junior college.

Formulation of GIS based Master Plan for AMRUT Cities – Design & Standards 90
If there are composite schools like middle schools with primary classes, or secondary schools with middle classes, these have been included in the number of primary and middle schools respectively. For example, if in a town, there are two primary schools and one middle school with primary classes, the number of primary schools in the town will be given as three and that of middle schools as one even though there are only three educational institutions. Same is the case with secondary or senior secondary schools. Number of vocational training institutions This includes vocational institutions like Applied Art/Painting College, Pharmacy College, B.Ed. College, Teachers Training Institutions, Govt./recognized polytechnics, Shorthand, Typewriting, Music/Dance Schools, etc. Number of colleges The number of different types of colleges offering various courses in the town is to be indicated under following sub-heads: (1) General (2) Medical (3) Engineering (4) Law A general college means Arts, Science and Commerce colleges. TABLE 7: NUMBER OF ADULT EDUCATION CENTERS This aspect was first introduced in the Town Directory of 1981 Census keeping in view the Minimum Needs Programme of the Planning Commission. In this column the number of adult education centres conducting regular classes are to be indicated.
TABLE 10: MEDICAL FACILITIES 10.1 Number of hospitals, dispensaries, etc., doctors, nurses, paramedical staff and
total number of beds available therein The particulars of various type of medical institutions in various system of medicines like Allopathic, Ayurvedic, Unani, Homeopaththic etc. and their numbers viz., Hospitals, Dispensaries, Health Centres, Family Planning Centres, Nursing Homes and other medical institutions and the capacity with reference to total beds, doctors, nurses, paramedical staff available is to be given. The data is to be provided for both Govt./Private institutions. 10.2 Epidemiological Details No. of persons affected by diseases like Leprosy, Phylaria, Tuberculosis, Cholera etc.

Formulation of GIS based Master Plan for AMRUT Cities – Design & Standards 91
TABLE 11: AVAILABILITY OF SANITARY FACILITIES The sanitation facilities in a city/town could be based on septic tanks or sewerage system or low cost sanitation. Studies have shown that proper sewerage systems cover less than 20% of Indian Cities. Therefore, the correct data has to be filled in here so that planning could be undertaken accordingly. Sewerage System Sewerage system implies the network of mains and branches of underground conduits for the conveyance of sewage to the point of disposal. Sewers that carry only household and industrial wastage are called separate sewers; those that carry storm water from roofs, streets and other surfaces are known as storm water drains, while those carrying both sewage and storm water are called combined sewers. However, towns which are not provided with such underground sewerage system normally have open surface drain, covered drains, etc. 11.2 Network Details The details about the sewerage/drainage network to be provided. 11.3 to 11.8 Details of sewage generation, treatment and disposal 11.9 Public Toilets 11.10 Major Storm Water Drains TABLE 12: SOLID WASTE MANAGEMENT There are three major steps involved in the management of solid waste viz. collection, transportation and disposal. Disposal of solid waste is generally done through land filling. Municipal solid waste includes commercial and residential waste generated by a community Collection means collection and removal of solid waste from different collection points Disposal means final disposal of solid waste; Recycling means the process by which waste is transformed into new products in such a manner that the original products lose their identity; Land fill: Means disposal of solid waste by spreading it in layers over a lined surface or land, compacting it to the smallest volume and covering it by impervious soil layer at the end of the day or more frequently. A landfill is operated to prevent leachate for contaminating ground water and maintaining ambient air quality; Incineration: Incineration is a process of controlled combustion for burning of waste and residue, containing material, Carbon dioxide, water vapour, ash and non-combustible end products.
Formulation of GIS based Master Plan for AMRUT Cities – Design & Standards 92
Biodegradable substance means a substance that can be degraded by micro-organisms. Hospital Waste: Waste generating from the hospitals is called hospital waste TABLE 13: AVAILABILITY OF RECREATIONAL, CULTURAL, BANKING AND
CREDIT FACILITIES 13.1 Community Facilities The particulars of recreational facilities such as stadia, museum, cinema halls and auditoria/drama/community halls and their number in the town are to be recorded. The availability of cultural facilities in the form of the number of public libraries and reading rooms, if any, available in the town is to be indicated. If fire fighting facility is not available in the town, the name of the nearest place where this facility is available is to be indicated and the distance of the same is given in column. 13.2 Number of banks and credit societies Banks Number of banks, commercial as well as co-operative functioning in the town has to be indicated. It gives the number of banks both the head as well as branch offices of banks in each town, which actually transact banking business. The head or branch offices not actually transacting any banking business are not to be taken into account. Credit Societies The information on Agricultural Credit Societies and Non-Agricultural Credit Societies are to be furnished. The agricultural credit societies include service, multipurpose, agricultural produce, marketing cooperative societies, etc. The non-agricultural credit societies include consumer cooperative societies and also credit co-operative societies of certain categories of persons like teachers, postal-workers, etc. TABLE 14: LAW AND ORDER/CRIMES TABLE 15: HOUSING TABLE 16: LAND OWNERSHIP AND COST 16.3 Mortgage to credit ratio for housing (Rs. in Lakh) Mortgage/loans Percentage of dwellings purchased during the past year that are covered by mortgage and percentage of dwellings that are covered by non-mortgage.

Formulation of GIS based Master Plan for AMRUT Cities – Design & Standards 93
TABLE 17: DISASTERS TABLE 18: PUBLIC PRIVATE PARTNERSHIP PROJECTS IMPLEMENTED IN
THE TOWN (PPP) TABLE 19: SLUMS All the inhabitants of the areas, which have been notified as slums by the state governments under any legal provisions or even recognized by them, are to be accordingly considered as slum population. Besides areas in cities/towns, which satisfy the usual criteria for declaring an area as slum have also been included. As per Census of India, the slum areas broadly consist of:-
1. All specified areas notified as 'Slum' by State/Local Government and UT Administration under any Act;
2. All areas recognized as 'Slum' by State/Local Government and UT Administration which may not have been formally notified as slum under any Act;
3. A compact area of at least 300 population or about 60-70 households of poorly built congested tenements, in unhygienic environment usually with inadequate infrastructure and lacking in proper sanitary and drinking water facilities.
Houseless Population: As per Census of India 2011, households which do not live in buildings or Census houses but live in the open or roadside, pavements, in hume-pipes, under fly-overs and staircases, or in the open in places of worship, mandaps, railway platforms, etc., are to be treated as Houseless households TABLE 20: TRAFFIC & TRANSPORTATION 20.3 Road length and Footpath (in km.) The road length to be shown in these columns pertains to Surfaced i.e., Pucca and Un-surfaced i.e., Kutcha roads and its total road length. TABLE 21: ENVIRONMENT Environmental pollutant means any solid, liquid or gaseous substance present in such concentration as may be or tend to be, injurious to environment and environmental pollution means the presence in the environment of any environmental pollutant. 21.1 Air pollution Air pollution is the excessive concentration of foreign matter in the air, which adversely affects the well being of the individual or cause damage to property. The important air contaminants are SO2, NO, Suspended Particulate Matter (SPM), CO. Air pollutants are measures in µg/m3.
Sulfur dioxide (SO2):SO2 is an irritant colourless gas, which affects the mucous membranes when inhaled. Exposure at low level can cause increased upper respiratory symptoms such as cough, sore throat and affects lung function.

Formulation of GIS based Master Plan for AMRUT Cities – Design & Standards 94
Oxides of Nitrogen (NO): Of the seven oxides of nitrogen known to exist in the ambient air, Nitrogen dioxide is the main oxides affecting human health. Oxides of nitrogen are released in all the types of combustion as they are formed by the oxidation of atmospheric nitrogen at high temperature. Exposure to excessive NO2 affects the defense mechanism of human body.
Suspended Particulate Matters (SPM): Particulate is a term given to the minute particle of solid or semi solid material dispersed in the atmosphere. SPM presence in the air cause respiratory diseases.
Carbon Monoxide (CO): Carbon monoxide is a colourless, odourless gas with relatively poor solubility in water. CO emission is due to incomplete combustion of fuel of vehicles. CO affects the central nervous system and also responsible for heart attacks and a high mortality rate.
21.2 Noise Pollution: Noise is an unwanted sound without agreeable musical quality. Noise levels are measured in decibels. One decibel is the threshold of hearing. 21.3 Water pollution: Water pollution is any physical or chemical change in water that can adversely affect organisms
Biochemical oxygen demand, or BOD The amount of organic material that can decompose in the sewage is measured by the biochemical oxygen demand. BOD is the amount of oxygen required by micro-organisms to decompose the organic substances in sewage. Therefore, the more organic material there is in the sewage, the higher the BOD. Dissolved oxygen is an important factor that determines the quality of water in lakes and rivers. The higher the concentration of dissolved oxygen, the better the water quality. BOD level measured in mg/l. Coliform level: Coliform level is an important index to measure pollution by human waste. Water pollution due to human excreta is caused mainly by the lack of proper municipal sewerage. pH Value: A number used to express degrees of acidity or alkalinity in solution.
TABLE 22: ANIMAL HUSBANDARY DETAILS Animal husbandry continues to be an important activity in most Indian cities/towns, most often found in urban villages and peri-urban areas. Details are essential for master plan formulation.

Formulation of GIS based Master Plan for AMRUT Cities – Design & Standards 95
TABLE 23: TRAVEL & TOURISM Aspects related to travel and tourism closely affect demand for facilities, demand for land and economic activity generated such as hotels, parking, eateries, water demand, electricity demand, etc. TABLE 24: GOVERNANCE Civic Status of town: see para 1.2. Status of Master/Development Plan: Many cities/towns will have at least some kind of pre-existing plan document. The details such as date of sanction of the Ist Plan, plan revision are to be furnished. Revenue and Receipt of Local Body (Rs. in Lakh) The actual revenue receipt and revenue expenditure figures of the administrative body governing the town are to be filled. Data is to be presented not only in respect of statutory bodies but also in respect of non-statutory bodies managing the civic administration of the towns if they have separate budgets and accounts of their own pertaining to the town. City Product Total product of the city as defined in national accounts procedures. It may either be taken as the total income or value-added (wages plus business surplus plus taxes plus imports), or the total final demand (consumption plus investment plus exports). City Product = (GNP) x (number of households in the city) x (average household income in
the city) (Total national household income, from national accounts)