Embed Size (px)
Citation preview

forestry in Mississippi
The impact of the forest products industry on the
post-Katrina Mississippi economy
Based on 2006 data
Forest and Wildlife Research Center Mississippi State University
An input-output analysis

Dr. James E. Henderson is an assistant extension professor, Dr. Ian A. Munn is a professor, and Dr. Donald L. Grebner is an associate professor, all in the department of forestry. Gustavo Perez-Verdin is a post-doctoral assistant in the department of forestry. All authors have research interest in natural resources economics.
The Forest and Wildlife Research Center at Mississippi State University was established by the Mississippi Legislature with the passage of the Renewable Natural Resources Research Act of 1994. The mission of the Center is to conduct research and technical assistance programs relevant to the efficient management and utilization of the forest, wildlife, and fisheries of the state and region, and the protection and enhancement of the natural environment associated with these resources. FWRC scientists conduct research in laboratories and forests administered by the University and cooperating agencies and industries throughout the country. Research results are made available to potential users through the University’s educational program and through Center publications such as this, which are directed as appropriate to forest landowners and managers, manufacturers and users of forest products, leaders of government and industry, the scientific community, and the general public. Dr. George M. Hopper is director of the Forest and Wildlife Research Center.
Authors
Research Bulletin FO374
Mississippi State University
FOREST AND WILDLIFE RESEARCH CENTER
CitationHenderson, J.E., I.A. Munn, G. Perez-Verdin, D.L. Grebner. 2008. Forestry in Mississippi: the impact of the forest products industry on the post-Katrina Mississippi economy—an input-output analysis. Forest and Wildlife Research Center, Research Bulletin FO374, Mississippi State University. 31 pp.
AcknowledgementThis research is funded by the U.S. Department of Agriculture, Cooperative State Research, Education and Extension Service, Wood Utilization Research Program.
Copies of this and other Forest and Wildlife Research Center publications are available from:Publications OfficeForest and Wildlife Research CenterBox 9680Mississippi State, MS 39762-9680
Please indicate author(s), title and publication number if known.Publications are also available at the web site at www.cfr.msstate.edu
To Order Copies
Forestry in Mississippi
Forest and Wildlife Research CenterMississippi state University
The impact of the forest products industry on the post-Katrina Mississippi economy:
An input-output analysis
Dr. James E. HendersonDr. Ian A. Munn
Dr. Gustavo Perez-VerdinDr. Donald L. Grebner

TAble Of COnTenTs
Introduction ........................................................................................................................................................1
Methods .............................................................................................................................................................2
Results ................................................................................................................................................................3
Logging .............................................................................................................................................................4
Solid Wood Products ........................................................................................................................................4
Pulp and Paper .................................................................................................................................................5
Wood Furniture ................................................................................................................................................5
Total Industry Impact ........................................................................................................................................6
Regional Differences .........................................................................................................................................6
A comparison to the economic impacts of the Pre-Katrina Forest Products industry .............................................8
Biofuels: A new market for forest products .........................................................................................................9
Literature Cited .................................................................................................................................................10
Tables ...............................................................................................................................................................12

1
InTrOduCTIOn
Forest resources are a major component of Mississippi’s economic base covering over 19.6 million acres, or 65% of the state’s total land area (Oswalt 2008). Over $1.1 billion worth of forest products are harvested from Mississippi’s forest lands annually and delivered to mills and other manufacturing plants, making timber one of Mississippi’s most valuable agricultural crops (Henderson 2008). Clearly, the forest products industry makes a major contribution to Mississippi’s economy.
The forest products industry includes four main sectors: logging, solid wood products, pulp and paper, and wood furniture manufacturing. The impact of the forest products industry on Mississippi’s economy can be measured by four key statistics: employment —the number of full- and part-time jobs in the sector; employee compensation—the wages paid by the sector; output—the sector’s total value of production; and value-added—total sector output minus the costs of purchased inputs. Value-added represents the amount of money available for disbursement, either in the form of wages, owner compensation, or taxes.
Forest products industry sectors impact Mississippi’s economy in three ways. First, these sectors impact the state economy directly through their own employment, wages, production, and value-added. Second, there is an indirect effect resulting from the industry’s purchase of goods and services from supporting industries located in the state, resulting in increased employment, wages, production, and value-added in these supporting industries to meet the demands of the forest products industry. Finally, there is an induced effect, resulting from purchases of consumer goods and services by employee households associated with both the forest products industry and its supporting industries.
The forest products industry and the timberland base it depends on for raw materials vary significantly across the state. Likewise, the composition and magnitude of the general economy also vary throughout the state. Both factors influence the
relative contribution of the forest products industry to local economies. Consequently, the impact of the forest products industry can differ substantially between locales.
This study evaluates the importance of the forest products industry to the state’s economy and the economy of five forest regions within the state established by the Mississippi Institute for Forest Inventory: north Mississippi, southeast Mississippi, southwest Mississippi, central Mississippi and the Delta.

2
MeThOds
Input-Output Modeling - Forest industry economic impacts were modeled using the Impact Analysis for Planning (IMPLAN) System, originally developed by the USDA Forest Service in cooperation with the Federal Emergency Management Agency and the University of Minnesota. The IMPLAN model was designed by the Forest Service to estimate the regional economic impacts of management plans for National Forests (Alward et al. 1985). IMPLAN is a computerized database and modeling system for constructing regional economic accounts and regional input-output tables. The IMPLAN model used a 528 sector input-output transactions table based upon the Bureau of Economic Analysis’ National I-O table (USDC 1984). Beginning with the 2001 database, IMPLAN now has 509 sectors. The Minnesota IMPLAN Group, Inc. of Stillwater, Minnesota, a commercial venture, provides current data and analytical support necessary to run the model (Alward et al. 1993).
This study combines the 509 sectors into 31 aggregated sectors—four major forest products sectors, one sector of miscellaneous forestry related activities, and 26 non-forestry related sectors (Table 1). This procedure follows Barnett and Reinschmiedt (1996) who modeled the Mississippi economy using 45 aggregated sectors—26 food and fiber sectors and 18 non-food and non-fiber sectors. The focus of this study is the forest products industry; therefore, the non-forestry related food and fiber sectors were further aggregated into three sectors: agricultural production, agricultural processing, and food processing. IMPLAN data for 2006, the most recent available, was used.
The impact of the four primary sectors of the forest products industry were examined individually, followed by the impact of the entire industry. Direct impacts of the four sectors and the entire forest products industry were obtained from IMPLAN’s report of Base Year Information. Total impacts (i.e. direct, indirect, and induced) were estimated
within the IMPLAN model by removing the total employment for the relevant sector and calculating the impact on the state economy resulting from the total loss of industry production for that sector. This is the procedure recommended by the Minnesota IMPLAN Group Inc. (2000) for estimating the economic impact of an industry. This will also provide information about which industries benefit the most from the forest products industry. The importance of Mississippi’s forest products industry to the state, local, and federal governments were examined through the tax revenue generated.
Economic impacts were investigated at the state level and for five regions within the state: north Mississippi, central Mississippi, southeast Mississippi,
Figure 1. Forest regions, as designated by the Mississippi Institute for Forest Inventory, used in the assessment of economic impacts of the forest products industry on the Mississippi economy in 2006.
North
Central
Southeast
Southwest
Delta

3
southwest Mississippi, and the Delta (Figure 1). These five regions were chosen to correspond with the regional breakdown used by the Mississippi Institute for Forest Inventory. North Mississippi consists of Alcorn, Benton, Calhoun, Chickasaw, Clay, DeSoto, Grenada, Itawamba, Lafayette, Lee, Marshall, Monroe, Panola, Pontotoc, Prentiss, Tate, Tippah, Tishomingo, Union, and Yalobusha counties. Central Mississippi consists of Attala, Carroll, Choctaw, Clarke, Jasper, Kemper, Lauderdale, Leake, Lowndes, Montgomery, Neshoba, Newton, Noxubee, Oktibbeha, Scott, Smith, Webster, and Winston counties. Southeast Mississippi consists of Covington, Forrest, George, Greene,
Hancock, Harrison, Jackson, Jefferson Davis, Jones, Lamar, Marion, Pearl River, Perry, Stone, and Wayne counties. Southwest Mississippi consists of Adams, Amite, Claiborne, Copiah, Franklin, Hinds, Jefferson, Lawrence, Lincoln, Madison, Pike, Rankin, Simpson, Walthall, and Wilkinson counties. The Delta Region consists of Bolivar, Coahoma, Holmes, Humphreys, Issaquena, Leflore, Quitman, Sharkey, Sunflower, Tallahatchie, Tunica, Warren, Washington, and Yazoo counties. The relative magnitude and importance of the forest products industry varies significantly between regions within Mississippi and this study evaluated those differences.
resulTs
Table 2 provides data on the direct impacts on Mississippi’s economy of the industry aggregations used in this study. Employment, wages and salaries, output, and value-added are reported for each industry aggregation. The forest products industry (all forest-related sectors) employed 51,281 people in 2006, roughly 3.4% of the state’s total employment of 1,493,389. The industry paid out almost $2.1 billion in wages. The industry’s average annual wage was $40,713; $8,777 more than the state average. The average Mississippi wage was calculated by dividing the wages and salaries for all sectors by the employment for all sectors given in Table 2. Value-added generated by the industry totaled over $3.5 billion.
Each sector of the forest products industry made substantial contributions to the state economy. Tables 3 to 6 provide data on the total impacts (i.e. direct, indirect and induced) of the logging, solid wood products, pulp and paper, and wood furniture sectors on the state economy, respectively. Total impacts are
reported by aggregated industrial sectors. In general, the impacts reported for each forest-related sector are direct impacts, while the impacts reported for all other sectors are indirect and induced impacts. The total impact of the sector on the state economy is summarized in the table row titled Totals.
Table 7 provides data on the total impacts of the aggregated forest-related sectors. Summing the impacts of the individual forest-related sectors overestimates the impacts of the forest products industry. Considered separately, each sector has indirect and induced impacts on the other forest-related sectors. However, when all forest-related sectors are considered as a group, these impacts are internal and thus do not result in additional indirect or induced impacts. Aggregating the forest-related sectors allows IMPLAN to automatically internalize these impacts and generate an estimate of the true impact of the forest products industry on the state economy.

4
LoggingThe logging sector includes all establishments engaged in cutting timber and producing rough, round, hewn, or
riven primary forestry and wood raw materials, including wood chips, in the field. Logging is extremely important to Mississippi’s economy for two reasons. First, the sector is essential in providing wood-based raw materials for the rest of the forest products industry. Second, the sector is important because of the economic contributions it makes through its own employment and income creation.
Timber has become one of Mississippi’s most valuable crops. In 2006, the value of Mississippi’s timber harvest at the point of first processing was $1.2 billion dollars. The direct effect of the industry was substantial. Landowners received $825 million for their standing timber (Measells 2007). Logging firms employed 6,427 people and paid $133 million in wages. Value-added exceeded $374 million (Table 2). The total effect (i.e. direct, indirect, and induced) of logging on Mississippi’s economy was even greater (Table 3). In 2006, 15,163 jobs were related to timber harvesting activities with wages totaling $390 million. Logging generated an estimated $2.28 billion addition to Mississippi’s total industry output and $767 million in value-added to Mississippi’s economy. Miscellaneous services, wholesale and retail trade, resource services, and financial and real estate are among those sectors that benefit substantially from the indirect and induced impacts created by the logging industry based on employment. However, the sector’s overall importance was much greater than stated here. Timber harvesting and transportation are essential for solid wood products, pulp and paper, and wood furniture manufacturing—three sectors that make up the remainder of the forest products industry in the state.
solid Wood productsThe solid wood products sector is a major component of Mississippi’s forest products industry and a key
component of the state economy. Included in this sector are sawmills, plywood mills, veneer mills, reconstituted wood product mills, and firms manufacturing articles made primarily of wood (Table 1). In 2006, these firms directly employed 14,679 workers and paid $595 million in wages. The average annual wage was $40,528; $8,592 higher than the state average. Industry output for the sector was $3.30 billion and the value-added exceeded $1.14 billion (Table 2).
The solid wood products sector utilized roughly 1.6 billion board feet of pine stumpage and 348 million board feet of hardwood stumpage in 2006, resulting in payments to Mississippi landowners of almost $739 million
(Measells 2007). The total impact of the solid wood products sector on Mississippi’s economy was substantial. This sector generated 41,434 jobs, either directly or in supporting industries. Employee compensation for these jobs was $1.41 billion annually. Total value-added was over $2.5 billion and industry output generated by the solid wood products sector and its supporting industries amounted to $6.28 billion (Table 4).

5
Wood FurnitureThis sector includes firms that manufacture wood
household furniture, upholstered furniture on wood frames, wood office furniture, and wood partitions and fixtures (Table 1). In 2006, these firms employed 24,605 workers and paid $959 million in wages. The average annual wage was $38,986, which is $7,050 more than the state’s average wage. Total industry output for the sector was $3.06 billion and the value-added by manufacturing totaled $1.16 billion (Table 2).
Other industrial sectors that benefited from the indirect and induced impacts of the wood furniture sector included the wholesale and retail trade, petroleum and chemicals, financial and real estate, transportation and communication services, and health services sectors. Direct, indirect, and induced employment totaled 50,172. Total wages totaled $1.78 billion. Industry output related to the activities of the wood furniture and related products sector amounted to $5.68 billion with an associated $2.49 billion in value-added (Table 6).
pulp and paperPulp mills, paper mills, paperboard mills, and manufacturers of paperboard containers and boxes, converted
paper and paperboard products and other related paper products are included in this sector (Table 1). In 2006, these firms employed 5,044 workers and paid $381 million in wages. The average annual wage was $75,500, more than 2.3 times greater than the state average. Total industry output for the sector was $2.3 billion and value-added by manufacturing exceeded $735 million (Table 2). The indirect and induced impacts of the pulp and paper sector had a major impact on the petroleum and chemicals, wholesale and retail trade, transportation and communications, and miscellaneous services sectors, increasing the total industrial output of these sectors by more than $120 million each. The number of full- and part-time jobs generated by the pulp and paper sector, either directly, indirectly or through induced impacts, totaled 21,952. Total wages exceeded $931 million. Industry output related to pulp and paper sector activities amounted to $4.18 billion with an associated $1.65 billion value-added (Table 5).

6
Regional DifferencesThe forest products industry varies substantially between regions in Mississippi. In absolute terms, the forest
products industry has the greatest regional impact in north Mississippi where it directly employs over 26,000 and generates over $1.3 billion in value-added (Table 9a). A substantial portion of this total is attributable to wood furniture manufacturing, which employs almost 21,000 and generates over $964 million in value-added. Including indirect and induced impacts, the forest product industry accounts for 49,909 jobs in the region and $2.48 billion in value-added (Table 9b). The state and local governments collected over $202 million in taxes from the forest products industry in north Mississippi (Table 8b).
The forest products industry in central Mississippi employs 9,243 and generates more than $682 million in value-added (Table 10a). Solid wood products accounts for over 40% of the employment and value-added with nearly 4,000 employed and more than $278 million in value-added. Including indirect and induced impacts, the forest product industry accounts for 21,462 jobs in the region and $1.24 billion in value-added (Table 10b). Central Mississippi generated in excess of $105 million in state and local taxes (Table 8b).
In southeast Mississippi, the industry directly employs 6,051 and generates more than $860 million in value-added (Table 11a). Solid wood products manufacturing accounts for more than half the employment with 3,137 employed. Including indirect and induced impacts, the forest product industry accounts for 14,560 jobs in the region and $1.07 billion in value-added (Table 11b). The forest products industry produced over $87 million in state and local taxes (Table 8b).
In southwest Mississippi, the industry directly employs 6,429 and generates nearly $550 million in value-added (Table 12a). Solid wood products manufacturing accounts for more than half the employment with over 3,400 employed. Direct, indirect and induced impacts of the forest product industry accounts for over 17,000 jobs in the region and $1.12 billion in value-added (Table 12b). The forest products industry produced $105.7 million in state and local taxes (Table 8b).
Total industry impactThe forest products industry is responsible for approximately 50% of the total impacts due to food and fiber-
related production and processing (Barnett and Reinschmiedt 1996). In 2006, the combined impact of all sectors of the forest products industry on Mississippi’s economy was dramatic. Forestry related employment (i.e. direct, indirect, and induced) accounted for 8.5% of all jobs in Mississippi. The average annual wage in forestry related occupations was $40,713; $8,777 more than the state average (Table 2).
In Mississippi, total industry output related to the forest products industry exceeded $17.37 billion and related value-added exceeded $7.12 billion. Related employment totaled 123,659 full- or part-time jobs with an associated annual payroll of $4.37 billion (Table 7). The industrial sectors that benefit most from the forest products industry are wholesale and retail trade, miscellaneous services, and petroleum and chemicals. Wholesale and Retail Trade output generated by the forest products industry was $1.1 billion, accounting for 12,784 additional jobs. Miscellaneous Services, which includes legal services, child day care services, food services and drinking places, and automotive repair and maintenance (see Table 1 for full listing), output was more than $629 million with 11,672 people employed.
Mississippi’s forest products industry generated over $1.66 billion in tax revenue in 2006. Federal government, non-defense taxes exceeded $1 billion (Table 8a). State and local government, non-education taxes totaled over $620 million (Table 8b).

7
Solid wood products manufacturing comprises a greater percentage of forest products industry employment in southern regions of Mississippi accounting for about 50% of employment while in north Mississippi wood furniture manufacturing contributes to over 80% of employment. The two southern regions of Mississippi employ 12,480 in the forest products industry while north Mississippi employs more than twice that number at 26,024. However, the total value-added impact for the forest products industry for north Mississippi is only 13% larger than southern Mississippi. This relative greater total value-added impact results from the fact that the economy in south Mississippi is much larger than that in the north, thereby enabling it to capture more of the indirect and induced impacts, resulting in less “leakage” from the economy.
In the Delta, the forest products industry plays only a minor role in the regional economy. Employment in the industry accounts for 3,534 jobs and generates just under $330 million in value-added (Table 13a). Even including induced and indirect impacts, the contribution of the forest products industry to the local economy is minor, accounting for 11,614 jobs and $634 million in value-added (Table 13b). More than $52 million in state and local taxes were collected in the Delta due to the forest products industry (Table 8b).
Although employment, wages and salaries, industry output, and value-added can reveal a great deal about an industry’s contribution to a regional economy, the size of the regional economy must also be considered. The relative importance of an industry is demonstrated by expressing these economic contributions as a percentage of the regional totals. The relative importance of the forest products industry differs more between regions than does the absolute importance. Direct employment ranges from 8.6% of the regional total in north Mississippi, to 4.3% in central Mississippi, 1.8% in southeast Mississippi, 1.7% in southwest Mississippi, and 1.4% in the Delta (Figure 2). Regional differences in wages and salaries, total industry output, and value-added follow a similar pattern. The forest products industry is a key player in north Mississippi. Direct, indirect and induced impacts of the industry account for nearly 17% of the regional economy compared to 10% to 4% for the other regions in the state (Figure 3). The economic contributions of the forest products
0
2
4
6
8
10
12 Delta
Southeast
Southwest
Central
North
Value AddedOutputWagesEmployment
Perc
enta
ge o
f Reg
iona
l Eco
nom
y
Economic Indicators
Figure 2. Relative Magnitude of the Direct Impacts of Forest Products Industry
compared to the Regional Economy (2006).
0
5
10
15
20
25
30Delta
Southwest
Southeast
Central
North
Value-AddedOutputWagesEmployment
Perc
enta
ge o
f Reg
iona
l Eco
nom
y
Economic Indicators
Figure 3. Relative Magnitude of the Total Impacts of Forest Products Industry
compared to the Regional Economy (2006).

8
Periodic assessments of the economic impacts generated by the forest products industry enable us to evaluate changes in the industry’s economic contributions over time (e.g., Munn 1998, Munn and Henderson 2001, Munn and Henderson 2002, and Munn and Tilley 2005). From 1993 (Munn 1998) to 2001 (Munn and Tilley 2005), the forest products industry as a whole saw a decrease in direct employment from 63,873 to 54,853 and total employment from 129,443 to 119,575. Wages and salaries, total output, and value-added increased in nominal dollars, but decreased as a percentage of the economy. In 1993, direct wages and salaries accounted for 6.3% of the total wages and salaries for the state, compared to 4.5% in 2001. Total output accounted for 8.4% for the total state output in 1993, but decreased to 6.6% in 2001. Value-added decreased as a percentage of total state value added from 6.0% in 1993 to 4.4% in 2001.
In 2005, Katrina devastated forests in the southern part of the state. Over 3.2 billion board feet of timber was damaged or destroyed (Cooke III et al., 2007). This report is the first post-Katrina assessment of the economic contributions of the forest products industry. In 2006, the forest products industry directly employed 51,281 and total employment resulting from the industry’s activity equaled 123,658. These employment numbers represent decreases of 6.5% and 4.5% respectively since 2001 (the last pre-Katrina assessment). Although forestry-related employment decreased, the wage differential between forest industry employees and the rest of the state’s employees increased from $6,254 in 2001 to $8,777 in 2006. Thus, as a percentage of the state’s total, industry wages decreased by only a minor amount, from 4.5% to 4.4%.
In nominal terms, total economic impacts (direct, indirect, and induced) of the industry increased substantially from 2001 to 2006. Industry output increased by almost $4 billion. Value-added increased by $1.8 billion. Taxes generated by the industry increased by over $300 million. Despite the decrease in direct employment, the total contributions of the industry to the state’s economy held their own. Total wages and salaries generated by the industry’s activities increased from 8.6% to 9.2% of the state’s total. Value-added, as a percentage of the state’s total, increased from 8.4% to 9.4%. In contrast, total industry output decreased from 10.7% to 10% of the state’s total output. Although not all the changes in the industry between 2001 and 2006 can be attributed to Katrina, these results depict an industry that seems to have survived the catastrophe without major long-term damage.
industry in southeast and southwest Mississippi, while substantial in absolute terms, are much less important to the regional economy due to the presence of most of the state’s large urban centers and the Gulf Coast tourism and gaming industry. In the Delta, the contributions of the forest products industry are minor in both absolute and relative terms.
a comparison to the economic impacts of the Pre-Katrina Forest Products industry

9
Rising prices and limited supplies of oil have spurred great interest in ethanol as an alternative fuel. Much of the early interest focused on corn and other agricultural crops as the raw material used to generate ethanol; however, diversion of food crops into ethanol production and clearing of marginal lands has led to soaring food prices and a host of undesirable environmental impacts. Woody materials from forests offer a promising alternative. Logging residues and small-diameter materials not suitable for other end products may be used directly as fuel in cogeneration plants, converted to wood pellets and burned as fuel, or used as feedstock in cellulosic ethanol plants. The use of low grade woody material as fuel or feedstock has the potential to substantially increase the economic impacts of the forest products industry on the State’s economy. Recent research suggests that over 3.5 million dry tons of logging residues and unharvested first thinning sized materials per year are recoverable for use as biofuels raw material (Table 14) (Perez-Verdin et al. 2008b).
Unlike the use of agricultural crops for ethanol production, these materials currently have no alternative use and thus, utilizing them as biofuels would have few, if any, adverse impacts on the supply of raw materials to the other sectors in the forest products industry. Furthermore, as these materials are available from acres already in timber production, no additional land need be converted to timber production to achieve these levels of output.
The economic impacts of potential biofuel related activities would be substantial. Harvesting and delivering the available logging residues and first thinning materials to a biofuels facility would generate direct impacts of 585 jobs, $13.2 million in wages and salaries, and $37.27 in value-added (Table 15). This is equivalent to a 9% expansion in the logging sector. Total impacts would exceed 1,700 additional jobs and almost $47 million in value-added (Table 16).
Operating a 100 megawatt power plant using woody biomass as fuel would generate 281 direct jobs and create $14.98 million in value-added (Table 15). Such a plant would utilize up to 430 thousand dry tons of woody biomass annually. Thus, there is the raw material supply to operate eight 100 megawatt power plants in Mississippi. The total economic impact (direct, indirect and induced) of eight power plants in Mississippi would exceed 5,000 jobs, $152 million in wages and salaries, and $279 million in value-added (Table 16).
Constructing and operating a 52-million gallon cellulosic ethanol plant would generate 908 jobs with $23.111 million in wages and salaries and create $38.11 million in value-added (Table 15). A plant of this capacity would utilize 700 thousand dry tons of woody biomass annually. Assuming no other demand for this raw material, Mississippi forests could support five biofuel plants of this size. The total economic impact of constructing and operating five such plants would exceed 8,700 jobs with wages and salaries in excess of $248 million, $432 million in value-added, and $1.2 billion in total industrial output.
Existing forest products sectors are providing a healthy demand for traditional commodities such as pulpwood and sawtimber. Significant demand for under utilized biomass is looming on the near horizon. Clearly, the prospects of forestry and related forest products industries in Mississippi are more promising than anytime in the recent past.
bioFuelsa new market for forest products

10
lITerATure CITed
Alward, G.S., H.C. Davis, K.A. Depotakis, and E.M. Lofting. 1985. Regional non-survey input-output analysis with IMPLAN. Paper presented at the Southern Regional Science Association Conference. Washington, D.C. May 9-10, 1985.
Alward, G.S., E. Siverts, C. Taylor and S. Winter. 1993. MicroIMPLAN User’s Guide U.S.D.A. Forest Service. Land Management Planning, Fort Collins, Colorado.
Barnett, B. and L. Reinschmiedt. 1996. Agriculture and forestry in Mississippi - An analysis of the impacts of food and fiber related sectors on the Mississippi economy. Agricultural Economics Technical Bulletin No. 95. Mississippi State University, Mississippi State, Mississippi.
Cooke III, W.H., K. Grala, D. Evans, and C. Collins. 2007. Katrina fuel conditions as a component of fire potential modeling for southern Mississippi. Journal of Forestry 105(8):389-397.
Henderson, J.E. 2008. 2007 Harvest of forest products. Forest Resources Market Notes, Cooperative Extension Service, Mississippi State University, Mississippi State, Mississippi.
Measells, M. 2007. 2006 Harvest of forest products. Forest Resources Market Notes, Cooperative Extension Service, Mississippi State University, Mississippi State, Mississippi.
Minnesota IMPLAN Group, Inc. 2000. Introduction to IMPLAN. Minnesota IMPLAN Group, Inc., Stillwater, Minnesota.
Munn, I.A. 1998. Forestry in Mississippi - The impact of the forest products industry on the Mississippi economy: An input-output Analysis. Forest and Wildlife Research Center, Research Bulletin FO 087. Mississippi State University, Mississippi State, Mississippi.
Munn, I.A. and J.E. Henderson. 2002. Forestry and forest products: The impact of the industry on the Mississippi economy – An input-output analysis. Research Bulletin FO 206, Forest and Wildlife Research Center, Mississippi State University. 14p.
Munn, I.A. and J.E. Henderson. 2003. Forestry in Mississippi: The impact of the forest products industry on the Mississippi economy – An input-output analysis. Research Bulletin FO 216, Forest and Wildlife Research Center, Mississippi State University. 22p.
Munn, I.A. and B.K. Tilley. 2005. Forestry in Mississippi – The impact of the forest products industry on the Mississippi economy: An input-output analysis. Forest and Wildlife Research Center, Bulletin FO 301, Mississippi State University. 27p.

11
Perez-Verdin, G., D.L. Grebner, I.A. Munn, C. Sun and S.C. Grado. 2008a. Economic impacts of woody biomass utilization for bioenergy development in Mississippi. Under review in Forest Products Journal. (submitted May 7, 2008) Perez-Verdin, G., D.L. Grebner, C. Sun, I.A. Munn, E.B. Schultz and T.G. Matney. 2008b. Woody biomass availability for bioethanol conversion in Mississippi. Under review in Biomass and Bioenergy. (submitted Aug 22, 2007)
Oswalt, S.N. 2008. Forest Inventory and Analysis Factsheet: Mississippi 2006. USDA Forest Service Southern Research Station.
United States Department of Commerce 1984. The detailed input-output structure of the U. S. economy, 1977. The Use and Make of Commodities by Business. Vol. 1. U.S. Department of Commerce, Bureau of Economic Analysis, Washington, D.C.

12
referenCesTAble 1. AggregATIOn sCheMe Of COMMerCIAl seCTOrs used fOr IMPlAn InPuT-OuTPuT AnAlysIs Of The fOresT PrOduCTs IndusTry IMPACTs On The MIssIssIPPI eCOnOMy, 2006.
MisCELLANEOUs FOREsT pRODUCTs Forest nurseries, forest products, and timber tractsLOGGiNG LoggingsOLiD WOOD pRODUCTs Sawmills; Wood preservation; Reconstituted wood product
manufacturing; Veneer and plywood manufacturing; Engineered wood member and truss manufacturing; Cut stock, resawing lumber, and planning; Other millwork, including flooring; Wood container and pallet manufacturing; Prefabricated wood building manufacturing; Miscellaneous wood product manufacturing; Custom architectural woodwork and millwork
WOOD FURNiTURE Wood windows and door manufacturing; Wood kitchen cabinet and countertop manufacturing; Upholstered household furniture manufacturing; Nonupholstered wood household furniture manufacturing; Wood office furniture manufacturing
pULp AND pApER Pulp mills; Paper and paperboard mills; Paperboard container manufacturing; Surface-coated paperboard manufacturing; Coated and laminated paper and packaging materials; Coated and uncoated paper bag manufacturing; Die-cut paper office supplies manufacturing; Envelope manufacturing; Sanitary paper product manufacturing; All other converted paper product manufacturing
REsOURCE sERViCEs Fishing; Hunting and trapping; Agriculture and forestry support activities
MiNiNG Oil and gas extraction; Coal mining; Iron ore mining; Copper, nickel, lead, and zinc mining; Gold, silver, and other metal ore mining; Stone mining and quarrying; Sand, gravel, clay, and refractory mining; Other nonmetallic mineral mining; Drilling oil and gas wells; Support activities for oil and gas operations; Support activities for other mining
CONsTRUCTiON New residential 1-unit structures, nonfarm; New multifamily housing structures, nonfarm; New residential additions and alterations, nonfarm; New farm housing units and additions and alterations; Manufacturing and industrial buildings; Commercial and institutional buildings; Highway, street, bridge, and tunnel construction; Water, sewer, and pipeline construction; Other new construction; Maintenance and repair of farm and nonfarm residential structures; Maintenance and repair of nonresidential buildings; Maintenance and repair of highways, streets, bridges, and tunnels; Other maintenance and repair construction
MODEL sECTORs ORiGiNAL iMpLAN sECTORs

13
AGRiCULTURAL pRODUCTiON Oilseed farming; Grain farming; Vegetable and melon farming; Tree nut farming; Fruit farming; Greenhouse and nursery production; Tobacco farming; Cotton farming; Sugarcane and sugar beet farming; All other crop farming; Cattle ranching and farming; Poultry and egg production; Animal production, except cattle and poultry and eggs
AGRiCULTURAL pROCEssiNG Dog and cat food manufacturing; Flour milling; Rice milling; Wet corn milling; Soybean processing; Other oilseed processing; Fats and oils refining and blending; Breakfast cereal manufacturing; Fluid milk manufacturing; Creamery butter manufacturing; Cheese manufacturing; Dry, condensed, and evaporated dairy products; Ice cream and frozen dessert manufacturing; Animal, except poultry, slaughtering; Meat processed from carcasses; Rendering and meat byproduct processing; Poultry processing
FOOD pROCEssiNG Malt manufacturing; Sugar manufacturing; Confectionery manufacturing from cacao beans; Confectionery manufacturing from purchased chocolate; Nonchocolate confectionery manufacturing; Frozen food manufacturing; Fruit and vegetable canning and drying; Seafood product preparation and packaging; Frozen cakes and other pastries manufacturing; Bread and bakery product, except frozen, manufacturing; Cookie and cracker manufacturing; Mixes and dough made from purchased flour; Dry pasta manufacturing; Tortilla manufacturing; Roasted nuts and peanut butter manufacturing; Other snack food manufacturing; Coffee and tea manufacturing; Flavoring syrup and concentrate manufacturing; Mayonnaise, dressing, and sauce manufacturing; Spice and extract manufacturing; All other food manufacturing; Soft drink and ice manufacturing; Breweries; Wineries; Distilleries; Tobacco stemming and redrying; Cigarette manufacturing; Other tobacco product manufacturing
FARM iNpUTs AND MACHiNERY Other animal food manufacturing; Nitrogenous fertilizer manufacturing; Phosphatic fertilizer manufacturing; Fertilizer, mixing only, manufacturing; Pesticide and other agricultural chemical manufacturing; Farm machinery and equipment manufacturing; Lawn and garden equipment manufacturing
FABRiC MiLLs AND LEATHER Fiber, yarn, and thread mills; Broadwoven fabric mills; Narrow fabric mills and schiffli embroidery; Textile and fabric finishing mills; Leather and hide tanning and finishing; Other leather product manufacturing

14
pETROLEUM AND CHEMiCALs Petroleum refineries; Asphalt paving mixture and block manufacturing; Asphalt shingle and coating materials manufacturing; Petroleum lubricating oil and grease manufacturing; All other petroleum and coal products manufacturing; Petrochemical manufacturing; Industrial gas manufacturing; Synthetic dye and pigment manufacturing; Other basic inorganic chemical manufacturing; Other basic organic chemical manufacturing; Plastics material and resin manufacturing; Synthetic rubber manufacturing; Cellulosic organic fiber manufacturing; Noncellulosic organic fiber manufacturing; Pharmaceutical and medicine manufacturing; Paint and coating manufacturing; Adhesive manufacturing; Soap and other detergent manufacturing; Polish and other sanitation good manufacturing; Surface active agent manufacturing; Toilet preparation manufacturing; Printing ink manufacturing; Explosives manufacturing; Custom compounding of purchased resins; Photographic film and chemical manufacturing; Other miscellaneous chemical product manufacturing; Plastics packaging materials, film and sheet; Plastics pipe, fittings, and profile shapes; Laminated plastics plate, sheet, and shapes; Plastics bottle manufacturing; Resilient floor covering manufacturing; Plastics plumbing fixtures and all other plastics products; Foam product manufacturing; Tire manufacturing; Rubber and plastics hose and belting manufacturing; Other rubber product manufacturing
GLAss, sTONE, AND CLAY Vitreous china plumbing fixture manufacturing; Vitreous china and earthenware articles manufacturing; Porcelain electrical supply manufacturing; Brick and structural clay tile manufacturing; Ceramic wall and floor tile manufacturing; Nonclay refractory manufacturing; Clay refractory and other structural clay products; Glass container manufacturing; Glass and glass products, except glass containers; Cement manufacturing; Ready-mix concrete manufacturing; Concrete block and brick manufacturing; Concrete pipe manufacturing; Other concrete product manufacturing; Lime manufacturing; Gypsum product manufacturing; Abrasive product manufacturing; Cut stone and stone product manufacturing; Ground or treated minerals and earths manufacturing; Mineral wool manufacturing; Miscellaneous nonmetallic mineral products
TAble 1. AggregATIOn sCheMe Of COMMerCIAl seCTOrs used fOr IMPlAn InPuT-OuTPuT AnAlysIs Of The fOresT PrOduCTs IndusTry IMPACTs On The MIssIssIPPI eCOnOMy, 2006 (continued).
15
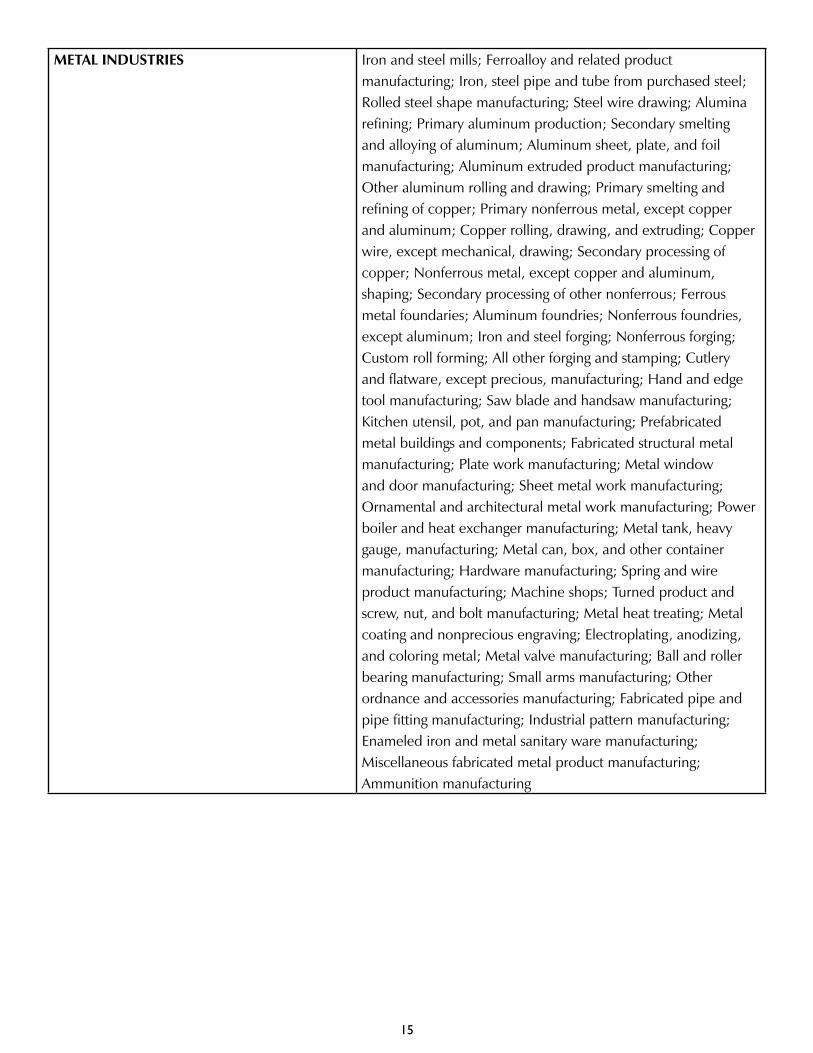
METAL iNDUsTRiEs Iron and steel mills; Ferroalloy and related product manufacturing; Iron, steel pipe and tube from purchased steel; Rolled steel shape manufacturing; Steel wire drawing; Alumina refining; Primary aluminum production; Secondary smelting and alloying of aluminum; Aluminum sheet, plate, and foil manufacturing; Aluminum extruded product manufacturing; Other aluminum rolling and drawing; Primary smelting and refining of copper; Primary nonferrous metal, except copper and aluminum; Copper rolling, drawing, and extruding; Copper wire, except mechanical, drawing; Secondary processing of copper; Nonferrous metal, except copper and aluminum, shaping; Secondary processing of other nonferrous; Ferrous metal foundaries; Aluminum foundries; Nonferrous foundries, except aluminum; Iron and steel forging; Nonferrous forging; Custom roll forming; All other forging and stamping; Cutlery and flatware, except precious, manufacturing; Hand and edge tool manufacturing; Saw blade and handsaw manufacturing; Kitchen utensil, pot, and pan manufacturing; Prefabricated metal buildings and components; Fabricated structural metal manufacturing; Plate work manufacturing; Metal window and door manufacturing; Sheet metal work manufacturing; Ornamental and architectural metal work manufacturing; Power boiler and heat exchanger manufacturing; Metal tank, heavy gauge, manufacturing; Metal can, box, and other container manufacturing; Hardware manufacturing; Spring and wire product manufacturing; Machine shops; Turned product and screw, nut, and bolt manufacturing; Metal heat treating; Metal coating and nonprecious engraving; Electroplating, anodizing, and coloring metal; Metal valve manufacturing; Ball and roller bearing manufacturing; Small arms manufacturing; Other ordnance and accessories manufacturing; Fabricated pipe and pipe fitting manufacturing; Industrial pattern manufacturing; Enameled iron and metal sanitary ware manufacturing; Miscellaneous fabricated metal product manufacturing; Ammunition manufacturing

16
MACHiNERY AND EQUipMENT Construction machinery manufacturing; Mining machinery and equipment manufacturing; Oil and gas field machinery and equipment; Sawmill and woodworking machinery; Plastics and rubber industry machinery; Paper industry machinery manufacturing; Textile machinery manufacturing; Printing machinery and equipment manufacturing; Food product machinery manufacturing; Semiconductor machinery manufacturing; All other industrial machinery manufacturing; Office machinery manufacturing; Optical instrument and lens manufacturing; Other commercial and service industry machinery manufacturing; Automatic vending, commercial laundry and drycleaning machinery; Air purification equipment manufacturing; Industrial and commercial fan and blower manufacturing; Heating equipment, except warm air furnaces; AC, refrigeration, and forced air heating; Industrial mold manufacturing; Metal cutting machine tool manufacturing; Metal forming machine tool manufacturing; Special tool, die, jig, and fixture manufacturing; Cutting tool and machine tool accessory manufacturing; Rolling mill and other metalworking machinery; Turbine and turbine generator set units manufacturing; Other engine equipment manufacturing; Speed changers and mechanical power transmission equipment; Pump and pumping equipment manufacturing; Air and gas compressor manufacturing; Measuring and dispensing pump manufacturing; Elevator and moving stairway manufacturing; Conveyor and conveying equipment manufacturing; Overhead cranes, hoists, and monorail systems; Power-driven handtool manufacturing; Welding and soldering equipment manufacturing; Packaging machinery manufacturing; Industrial process furnace and oven manufacturing; Fluid power cylinder and actuator manufacturing; Fluid power pump and motor manufacturing; Scales, balances, and miscellaneous general purpose machinery; Electric lamp bulb and part manufacturing; Lighting fixture manufacturing; Electric housewares and household fan manufacturing; Household vacuum cleaner manufacturing; Household cooking appliance manufacturing; Household refrigerator and home freezer manufacturing; Household laundry equipment manufacturing; Other major household appliance manufacturing; Electric power and specialty transformer manufacturing; Motor and generator manufacturing;
TAble 1. AggregATIOn sCheMe Of COMMerCIAl seCTOrs used fOr IMPlAn InPuT-OuTPuT AnAlysIs Of The fOresT PrOduCTs IndusTry IMPACTs On The MIssIssIPPI eCOnOMy, 2006 (continued).

17
MACHiNERY AND EQUipMENT Switchgear and switchboard apparatus manufacturing; Relay and industrial control manufacturing; Storage battery manufacturing; Primary battery manufacturing; Fiber optic cable manufacturing; Other communication and energy wire manufacturing; Wiring device manufacturing; Carbon and graphite product manufacturing; Miscellaneous electrical equipment manufacturing
TRANspORTATiON EQUipMENT Industrial truck, trailer, and stacker manufacturing; Automobile and light truck manufacturing; Heavy duty truck manufacturing; Motor vehicle body manufacturing; Truck trailer manufacturing; Motor home manufacturing; Travel trailer and camper manufacturing; Motor vehicle parts manufacturing; Aircraft manufacturing; Aircraft engine and engine parts manufacturing; Other aircraft parts and equipment; Propulsion units and parts for space vehicles and guided missiles; Railroad rolling stock manufacturing; Ship building and repairing; Boat building; Motorcycle, bicycle, and parts manufacturing; All other transportation equipment manufacturing
TECHNOLOGY iNDUsTRiEs Photographic and photocopying equipment manufacturing; Electronic computer manufacturing; Computer storage device manufacturing; Computer terminal manufacturing; Other computer peripheral equipment manufacturing; Telephone apparatus manufacturing; Broadcast and wireless communications equipment; Other communications equipment manufacturing; Audio and video equipment manufacturing; Electron tube manufacturing; Semiconductors and related device manufacturing; All other electronic component manufacturing; Electromedical apparatus manufacturing; Search, detection, and navigation instruments; Automatic environmental control manufacturing; Industrial process variable instruments; Totalizing fluid meters and counting devices; Electricity and signal testing instruments; Analytical laboratory instrument manufacturing; Irradiation apparatus manufacturing; Software reproducing; Audio and video media reproduction; Magnetic and optical recording media manufacturing; Guided missile and space vehicle manufacturing; Military armored vehicles and tank parts manufacturing; Laboratory apparatus and furniture manufacturing; Surgical and medical instrument manufacturing; Surgical appliance and supplies manufacturing; Dental equipment and supplies manufacturing; Ophthalmic goods manufacturing; Dental laboratories
TRANspORTATiON AND COMMUNiCATiON sERViCEs
Air transportation; Rail transportation; Water transportation; Truck transportation; Transit and ground passenger transportation; Pipeline transportation; Scenic and sightseeing transportation and support activities for transportation

18
MisCELLANEOUs MANUFACTURiNG Nonwoven fabric mills; Knit fabric mills; Fabric coating mills; Carpet and rug mills; Curtain and linen mills; Textile bag and canvas mills; Tire cord and tire fabric mills; Other miscellaneous textile product mills; Sheer hosiery mills; Other hosiery and sock mills; Other apparel knitting mills; Cut and sew apparel manufacturing; Accessories and other apparel manufacturing; Footwear manufacturing; Manufactured home, mobile home, manufacturing; Flexible packaging foil manufacturing; Stationery and related product manufacturing; Manifold business forms printing; Books printing; Blankbook and looseleaf binder manufacturing; Commercial printing; Tradebinding and related work; Prepress services; Watch, clock, and other measuring and controlling device manufacturing; Metal household furniture manufacturing; Institutional furniture manufacturing; Other household and institutional furniture; Office furniture, except wood, manufacturing; Showcases, partitions, shelving, and lockers; Mattress manufacturing; Blind and shade manufacturing; Jewelry and silverware manufacturing; Sporting and athletic goods manufacturing; Doll, toy, and game manufacturing; Office supplies, except paper, manufacturing; Sign manufacturing; Gasket, packing, and sealing device manufacturing; Musical instrument manufacturing; Broom, brush, and mop manufacturing; Burial casket manufacturing; Buttons, pins, and all other miscellaneous manufacturing; Couriers and messengers; Accounting and bookkeeping services; Architectural and engineering services; Specialized design services; Custom computer programming services; Computer systems design services; Other computer related services, including facilities management; Management consulting services; Environmental and other technical consulting services; Scientific research and development services; Advertising and related services; Photographic services; Veterinary services; All other miscellaneous professional and technical services; Management of companies and enterprises; Office administrative services; Facilities support services; Employment services; Business support services; Travel arrangement and reservation services; Investigation and security services; Services to buildings and dwellings; Private households
TAble 1. AggregATIOn sCheMe Of COMMerCIAl seCTOrs used fOr IMPlAn InPuT-OuTPuT AnAlysIs Of The fOresT PrOduCTs IndusTry IMPACTs On The MIssIssIPPI eCOnOMy, 2006 (continued).

19
UTiLiTY sERViCEs Power generation and supply; Natural gas distribution; Water, sewage and other systems; Waste management and remediation services
WHOLEsALE AND RETAiL TRADE Wholesale trade; Warehousing and storage; Motor vehicle and parts dealers; Furniture and home furnishings stores; Electronics and appliance stores; Building material and garden supply stores; Food and beverage stores; Health and personal care stores; Gasoline stations; Clothing and clothing accessories stores; Sporting goods, hobby, book and music stores; General merchandise stores; Miscellaneous store retailers; Nonstore retailers; Newspaper publishers; Periodical publishers; Book publishers; Database, directory, and other publishers; Software publishers; Sound recording industries
FiNANCiAL AND REAL EsTATE Nondepository credit intermediation and related activities; Securities, commodity contracts, investments; Insurance carriers; Insurance agencies, brokerages, and related; Funds, trusts, and other financial vehicles; Monetary authorities and depository credit intermediation; Real estate
MisCELLANEOUs sERViCEs Information services; Data processing services; Legal services; Other support services; Nursing and residential care facilities; Child day care services; Social assistance, except child day care services; Hotels and motels, including casino hotels; Other accommodations; Food services and drinking places; Car washes; Automotive repair and maintenance, except car washes; Electronic equipment repair and maintenance; Commercial machinery repair and maintenance; Household goods repair and maintenance; Personal care services; Death care services; Drycleaning and laundry services; Other personal services; Religious organizations; Grantmaking and giving and social advocacy organizations; Civic, social, professional and similar organizations
RECREATiON AND AMUsEMENT Motion picture and video industries; Performing arts companies; Spectator sports; Independent artists, writers, and performers; Promoters of performing arts and sports and agents for public figures; Museums, historical sites, zoos, and parks; Fitness and recreational sports centers; Bowling centers; Other amusement, gambling, and recreation industries
HEALTH sERViCEs Home health care services; Offices of physicians, dentists, and other health practioners; Other ambulatory health care services; Hospitals
EDUCATiON Elementary and secondary schools; Colleges, universities, and junior colleges; Other educational servicesState & Local Education

20
GOVERNMENT Postal service; Federal electric utilities; Other Federal Government enterprises; State and local government passenger transit; State and local government electric utilities; Other State and local government enterprises; State & Local Non-Education; Federal Military; Federal Non-Military
DOMEsTiC sERViCEs Radio and television broadcasting; Cable networks and program distributionl; Telecommunications; Automotive equipment rental and leasing; Video tape and disc rental; Machinery and equipment rental and leasing; General and consumer goods rental except video tapes and discs; Lessors of nonfinancial intangible assets
BALANCE Noncomparable imports; Scrap; Used and secondhand goods; Rest of the world adjustment to final uses; Inventory valuation adjustment; Owner-occupied dwellings
TAble 1. AggregATIOn sCheMe Of COMMerCIAl seCTOrs used fOr IMPlAn InPuT-OuTPuT AnAlysIs Of The fOresT PrOduCTs IndusTry IMPACTs On The MIssIssIPPI eCOnOMy, 2006 (continued).

21
Model sectors EmploymentWages and
salaries($MM)
Total industry Output($MM)
Value-Added($MM)
Miscellaneous Forest Products 526 19.39 364.95 98.85Logging 6,427 133.44 1,525.06 374.60Solid Wood Products 14,679 594.91 3,295.89 1,144.00Wood Furniture 24,605 959.26 3,058.93 1,157.54Pulp and Paper 5,044 380.82 2,330.17 735.59FOREsT pRODUCTs iNDUsTRY(sum of above sectors)
51,281 2,087.82 10,575.00 3,510.57
Agricultural Production 43,716 214.90 4,223.67 1,357.45Resources Services 9,420 185.86 299.76 196.64Mining 9,313 388.64 3,560.95 2,070.70Utility Services 11,333 717.04 3,288.57 2,321.32Construction 90,717 2,381.71 8,739.70 3,711.10Agricultural Processing 20,410 615.06 6,049.48 746.91Farm Inputs and Machinery 2,615 132.78 1,945.96 296.76Food Processing 5,951 187.51 1,950.25 310.71Fabric Mills and Leather 573 21.79 106.12 26.43Miscellaneous Manufacturing 161,944 3,841.99 10,620.87 5,386.95Petroleum and Chemicals 16,930 1,047.45 20,473.55 2,111.31Glass, Stone, and Clay 4,696 208.92 1,116.36 414.98Metal Industries 14,109 669.02 3,865.60 1,107.67Machinery and Equipment 20,956 1,035.51 6,337.68 1,578.89Technology Industries 3,938 177.94 3,405.34 203.88Transportation Equipment 28,345 1,680.39 10,969.99 1,966.86Wholesale and Retail Trade 226,090 6,113.16 17,332.45 11,254.51Transportation/Communication 37,655 1,382.06 5,092.02 2,239.81Government 137,387 8,011.62 9,859.19 8,881.06
Recreation and Amusement 19,978 311.84 1,153.40 573.59
Domestic Services 17,145 650.53 4,042.40 1,734.52
Miscellaneous Services 242,402 4,721.67 13,490.63 7,070.40
Financial and Real Estate 76,997 1,987.96 10,031.80 6,136.45
Education 162,363 5,383.37 6,287.11 5,899.57
Health Services 77,124 3,537.54 8,102.27 4,914.71
TOTALs 1,493,389 47,694.09 172,920.10 76,023.75
TAble 2. dIreCT IMPACTs On MIssIssIPPI eMPlOyMenT, WAges, OuTPuT And VAlue-Added Of The AggregATed IndusTrIAl seCTOrs (2006).

22
TAble 3. TOTAl IMPACTs Of The lOggIng seCTOr On MIssIssIPPI eMPlOyMenT, WAges, OuTPuT, And VAlue-Added fOr The AggregATed IndusTrIAl seCTOrs (2006)1.
Model sectors EmploymentWages and
salaries($MM)
Total industry Output($MM)
Value-Added($MM)
Miscellaneous Forest Products 5 0.18 3.34 0.91Logging 6,427 133.44 1,525.06 374.60Solid Wood Products 14 0.56 3.04 0.96Wood Furniture 19 0.67 2.35 0.94Pulp and Paper 0 0.02 0.14 0.04Agricultural Production 224 0.70 12.59 4.04Resources Services 1,942 44.87 62.41 45.53Mining 37 1.29 16.14 9.70Utility Services 57 3.94 19.94 13.25Construction 324 8.48 31.03 13.13Agricultural Processing 27 0.89 9.12 1.11Farm Inputs and Machinery 7 0.34 5.37 0.89Food Processing 10 0.36 2.74 0.64Fabric Mills and Leather 1 0.04 0.18 0.05Miscellaneous Manufacturing 621 14.50 40.53 20.39Petroleum and Chemicals 46 3.19 99.28 7.19Glass, Stone, and Clay 3 0.09 0.37 0.15Metal Industries 5 0.22 0.93 0.31Machinery and Equipment 31 1.44 6.10 1.88Technology Industries 13 0.59 10.60 0.69Transportation Equipment 21 1.23 9.60 1.50Wholesale and Retail Trade 1,250 36.11 103.41 67.84Transportation/Communication 121 4.45 16.40 7.24Government 742 43.90 54.15 48.75
Recreation and Amusement 105 1.59 5.80 2.90
Domestic Services 86 3.22 20.34 8.66
Miscellaneous Services 1,206 21.58 66.44 33.18
Financial and Real Estate 501 13.12 67.45 39.77
Education 880 29.28 34.25 32.12
Health Services 438 20.32 46.51 28.68
TOTALs 15,163 390.61 2,275.61 765.05
1Direct impacts are listed in the shaded row, indirect and induced impacts are listed in non shaded rows, and the sum of direct, indirect, and induced impacts are listed in the row labeled Totals.

23
TAble 4. TOTAl IMPACTs Of The sOlId WOOd PrOduCTs seCTOr On MIssIssIPPI eMPlOyMenT, WAges, OuTPuT And VAlue-Added by AggregATed IndusTrIAl seCTOrs (2006)1.
Model sectors EmploymentWages and
salaries($MM)
Total industry Output($MM)
Value-Added($MM)
Miscellaneous Forest Products 5 0.17 3.23 0.87Logging 3,331 69.15 790.33 194.13solid Wood products 14,679 594.91 3,295.89 1,144.00Wood Furniture 81 2.90 10.29 4.13Pulp and Paper 2 0.13 0.79 0.23Agricultural Production 293 1.09 19.23 5.74Resources Services 1,033 23.77 33.19 24.14Mining 92 3.83 37.75 21.65Utility Services 240 17.27 82.89 59.85Construction 1,179 30.88 114.01 47.83Agricultural Processing 87 2.82 29.04 3.55Farm Inputs and Machinery 13 0.64 7.79 1.41Food Processing 32 1.13 8.70 2.04Fabric Mills and Leather 4 0.14 0.63 0.17Miscellaneous Manufacturing 2,117 49.41 142.74 71.42Petroleum and Chemicals 141 8.40 192.62 17.83Glass, Stone, and Clay 17 0.61 2.93 1.14Metal Industries 30 1.33 5.03 1.86Machinery and Equipment 67 3.20 16.73 4.63Technology Industries 57 2.54 41.73 2.89Transportation Equipment 55 3.30 27.78 4.02Wholesale and Retail Trade 4,198 125.56 359.43 236.41Transportation/Communication 1,125 42.36 147.67 68.15Government 2,471 148.06 185.85 165.62
Recreation and Amusement 354 5.07 18.66 9.18
Domestic Services 234 8.65 54.94 23.47
Miscellaneous Services 3,953 71.04 214.59 107.93
Financial and Real Estate 1,396 35.93 186.12 108.45
Education 2,794 93.12 108.73 102.13
Health Services 1,354 62.85 143.91 88.69
TOTALs 41,434 1,410.26 6,283.22 2,523.56
1Direct impacts are listed in the shaded row, indirect and induced impacts are listed in non shaded rows, and the sum of direct, indirect, and induced impacts are listed in the row labeled Totals.

24
TAble 5. TOTAl IMPACTs Of The PulP And PAPer seCTOr On MIssIssIPPI eMPlOyMenT, WAges, OuTPuT And VAlue-Added by AggregATed IndusTrIAl seCTOrs (2006)1.
Model sectors EmploymentWages and
salaries($MM)
Total industry Output($MM)
Value-Added($MM)
Miscellaneous Forest Products 1 0.02 0.35 0.09Logging 608 12.63 144.37 35.46Solid Wood Products 188 7.60 45.59 13.61Wood Furniture 45 1.62 5.71 2.29pulp and paper 5,044 380.82 2,330.17 735.59Agricultural Production 153 0.61 10.74 3.14Resources Services 194 4.42 6.25 4.50Mining 75 2.88 30.76 17.92Utility Services 238 16.85 84.48 57.39Construction 802 21.01 77.43 32.37Agricultural Processing 57 1.87 19.31 2.36Farm Inputs and Machinery 9 0.46 6.21 1.08Food Processing 21 0.76 5.81 1.36Fabric Mills and Leather 3 0.11 0.53 0.14Miscellaneous Manufacturing 1,642 44.92 125.98 63.59Petroleum and Chemicals 221 13.66 212.13 26.38Glass, Stone, and Clay 6 0.21 0.92 0.36Metal Industries 25 1.14 4.32 1.61Machinery and Equipment 43 2.04 11.05 2.99Technology Industries 41 1.78 28.22 2.02
Transportation Equipment 34 2.04 17.36 2.48
Wholesale and Retail Trade 2,977 90.87 260.45 171.47Transportation/Communication 888 33.93 118.95 54.74Government 1,681 99.13 129.53 111.93
Recreation and Amusement 246 3.44 12.80 6.21
Domestic Services 172 6.31 39.50 16.83
Miscellaneous Services 2,750 50.01 152.40 76.81
Financial and Real Estate 978 24.90 129.29 75.66
Education 1,913 63.80 74.50 69.97
Health Services 897 41.67 95.42 58.82
TOTALs 21,952 931.51 4,180.53 1,649.17
1Direct impacts are listed in the shaded row, indirect and induced impacts are listed in non shaded rows, and the sum of direct, indirect, and induced impacts are listed in the row labeled Totals.

25
TAble 6. TOTAl IMPACTs Of The WOOd furnITure seCTOr On MIssIssIPPI eMPlOyMenT, WAges, OuTPuT And VAlue-Added by AggregATed IndusTrIAl seCTOrs (2006)1.
Model sectors EmploymentWages and
salaries($MM)
Total industry Output($MM)
Value-Added($MM)
Miscellaneous Forest Products 0 0.01 0.15 0.04Logging 145 3.01 34.35 8.44Solid Wood Products 616 24.07 133.95 42.81Wood Furniture 24,605 959.26 3,058.93 1,157.54Pulp and Paper 6 0.35 1.90 0.52Agricultural Production 235 0.96 16.69 4.80Resources Services 62 1.31 1.99 1.36Mining 60 2.53 24.30 13.86Utility Services 203 13.83 64.35 46.90Construction 971 25.47 93.20 39.21Agricultural Processing 94 3.06 31.83 3.85Farm Inputs and Machinery 9 0.43 5.33 0.97Food Processing 35 1.24 9.53 2.23Fabric Mills and Leather 158 6.46 33.30 7.74Miscellaneous Manufacturing 2,910 76.34 227.86 113.86Petroleum and Chemicals 982 39.19 341.24 73.85Glass, Stone, and Clay 19 0.71 3.63 1.43Metal Industries 66 2.99 12.42 4.63Machinery and Equipment 52 2.46 13.61 3.70Technology Industries 55 2.38 38.13 2.77
Transportation Equipment 47 2.82 24.39 3.45
Wholesale and Retail Trade 4,877 149.48 429.83 282.74Transportation/Communication 960 34.66 121.66 55.42Government 2,389 140.70 182.16 157.59
Recreation and Amusement 419 5.80 23.13 10.44
Domestic Services 274 10.04 62.26 26.14
Miscellaneous Services 4,260 76.22 224.10 113.40
Financial and Real Estate 1,545 38.19 202.92 118.44
Education 2,624 86.65 102.47 95.15
Health Services 1,494 69.41 158.88 97.98
Totals 50,172 1,780.03 5,678.49 2,491.26
1Direct impacts are listed in the shaded row, indirect and induced impacts are listed in non shaded rows, and the sum of direct, indirect, and induced impacts are listed in the row labeled Totals.

26
TAble 7. TOTAl IMPACTs Of The fOresT PrOduCTs IndusTry On MIssIssIPPI eMPlOyMenT, WAges, OuTPuT And VAlue-Added by AggregATed IndusTrIAl seCTOrs (2006)1.
Model sectors EmploymentWages and
salaries($MM)
Total industry Output($MM)
Value-Added($MM)
Miscellaneous Forest Products 526 19.39 364.95 98.85Logging 6,427 133.44 1,525.06 374.60Solid Wood Products 14,679 594.91 3,295.89 1,144.00Wood Furniture 24,605 959.26 3,058.93 1,157.54Pulp and Paper 5,044 380.82 2,330.17 735.59Agricultural Production 1,093 3.80 67.22 20.19Resources Services 5,137 118.44 165.06 120.23Mining 244 9.88 100.39 57.96Utility Services 712 49.92 241.28 170.63Construction 3,150 82.58 303.29 127.45Agricultural Processing 261 8.46 87.14 10.63Farm Inputs and Machinery 45 2.22 30.10 5.27Food Processing 94 3.34 25.72 6.03Fabric Mills and Leather 166 6.72 34.50 8.05Miscellaneous Manufacturing 7,023 178.61 518.97 260.04Petroleum and Chemicals 1,363 62.65 790.74 121.28Glass, Stone, and Clay 42 1.57 7.61 2.99Metal Industries 122 5.51 22.11 8.19Machinery and Equipment 175 8.36 44.46 12.22Technology Industries 160 7.02 113.90 8.05
Transportation Equipment 148 8.88 75.09 10.82
Wholesale and Retail Trade 12,784 385.27 1,105.02 726.68Transportation/Communication 2,997 111.76 391.57 179.66Government 7,026 416.03 532.10 466.34
Recreation and Amusement 1,087 15.37 58.49 27.80
Domestic Services 723 26.61 166.79 70.74
Miscellaneous Services 11,672 209.98 629.72 317.51
Financial and Real Estate 4,198 106.21 555.85 324.42
Education 7,944 264.14 309.54 289.78
Health Services 4,012 186.33 426.61 263.00
TOTALs 123,659 4,367.48 17,378.27 7,126.54
1Direct impacts are listed in the shaded rows, indirect and induced impacts are listed in non shaded rows, and the sum of direct, indirect, and induced impacts are listed in the row labeled Totals.

27
TAble 8A. federAl, nOn-defense TAx IMPACTs ($MM) generATed by The fOresT PrOduCTs IndusTry In MIssIssIPPI (2006).
Type of Tax North Central south East south West Delta stateCorporate Profits Tax 63.29 40.75 40.70 36.42 20.61 217.75Indirect Business Taxes1 10.07 5.54 4.76 7.59 5.95 39.96Personal Taxes2 97.44 40.95 34.15 39.28 15.95 254.11Social Security Taxes3 217.48 90.25 67.43 82.12 37.65 530.32TOTAL 388.29 177.49 147.04 165.40 80.16 1042.15
1Includes Custom Duty; Excise Taxes; and Federal Non Taxes.2Includes Estate and Gift Taxes; and Income Taxes.3Includes Employee Contribution; and Employer Contribution.
TAble 8b. sTATe And lOCAl gOVernMenT, nOn-eduCATIOn TAxes ($MM) generATed by The fOresT PrOduCTs IndusTry In MIssIssIPPI (2006).
Type of Tax North Central south East south West Delta stateCorporate Profits Tax 11.69 7.52 7.51 6.72 3.81 40.20Dividends 22.18 14.28 14.26 12.76 7.22 76.29Indirect Business Taxes1 114.63 59.32 46.09 63.90 31.85 359.67Personal Taxes2 46.07 19.65 16.21 18.48 7.70 120.57Social Security Taxes3 8.28 5.09 2.99 3.85 1.67 24.24TOTAL 202.85 105.87 87.06 105.71 52.24 620.98
1Includes Motor Vehicle License; Property Taxes; State and Local Non Taxes; Sales Tax; Severance Tax; and Other Taxes.2Includes Estate and Gift Taxes; Income Taxes; Motor Vehicle License; Non Taxes; Property Taxes; and Other Taxes.3Includes Employee Contribution; and Employer Contribution.
TAble 9A. dIreCT IMPACTs Of The fOresT PrOduCTs IndusTry On eMPlOyMenT, WAges, OuTPuT And VAlue-Added In nOrTh MIssIssIPPI (2006).
Model sectors EmploymentWages and
salaries ($MM)Total industry Output ($MM)
Value-Added ($MM)
Miscellaneous Forest Products 11 0.53 8.49 2.56Logging 813 17.90 189.61 44.53Solid Wood Products 3,108 125.38 648.05 234.39Wood Furniture 20,995 827.86 2,591.88 964.76Pulp and Paper 1,095 66.98 371.15 96.97Forest Products Industry(sum of above sectors)
26,024 1,038.65 3,809.181,343.20
ALL sECTORs 301,091 9,437.14 33,246.96 15,620.60

28
TAble 10b. TOTAl IMPACTs Of The fOresT PrOduCTs IndusTry On eMPlOyMenT, WAges, OuTPuT And VAlue-Added In CenTrAl MIssIssIPPI (2006).
Model sectors EmploymentWages and
salaries ($MM)Total industry Output ($MM)
Value-Added ($MM)
Logging 3,420 89.64 496.76 161.27Solid Wood Products 10,213 335.25 1,476.33 574.32Wood Furniture 4,375 150.46 478.16 211.05Pulp and Paper 4,986 211.02 920.35 374.66(sum of above sectors) 22,994 786.38 3,371.60 1,321.30FOREsT pRODUCTs iNDUsTRY
21,462 746.69 3,107.56 1,243.77
TAble 9b. TOTAl IMPACTs Of The fOresT PrOduCTs IndusTry On eMPlOyMenT, WAges, OuTPuT And VAlue-Added In nOrTh MIssIssIPPI (2006).
Model sectors EmploymentWages and
salaries ($MM)Total industry Output ($MM)
Value-Added ($MM)
Logging 1,887 43.76 256.10 83.83Solid Wood Products 7,687 257.23 1,092.09 449.50Wood Furniture 39,632 1,399.85 4,332.18 1,873.52Pulp and Paper 3,008 126.04 546.99 191.53(sum of above sectors) 52,213 1,826.88 6,227.36 2,598.38FOREsT pRODUCTs iNDUsTRY
49,909 1,761.89 5,898.44 2,483.97
TAble 10A. dIreCT IMPACTs Of The fOresT PrOduCTs IndusTry On eMPlOyMenT, WAges, OuTPuT And VAlue-Added In CenTrAl MIssIssIPPI (2006).
Model sectors EmploymentWages and
salaries ($MM)Total industry Output ($MM)
Value-Added ($MM)
Miscellaneous Forest Products 96 6.03 65.68 17.54Logging 1,611 38.54 373.61 86.61Solid Wood Products 3,997 154.61 843.44 278.78Wood Furniture 2,276 87.38 283.74 110.14Pulp and Paper 1,263 96.48 574.41 189.22Forest Products Industry(sum of above sectors)
9,243 383.04 2,140.88 682.27
ALL sECTORs 213,249 6,327.72 22,845.82 10,798.31

29
TAble 11A. dIreCT IMPACTs Of The fOresT PrOduCTs IndusTry On eMPlOyMenT, WAges, OuTPuT And VAlue-Added In sOuTheAsT MIssIssIPPI (2006).
Model sectors EmploymentWages and
salaries ($MM)Total industry Output ($MM)
Value-Added ($MM)
Miscellaneous Forest Products 23 2.44 18.75 6.57Logging 1,393 41.75 326.58 77.79Solid Wood Products 3,137 137.89 820.05 334.57Wood Furniture 738 25.22 88.45 36.56Pulp and Paper 758 58.35 421.60 150.47Forest Products Industry(sum of above sectors)
6,051 265.64 1,675.42 605.95
ALL sECTORs 341,279 13,070.22 48,608.44 20,994.54
TAble 11b. TOTAl IMPACTs Of The fOresT PrOduCTs IndusTry On eMPlOyMenT, WAges, OuTPuT And VAlue-Added In sOuTheAsT MIssIssIPPI (2006).
Model sectors EmploymentWages and
salaries ($MM)Total industry Output ($MM)
Value-Added ($MM)
Logging 2,567 85.30 440.54 139.95Solid Wood Products 8,488 337.77 1,435.60 634.69Wood Furniture 1,379 49.07 156.68 73.13Pulp and Paper 3,343 156.06 704.56 298.40(sum of above sectors) 15,777 628.21 2,737.37 1,146.18FOREsT pRODUCTs iNDUsTRY
14,260 578.54 2,480.54 1,065.06
TAble 12A. dIreCT IMPACTs Of The fOresT PrOduCTs IndusTry On eMPlOyMenT, WAges, OuTPuT And VAlue-Added In sOuThWesT MIssIssIPPI (2006).
Model sectors EmploymentWages and
salaries ($MM)Total industry Output ($MM)
Value-Added ($MM)
Miscellaneous Forest Products 136 10.27 102.49 31.76Logging 1,303 29.46 298.76 67.19Solid Wood Products 3,427 141.15 769.08 233.75Wood Furniture 193 5.49 28.72 13.01Pulp and Paper 1,369 115.61 666.81 204.21Forest Products Industry(sum of above sectors)
6,429 301.98 1,865.86 549.92
ALL sECTORs 385,263 13,960.23 48,959.55 22,947.85

30
TAble 13b. TOTAl IMPACTs Of The fOresT PrOduCTs IndusTry On eMPlOyMenT, WAges, OuTPuT And VAlue-Added In The MIssIssIPPI delTA (2006).
Model sectors EmploymentWages and
salaries ($MM)Total industry Output ($MM)
Value-Added ($MM)
Logging 3,274 47.67 485.34 176.89Solid Wood Products 2,618 65.43 388.88 138.94Wood Furniture 4,375 150.46 478.16 211.05Pulp and Paper 2,471 83.51 488.40 185.29(sum of above sectors) 12,737 347.07 1,840.79 712.17FOREsT pRODUCTs iNDUsTRY
11,614 271.33 1,647.88 634.25
TAble 12b. TOTAl IMPACTs Of The fOresT PrOduCTs IndusTry On eMPlOyMenT, WAges, OuTPuT And VAlue-Added In sOuThWesT MIssIssIPPI.
Model sectors Employment Wages and salaries ($MM)
Total industry Output ($MM)
Value-Added ($MM)
Logging 2,675 75.01 418.16 135.62Solid Wood Products 9,037 329.88 1,421.08 538.85Wood Furniture 422 13.57 51.92 25.55Pulp and Paper 5,900 280.11 1,175.13 469.85(sum of above sectors) 18,034 698.57 3,066.28 1,169.87FOREsT pRODUCTs iNDUsTRY
17,007 674.12 2,867.34 1,122.48
TAble 13A. dIreCT IMPACTs Of The fOresT PrOduCTs IndusTry On eMPlOyMenT, WAges, OuTPuT And VAlue-Added In The MIssIssIPPI delTA (2006).
Model sectors EmploymentWages and
salaries ($MM)Total industry Output ($MM)
Value-Added ($MM)
Miscellaneous Forest Products 259 0.12 169.54 40.42Logging 1,306 5.79 336.51 98.49Solid Wood Products 1,009 35.89 215.28 62.52Wood Furniture 402 13.32 66.14 33.07Pulp and Paper 558 43.40 296.20 94.72Forest Products Industry(sum of above sectors)
3,534 98.52 1,083.67 329.22
ALL sECTORs 252,506 4,898.79 26,112.41 11,699.69

31
TAble 14. lOggIng resIdues And fIrsT ThInnIng MATerIAls nOT CurrenTly hArVesTed POTenTIAlly AVAIlAble fOr use As bIOfuels In MIssIssIPPI. Source: Perez-Verdin et al. 2008b
Mississippi RegionLogging Residues
(dry tons)Thinnings(dry tons)
Total
Central 758,070 286,341 1,044,411 Delta 295,913 80,469 376,382 North 475,485 184,706 660,191 Southeast 495,852 129,150 625,002 Southwest 737,911 146,358 884,269 TOTAL 2,763,231 827,025 3,590,256
TAble 15. dIreCT IMPACTs Of POTenTIAl bIO-fuels relATed ACTIVITIes On The MIssIssIPPI eCOnOMy. Source: Perez-Verdin et al. 2008b
Model sectors EmploymentWages and
salaries ($MM)Total industry Output ($MM)
Value-Added ($MM)
Logging (3.5 million dry tons) 585 13.28 151.75 37.27Biopower (100 megawatt plant) 281 7.95 64.47 14.98Biofuels (52MM gallon plant) 908 23.11 38.11 150.11
TAble 16. TOTAl IMPACTs Of POTenTIAl bIO-fuels relATed ACTIVITIes On The MIssIssIPPI eCOnOMy. Source: Perez-Verdin et al. 2008b
Model sectors EmploymentWages and
salaries ($MM)Total industry Output ($MM)
Value-Added ($MM)
Logging (3.5 million dry tons) 1,712 46.95 282.49 97.78Biopower (100 megawatt plant) 632 19.09 103.42 34.94Biofuels (52MM gallon plant) 1,756 49.77 242.35 86.41

discrimination based upon race, color, religion, sex, national origin, disability, or veteran’s status is a violation of federal and state law and MSU policy and will not be tolerated. Discrimination based upon sexual orientation or group affiliation is a violation of Msu policy and will not be tolerated.
College of Forest ResourcesMiss iss ippi S tate Univers i ty
Forest and Wildlife Research Center