Embed Size (px)
Citation preview
4/4/2012 1
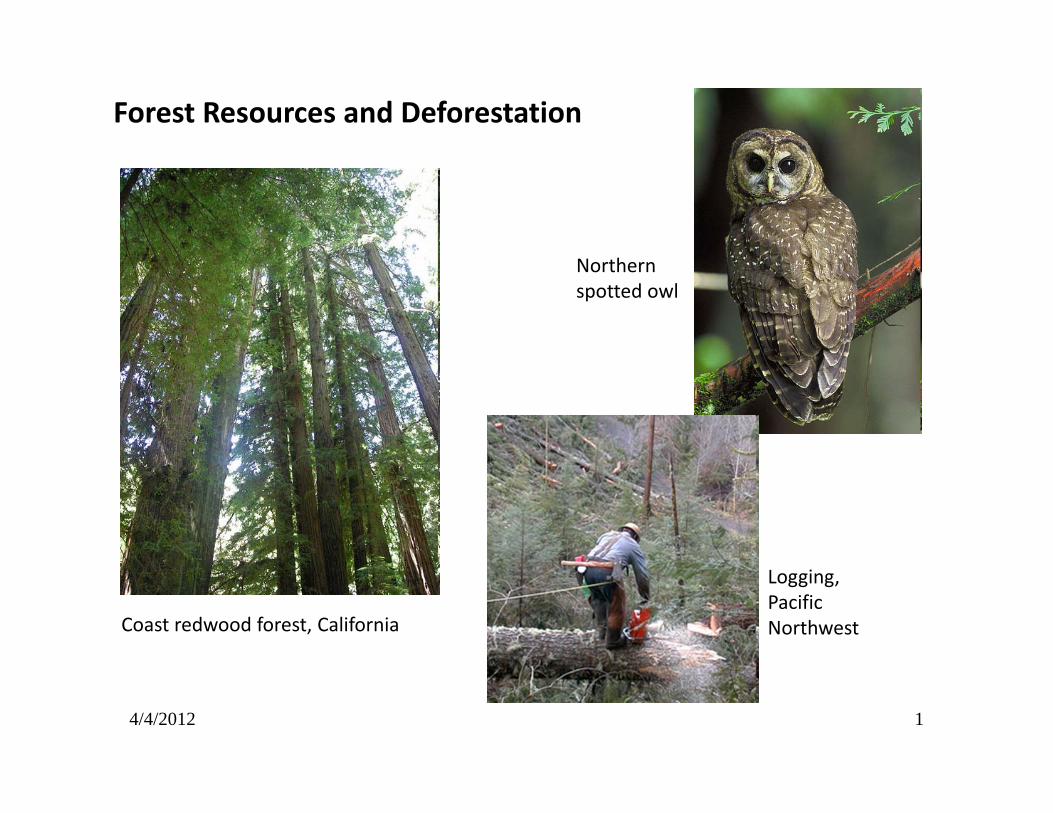
Forest Resources and Deforestation
Coast redwood forest, California
Northern spotted owl
Logging, Pacific Northwest
4/4/2012 2
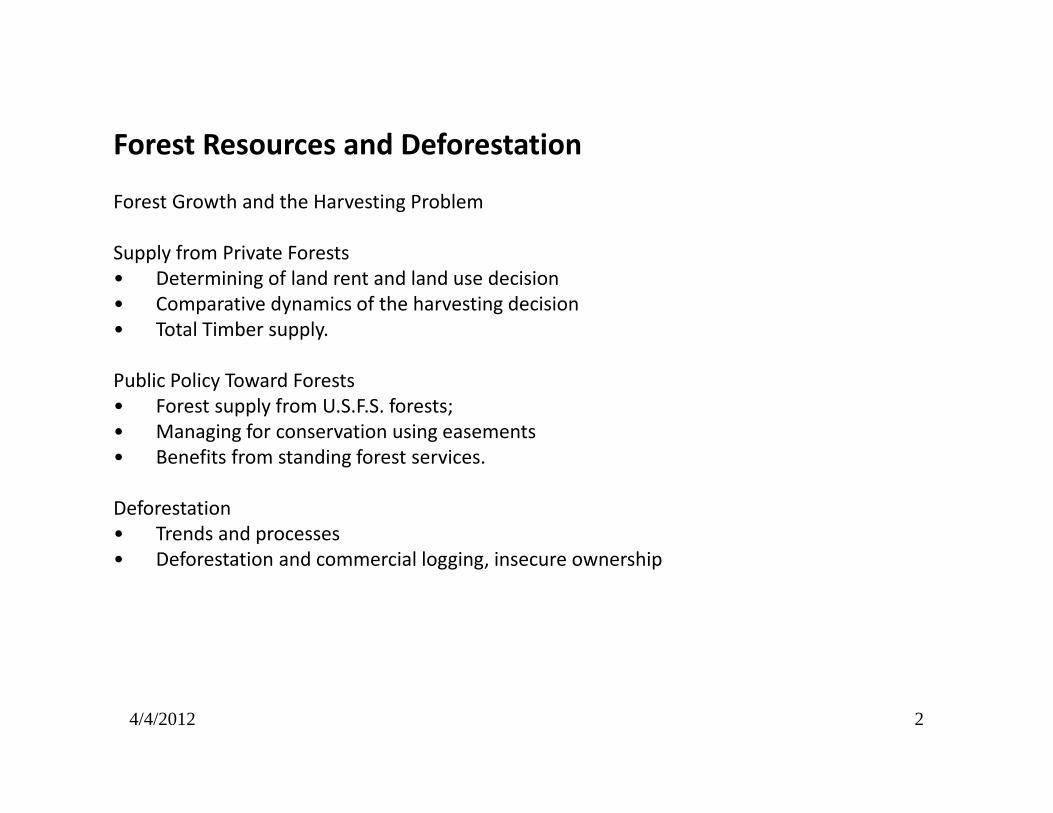
Forest Resources and Deforestation
Forest Growth and the Harvesting Problem
Supply from Private Forests• Determining of land rent and land use decision• Comparative dynamics of the harvesting decision• Total Timber supply.
Public Policy Toward Forests• Forest supply from U.S.F.S. forests;• Managing for conservation using easements• Benefits from standing forest services.
Deforestation• Trends and processes• Deforestation and commercial logging, insecure ownership
4/4/2012 3
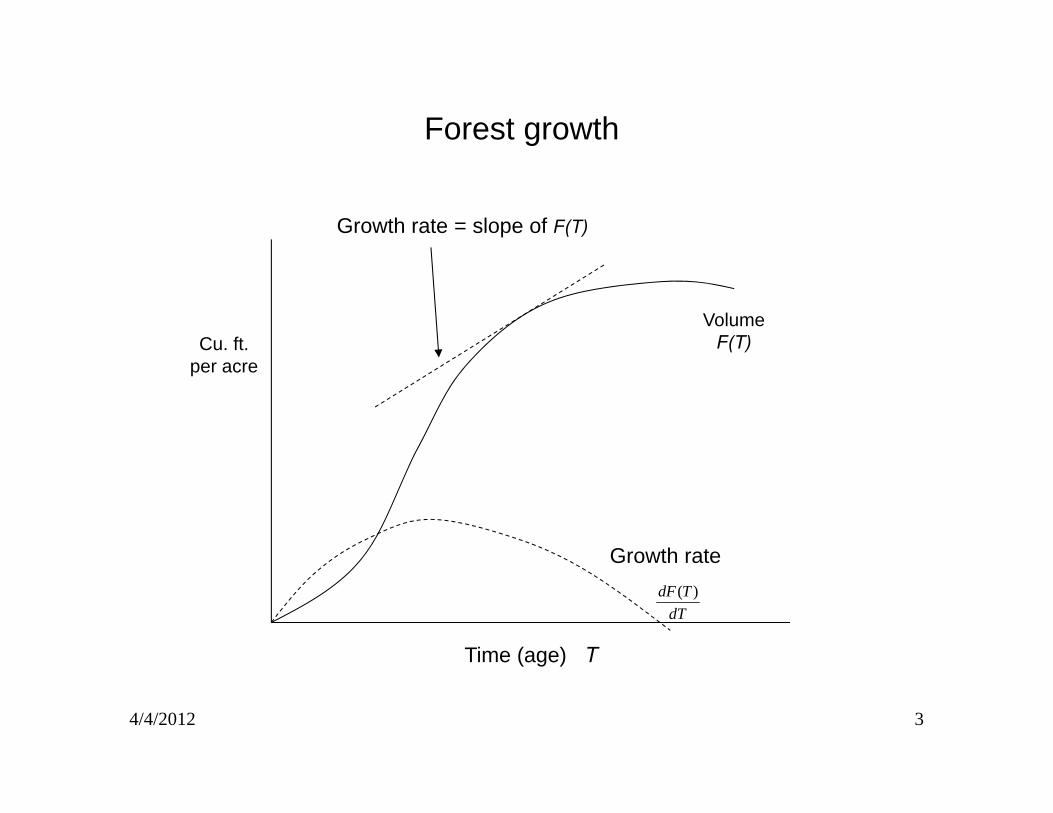
Forest growth
Time (age) T
Cu. ft.per acre
VolumeF(T)
Growth rate
Growth rate = slope of F(T)
dTTdF )(
4/4/2012 4
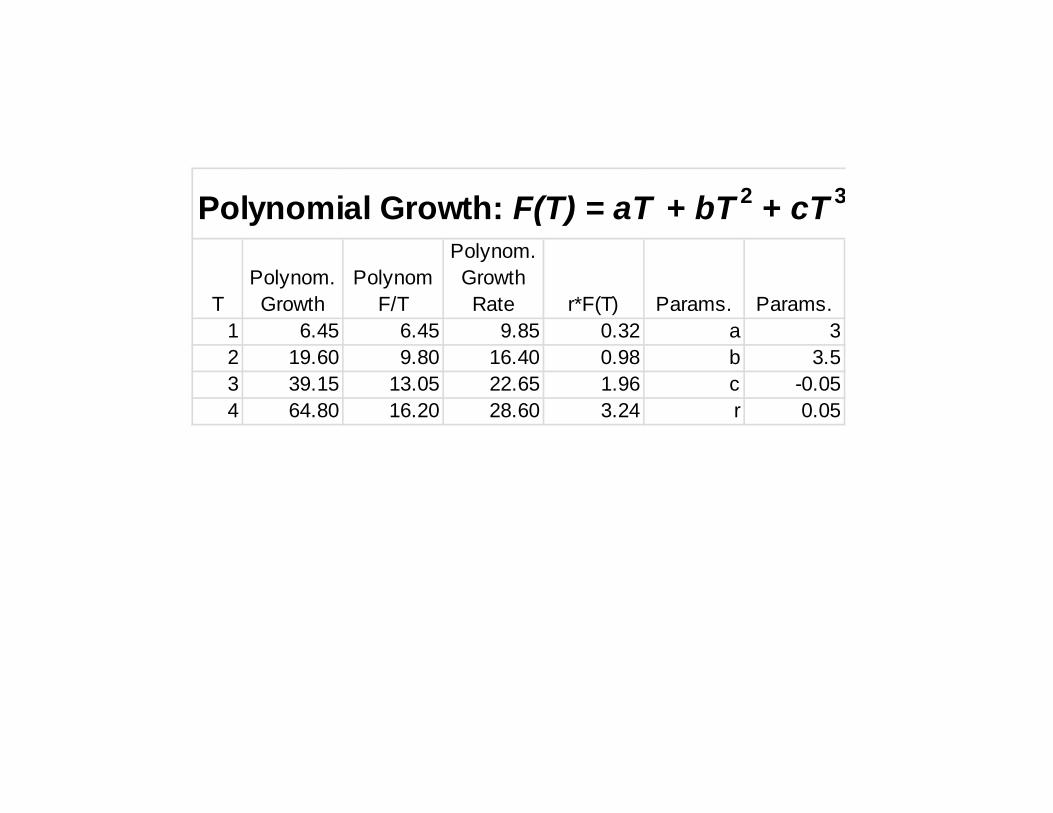
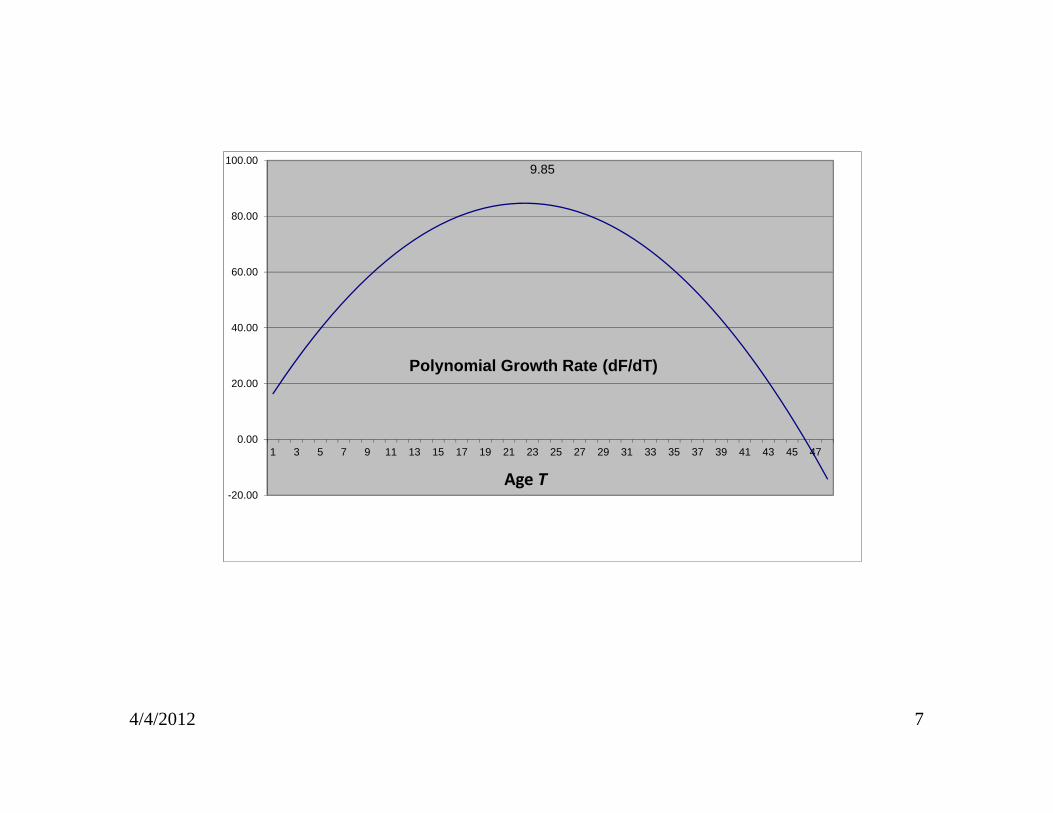
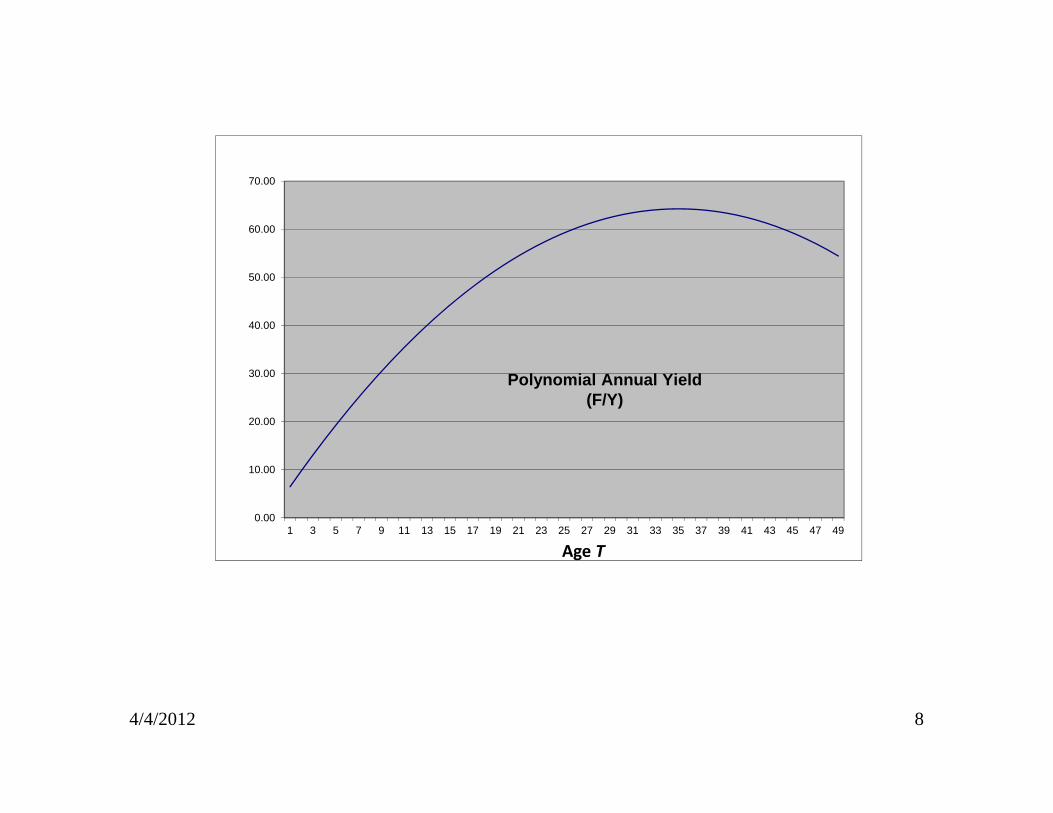
Polynomial Growth: F(T) = aT + bT 2 + cT 3
TPolynom. Growth
Polynom F/T
Polynom. Growth Rate r*F(T) Params. Params.
1 6.45 6.45 9.85 0.32 a 32 19.60 9.80 16.40 0.98 b 3.53 39.15 13.05 22.65 1.96 c -0.054 64.80 16.20 28.60 3.24 r 0.05
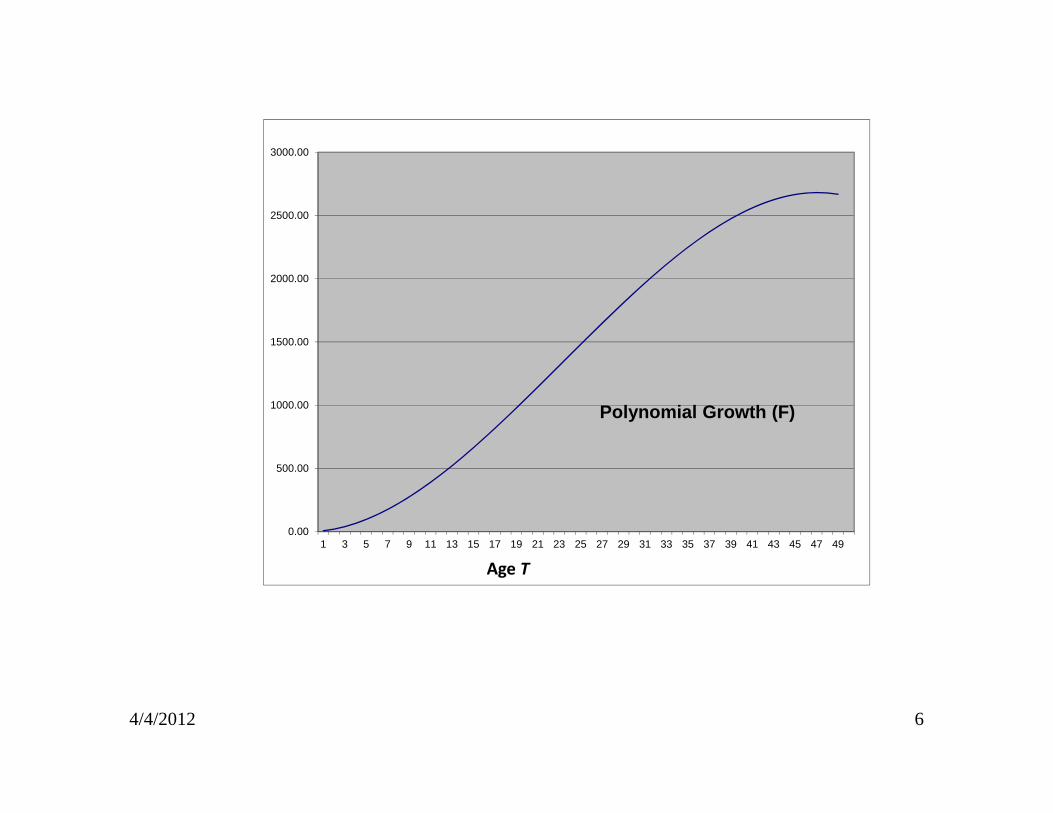
4/4/2012 6
0.00
500.00
1000.00
1500.00
2000.00
2500.00
3000.00
1 3 5 7 9 11 13 15 17 19 21 23 25 27 29 31 33 35 37 39 41 43 45 47 49
Polynomial Growth (F)
Age T
4/4/2012 7
-20.00
0.00
20.00
40.00
60.00
80.00
100.00
1 3 5 7 9 11 13 15 17 19 21 23 25 27 29 31 33 35 37 39 41 43 45 47
9.85
Polynomial Growth Rate (dF/dT)
Age T
4/4/2012 8
0.00
10.00
20.00
30.00
40.00
50.00
60.00
70.00
1 3 5 7 9 11 13 15 17 19 21 23 25 27 29 31 33 35 37 39 41 43 45 47 49
Polynomial Annual Yield (F/Y)
Age T
4/4/2012 9
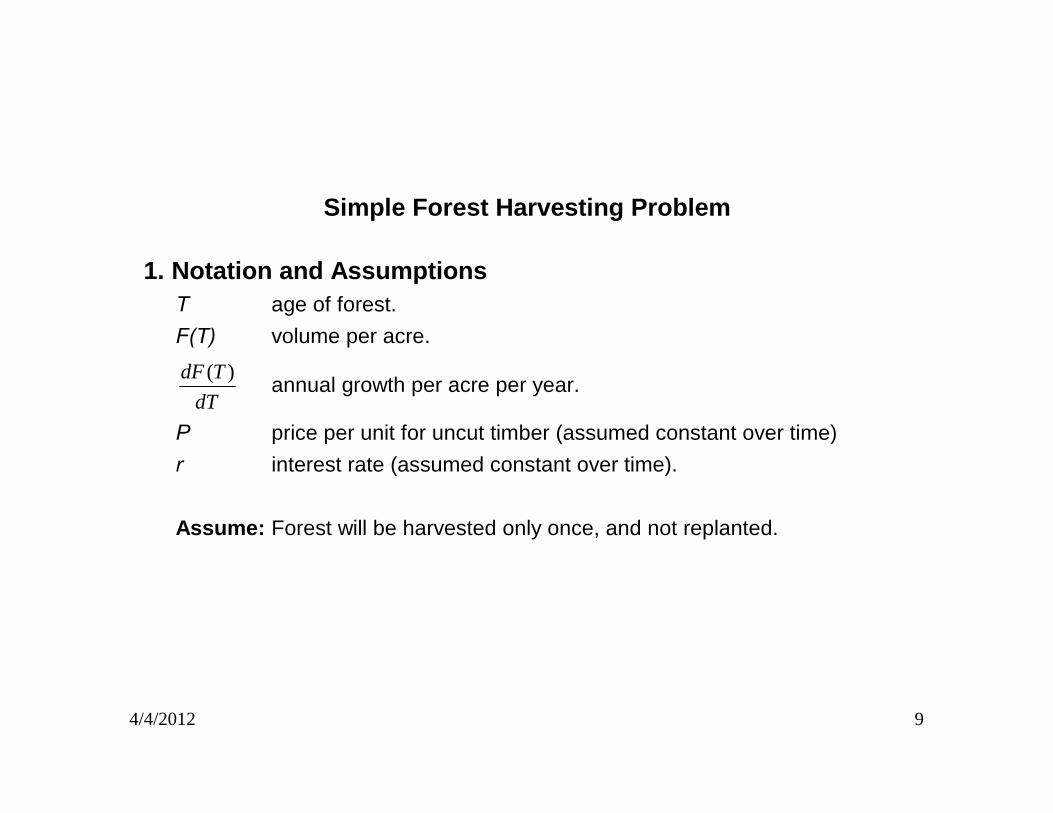
Simple Forest Harvesting Problem 1. Notation and Assumptions
T age of forest. F(T) volume per acre.
dTTdF )( annual growth per acre per year.
P price per unit for uncut timber (assumed constant over time) r interest rate (assumed constant over time). Assume: Forest will be harvested only once, and not replanted.
4/4/2012 10
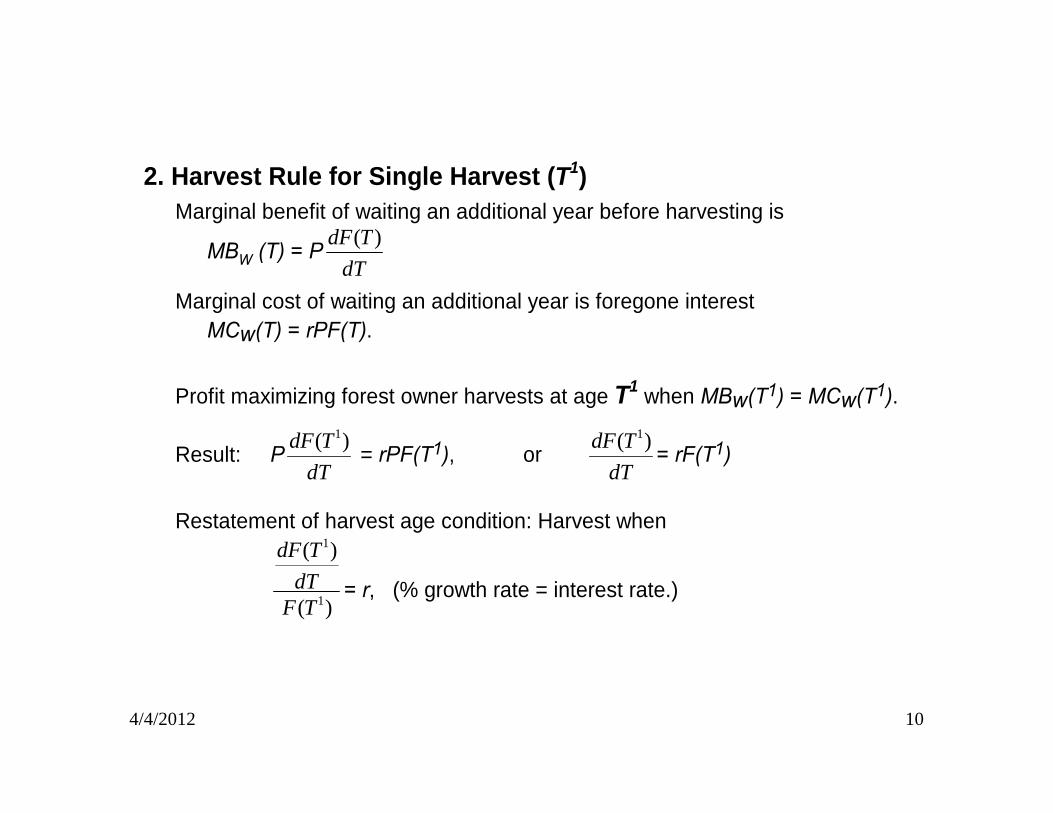
2. Harvest Rule for Single Harvest (T1) Marginal benefit of waiting an additional year before harvesting is
MBW (T) = PdT
TdF )(
Marginal cost of waiting an additional year is foregone interest MCw(T) = rPF(T). Profit maximizing forest owner harvests at age T1 when MBw(T1) = MCw(T1).
Result: PdT
TdF )( 1
= rPF(T1), or dT
TdF )( 1
= rF(T1)
Restatement of harvest age condition: Harvest when
)(
)(
1
1
TFdT
TdF
= r, (% growth rate = interest rate.)
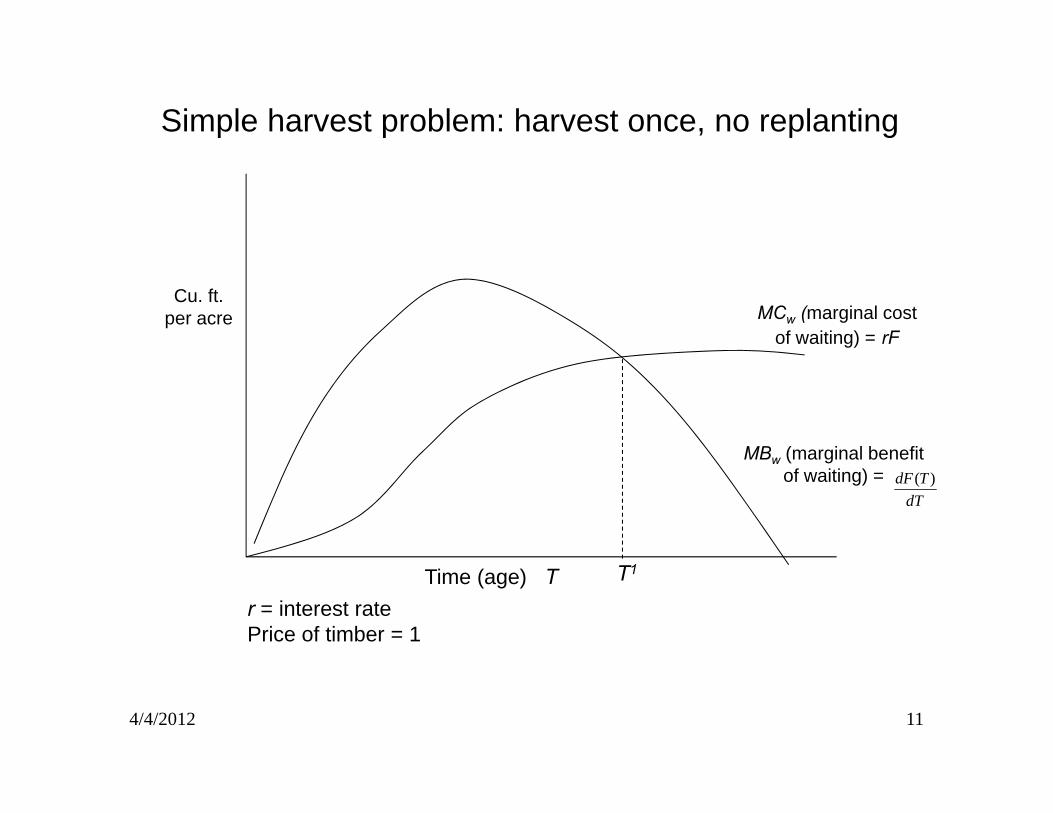
4/4/2012 11
Time (age) T
Cu. ft.per acre
MBw (marginal benefitof waiting) =
MCw (marginal costof waiting) = rF
r = interest ratePrice of timber = 1
Simple harvest problem: harvest once, no replanting
T1
dTTdF )(
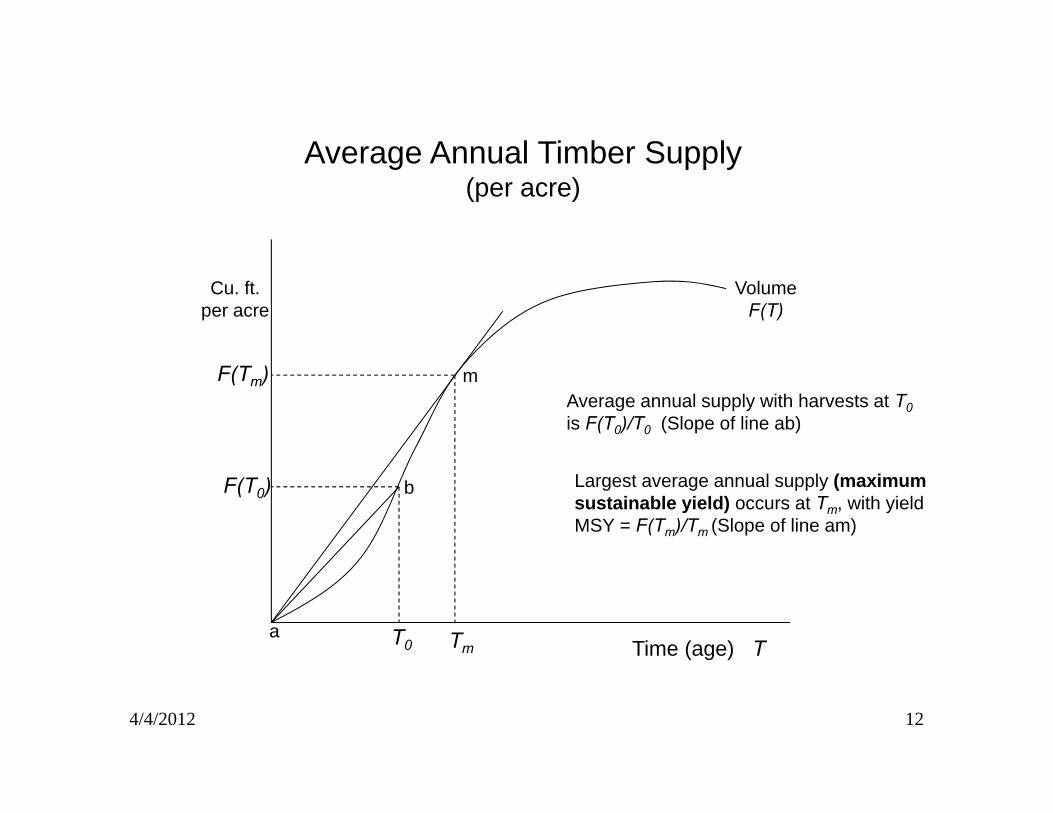
4/4/2012 12
Average Annual Timber Supply(per acre)
Time (age) T
Cu. ft.per acre
VolumeF(T)
T0 Tm
Average annual supply with harvests at T0is F(T0)/T0 (Slope of line ab)
a
bF(T0) Largest average annual supply (maximumsustainable yield) occurs at Tm, with yieldMSY = F(Tm)/Tm (Slope of line am)
F(Tm) m
4/4/2012 13
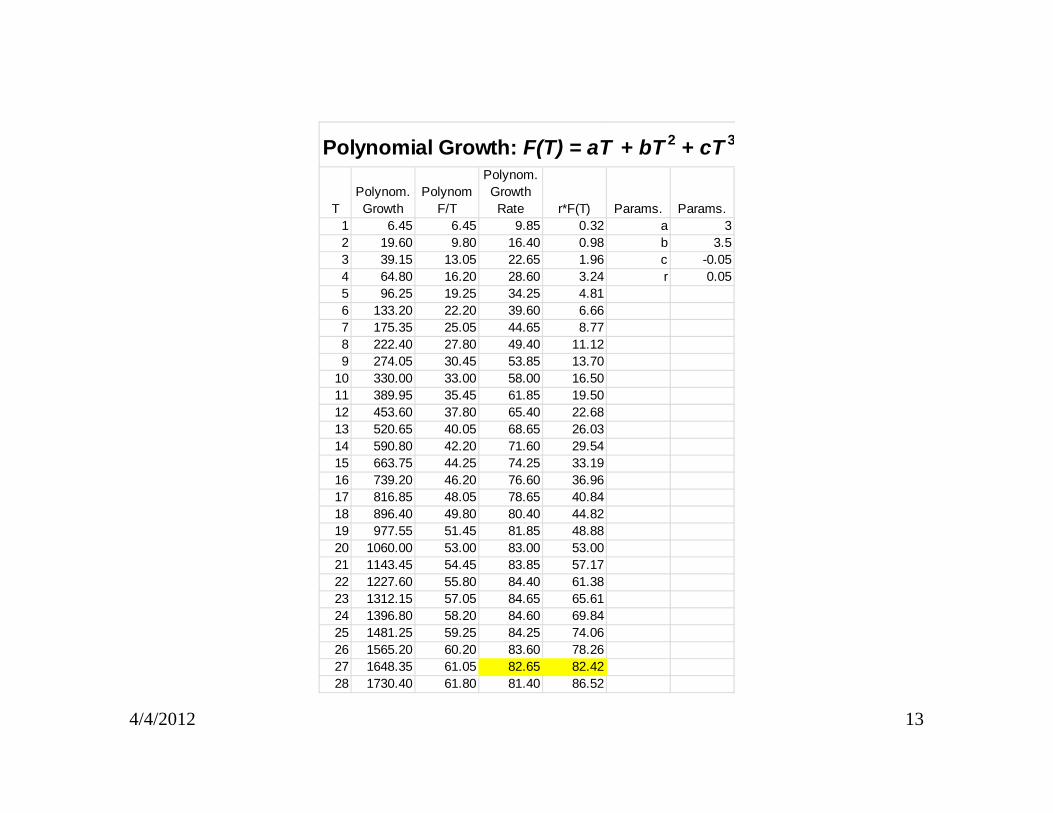
Polynomial Growth: F(T) = aT + bT 2 + cT 3
TPolynom. Growth
Polynom F/T
Polynom. Growth Rate r*F(T) Params. Params.
1 6.45 6.45 9.85 0.32 a 32 19.60 9.80 16.40 0.98 b 3.53 39.15 13.05 22.65 1.96 c -0.054 64.80 16.20 28.60 3.24 r 0.055 96.25 19.25 34.25 4.816 133.20 22.20 39.60 6.667 175.35 25.05 44.65 8.778 222.40 27.80 49.40 11.129 274.05 30.45 53.85 13.70
10 330.00 33.00 58.00 16.5011 389.95 35.45 61.85 19.5012 453.60 37.80 65.40 22.6813 520.65 40.05 68.65 26.0314 590.80 42.20 71.60 29.5415 663.75 44.25 74.25 33.1916 739.20 46.20 76.60 36.9617 816.85 48.05 78.65 40.8418 896.40 49.80 80.40 44.8219 977.55 51.45 81.85 48.8820 1060.00 53.00 83.00 53.0021 1143.45 54.45 83.85 57.1722 1227.60 55.80 84.40 61.3823 1312.15 57.05 84.65 65.6124 1396.80 58.20 84.60 69.8425 1481.25 59.25 84.25 74.0626 1565.20 60.20 83.60 78.2627 1648.35 61.05 82.65 82.4228 1730.40 61.80 81.40 86.52
4/4/2012 14
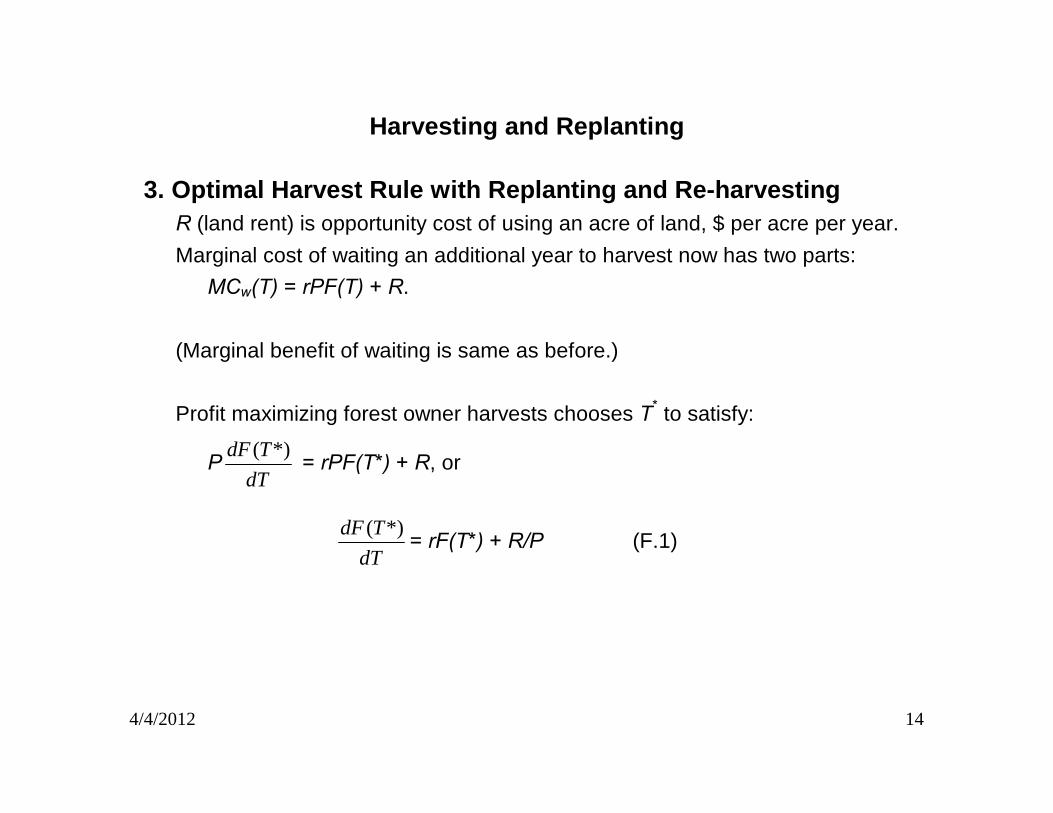
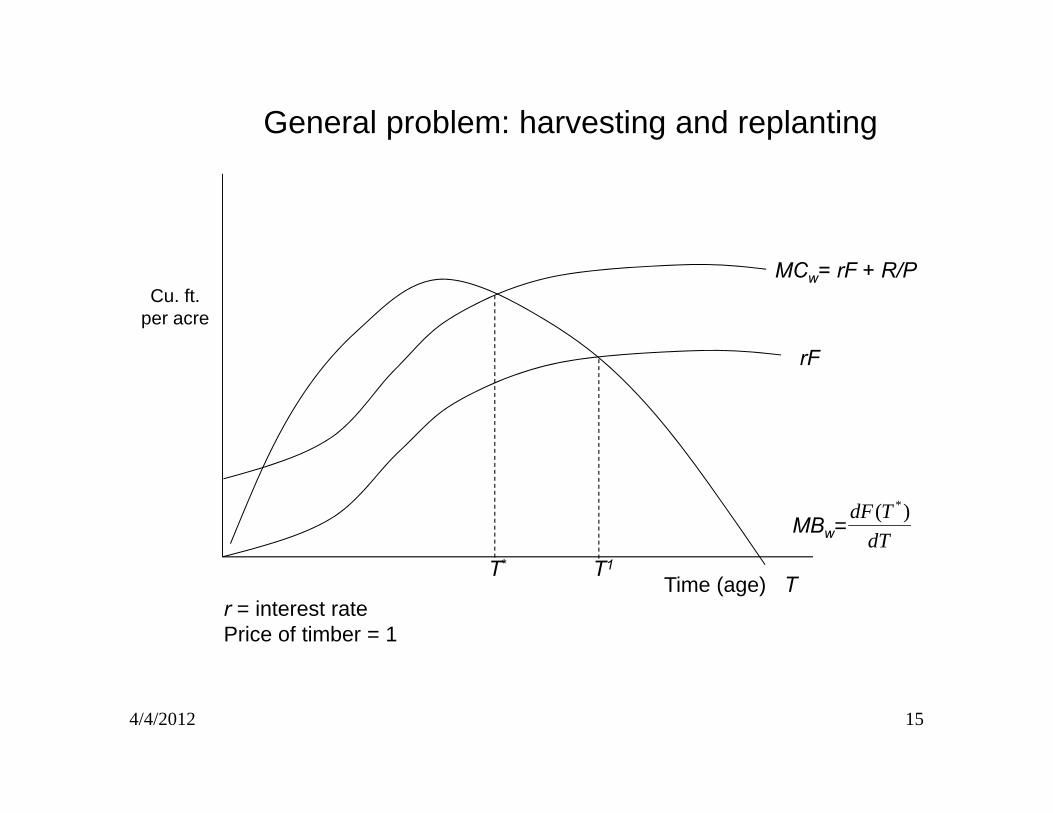
Harvesting and Replanting 3. Optimal Harvest Rule with Replanting and Re-harvesting
R (land rent) is opportunity cost of using an acre of land, $ per acre per year.Marginal cost of waiting an additional year to harvest now has two parts:
MCw(T) = rPF(T) + R. (Marginal benefit of waiting is same as before.) Profit maximizing forest owner harvests chooses T* to satisfy:
PdT
TdF *)( = rPF(T*) + R, or
dT
TdF *)( = rF(T*) + R/P (F.1)
4/4/2012 15
Time (age) T
Cu. ft.per acre
MBw=
MCw= rF + R/P
r = interest ratePrice of timber = 1
General problem: harvesting and replanting
T1
rF
T*dT
TdF )( *
4/4/2012 16
4. The Land Use Decision and Determinants of R (land rent) Notation: Subscripts ‘f’ and ‘a’ denote land uses, "forestry" and "alternative".
The return an acre of land can earn these two uses is denoted Rf and Ra.
The owner will: allocate the acre of land to forestry if Rf ≥ Ra
allocate the acre to alternative use if Rf < Ra.
The resulting rent will be R = max(Rf, Ra).
4/4/2012 17
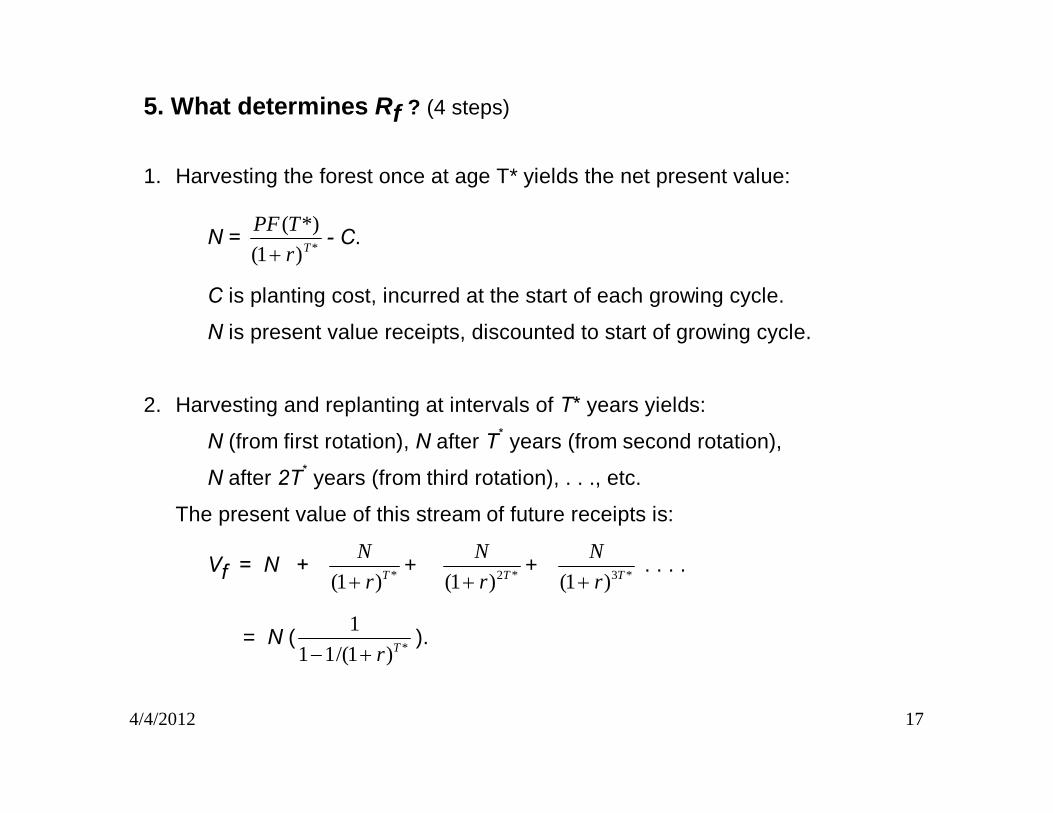
5. What determines Rf ? (4 steps)
1. Harvesting the forest once at age T* yields the net present value:
N = *)1(*)(Tr
TPF
- C.
C is planting cost, incurred at the start of each growing cycle.
N is present value receipts, discounted to start of growing cycle.
2. Harvesting and replanting at intervals of T* years yields:
N (from first rotation), N after T* years (from second rotation),
N after 2T* years (from third rotation), . . ., etc.
The present value of this stream of future receipts is:
Vf = N + *)1( TrN
+ *2)1( TrN
+ *3)1( TrN
. . . .
= N ( *)1/(111
Tr).
4/4/2012 18
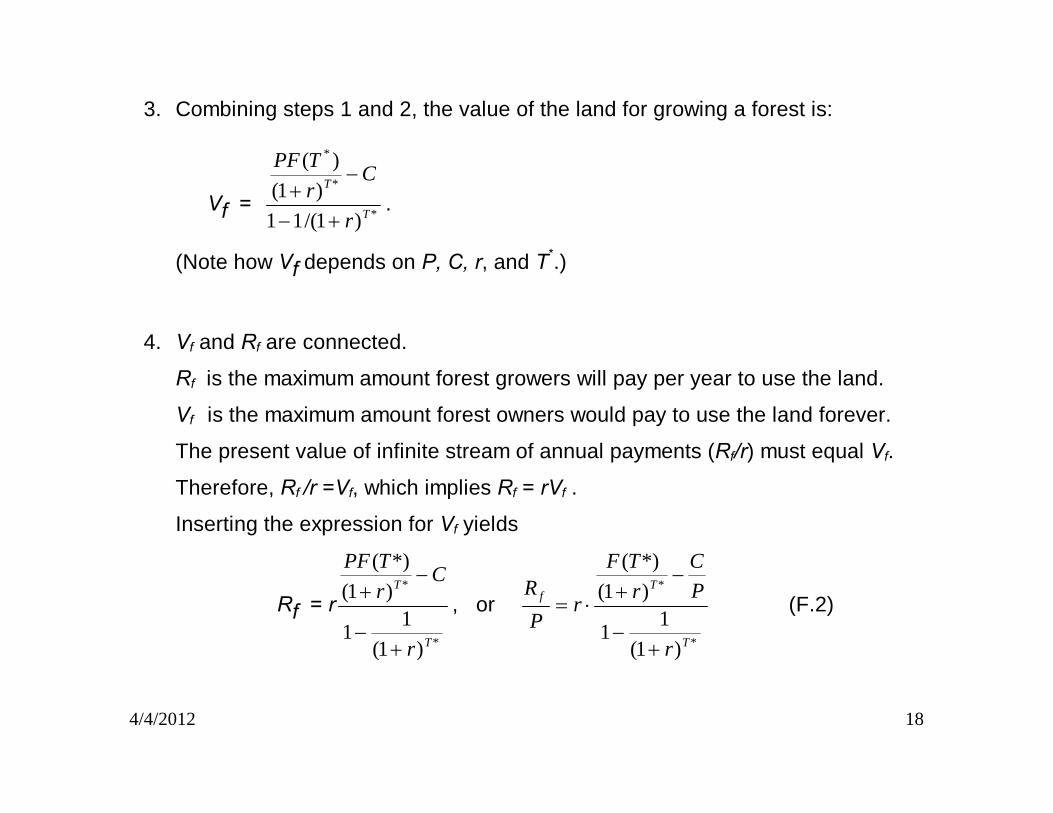
3. Combining steps 1 and 2, the value of the land for growing a forest is:
Vf = *
*
*
)1/(11)1(
)(
T
T
r
CrTPF
.
(Note how Vf depends on P, C, r, and T*.)
4. Vf and Rf are connected.
Rf is the maximum amount forest growers will pay per year to use the land.
Vf is the maximum amount forest owners would pay to use the land forever.
The present value of infinite stream of annual payments (Rf/r) must equal Vf.
Therefore, Rf /r =Vf, which implies Rf = rVf .
Inserting the expression for Vf yields
Rf = r*
*
)1(11
)1(*)(
T
T
r
CrTPF
, or
*
*
)1(11
)1(*)(
T
Tf
r
PC
rTF
rPR
(F.2)
4/4/2012 19
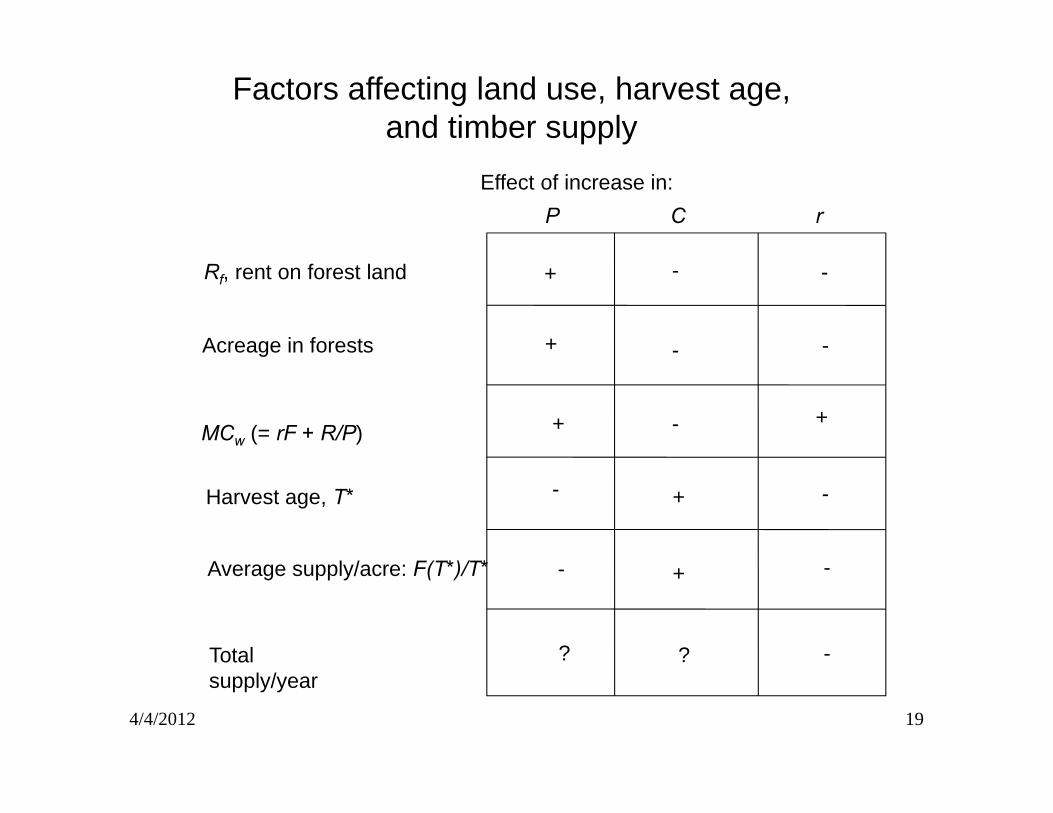
Effect of increase in:P C r
Rf, rent on forest land
Acreage in forests
MCw (= rF + R/P)
Harvest age, T*
Average supply/acre: F(T*)/T*
Total supply/year
+ - -
+ - -
-
- -
- -
-? ?
+
+
+ +
Factors affecting land use, harvest age,and timber supply
4/4/2012 20
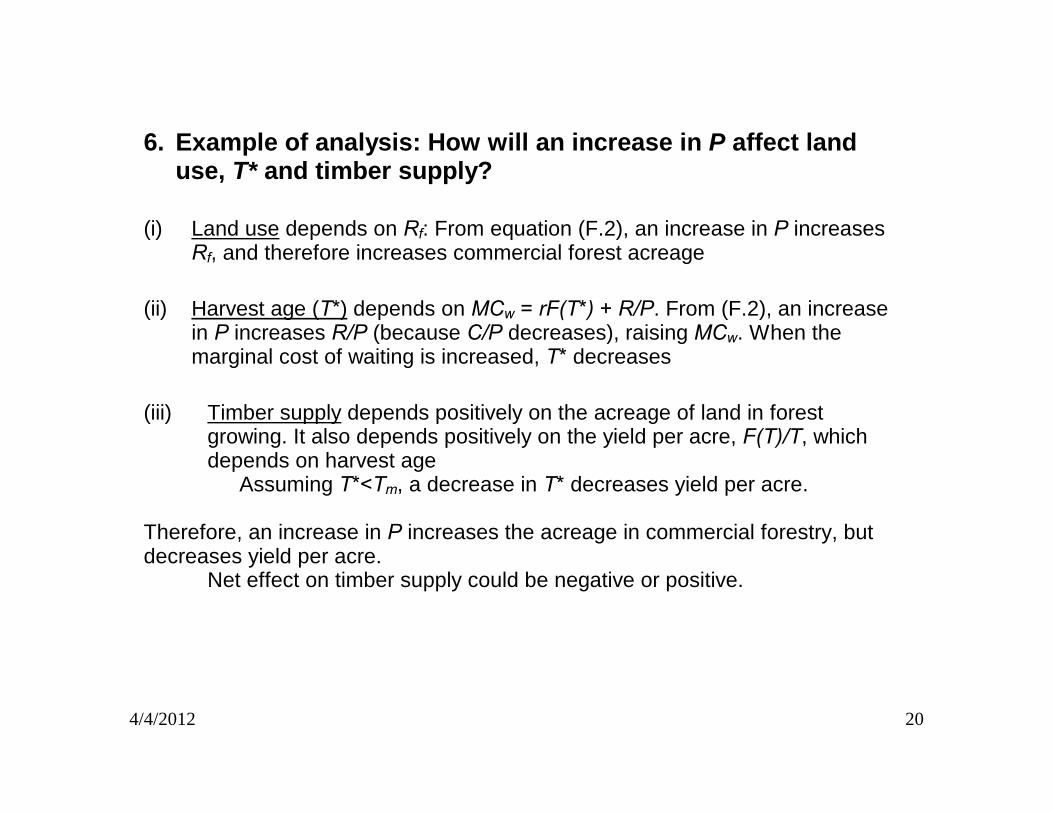
6. Example of analysis: How will an increase in P affect land use, T* and timber supply?
(i) Land use depends on Rf: From equation (F.2), an increase in P increases
Rf, and therefore increases commercial forest acreage (ii) Harvest age (T*) depends on MCw = rF(T*) + R/P. From (F.2), an increase
in P increases R/P (because C/P decreases), raising MCw. When the marginal cost of waiting is increased, T* decreases
(iii) Timber supply depends positively on the acreage of land in forest
growing. It also depends positively on the yield per acre, F(T)/T, which depends on harvest age
Assuming T*<Tm, a decrease in T* decreases yield per acre.
Therefore, an increase in P increases the acreage in commercial forestry, but decreases yield per acre.
Net effect on timber supply could be negative or positive.
4/4/2012 21
Forest management on U.S.F.S forests
MSY principle for harvest age decisions
MSY can justify harvests, even though profit<0. USFS incurred losses on some forests & subsidized with other revenues.
GAO study, 1984:Examined data on 3,000 timber stumpage sales in 1981 & 1982 USFS cost of sales include: mgt. cost on forest, road building, fire control, etc.Nearly all sales in Rocky Mt., Intermountain, some Northern region forests lost money.
4/4/2012 22
Forest management on U.S.F.S forests (cont.)
CRS 1984 study: Compare revenue to costs, forest by forest, 1973‐1983, report results by state.Profitable: Pacific states and deep southUnprofitable: Intermountain, rocky mountain, east, southwest, and Alaska
CRS 1985 study: Compare 1981 and 1982 operating revenue to costs, by region. Rocky Mt. & Intermountain Regions lost money on average.
NRDC/Wilderness Society: Compare costs and revenues 1974‐1978Consistent money losers include 125 million acres (~ size of Calif. plus Oregon)
4/4/2012 23
Forest management on U.S.F.S forests (cont.)
CRS 1994 study: USFS procedures for reporting costs of timber sale programCost accounting flawedUSFS is not responsive to recommendations for changeDuring 1989‐1993, timber sales on most national forests lost money
GAO 2001 study: USFS data on timber sale costs unreliableUSFS timber sale program lost $125 million in FY1998.All but 2 out of 10 FS regions lost money.
4/4/2012 24
A. Berry article: Comparing outcomes on FS forest and tribal forest in Montana
Difference in incentives on tribal vs. Forest Service forests in Montana
• Local control for tribal forests
• National control and lack of economic objectives on USFS forest
Forests are similar in physical attributes, species mix, forest growth potential
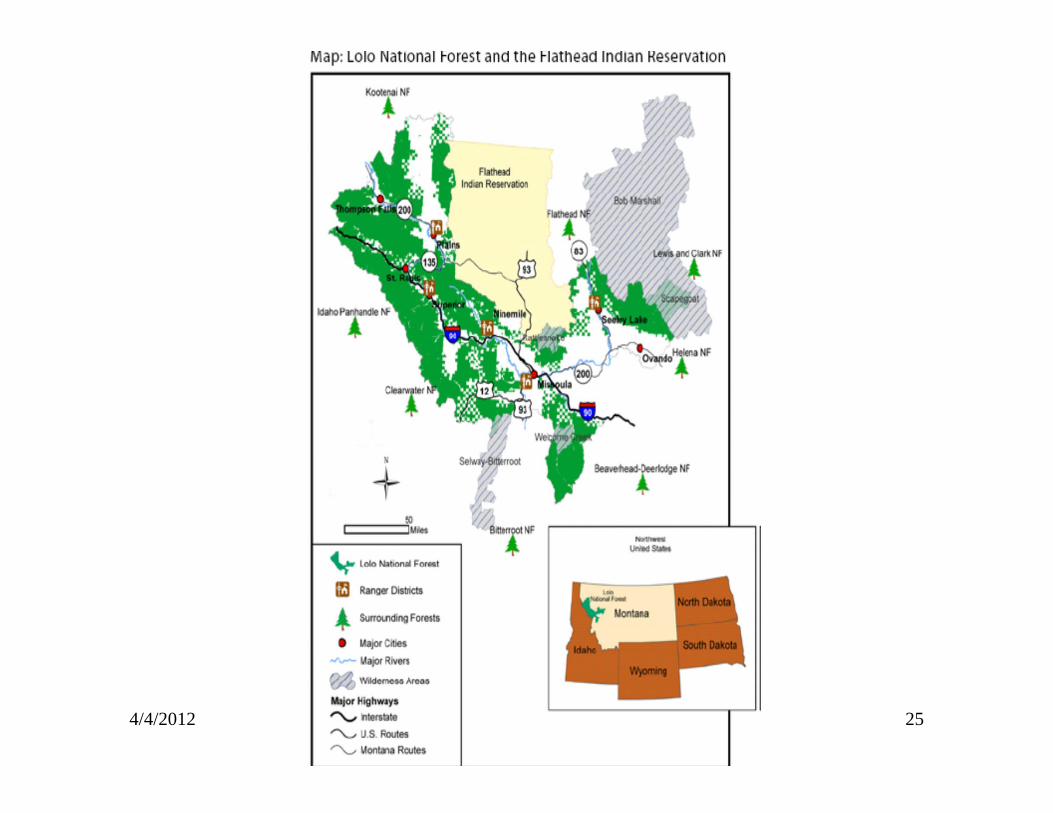
4/4/2012 25
4/4/2012 26
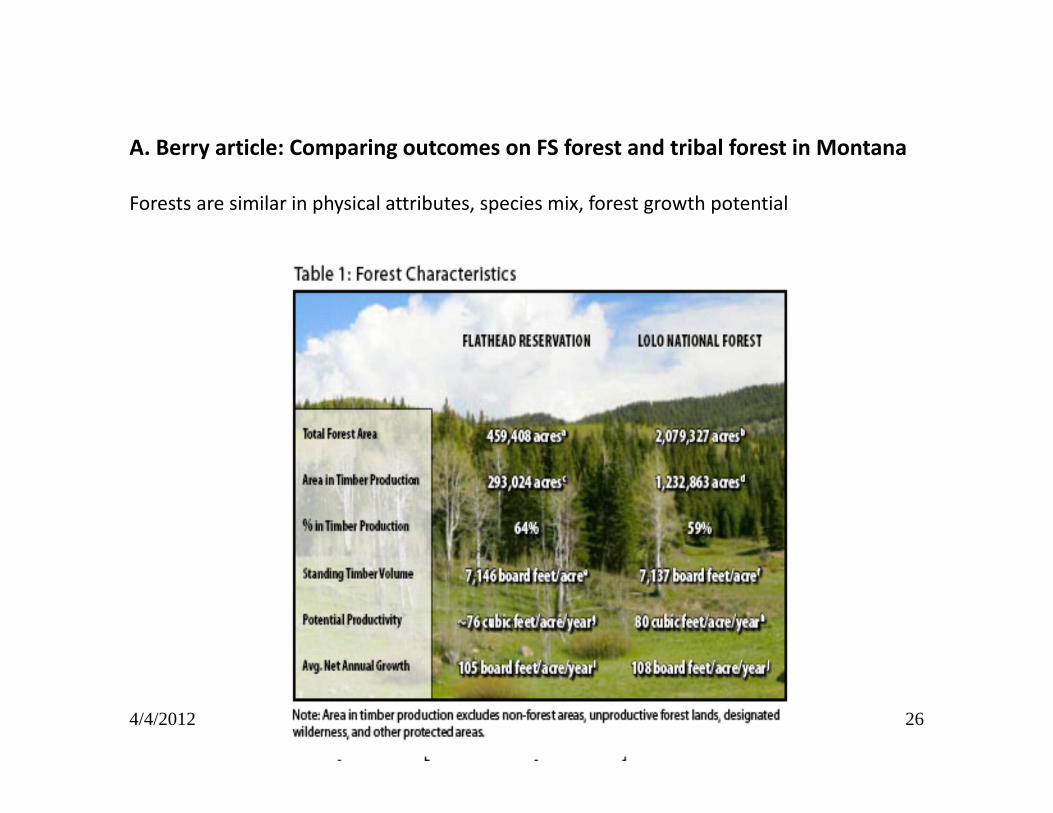
A. Berry article: Comparing outcomes on FS forest and tribal forest in Montana
Forests are similar in physical attributes, species mix, forest growth potential
4/4/2012 27
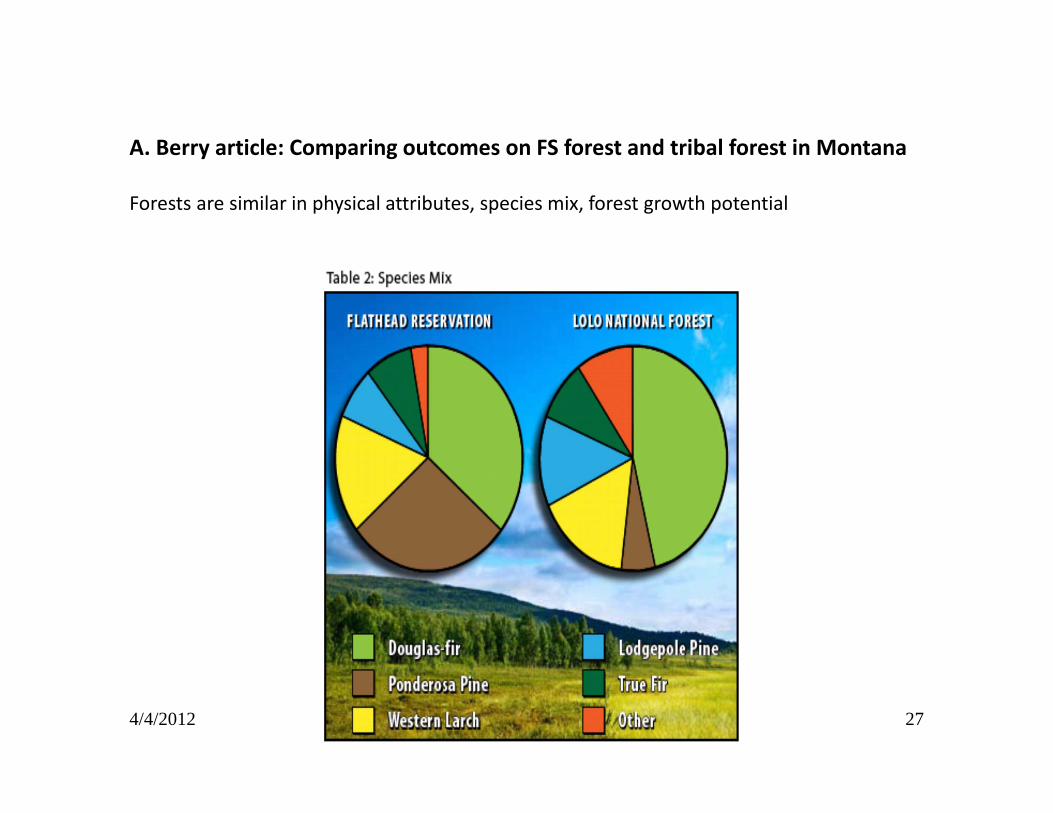
A. Berry article: Comparing outcomes on FS forest and tribal forest in Montana
Forests are similar in physical attributes, species mix, forest growth potential
4/4/2012 28
A. Berry article: Comparing outcomes on FS forest and tribal forest in Montana
Difference in objectives on tribal vs. Forest Service forests in Montana
CSKT forest: Objective is to strengthen tribal self sufficiency through good forest management, and providing perpetual economic benefits of labor, profits and products to local communities
USFS forest: Not required to generate income from timber sales; instead, manages to achieve the combination of uses that will best meet the needs of the American people … not necessarily generating the greatest dollar return …
4/4/2012 29
A. Berry article: Comparing outcomes on FS forest and tribal forest in Montana
Net revenues per acre much different: • $125/acre on Flathead Reservation• $13/acre on Lolo Nat’l. ForestTimber management costs differ; over 50% higher on Lolo Forest;Revenue per unit also different• $245/MBF on Flathead Reservation (higher quality timber harvested)• $125/MBF on Lolo Nat’l. Forest
Difference in incentives and problems of litigation on Forest Service forests account for different outcomes.
Environmental performance: • Both forests have wilderness areas that provide habitat;• Lolo forest has been plagued by litigation that has hampered its operations.• Lolo NF harvested more timber than tribal forests (1998‐2005), but earned less money.
4/4/2012 30
D. Leal analysis: Comparing outcomes on FS and State operated forests in Minnesota and Montana during 1988‐1992
Difference in incentives on state vs. Forest Service forests• States use forest revenue to support schools• During 1988‐1992, state forests earned $13.3 mill., while FS forests lost $42 mill.
Revenue / cost comparisons in Montana: • $2.16 earned per dollar spent on State forests• $0.09‐$0.73 earned per dollar spent on FS forests
Management cost differences in Minnestoa:• Cost per bd. ft. = $34.12 on FS forests;• Cost per bd. ft. = $12.31 on state forests;
Substantial differences in road building costs and practices
State forests better on environmental grounds (Serra Club, Audubon Society)
4/4/2012 31
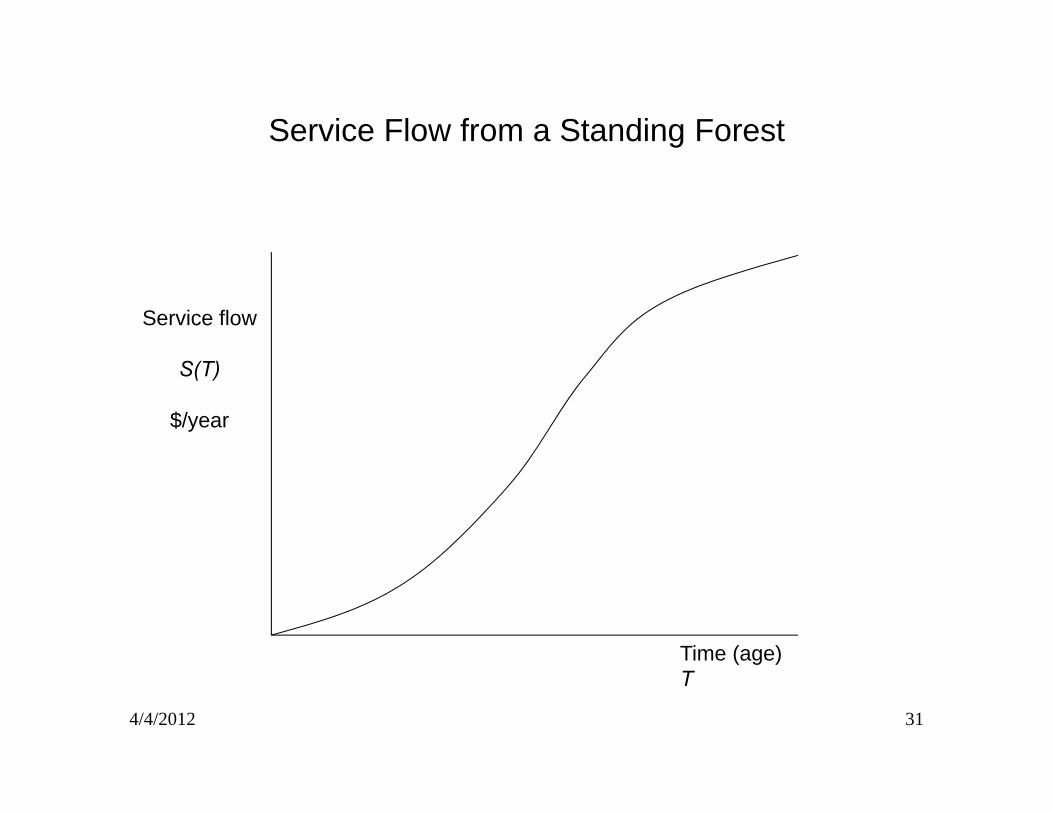
Time (age) T
Service flow
S(T)
$/year
Service Flow from a Standing Forest
4/4/2012 32
4/4/2012 33
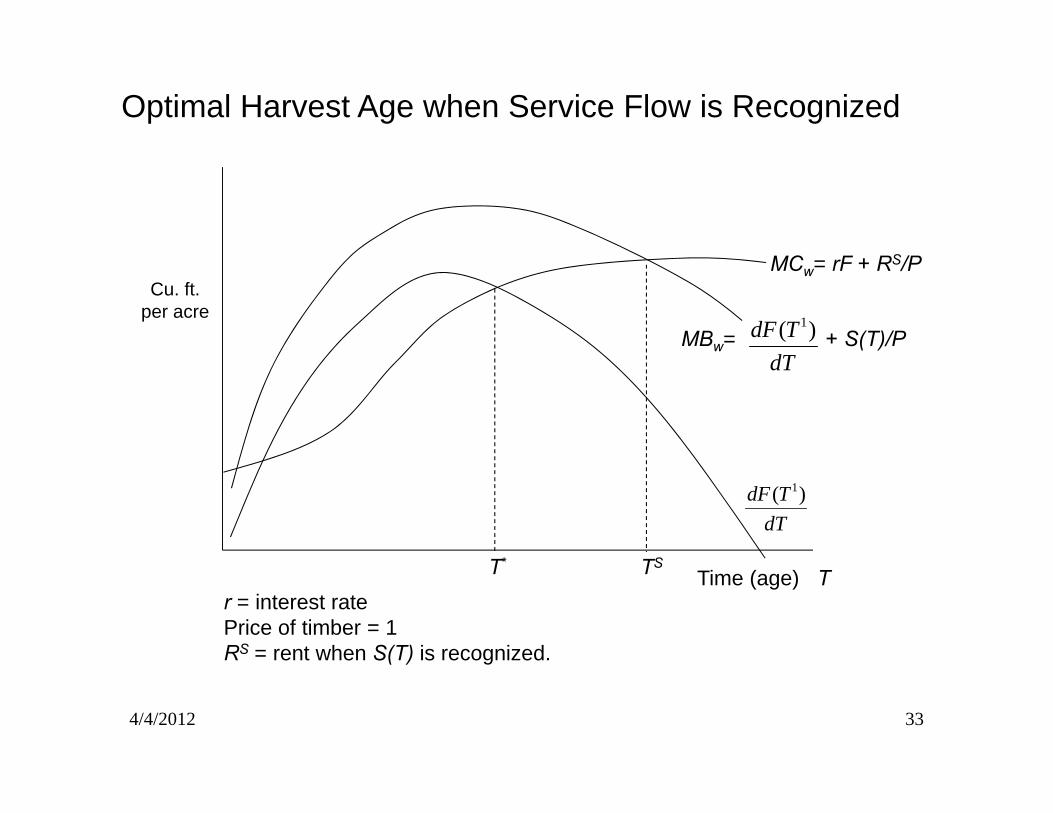
Time (age) T
Cu. ft.per acre
MCw= rF + RS/P
r = interest ratePrice of timber = 1RS = rent when S(T) is recognized.
Optimal Harvest Age when Service Flow is Recognized
T*
MBw= + S(T)/P
TS
dTTdF )( 1
dTTdF )( 1
4/4/2012 34
Conservation forestry initiatives in Cumberlands Plateau in Tennessee and “Wild Rivers Legacy Forest” in Wisconsin
4/4/2012 35
Conservation Forestry approach
Conservation Forestry LLC: invests in conservation related transactions.
Wisconsin’s Wild Rivers Legacy Forest Project• The Nature Conservancy , Wisconsin Dept. of Natural Resources, Conservation Forestry
• Purchase 69,000 acres of timber land from International Paper
• Resources: 48 lakes and ponds, >70 miles of rivers, habitat, valuable forestland
• Conservation Forestry acquires parcel, grants easements to TNC and State of Wisconsin to provide habitat and recreation.
• Some forest used for commercial timber production
• Privately negotiated
Tennessee’s Cumberlands Plateau Project (Similar structure)
4/4/2012 36
DeforestationBackground: Trends, locations, policy concerns.
Deforestation processes: • Shifting cultivation, fuelwood gathering, conversion to permanent agriculture• Forest harvesting and access to forests
Climate change and deforestation
Current trends and spatial patterns: developed vs. developing countries
Deforestation and insecure property rights• Theory• Evidence
4/4/2012 37
Overview• Tropical climax forest areas declined 20-25% since pre-agric. times.• Rapid in Latin America and S. Asia (Indon., Malaysia, Phillip.)
Tropical forests of primary interest, mainly in developing countries• SE Asia -- (Indon., Malaysia, Phillip.);• W. Africa (Nigeria, I. Coast, Gabon, Liberia, Zaire);• Latin America (Brazil, Colombia, Peru, Mexico, Ecuador Bolivia, etc.);
4/4/2012 38
Benefits standing tropical forests provide
• Resources for indigenous people: food, shelter, clothing, land to farm.• Biodiversity: genetic material for new medicines, hybrid plants, etc. • Control of CO2.
25% of CO2 buildup since pre-agric., about 12% of GHG stock. REDD (defined later): policy tool for controlling GHGs.
4/4/2012 39
Policy Challenges:
Global externality:• Benefits of preserving forests often global, external to host country.• Costs borne by host country.
Costs/benefits of clearing forests may not be represented in host country decisions.• Losers from forest clearing may lack political power.
Host country governance may be weak May not enforce ownership Possibly unstable
4/4/2012 40
Deforestation processes
“Shifting cultivation".• Burn to enrich soil, supports crops for few years, move on when
exhausted.• Facilitated by road building.
Conversion to permanent agriculture/pasture.
Fuel wood gathering:• Some forest areas cut directly.• Nutrient levels reduced, degrades forest regrowth.
Logging: role of logging roads
4/4/2012 41
Deforestation and climate change
• Forest clearing: ~20% of GHG emissions.
• Deforestation: 25% of CO2 buildup since pre-agric., about 12% of GHG stock.
• REDD, “reducing emissions from deforestation and (forest) degradation”
Low cost options for controlling GHGs
How to measure baseline?
RFF resource: http://www.forestcarbonindex.org/
4/4/2012 42
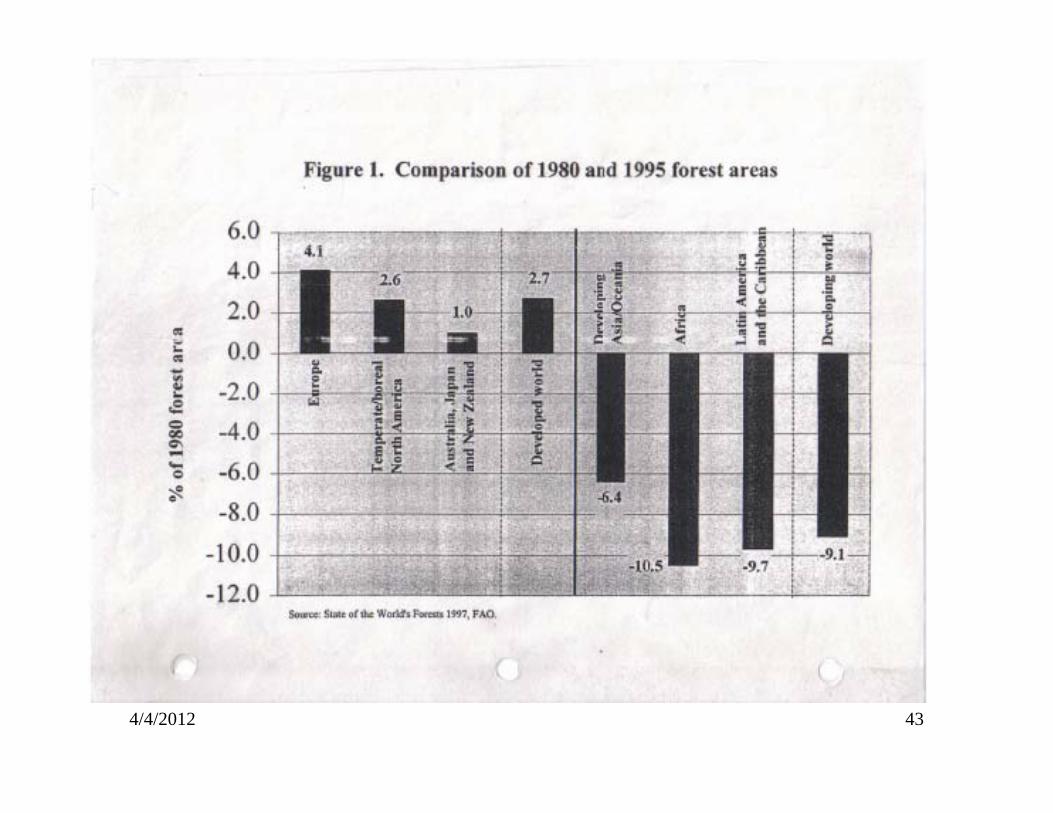
Current deforestation trends: slower, reversal in some areasKauppi, et al, article.
Authors examine forest biomass, not just forest area
Identify transitions in many countries where area and biomass are expanding.
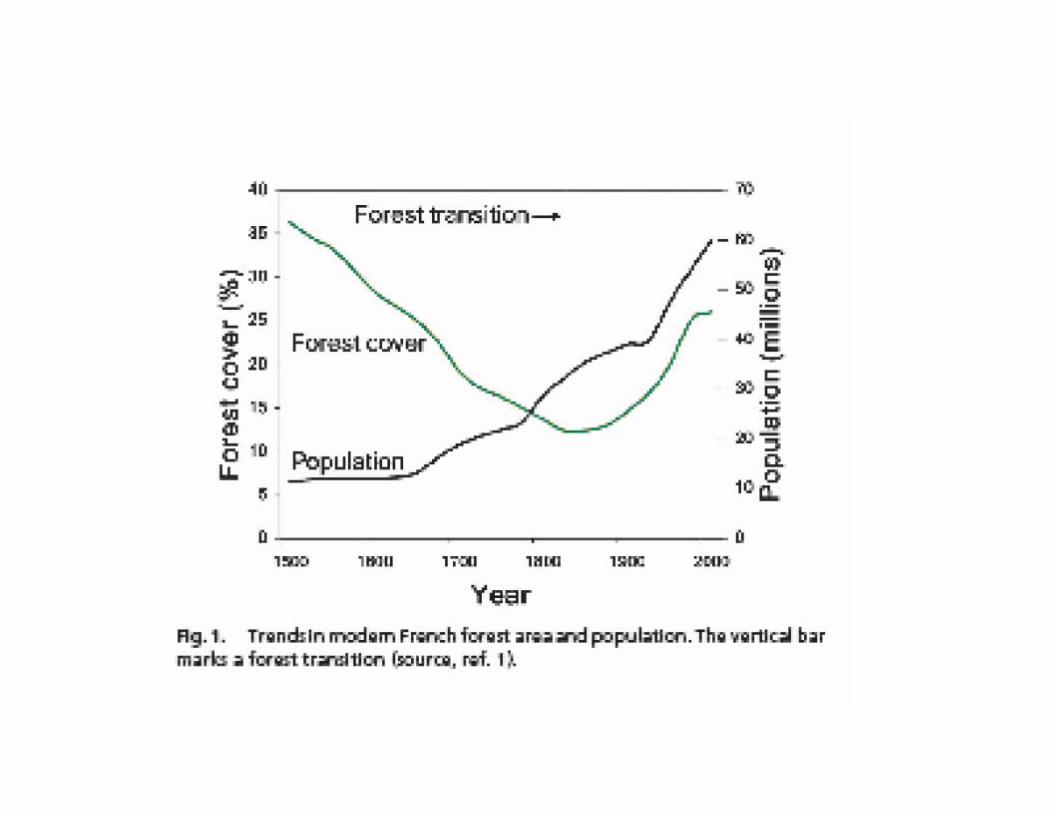
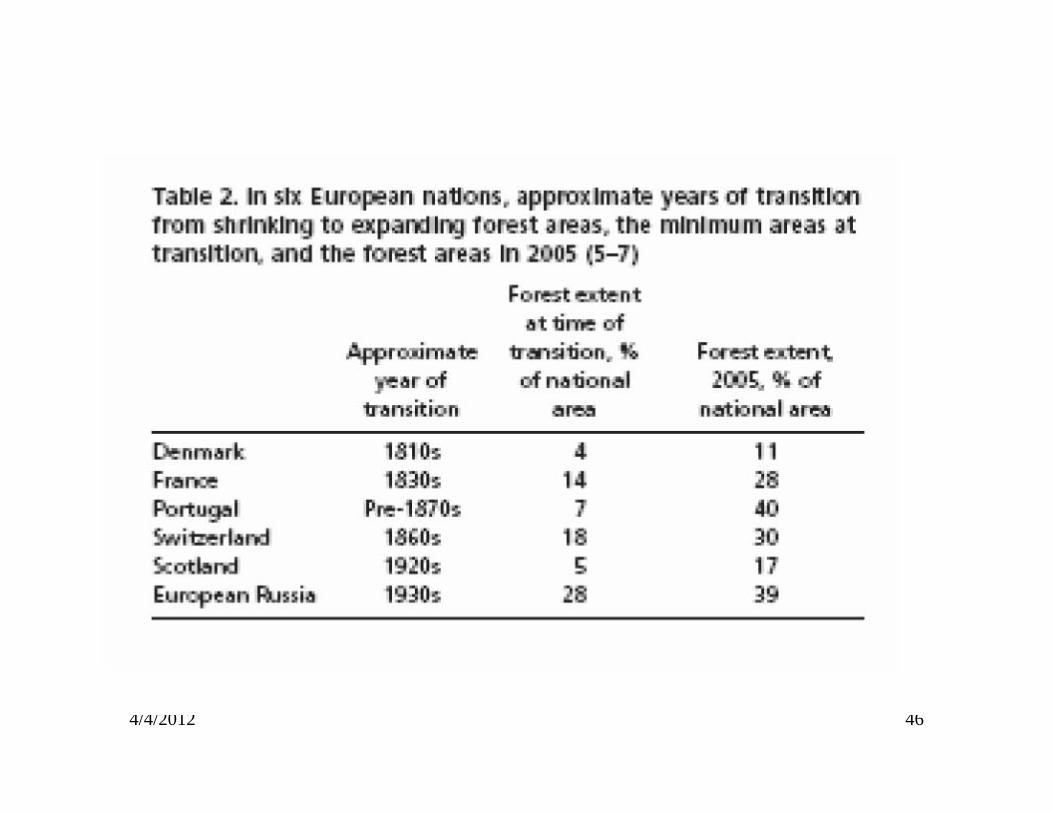
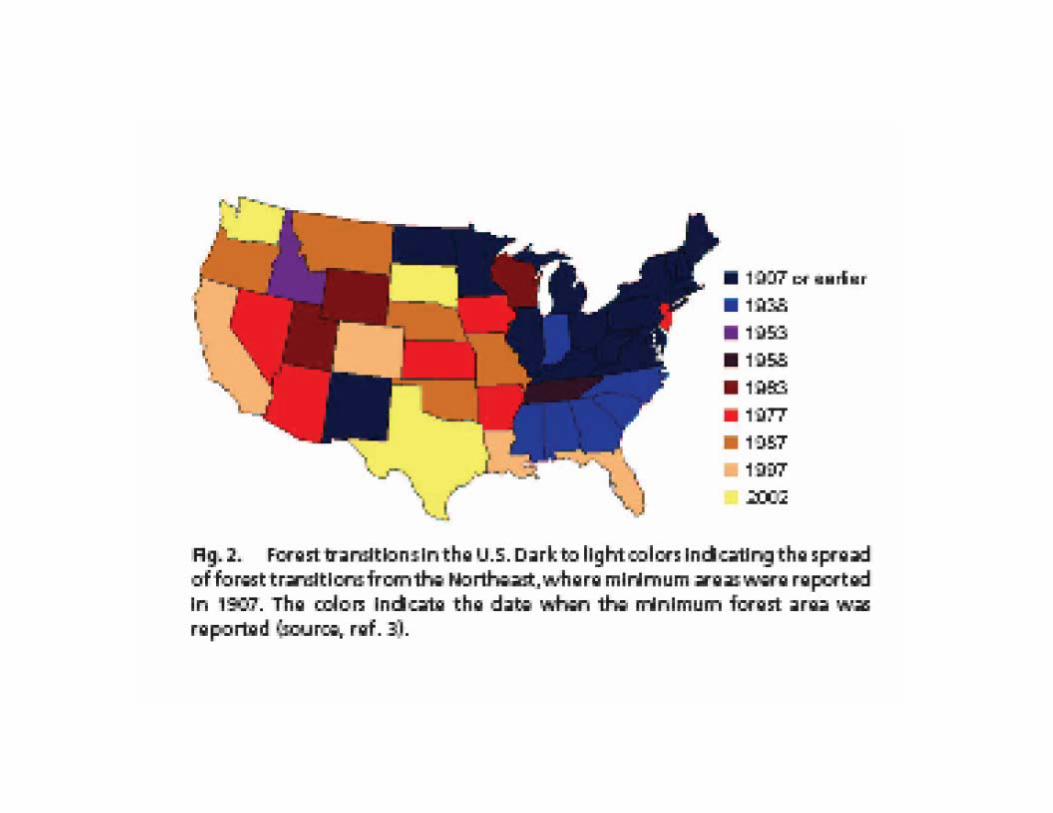
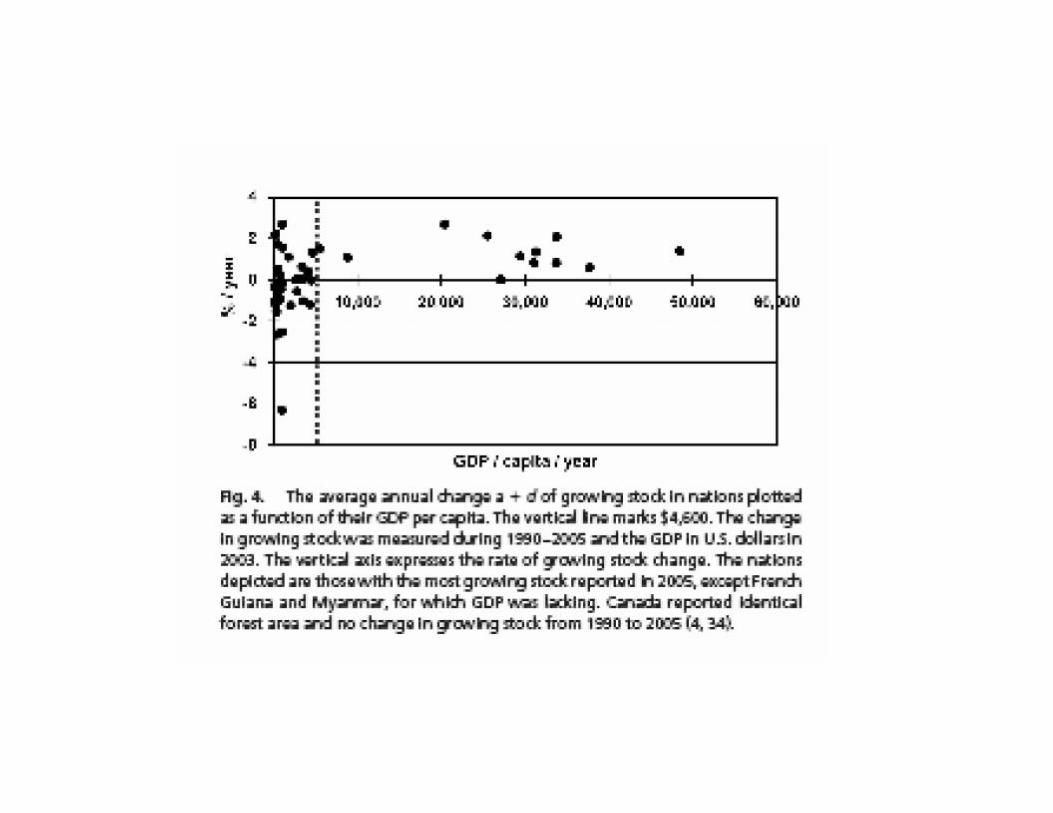
Topics:• Changes in forest area in developing vs. developed countries• Computing changes in volume and biomass of forests• Dates when forest area begins increasing in European countries• Transitions in US.• Change in forest volume vs. income
4/4/2012 43
4/4/2012 44
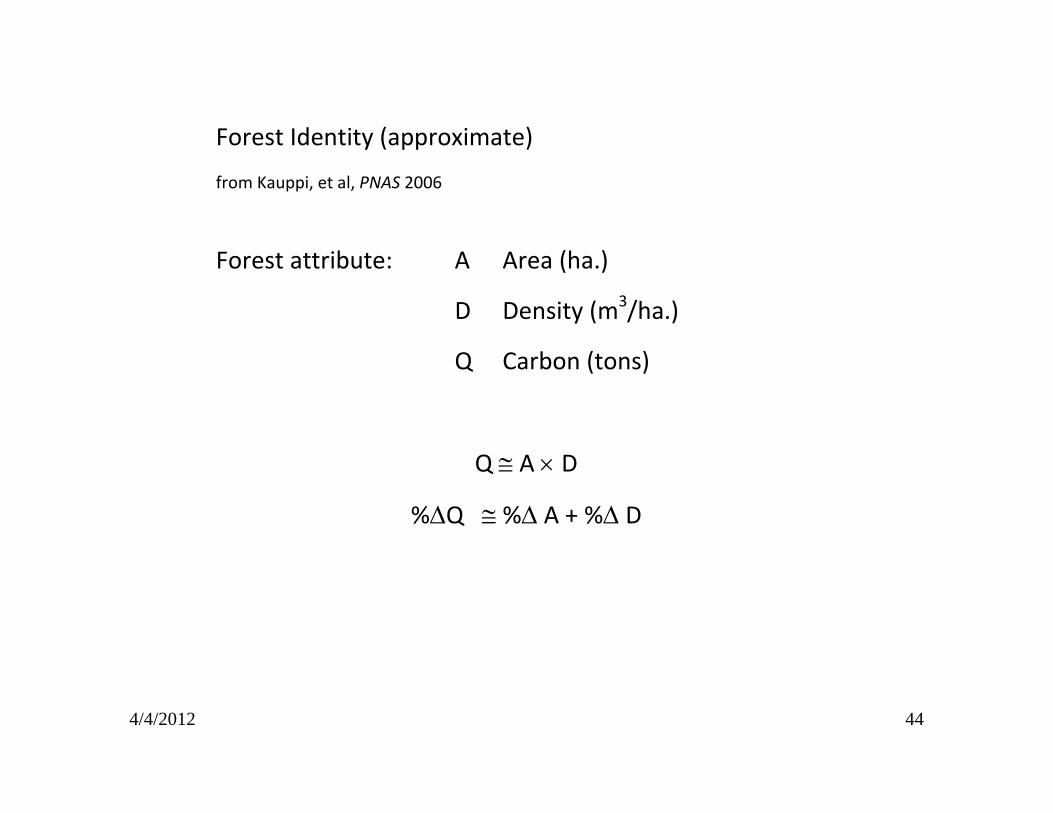
Forest Identity (approximate)
from Kauppi, et al, PNAS 2006
Forest attribute: A Area (ha.)
D Density (m3/ha.)
Q Carbon (tons)
Q A D
%Q % A + % D
4/4/2012 45
4/4/2012 46
4/4/2012 47
4/4/2012 48
4/4/2012 49
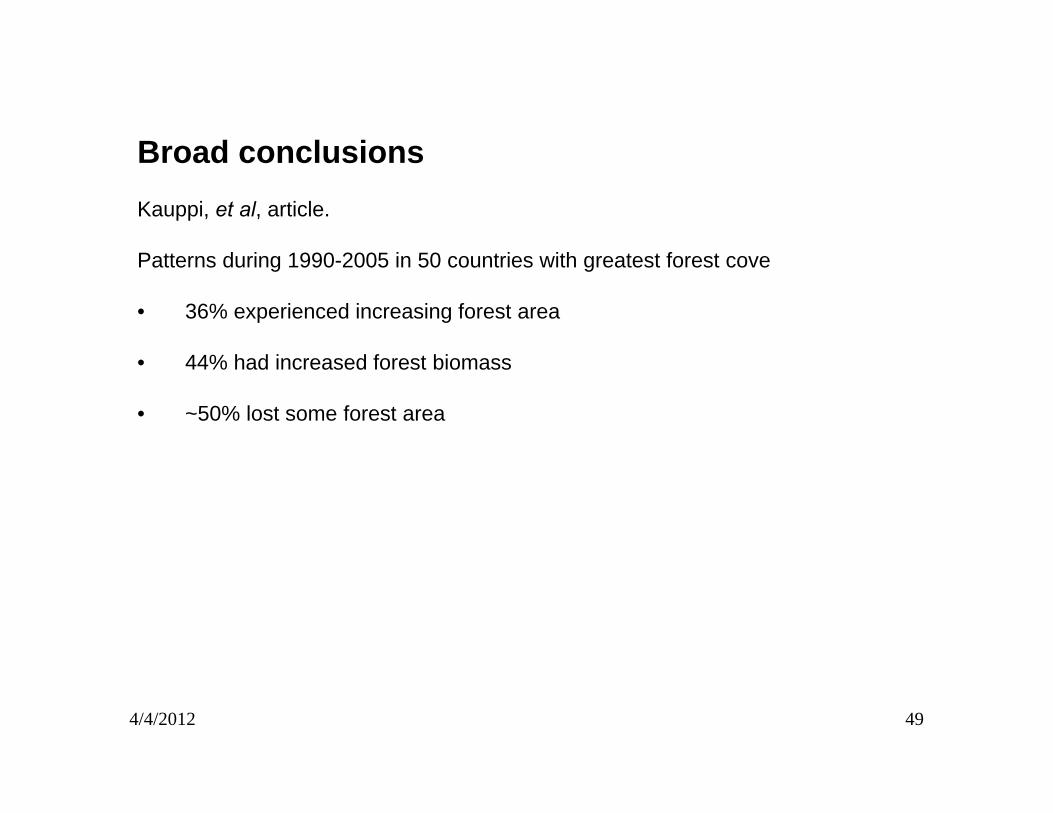
Broad conclusionsKauppi, et al, article.
Patterns during 1990-2005 in 50 countries with greatest forest cove
• 36% experienced increasing forest area
• 44% had increased forest biomass
• ~50% lost some forest area
4/4/2012 50
A National and International Analysis of Changing Forest Cover
Rautiainen, et al, PLoS ONE 2011.
Examine changes in forestland area and density
Focus on US pattern 1953-2007
Present information on other countries
4/4/2012 51
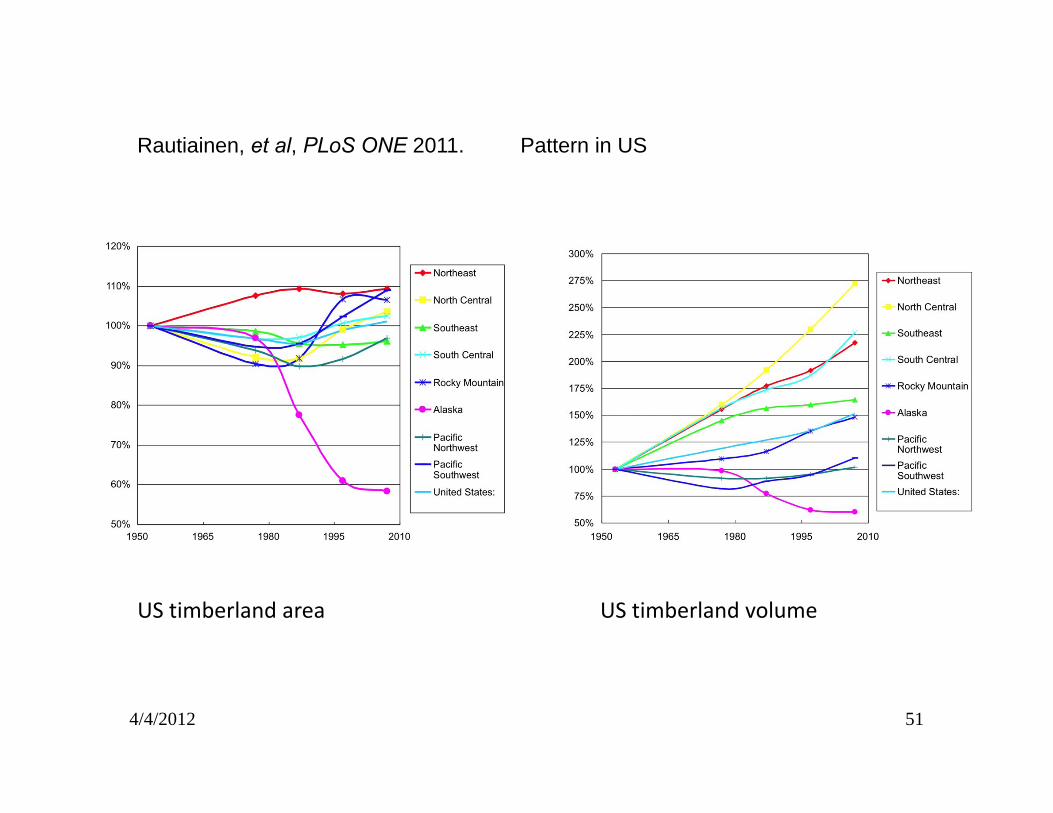
Rautiainen, et al, PLoS ONE 2011. Pattern in US
US timberland area US timberland volume
4/4/2012 52
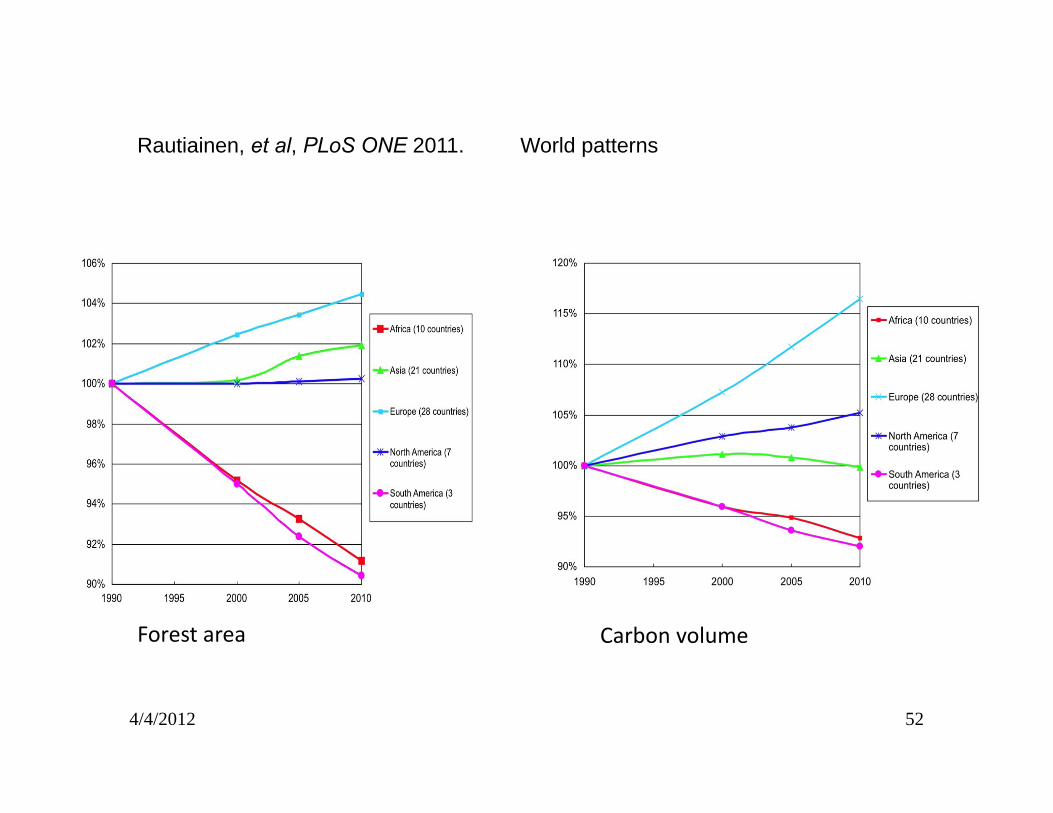
Rautiainen, et al, PLoS ONE 2011. World patterns
Forest area Carbon volume
4/4/2012 53
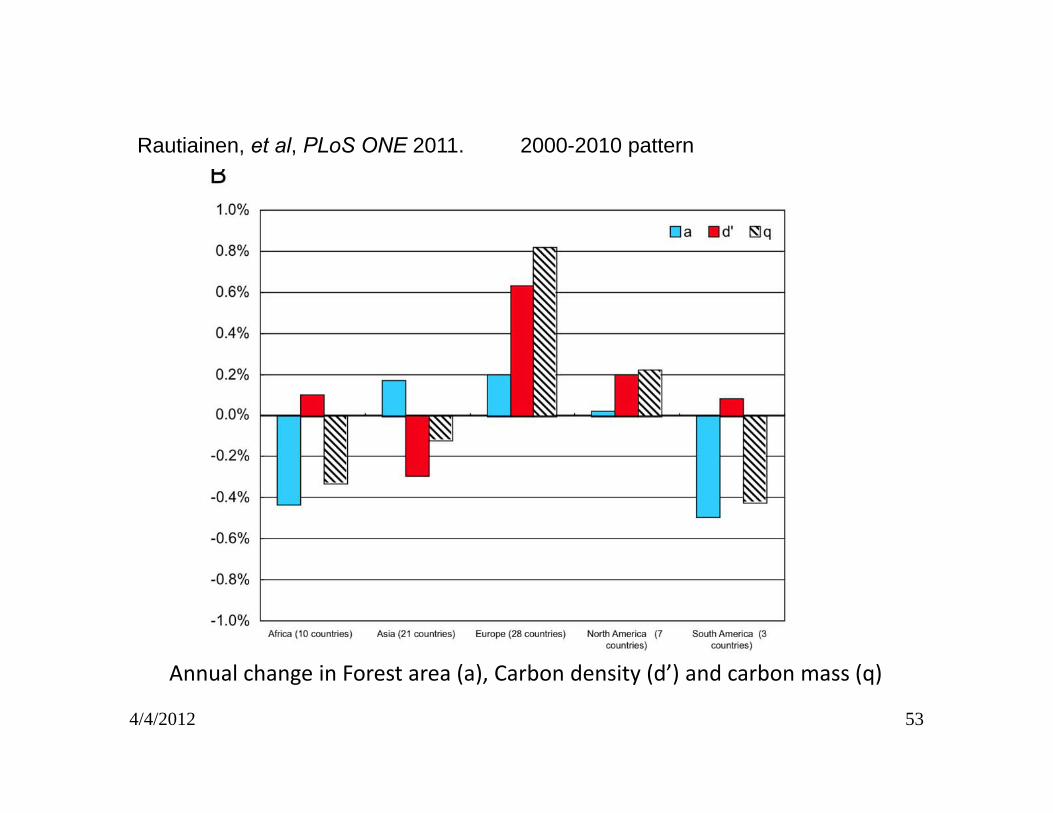
Rautiainen, et al, PLoS ONE 2011. 2000-2010 pattern
Annual change in Forest area (a), Carbon density (d’) and carbon mass (q)
Carbon volume
4/4/2012 54
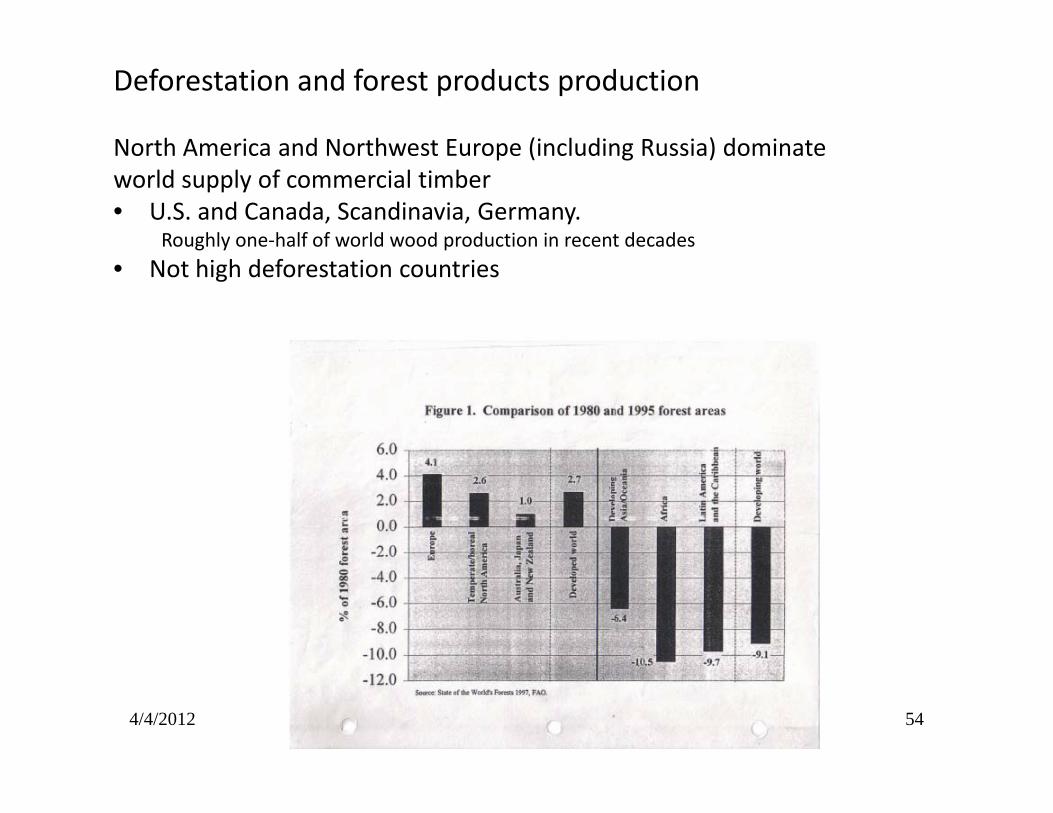
Deforestation and forest products production
North America and Northwest Europe (including Russia) dominate world supply of commercial timber• U.S. and Canada, Scandinavia, Germany.
Roughly one‐half of world wood production in recent decades• Not high deforestation countries
4/4/2012 55
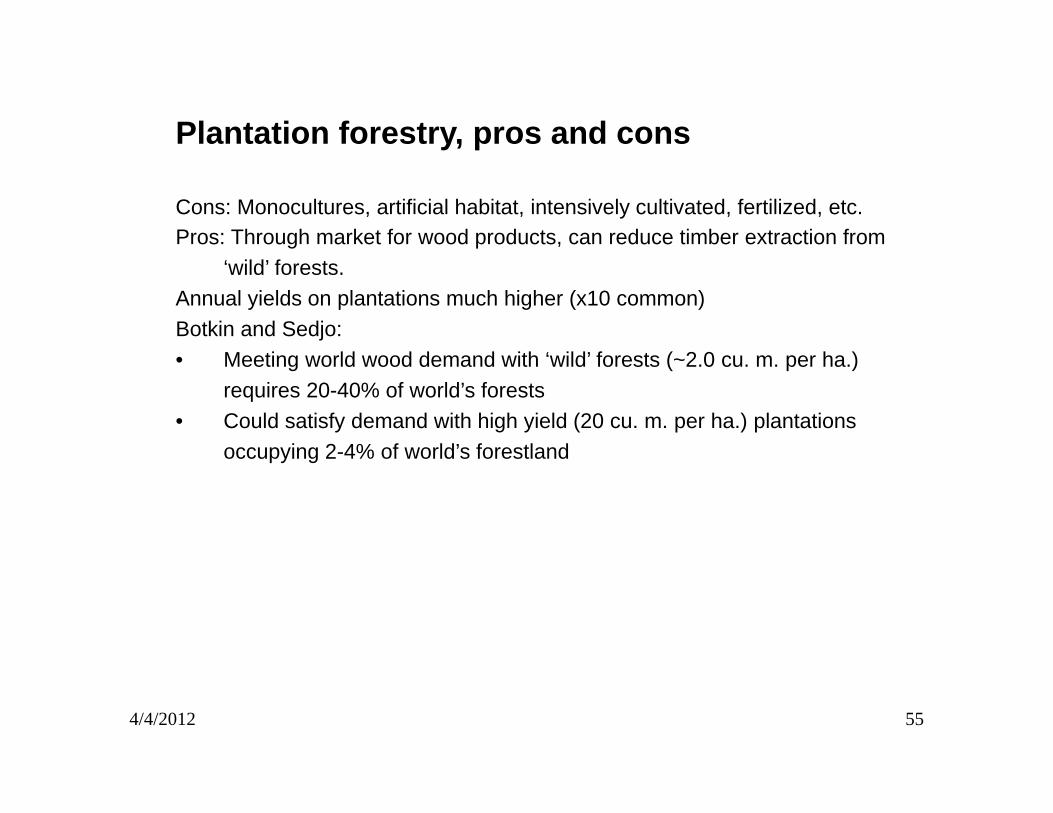
Plantation forestry, pros and cons
Cons: Monocultures, artificial habitat, intensively cultivated, fertilized, etc.Pros: Through market for wood products, can reduce timber extraction from
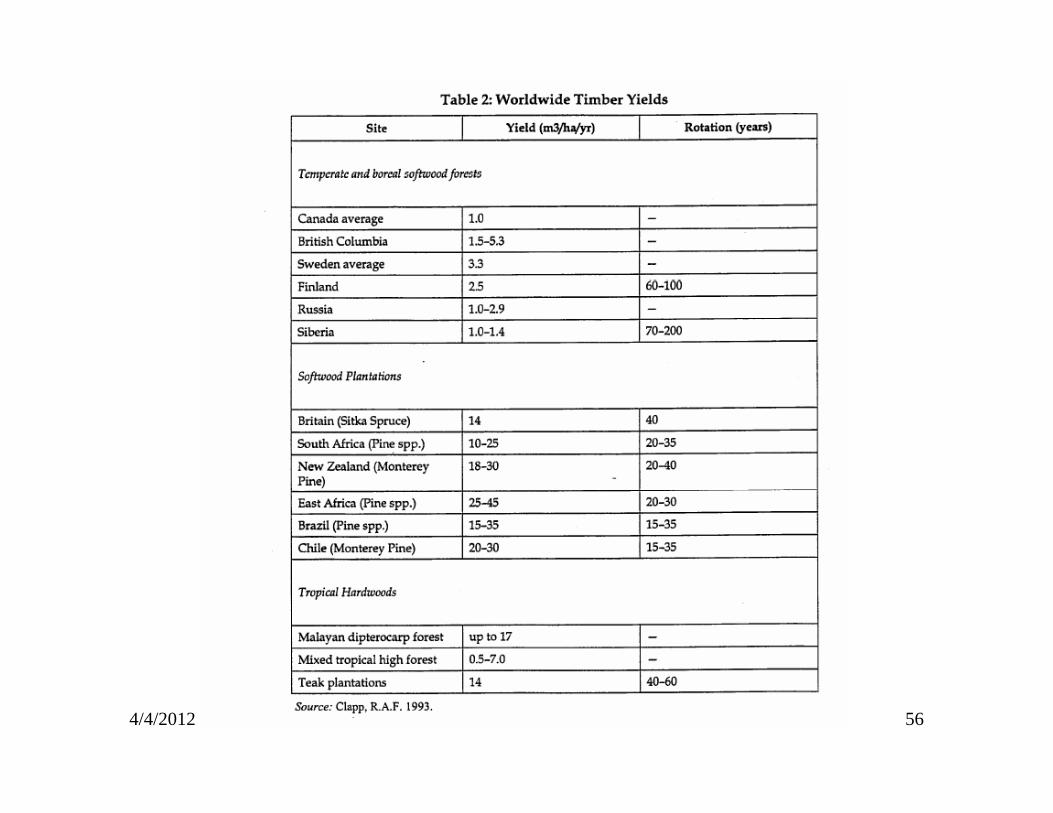
‘wild’ forests.Annual yields on plantations much higher (x10 common)Botkin and Sedjo:• Meeting world wood demand with ‘wild’ forests (~2.0 cu. m. per ha.)
requires 20-40% of world’s forests• Could satisfy demand with high yield (20 cu. m. per ha.) plantations
occupying 2-4% of world’s forestland
4/4/2012 56
4/4/2012 57
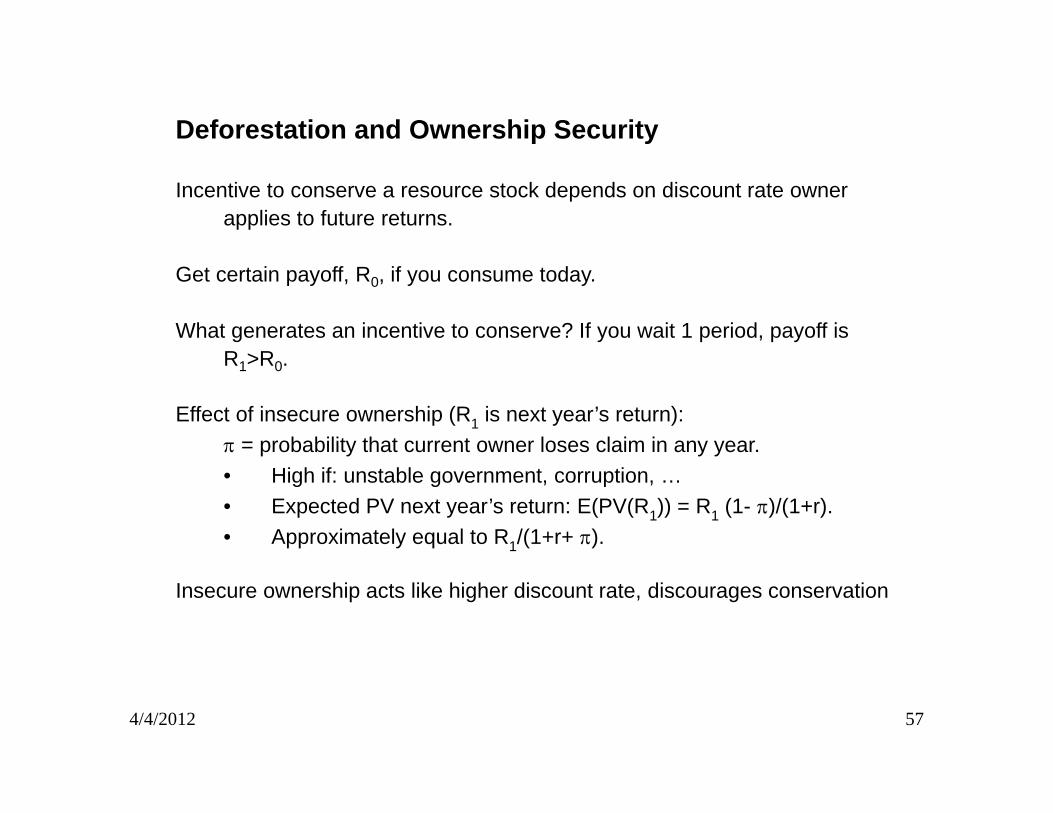
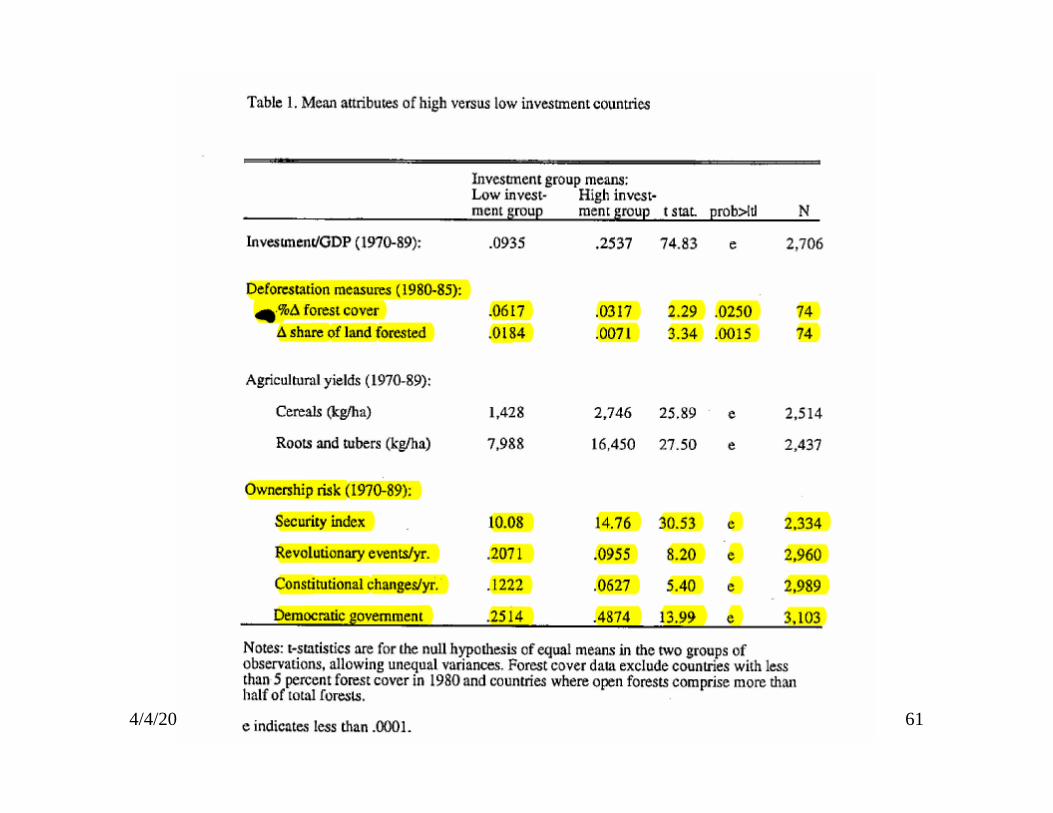
Deforestation and Ownership Security
Incentive to conserve a resource stock depends on discount rate owner applies to future returns.
Get certain payoff, R0, if you consume today.
What generates an incentive to conserve? If you wait 1 period, payoff is R1>R0.
Effect of insecure ownership (R1 is next year’s return): = probability that current owner loses claim in any year. • High if: unstable government, corruption, …• Expected PV next year’s return: E(PV(R1)) = R1 (1- )/(1+r).• Approximately equal to R1/(1+r+ ).
Insecure ownership acts like higher discount rate, discourages conservation
4/4/2012 58
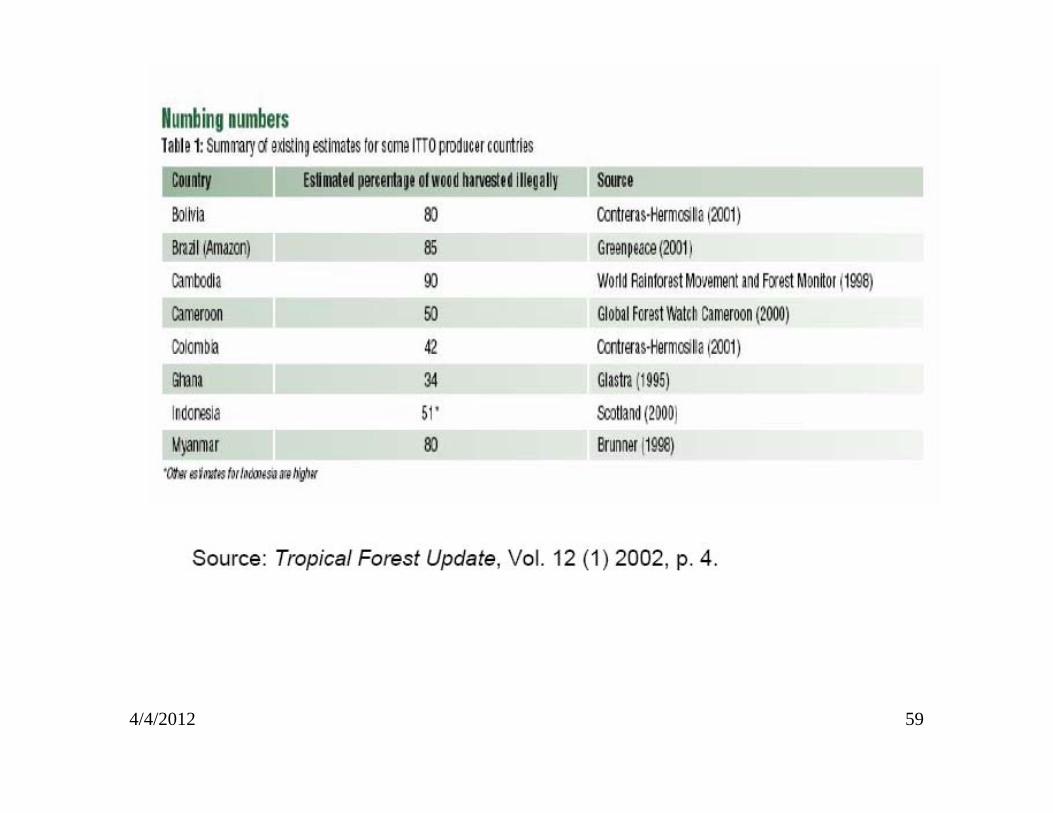
4/4/2012 59
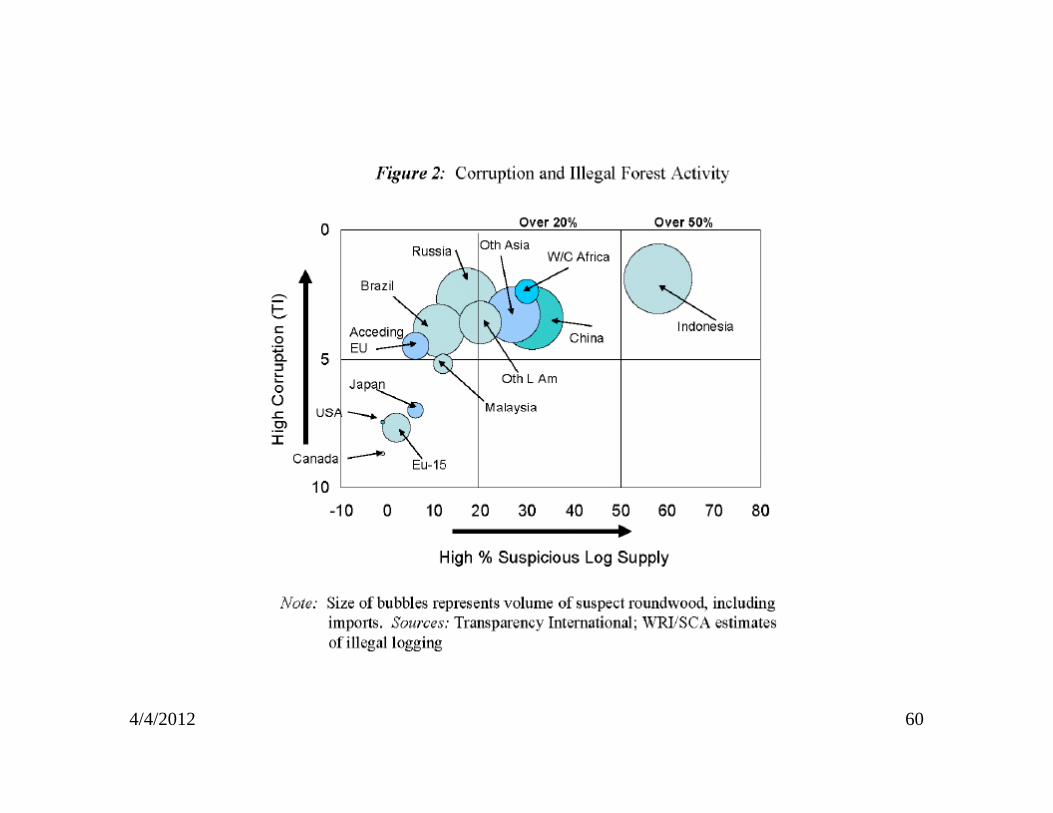
4/4/2012 60
4/4/2012 61