Embed Size (px)
Citation preview

1
Foreign Ownership and Corporate IncomeTaxation: An Empirical Evaluation
Harry Huizinga*
European Commission, Tilburg University and CEPR
and
Gaëtan Nicodème*
European Commission and Solvay Business School (ULB)
February 2003
Abstract: Economic integration in Europe has not led to a �race to the bottom�regarding corporate income taxes. Corporate income tax revenues as a share of GDPhave in fact remained rather stable, even if the share of corporate income taxes inoverall tax revenues has declined. This paper documents trends in the foreignownership of companies in Europe and it examines whether foreign ownership exertsa positive influence on corporate income tax levels. Using company-level data, wedocument that the foreign ownership share in Europe stood at around 26 percent in theyear 2000. The estimation suggests that a one-percentage point increase in foreignownership increases the average corporate income tax burden by slightly more than 1percent. Further international economic integration is likely to lead to higher foreignownership shares with a concomitant positive influence on corporate taxation levels.
Keywords: foreign ownership, corporate taxation, tax competition
JEL Classification Numbers: F21, H25
* The findings, interpretations, and conclusions expressed in this paper are entirely those of theauthors. They should not be attributed to the European Commission. We thank Ramiro Gomez Villalbafor technical assistance.

2
1. Introduction
Over the last two decades, industrialized countries have eliminated most
remaining capital controls and restrictions on the activities of multinational firms. The
EU specifically had abolished all restrictions on capital outflows by 1992, while
common market principles guarantee EU firms the right of establishment in every
Member State. The EU similarly imposes few restrictions on the activities of firms
from third countries. Economic integration in principle makes national tax policies
interdependent. This realization underlies an already substantial literature on
international tax competition. While tax policies may indeed be interdependent, this
has so far not led to a �race to the bottom� in the area of corporate income taxes. In
fact, Devereux, Griffith and Klemm (2002) document that corporate tax revenues as a
percentage of GDP have been rather stable at around 2.5 percent for EU Member
States and the G7. Corporate tax revenues, however, have declined as a share of total
tax revenues. These outcomes reflect that recent tax reforms in Europe have led to
only slight reductions in average or effective corporate income tax rates, even if top
statutory rates have been in decline.
Economic integration is expected to exert downward pressure on corporate tax
rates insofar as it renders the international location of productive capital more
responsive to national tax policies. Economic integration, however, is accompanied by
increased levels of foreign direct investment (FDI) and international portfolio
investment in corporate shares. Increased foreign ownership per se provides countries
with the incentive to increase corporate tax levels, as it introduces the possibility of
corporate tax exportation (see Mintz (1994) and Huizinga and Nielsen (1997)). The
share of FDI in total investment in Europe has indeed increased rapidly in the last
decade (see, for instance, Wildasin (2000), Table 3). The share of foreign assets in
European portfolios has correspondingly been on the rise in the run-up to EMU, as
documented by Adjaouté et al (2000) and also by European Commission (2001b).1
The purpose of this paper is to present evidence on the level of
internationalization of corporate sectors in Europe in recent years, and to investigate
whether this internationalization is in fact a reason that corporate taxes have remained
relatively high. From the Amadeus database, we compile information on the foreign
1 European Commission (2001b, p. 153) shows that foreign financial assets exceed 25 percent of totalfinancial assets in Belgium, the Netherlands, Spain and the United Kingdom out of the 12 memberstates for which data are available.

3
ownership for 31 European countries over the 1996-2000 period. For 2000, we have
full ownership information on around 14,000 firms. To expand our sample, we
alternatively consider foreign firms to be at least 50 percent foreign owned, and
domestic firms to be more than 50 percent domestically owned. This allows us to
trace the foreign or domestic ownership of about 26,500 European firms in the year
2000. Depending on the exact definition of a foreign ownership, we find that the
asset-weighted foreign ownership share in Europe is in the 23-26 range for the year
2000. For Western Europe, estimates are in the 18-19 percent range, while they are
between 35 and 39 percent for Eastern Europe.
Our empirical analysis suggests that corporate tax levels are positively related
to country-level foreign ownership shares. Moreover, our estimates indicate that the
effect is economically significant. An increase in foreign ownership by one
percentage point, specifically, is estimated to increase the tax burden as a percent of
assets by 0.027, which is about 1 percent of the average value of this measure of the
tax burden. The positive relationship between the corporate tax burden and foreign
ownership is found to persist, if we split the sample by year or by economic sector.
Robustness checks indicate that the positive empirical relationship between foreign
ownership and the tax burden primarily reflects cross-country variation in the data
rather than variation over time during the 1996-2000 period. Also, the relationship is
stronger for the Western Europe separately than for the entire European sample.
In the remainder, section two first discusses some of the previous theoretical
and empirical literature on the relationship between foreign ownership and taxation.
Section three discusses the foreign ownership data used in this study. Section four
discusses the estimation framework and section five presents the estimation results.
Section six concludes.
2. Previous literature
A small open economy optimally does not tax internationally mobile capital
(see, for instance, Gordon (1986)). The reason is that the incidence of a capital tax
will be on immobile factors of production such as labor. It is then better to tax labor
directly, as this leaves the capital input decision undistorted. The corporate income tax
in practice taxes mobile capital as well as residual profits. In the absence of a separate
profit tax, the corporate income tax then can be rationalized as a crude way of taxing
profits. Foreign ownership implies that part of a company�s profit stream accrues to

4
foreign residents. The corporate income tax thus can serve to shift some income away
from foreign residents to the domestic treasury or ultimately domestic residents.
Huizinga and Nielsen (1997) show that a higher foreign ownership share will
generally rationalize higher source-based capital income taxes (such as the corporate
income tax) combined with lower residence-based capital income taxes.
In a multi-country world, foreign ownership will generally increase the level
of capital income taxation that materializes in the absence of international tax policy
coordination. Foreign ownership therefore affects whether countries can increase their
welfare by coordinating their tax policies and if so, whether coordination requires
increases or reductions in overall capital income tax levels. Huizinga and Nielsen
(2002), for instance, show that a high degree of foreign ownership may obviate the
need to increase source-based capital income taxes through coordination in a world
where the evasion of residence-based capital income taxes would otherwise justify
such coordination.
Sorensen (2000) examines the scope for international tax policy coordination
with the aid of a simulation model characterized by partial foreign ownership and an
absence of residence-based capital income taxes.2 The model specifically considers
regional capital income tax coordination among EU countries in a model consisting of
four European �regions� and the US. In the benchmark calibration, the four European
regions have a foreign ownership share of 25 percent. Regional coordination in
Europe increases the average capital income tax from 33.8 percent to 46.5 percent.
Sensitivity analysis reveals that putting the foreign ownership share to zero has the
effect of reducing the uncoordinated and coordinated capital income taxes to 23.0 and
41.0 percent, respectively. Higher foreign ownership shares beyond 25 percent,
conceivably in the 50-60 percent range, may well imply that tax coordination in
Europe implies increasing capital income taxes, although Sorensen (2000) does not
provide calculations on this.
Empirical work on the relationship between foreign ownership and capital
income taxation has so far mostly focused on whether foreign-owned firms pay higher
or lower taxes than domestically-owned firms, rather than on the impact of macro-
2 In Sorensen (2000) firms are atomistic. Hence firms are too small to be able to change the taxes theyface by changing their degree of foreign ownership through, for instance divestment to domesticowners. Olsen and Osmundsen (2001) instead assume that a multinational firm can affect the taxcompetition between two countries competing for the multinational�s investments by changes in itsinternational ownership.

5
level foreign ownership on the overall tax burden. Specifically, Grubert, Goodspeed,
and Swenson (1993) find that foreign-controlled U.S. corporations pay lower U.S.
taxes than purely domestic firms on the basis of tax-return data. About half of the
observed difference in taxes paid can be explained by observable factors such as
exchange rate fluctuations, firm size and firm age. The remaining half is attributed to
unobservable factors such as a lower accounting profitability following the
manipulation of international transfer prices or lower �true� profitability due to lower
productivity.
Demirgüç-Kunt and Huizinga (2001), further, examine the taxes paid by
domestic and foreign banks in 80 countries during the 1988-1995 period using firm-
level accounting information. On average, foreign banks pay higher taxes than
domestic banks in lower-income countries, while they pay about equal taxes in
higher-income countries. Foreign banks, however, are found to pay lower taxes than
domestic banks in many individual industrialized countries (among them the U.K. and
the U.S.) after controlling for firm characteristics.3
In an attempt to shed further light on why foreign firms may pay lower taxes
in the U.S., Kinney and Lawrence (2000) compare the taxes paid by U.S. firms taken
over by foreign firms and other domestic U.S. firms, respectively, during the 1975-
1989 period. The firms taken over by foreign firms are shown to pay relatively low
taxes. This difference, however, is explained by the fact that foreigners tend to take
over U.S. targets that are less profitable than their industry counterparts, and hence it
is not attributed to income manipulation by foreign firms.
So far, little evidence exists on the potential relationship between macro-level
foreign ownership and the overall corporate tax burden (for foreign and domestic
firms alike). Using data for U.S. states, Eijffinger and Wagner (2001) relate the
average corporate tax rate paid to the real productive assets of foreign owned affiliates
(defined to be at least 10 percent foreign owned) as a measure of foreign ownership.
In the absence of data on aggregate state-level real productive assets, these authors
include statewide corporate income or employment as scaling variables in their
empirical specification. Also, the authors fail to include firm-level or industry-level
3 See Demirgüç-Kunt and Huizinga (2001, Table 5). These patterns again can reflect transfer pricingand differences in underlying productivity. The further finding that reported profitability rises with thestatutory tax rate only for domestic bank is interpreted as evidence that foreign banks are engaged ininternational profit shifting.

6
controls in their analysis. All the same, they report a positive relationship between the
average corporate tax rate and the real productive assets of foreign affiliates in support
of the hypothesis that corporate tax levels increase with the level of foreign
ownership.
3. The data
The main data source used in this study is the Amadeus database that provides
balance sheets and income statements for European firms in 34 countries. Amadeus
also contains detailed information on main shareholders including their nationality
(see Appendix A for further details on Amadeus). This allows us to account for the
domestic and foreign ownership of all shares for about 14,000 European firms in the
year 2000.4 For a larger number of about 26,500 firms, we have sufficient ownership
information to determine whether the firm is in majority domestically or foreign
owned. Firms with complete or nearly complete ownership information tend to be
firms with relatively few shareholders. This implies that our data reflect relatively few
publicly traded firms.5
For firms with full ownership information, we denote fs to be the share of
foreign ownership. Using these firm-level foreign ownership shares, we construct FS1
as the equal-weighted foreign ownership share at the country level, while FS2 is the
asset-weighted national foreign ownership share. Clearly, country-level foreign
ownership shares are only meaningful if they are based on a sufficiently large sample.
As a cut-off point, we only construct FS1 and FS2 measures, if they can be based on
at least 35 firms for a given country in a given year.
Alternatively, we construct a foreign ownership dummy, denoted fd. This
dummy takes on a value of 1 in case 50 percent or more of the shares are foreign
owned, while it takes on a value of 0 if more than 50 percent of the shares are
domestically owned. On the basis of this firm-level fd variable, we can again construct
two separate foreign ownership measures at the country level. First, FS3 is the share
4 Faccio and Lang (2002) do not focus on the nationality of ownership but instead on the type ofownership of European firms. These authors distinguish firms that are primarily family-owned, stateowned or with widely held shares.5 Unlisted firms in the aggregate may be as important as listed firms. This reflects that listed firms arerelatively few, even if they tend to be large on average. In the case of Belgium, for instance,Timmermans (2000) estimates that non listed firms represent 56 percent of the value of all equity. Ourempirical estimation is based on samples that underweight publicly traded firms, but still containsignificant numbers of these. See Appendix B for details.

7
of firms designated as foreign in the total, while FS4 is calculated as the share of the
assets of foreign firms in total assets. Again, each of the variables FS3 and FS4 is only
constructed for a given country in a given year, if it can be based on at least 35 firms.
Table (1) provides information on FS1 and FS2. For 2000, we see that the
average values of FS1 and FS2 in Europe were 26.1 and 25.9 percent, respectively.
For 2000, foreign ownership in the EU and in Western Europe (the EU plus Iceland,
Norway and Switzerland) is lower than in Eastern Europe. The average FS2, for
instance, is 19.2 percent in Western Europe and 39.2 percent in Eastern Europe.
Average figures for the 1996-2000 period are also provided. The average FS2 for
2000 in Europe (at 25.9 percent) is higher than the average for the 1996-2000 period
(at 24.0 percent), reflecting an overall increase in foreign ownership. Foreign
ownership in Eastern Europe has risen, while it appears to have decreased slightly in
Western Europe. Finally, the table indicates the changes in the FS1 and FS2 variables
between 1996 and 2000. These changes, computed for 15 countries, indicate an
increase in the foreign ownership share FS2 of 3.3 percent for Europe as a whole
between 1996 and 2000.
Table (2) provides information on FS3 and FS4. For 2000, information is now
also available for Lithuania and Switzerland. The data for these two additional
countries pull down the average European foreign ownership somewhat. Also, the
averages for FS3 and FS4 are pulled down, as apparently firms for which we have
information on majority foreign or domestic ownership tend to be less foreign owned
than firms for which we have full information on the internationalization of
ownership. On account of this, the European average of FS4 at 23.8 percent is about
two percentage points below the average for FS2 of 25.9. The average of FS4 for
Eastern Europe is even pulled down from 39.2 percent to 34.8 percent. The overall
trend in FS3 and FS4 over the 1996-2000 again is positive due to increases in foreign
ownership in Eastern Europe.6
6 It is interesting to compare our foreign ownership estimates with other available evidence. ForBelgium, Timmermans (2000, Table 2) reports estimates by the Bank of Belgium of the value-weightedforeign ownership of shares for 1998 as follows: 30.5 percent for listed shares, 28.0 percent for unlistedshares and 29.1 percent for the total. Our estimates for Belgium are 44.6 percent for FS2 and 27.1percent for FS4. Dahlquist and Robertsson (2001, Table 1) provide estimates of the equal-weighted andvalue-weighted foreign ownership of listed shares in Sweden for 1997 of 19.7 and 32.4 percent,respectively. Our estimates are 13.2 percent for FS1, 5.4 percent for FS2, 13.4 percent for FS3 and 4.9percent for FS4. Our numbers mostly reflect unlisted shares and are clearly much lower. Finally,Bøhren, Øyvind and Benrt Arne Ødegaard (2000, Table 4) report that the value-weighted foreignownership of listed shares in Norway in 1997 stood at 32 percent, in contrast to our estimates of 17.1

8
Variation in aggregate foreign ownership measures over time reflects changes
in the foreign ownership of specific firms and changes in the sample of firms. As
shown in Appendix C, changes in foreign ownership for given firms tend to be
relatively small. This suggests that changes in aggregate foreign ownership mostly
reflect corporate changes such as the establishment of new firms and mergers and
acquisitions.
The four measures of foreign ownership FS1 through FS4 are highly
correlated as indicated in Table (3). Part A provides the correlations of the foreign
ownership measures as computed per country and per year, while Part B gives the
correlations of country-level measures, where these country-level measures are
averages of annual averages per country. As seen in the table, FS1 and FS3
particularly are highly correlated, and the same goes for FS2 and FS4. This suggests
that aggregate foreign ownership measures based on majority domestic or foreign
ownership are very similar to those based on the exact foreign ownership share.
Our tax burden measure is accrued taxes as a percent of assets.7 In Figure (1),
we plot the average tax burden over 1996-2000 per country against the four aggregate
foreign ownership measures FS1 through FS4. Countries in Eastern and Western
Europe are marked differently. Parts A and B of the figure point at a positive
relationship between the tax burden and FS1 and FS2, at least for Western Europe.
Hungary and Bulgaria are distinct outliers with relatively high and low foreign
ownership, respectively. Parts C and D of the figure in addition plot the tax burden
against the FS3 and FS4 measures, with the advantage of data for several additional
countries. The figure again displays an apparently positive relationship between the
tax burden and foreign ownership for Western Europe, even if Luxembourg appears to
have relatively high foreign ownership (or a relatively low tax burden). There also is a
�cluster� of Eastern European countries, consisting of the Czech Republic, Latvia, and
Hungary, with relatively high foreign ownership (or low tax burdens). At the other
extreme, Bulgaria continues to show low foreign ownership with a high tax burden.
percent for FS2 and 19.5 percent for FS4. Again our numbers reflect mostly unlisted shares and arelower. Eurostat (2001) reports on the share of value-added for 1998 for Denmark, Spain, Netherlands,Finland, Sweden and the UK, with an average foreign share of 12.3 percent for these countries.Eurostat only counts majority-owned foreign enterprises (with a single owner or group of ownershaving more than 50 percent of the shares), which can explain the rather low figure. Data in theEurostat study reflect selected service industries only.7 We measure taxes relative to assets rather than some measure of income or profits, as these lattervariables are more easily distorted through international profit shifting.

9
The different data points for Eastern European countries in part reflect
different macroeconomic environments. In subsequent empirical work, we try to
control for this by, for instance, including absolute and per capita GDP as explanatory
variables. The relatively low values of these variables for Eastern European countries
can in part explain the relatively low tax burdens. All the same, differences between
Eastern and Western Europe no doubt reflect different recent economic histories that
are not so easily quantified in a regression framework. Specifically, large-scale
privatisation in the early 1990s and the need to import superior foreign technologies
catapulted these countries to high foreign ownership levels rather quickly. Eastern
European tax burdens, however, continue to be low according to Western European
standards, perhaps because a relatively poor infrastructure or the perceived riskiness
of investments in Eastern Europe force tax administrators to keep tax levels low.
Ten Eastern European countries are set to join the EU in 2004. This next phase
in the economic transition of Eastern Europe will presumably reduce the perceived
riskiness of investments in the accession countries. More generally, economic
conditions in Eastern and Western Europe will become more similar, and the
relationship between foreign ownership and the tax burden in Eastern Europe may
approach the one in Western Europe. For now, the data, however, appear to reflect the
transition process rather than a stable, long run relationship. To account for this, we
consider the group of Western European countries separately in some of the
subsequent empirical work.
From Amadeus, we also construct several variables � using company balance
sheets - that can be expected to affect the tax burden. First, the log of total assets
serves as an indicator of firm size. Second, fixed assets, short-term debt and long-term
debt (all as shares of total assets) can be expected to matter. Amadeus also provides a
sector code for each company in the form of the 3-digit NACE classification. On the
basis of this coding, we construct 8 sectoral indices. The eight sectors are: agriculture,
construction, financial services, manufacturing, retail and wholesale, transport,
utilities and other. In addition to data derived from Amadeus, this study uses data on
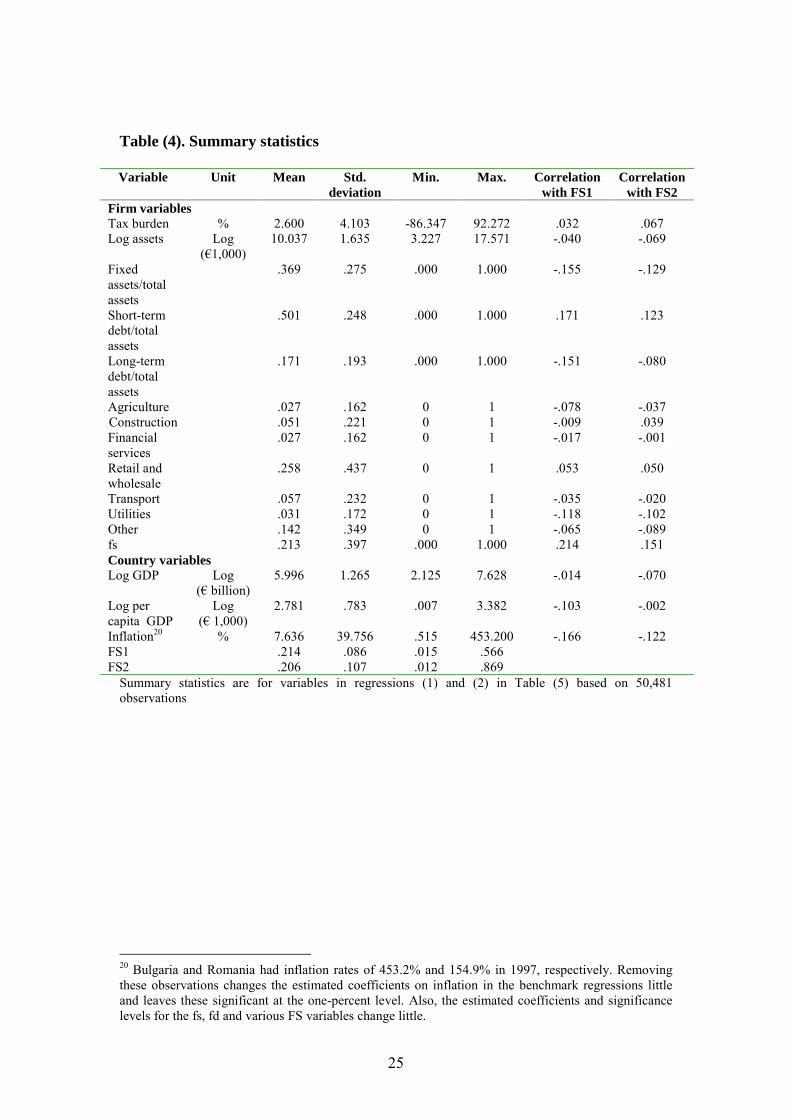
several standard macroeconomic variables. Summary statistics on all the variables
used in the empirical work are provided in Table (4). The table indicates that the
correlations between the ownership variables FS1 and FS2 with other macro-level
variables are quite low. Appendix A provides full information about data sources, data
construction and definitions, and the building of the sample.

10
4. The estimation
The estimation relates the tax burden of European firms to a range of firm-
level and country-level variables. Firm-level and aggregate foreign ownership
variables serve as explanatory variables. In addition, there is a range of firm-level and
macroeconomic controls. The benchmark specification can be written as follows:
Tax ijtjtjitit
ttjtjijtiijt FfTZXburden εγγβββα ++++++= �
where i, j and t denote the firm, the country, and the year and the variables are defined
as:
• Tax burdenijt is taxes accrued as a share of assets,
• Xijt is a range of firm-level controls (several variables derived from balance
sheet data as well as sector fixed effects),
• Zjt is a range of country-level controls (log of GDP, log of per capita GDP and
inflation),
• Tt is a vector of time fixed effects,
• fit is a variable denoting firm-level foreign ownership,
• Fjt is a variable denoting country-level foreign ownership,
• εijt is a random error,
• β is a vector of coefficients and α, γi and γj are individual coefficients.
The variable fit can be either the firm-level foreign ownership share, fs, in
which case Fjt is either FS1 or FS2, or it is the firm-level foreign ownership dummy,
fd, in which case Fjt is either FS3 or FS4. The parameters of interest are γi and γj. The
parameter γi measure the effect of firm-level foreign ownership on a firm�s tax
burden, while the parameter γj instead denotes the impact of country-level ownership
on firms� tax burdens. This second effect applies to all firms in a country j.
The firm-level and macro-level foreign ownership variables are not
independent, as changes in firm-level foreign ownership are reflected in country-level
foreign ownership measures (unless they cancel), and vice versa. A change in the
foreign ownership share at a firm thus in principle affects the tax burden through both
firm-level and macro-level effects. Specifically, consider that the foreign ownership

11
share, fsi, of firm i (between zero and one) increases by σi. Also, let A i be the assets of
firm i. The asset-weighted tax burden in country j then increases by 100σi (γi + γj)[ A
i / Σi A i] in percent, if in fact the firm-level tax burden, Tax burdenijt, is correctly
specified to be related to the asset-weighted country-level foreign ownership share,
FS2jt.8 Similarly, the average tax burden in a particular country increases by 100σi (γi+ γj) / n in percent (with n the number of firms that country), if the firm-level tax
burden, Tax burdenijt, is correctly related to the equal-weighted country-level foreign
ownership share, FS1jt.9
Our sample is constructed to include only firms with unconsolidated balance
sheets (see Appendix A). This is to exclude firms with consolidated balance sheets
that may have subsidiaries paying taxes in various countries. As a result, our tax
burden variable almost exclusively reflects source-level taxes, and in particular the
corporate income tax, in the country of establishment.10 Corporate income tax systems
generally do not discriminate on the basis of the international ownership of the firm.
Hence, there is no reason why foreign ownership should be endogenous to the tax
variable as constructed in this paper.11
5. Empirical results
5.1 Benchmark results
Table (5) contains the benchmark results. Columns (1) and (2) include the
firm-level foreign ownership share, fs, and the country-level foreign ownership shares
FS1 and FS2, respectively. Columns (3) and (4) instead include the firm-level foreign
8 Note that an increase in the tax burden as a percentage of assets may not translate into higher taxrevenues if the higher tax burden, resulting from any change in the tax system, induces some firms torelocate.9 Similarly, the sign of the sum γi + γj indicates the sign of the total effect higher foreign ownership onthe tax burden, if we proxy the foreign dummy, fd, for the firm-level foreign ownership share, fs, andcorrespondingly use the aggregate foreign ownership shares FS3 and FS4.10 All the same, some firms � even those with unconsolidated balance sheets � may report someforeign-source tax paid by foreign branches that pay corporate tax in the foreign country.11 In practice, the overall tax system � taking into account the interactions of a country�s sourcetaxation with its and foreign countries� residence taxation � may turn out to be discriminatory againstor favorable towards foreign ownership. As an example, countries that allow credits for corporate taxesagainst personal income taxes rarely provide credits against foreign corporate taxes. This discriminatesagainst foreign ownership. On the other hand, residents of a particular country may more easily escapethe residence tax on the income derived from foreign corporate shares than on domestic shares. Thiseffectively discriminates against domestic ownership. Our tax burden variable does not capture thesepossibly discriminatory aspects of the tax system, and should not be correlated with these. See Stulz(1981) for an analysis of the impact of investment barriers such as differential taxation on asset pricingand portfolio allocation.

12
dummy, fd, and the country-level foreign ownership share FS3 and FS4. The
regressions in columns (1) and (2) contain ownership variables that are based on full
information of the internationalization of ownership giving rise to a sample of 50,481
observations. The regressions in columns (3) and (4) instead require information only
about the collective majority ownership of either domestic or foreign shareholders,
which increases the sample to 102,138 observations. The regressions in columns (1)
and (2) are based on firm-level data from 18 countries, while regressions (3) and (4)
contain data from 21 countries. For a breakdown of the national origins of firms in the
two samples, see Tables B1 and B2 in Appendix B. Apart from being larger, the
sample in regressions (3) and (4) contains relatively more publicly traded firms.12
The results in all four columns of Table (5) first indicate that firms with larger
assets tend to pay lower taxes.13 Other variables derived from balance sheet data enter
the regressions as expected: fixed assets lead to lower taxes (reflecting generous
depreciation), and both short-term and long-term debt lower taxes (reflecting the tax
deductibility of interest payments). Relative to the left-out sectoral fixed effect for
manufacturing, we see that several sectors (agriculture, utilities, other) appear to pay
significantly higher taxes in at least one of the specifications, while other sectors
(construction, retail and wholesale, and transport) pay significantly lower taxes. These
differences may reflect variation in pre-tax profitability due to economic rents that are
not fully reflected in (book) asset values. At the same time, sectors that use few assets
with substantial depreciation allowances may pay higher taxes as scaled by assets.
The agricultural sector, for instance, uses mostly non-depreciable land and it appears
to face a relatively high tax burden.
Turning to the country variables, we test for a country-size effect by including
the log of GDP. Smaller countries should face a larger elasticity of the tax base with
respect to the effective tax rate, and hence are expected to levy lower taxes in a non-
cooperative tax competition equilibrium. The log of GDP indeed enters all four
regressions with a positive and significant coefficient. Next, we test whether richer
12 Regressions (1) and (2) contain 11,405 firms in 2000, of which 69 are publicly quoted. Regressions(3) and (4) contain 21,322 firms in 2000, of which 360 are quoted. See Appendix B for informationabout the nationalities of these quoted firms.13 Large firms tend to combine many ventures and hence are less likely to be restricted by limits on thecarry forward or backward of losses for tax purposes. Also, they may be less risky and hence onaverage yield lower pre-tax returns on assets. Finally, large firms may pay lower taxes because they aremore successful in implementing tax avoidance strategies.

13
countries, which tend to have larger public expenditures, levy higher corporate taxes
by including the log of per capita GDP. This variable, as expected, enters all four
regressions positively, but it is statistically significant only in the FS1, FS3 and FS4
regressions. The coefficient on inflation turns out to be positive and significant
throughout, reflecting that inflation erodes the value of depreciation and interest
allowances based on historical values.
Turning to the ownership variables, we see that the firm-level ownership
variables fs and fd have positive and significant coefficients between .158 and .199 in
the four regressions. A plausible explanation for this is simply that foreign-owned
firms are more profitable than domestic firms.14 Finally, we consider the country-level
foreign ownership variables. Note that the equal-weighted FS1 and FS3 variables
enter columns (1) and (3) with very similar coefficients of 1.377 and 1.454, while the
coefficients for FS2 and FS4 in columns (2) and (4) equally are very similar at 2.528
and 2.726. Hence, it makes little difference whether the aggregate foreign ownership
measures are based on full ownership information or only on information of majority
domestic or foreign ownership. A priori, the asset-weighted measures would be
preferred to the equal-weighted measures, as they appropriately give a larger weight
to bigger firms. Regression with asset-weighted foreign ownership measures also fit
the data somewhat better, as evidence by slightly larger R-squares. For all four
regressions, the sign of the combined firm-level and country-level effects of higher
foreign ownership on the tax burden, indicated by the sign of γi + γj, is clearly
positive.15
The sizes of the coefficients on the foreign ownership variables suggest that
the impact of foreign ownership on the tax burden is economically significant. To
illustrate, we take the estimates of the coefficients γi and γj in column (2) of 0.160
and 2.528, respectively. Noting that their sum 2.688, we see that an increase in the
foreign ownership share by 0.01 would increase taxes as a percent of assets by 0.027.
The mean of this tax variable for the observations in the regression is 2.600 (see Table
(4)). Thus an increase in the foreign ownership share by one percentage point would
increase taxes relative to assets by 1.034 percent. Devereux et al (2002, Figure 2)
14 An investigation of the extent to which the differential taxes paid by foreign firms reflect differencesin productivity or perhaps international profit shifting is beyond the scope of this paper.15 Formal T-tests of the hypothesis of this sum being equal to zero are strongly rejected for all fourregressions.

14
document that the average corporate income tax in Europe is currently in the
neighborhood of 33 percent. The elimination of all foreign ownership (currently at
about 26 percent) would thus reduce the average tax rate to about 24 percent, while a
doubling of foreign ownership to 52 percent conversely would increase the average
tax to 42 percent.
5.2 Regressions for different years and sectors
Higher corporate taxes may reduce the tax base by inducing some firms to
relocate or to invest less, while they increase the taxation of foreign-owned rents. The
nature of this trade-off may in principle differ over time giving rise to varying
sensitivities of the tax burden to foreign ownership over time. Specifically, increases
in the elasticity of the tax base to the tax rate over time would suggest that tax policy
makers are inclined to increase the tax rate less in response to any increase in foreign
ownership. If so, the sensitivity of the tax burden to foreign ownership falls over time.
To check this, Table (6) reports cross-sectional regressions for each of the
years 1996-2000, corresponding to the four benchmark regressions in Table (5).
Regressions for different years based on these four benchmark regressions are
reported in Panels A, B, C and D. We only report the coefficients for the fs, fd and the
FS1 to FS4 variables in the various panels. The coefficient for fs is positive for all
years in Panels A and B, but not statistically significant for all years. The fd variable
instead is positive and significant throughout panels C and D. The coefficients for FS1
through FS4 are positive and statistically significant for all years but 1996 in all
panels (in that year coefficients are positive and significant in Panels B and D, while
they are negative and significant in Panel A and negative but insignificant in Panel C).
In each of the panels, 1996 is the year with the smallest number of observations.
Estimated coefficients on the aggregate ownership variables for 2000 are lower than
in several previous years. The sample period, however, is too short to conclude
whether this reflects a structural or a business cycle related decline in the sensitivity
of the tax burden to foreign ownership.
Next, tax authorities no doubt have some discretion to vary the effective tax
burden across sectors. Sectors tend to differ in their asset use and in the rate of
(economic) depreciation of their assets. Therefore, changes in tax rates and in
depreciation allowances will affect effective tax rates differently across sectors. In
principle this means that countries can also vary the sensitivity of the tax burden to

15
foreign ownership across sectors as part of active policy making. A reason to do this
could be possibly different sensitivities of the tax base with respect to the tax rate
across sectors.
Table (7) reports estimates of the coefficients for the firm-level and country-
level foreign ownership variables for each of the 8 sectors in each of four panels, as
based on the four benchmark regressions of Table (5). Estimates of fs are positive and
significant for the retail and wholesale sector in Panels A and B, while fd is positive
and significant for the manufacturing and the retail and wholesale sectors in Panels C
and D. Also, the coefficients for the aggregate foreign ownership variables are
positive and significant for the manufacturing and the retail and wholesale regressions
in all four panels. In each panel, these two sectors also are the ones with the most
observations. Coefficients in the agricultural sector, with the smallest number of
observations, are positive and significant for Panels B and D, while they are negative
and insignificant in Panel A and negative and significant in Panel C.16
5.3 Robustness checks
Next, we subject the benchmark regressions in Table (5) to several robustness
checks to better understand the nature of our results. The four Panels of Table (8)
contain the robustness checks corresponding to each of the four benchmark
regressions. First, we redo the benchmark regressions for samples of only domestic
firms for which the firm-level foreign ownership variables fs and fd are zero. These
firms have few international profit shifting opportunities, as we exclude all firms
(fully domestically owned or not) with consolidated statements that could own
foreign subsidiaries that can be used in profit shifting schemes. Hence, for purely
domestic firms any effect of foreign ownership on taxation has to come primarily
through changes in the tax system.17 In Table (8), we see that the country-level
foreign ownership measures enter positively and significantly in the domestic-firms-
only regressions in all four panels.
16 In both Tables (6) and (7), we see a negative and significant coefficient on an equal-weighted foreignownership measure in one instance, in each case matched by a positive and significant coefficient in theregression with the corresponding value-weighted foreign ownership measure. While these results aredifficult to explain, we a priori think that value-weighted foreign ownership measures are more relevantfor tax policy makers.17 There might still be profit-shifting opportunities to the extent that there is an holding company thatowned this fully domestic firms as well as firms abroad.

16
Next, we select only firms located in Western European countries (i.e., the
EU-15, Iceland, Norway, and Switzerland). As expected, the coefficients are positive
and significant for each of the country-level foreign ownership measures. Also, the
estimated coefficients are larger than the corresponding benchmark regressions
reflecting, as seen in Figure (1), that the relationship between foreign ownership and
the tax burden is stronger for Western European countries than for the whole sample.
Alternatively, we include interaction terms of all firm-level variables
(including sector fixed effects) with the relevant firm-level foreign ownership
variable (either fs or fd). This allows the impact of firm-level foreign ownership on
the tax burden to vary with all firm characteristics.18 The estimated coefficients for
FS1 through FS4 in the four panels remain positive and significant.
Next, we redo the regressions with weighted least squares with the weight
equal to the inverse of the number of firms for a particular country in a particular
year. This puts additional weight on those countries and years with relatively few
firm-level observations. Perhaps undesirably, this also puts additional weight on
those observations for which our estimate of an FS measure is based on relatively few
firm observations. The estimated coefficients for the FS variables become
insignificant for all panels but Panel D. Figure (1) suggests that weighted least
squares puts additional weight on outliers for several Eastern European countries,
which indeed tend to have relatively few observations. As discussed before, countries
in Eastern Europe are still in a process of economic transition, which suggests that
the relationship between foreign ownership and taxation observed for these countries
does not represent a stable, long run outcome. Thus, it makes sense to redo the
weighted least squares for only Western European observations. This is shown to
restore positive and highly significant coefficients for the country-level foreign
ownership variables in the weighted least squares regressions.
We also report regressions with data averaged for each firm over the 5-year
period. The measures of FS are positive and significant in all four panels.
To the contrary, the inclusion of country fixed effects renders the coefficients
for the FS variables negative in all four panels, while significant in Panels A and D.
From Tables (1) and (2), we know that the foreign ownership measures increased
18 Note that the reported coefficients for fs or fd in this instance are not directly comparable tocorresponding estimates for these variables in other regressions.

17
significantly in Eastern Europe during the 1996-2000 period, while they changed
little in Western Europe. At the same time, the tax burden was on a downward path in
several Eastern European countries. Thus, the negative relationship between foreign
ownership and taxation in the regressions with country fixed effects appears to reflect
developments in Eastern Europe. Again, it makes sense to redo the regressions for
only Western European observations. This yields positive but insignificant
coefficients for the country-level foreign ownership variables in the four panels. This
suggests that the positive relationship between foreign ownership and taxation found
in Western Europe reflects cross-country variation rather than cross-time variation.
This should not be surprising given that the sample period is only 5 years and given
that foreign ownership in Western Europe has been stable during this period.
Also, we exclude year fixed effects from the regressions as a robustness check,
with little impact on estimated coefficients. Finally, we lag the FS variables to allow
for a possibly lagged response of tax policy to changes in country-level foreign
ownership. Estimates of coefficients for the FS variables remain very similar to those
in the benchmark regressions.
6. Conclusions
Using firm-level data, this paper presents consistent estimates of the degree of
foreign ownership of firms for a large set of European countries. Average foreign
ownership share in Europe is estimated to be about 26 percent in the year 2000. This
average foreign ownership figure reflects considerable variation across Europe, with
foreign ownership in Eastern Europe generally higher than in Western Europe.
The estimation results presented in this paper suggest that company tax
burdens are positively related to foreign ownership at the country level. This indicates
that company tax policies in Europe are in part motivated by the desire to export
corporate tax burdens. The empirical relationship between company tax burdens and
foreign ownership is economically significant. Specifically, our benchmark results
suggest that a doubling of foreign ownership in Europe, from 26 to 52 percent, would
increase the average corporate tax rate from about 33 percent to about 42 percent.
During the 1996-2000 period, average foreign ownership in Western Europe appears
to have been rather stable, while it has significantly increased in Eastern Europe. In
the decades to come, foreign ownership can be expected to increase in Western

18
Europe as well and thus might mitigate any �race to the bottom� in corporate tax
burdens.
The welfare effects of a positive relationship between foreign ownership and
corporate tax burdens are uncertain. Foreign ownership is relatively high in smaller
countries. The resulting upward pressure on corporate taxes thus is also relatively
large in smaller countries. This may serve to partially or wholly cancel the relatively
strong pressure to reduce taxes in smaller countries to attract a larger corporate tax
base. The higher foreign ownership in smaller countries thus in principle may help to
bring about more equal corporate tax levels across countries. Hence, the foreign
ownership effect on taxes could serve to reduce distortions in the international tax
system coming from international disparities in corporate tax burdens. In a world of
equal-sized, symmetric countries, foreign ownership would simply serve to increase
the equal corporate tax burden in the various countries. The welfare effects of such
upward pressure on corporate tax levels are unclear. Higher corporate income tax
levels could be desirable in a world where tax evasion increasingly erodes residence-
based capital income taxes. Higher capital income taxes, however, discourage capital
formation and may ultimately not be welfare improving.19
The absence of �race to the bottom� so far, in part due to the already
significant foreign ownership share at present, may be a reason that proposals to
coordinate corporate income taxes in the EU have so far not taken hold. In the
absence of all-out corporate income tax degradation, EU Member States apparently
prefer to maintain a high degree of national autonomy over corporate tax policies.
This also was evident at the Nice EU summit of December 2002, where Member
States decided to uphold the unanimity requirement regarding EU directives on tax
policy.
In the absence of across-the-board tax coordination, EU Member States in
recent years have focused on identifying elements of �harmful tax competition�. Peer
pressure is applied to convince partner Member States to give up tax regimes that are
deemed harmful. Examples of these are the low-tax treatments of corporate
headquarters in Belgium and the Netherlands and the 10-percent tax regime in Ireland.
Actual tax coordination efforts in the EU thus have been in the direction of higher
corporate income taxes. This suggests that tax policy makers in the EU are of the

19
opinion that currently corporate tax levels are too low. If so, this suggests that they
would welcome the foreign-ownership effect on corporate tax burdens.
Recent initiatives by the European Commission (see European Commission,
2001a) do not call for higher or lower corporate income taxes in the EU, but rather
they address the problems associated with separate tax accounting in Member States.
The European Commission at this point favors the introduction of a consolidated
corporate tax base in the EU along with some type of formula apportionment of tax
revenues. There is no push for the introduction of a common tax rate or even a
minimum tax rate. A common EU tax base, however, would help to make tax burdens
in the EU more transparent, and hence may lead to relatively intense tax competition
with a view to altering the apportionment of tax base among Member States. The
introduction of a common tax base in the EU thus would neither eliminate tax
competition nor the incentive to levy relatively high corporate income taxes on
account of a high foreign ownership of domestic firms.
19 In one view, optimal capital income taxes are zero in the long run (see Chamley (1986)), in whichcase the positive impact of foreign ownership on corporate income taxes appears to be undesirable.
20
References
Adjaouté, Kpate, Laura Botazzi, Jean-Pierre Danthine, Andreas M. Fischer, RonyHamaui, Richard Portes, Michael R. Wickens (2000), �EMU and portfolioadjustment�, CEPR Policy Paper 5.
Bøhren, Øyvind and Benrt Arne Ødegaard (2000), �The ownership structure ofNorwegian firms: characteristics of an outlier�, mimeo, Norwegian School ofManagement BI.
Chamley, Christophe (1986), �Optimal taxation of capital in economies with identicalprivate and social discount rates�, Econometrica, 1986.
Dahlquist, Magnus and Göran Robertsson (2001), �Direct foreign ownership,institutional investors, and firm characteristics�, Journal of Financial Economics 59,413-440.
Demirgüç-Kunt, Aslõ. and Harry Huizinga (2001), �The taxation of domestic andforeign banking�, Journal of Public Economics 79, 429-453.
Devereux, Michael P., Rachel Griffith and Alexander Klemm (2002), �Corporateincome tax reforms and international tax competition�, Economic Policy 35, 451-488.
European Commission (2001a), Company taxation in the internal market, COM(2001) 582 final.
European Commission (2001b), �Financial market integration in the EU�, Chapter 4in EU Economy Review 2001, Brussels.
Eurostat (2001), �Foreign owned enterprises�, Statistics in focus, Industry, trade andservices, Theme 4, No 20.
Eijffinger, Sylvester C. and Wolf Wagner (2001), �Taxation if capital is not perfectlymobile: tax competition versus tax exportation�, CEPR Working Paper No. 3084.
Faccio Mara and Larry H. Lang (2002), �The ultimate ownership of WesternEuropean corporation�, Journal of Financial Economics 65, 365-395.
Grubert, Harry, T. Goodspeed and D. Swenson (1999), �Explaining the low taxableincome of foreign-controled companies in the United States�, in A. Giovanni, R.Hubbard and J. Slemrod, eds., Studies in International Taxation. University ofChicago Press, Chicago, IL. 237-270.
Gordon, Roger H. (1986), �Taxation of investment and savings in a world economy�,American Economic Review 96, 1086-1102.
Huizinga, Harry and Søren B. Nielsen (1997), �Capital income and profit taxationwith foreign ownership of firms�, Journal of International Economics 42, 149-165.
21
Huizinga, Harry and Søren B. Nielsen (2002), �The coordination of capital incomeand profit taxation�, Regional Science and Urban Economics 32, 1-26.
Kinney, Michael and Janice Lawrence (2000), �An analysis of the relative U.S. taxburden of U.S. corporations having substantial foreign ownership�, National TaxJournal 53, 9-22.
Mintz, Jack M. (1994), �Is there a future for capital income taxation?�, Canadian TaxJournal.
Olsen, Trond E. and Petter Osmundsen (2001), �Strategic tax competition;implications of national ownership�, Journal of Public Economics 81, 253-277.
Sørensen, Peter Birch (2000), �The case for international tax co-ordinationreconsidered�, Economic Policy 31, 431-461.
Stulz, René M. (1981), �On the effects of barriers to international investment�,Journal of Finance 36, 923-934.
Timmermans, Thierry (2000), �International diversification of investments inBelgium and its effects on the main Belgian securities markets�, in Internationalfinancial markets and the implications for monetary and financial stability,Conference Papers No. 8, Bank for International Settlements.
Wildasin, David (2000), �Factor mobility and fiscal policy in the EU: policy issuesand analytical approaches�, Economic Policy 31, 339-368.

22
Table (1). Foreign ownership variables FS1 and FS2Country 2000 Average 1996-2000 Change in yearly average between 1996 and 2000
# firms FS1 FS2 # firms FS1 FS2 FS1 FS2Austria 148 25.8 21.4 282 29.9 24.0 -3.2 -2.3Belgium 620 29.1 28.0 525 36.3 39.0 -9.7 -12.6Bosnia n.a. n.a. n.a. 3 n.a. n.a. n.a. n.a.Bulgaria 418 21.3 18.4 383 6.8 7.2 20.9 17.8Croatia 85 20.1 13.5 49 20.3 12.5 n.a. n.a.Czech Rep. 282 39.9 54.6 227 36.4 50.3 4.2 3.9Denmark 916 22.6 22.8 666 23.9 21.4 -2.2 8.5Estonia 12 n.a. n.a. 8 n.a. n.a. n.a. n.a.Finland 125 21.0 7.4 92 20.3 8.6 n.a. n.a.France 2,479 21.9 14.7 2,163 20.1 15.4 -1.3 -2.0Germany 553 16.2 14.1 1,218 13.1 13.6 5.1 2.8Greece 203 39.3 23.3 248 34.1 24.5 4.9 -14.2Hungary 64 42.0 86.9 38 48.5 80.6 n.a. n.a.Iceland n.a. n.a. n.a. 3 n.a. n.a. n.a. n.a.Ireland 4 n.a. n.a. 8 n.a. n.a. n.a. n.a.Italy 1,369 39.4 29.7 1,121 32.1 33.7 7.3 -9.0Latvia 20 n.a. n.a. 12 n.a. n.a. n.a. n.a.Lithuania 32 n.a. n.a. 12 n.a. n.a. n.a. n.a.Luxembourg 7 n.a. n.a. 21 n.a. n.a. n.a. n.a.Netherlands 473 20.0 43.4 771 20.4 40.6 -1.6 1.5Norway 1,535 19.5 24.7 1,202 16.3 18.2 1.9 6.9Poland 123 33.5 33.2 133 22.7 16.2 19.2 30.8Portugal 112 17.8 18.7 156 24.2 18.3 -10.9 5.5Romania 1,424 39.6 31.7 618 18.6 20.6 35.8 25.3Slovak Rep. 2 n.a. n.a. 2 n.a. n.a. n.a. n.a.Slovenia 75 45.2 36.4 47 45.2 36.4 n.a. n.a.Spain 1,006 13.8 9.5 1,289 26.2 21.6 -19.1 -19.9Sweden 1,314 7.4 4.8 849 10.0 5.2 n.a. n.a.Switzerland 21 n.a. n.a. 13 n.a. n.a. n.a. n.a.United Kingdom 794 13.6 7.1 816 17.7 12.3 -7.4 -10.0Former Yugoslavia n.a. n.a. n.a. 11 n.a. n.a. n.a. n.a.
Europe 14,216 26.1 25.9 12,891 23.9 24.0 3.0 3.3European Union 10,123 22.1 18.8 10,190 24.2 22.4 -4.9 -7.0Western Europe 11,679 21.9 19.2 11,405 23.6 22.1 -4.3 -5.9Eastern Europe 2,537 34.5 39.2 1,485 23.5 27.7 20.9 24.2FS1 and FS2 are the equal-weighted and asset-weighted foreign ownership in percent. These foreign ownership measures are based on firms for which domestic and foreign ownership are fullyknown and they are computed only if the number of observations for a country in a specific year is at least 35 (see appendix A for details). The average for 1996-2000 is computed using theavailable years. The changes in between 1996 and 2000 are in absolute levels. Western Europe is the EU-15 where available plus Iceland, Norway and Switzerland.

23
Table (2). Foreign ownership variables FS3 and FS4Countries 2000 Average 1996-2000 Change in yearly average from
1996 to 2000# firms FS3 FS4 # firms FS3 FS4 FS3 FS4
Austria 184 23.9 18.5 354 28.1 22.8 -4.2 0.6Belgium 2,265 11.4 25.9 1,896 14.4 26.5 -3.2 2.8Bosnia n.a. n.a. n.a. 3 n.a. n.a. n.a. n.a.Bulgaria 768 17.4 19.0 569 7.0 9.5 16.9 13.1Croatia 117 22.2 24.8 74 20.8 23.6 n.a. n.a.Czech Rep. 804 31.5 34.8 724 25.5 24.2 9.3 12.8Denmark 971 22.0 22.1 702 23.8 22.5 -3.4 4.1Estonia 18 n.a. n.a. 12 n.a. n.a. n.a. n.a.Finland 147 21.1 8.0 111 19.9 8.6 n.a. n.a.France 8,369 21.6 18.2 8,543 16.8 16.6 4.4 0.2Germany 710 15.6 12.2 1,568 12.4 13.4 5.1 0.3Greece 823 31.1 22.7 641 25.9 23.2 4.8 -10.9Hungary 206 31.6 50.5 125 35.4 43.6 n.a. n.a.Iceland 7 n.a. n.a. 6 n.a. n.a. n.a. n.a.Ireland 4 n.a. n.a. 9 n.a. n.a. n.a. n.a.Italy 2,106 40.9 25.1 1,917 28.3 25.2 14.2 -2.3Latvia 29 n.a. n.a. 21 33.3 26.5 n.a. n.a.Lithuania 84 19.0 n.a. 39 13.3 13.1 n.a. n.a.Luxembourg 16 n.a. n.a. 48 42.6 52.5 n.a. n.a.Netherlands 499 20.2 42.9 817 20.7 40.0 -2.1 0.8Norway 1,772 18.1 23.3 1,416 14.9 18.3 2.3 4.7Poland 227 33.9 40.8 234 26.5 20.5 10.0 28.3Portugal 240 22.1 21.0 399 21.3 24.2 2.4 7.0Romania 1,798 38.0 32.8 1,104 18.2 21.7 31.8 20.9Slovak Rep. 2 n.a. n.a. 2 n.a. n.a. n.a. n.a.Slovenia 111 52.3 54.8 50 41.4 51.0 n.a. n.a.Spain 1,939 11.7 8.9 2,491 21.0 18.5 -14.5 -16.3Sweden 1,395 7.9 5.1 907 10.0 5.2 n.a. n.a.Switzerland 48 8.3 7.3 30 10.1 10.5 n.a. n.a.United Kingdom 924 15.2 7.0 1,062 17.5 12.1 -5.7 -8.7
Europe 26,583 23.4 23.8 25,683 21.1 22.2 2.7 2.5European Union 20,592 20.4 18.3 21,330 21.6 22.7 -3.1 -6.0Western Europe 22,419 19.4 17.9 22,783 20.9 22.1 -3.5 -6.0Eastern Europe 4,164 30.7 34.8 2,899 20.4 20.9 17.5 21.7FS3 and FS4 are the equal-weighted and asset-weighted foreign ownership in percent. A firm that is at least 50 percent foreign-owned is considered foreign, while a firm that is more than 50percent domestically owned is considered domestic. FS3 and FS4 are computed only if the number of observations for a country in a specific year is at least 35 (see appendix A for details). Theaverage for 1996-2000 is computed using the available years. The changes in between 1996 and 2000 are in absolute levels. Western Europe is the EU-15 where available plus Iceland, Norwayand Switzerland.

24
Table (3). Correlation coefficients of foreign ownership measures
Part A: Averages per country and per yearFS1 FS2 FS3 FS4
FS1 Correlation 1.000 Prob. Number of Obs. 92
FS2 Correlation .785 1.000 Prob. <.0001 Number of Obs. 92 92
FS3 Correlation .807 .568 1.000 Prob. <.0001 <.0001 Number of Obs. 92 92 104
FS4 Correlation .680 .803 .768 1.000 Prob. <.0001 <.0001 <.0001 Number of Obs. 92 92 104 104
The FS variables are averages per country and per year. An FS variable for a country in a year iscomputed if the number of observations is at least 35. Prob. is the p-value of a test of the hypothesisthat the correlation coefficient is different from zero.
Part B: Averages per countryFS1 FS2 FS3 FS4
FS1 Correlation 1.000 Prob. Number of Obs.
FS2 Correlation .823 1.000 Prob. <.0001 Number of Obs. 21 21
FS3 Correlation .849 .624 1.000 Prob. <.0001 .003 Number of Obs. 21 21 26
FS4 Correlation .779 .771 .847 1.000 Prob. <.0001 <.0001 <.0001 Number of Obs. 21 21 26 26
The FS are averages per country of yearly averages. An FS variable for a country in a year is computedif the number of observations is at least 35. Prob. is the p-value of a test of the hypothesis that thecorrelation coefficient is different from zero.
25
Table (4). Summary statistics
Variable Unit Mean Std.deviation
Min. Max. Correlationwith FS1
Correlationwith FS2
Firm variablesTax burden % 2.600 4.103 -86.347 92.272 .032 .067Log assets Log
(€1,000)10.037 1.635 3.227 17.571 -.040 -.069
Fixedassets/totalassets
.369 .275 .000 1.000 -.155 -.129
Short-termdebt/totalassets
.501 .248 .000 1.000 .171 .123
Long-termdebt/totalassets
.171 .193 .000 1.000 -.151 -.080
Agriculture .027 .162 0 1 -.078 -.037Construction .051 .221 0 1 -.009 .039Financialservices
.027 .162 0 1 -.017 -.001
Retail andwholesale
.258 .437 0 1 .053 .050
Transport .057 .232 0 1 -.035 -.020Utilities .031 .172 0 1 -.118 -.102Other .142 .349 0 1 -.065 -.089fs .213 .397 .000 1.000 .214 .151Country variablesLog GDP Log
(€ billion)5.996 1.265 2.125 7.628 -.014 -.070
Log percapita GDP
Log(€ 1,000)
2.781 .783 .007 3.382 -.103 -.002
Inflation20 % 7.636 39.756 .515 453.200 -.166 -.122FS1 .214 .086 .015 .566FS2 .206 .107 .012 .869
Summary statistics are for variables in regressions (1) and (2) in Table (5) based on 50,481observations
20 Bulgaria and Romania had inflation rates of 453.2% and 154.9% in 1997, respectively. Removingthese observations changes the estimated coefficients on inflation in the benchmark regressions littleand leaves these significant at the one-percent level. Also, the estimated coefficients and significancelevels for the fs, fd and various FS variables change little.

26
Table (5). Basic regression results
(1) (2) (3) (4)Log assets -.248**
(.047)-.242**(.015)
-.250**(.010)
-.247**(.010)
Fixed assets/total assets -2.877**(.102)
-2.858**(.102)
-3.132**(.070)
-3.115**(.070)
Short-term debt/total assets -3.609**(.111)
-3.648**(.111)
-4.165**(.074)
-4.181**(.074)
Long-term debt/total assets -3.286**(.108)
-3.315**(.108)
-3.492**(.077)
-3.485**(.077)
Agriculture 1.092**(.222)
1.093**(.221)
.541**(.153)
.540**(.152)
Construction -.337**(.074)
-.338**(.073)
-.549**(.045)
-.581**(.044)
Financial services -.078(.133)
-.082(.133)
-.016(.110)
-.013(.110)
Retail and wholesale -.089*(.043)
-.178**(.023)
-.062*(.028)
-.058*(.028)
Transport -.186*(.079)
-.175*(.079)
-.107*(.053)
-.110*(.053)
Utilities .196*(.081)
.254**(.080)
.428**(.062)
.471**(.062)
Other .102(.064)
.140**(.043)
-.202(.041)
-.010(.041)
Log GDP .209**(.019)
.239**(.019)
.117**(.013)
.178**(.014)
Log per capita GDP .065*(.032)
.029(.031)
.141**(.026)
.080**(.024)
Inflation .006**(.001)
.007**(.001)
.008**(.001)
.009**(.001)
fs .199**(.047)
.160**(.047)
FS1 1.377**(.217)
FS2 2.528**(.180)
fd .169**(.032)
.158**(.032)
FS3 1.454**(.193)
FS4 2.726**(.191)
Observations 50,481 50,481 102,138 102,138Adj-R2 .070 .073 .082 .084Data are for 1996-2000. All regressions include unreported time fixed effects. Detailed variabledefinitions and data sources are given in Appendix A. Heteroskedasticity consistent errors are given inparentheses. * and ** indicate significance levels of 5 and 1 percent, respectively.

27
Table (6). Cross-sectional analysis for different sectors
Panel AYear fs FS1 Adj-R2 N
1996 .387**(.124)
-2.067*(.821)
.059 6,505
1997 .257*(.107)
1.335*(.616)
.086 9,433
1998 .194(.107)
2.723**(.509)
.074 10,865
1999 .159(.092)
2.911**(.510)
.073 12,273
2000 .157(.102)
2.030**(.431)
.070 11,405
Included variables as in regression (1) of table (5) apart from time fixed effects. Variable definitionsand data sources are given in Appendix A. Heteroskedasticity consistent errors are given inparentheses. * and ** indicate significance levels of 5 and 1 percent, respectively.
Panel BYear fs FS2 Adj-R2 N
1996 .287*(.123)
3.022**(.570)
.063 6,505
1997 .189(.106)
3.141**(.420)
.089 9,433
1998 .183(.107)
3.146**(.377)
.077 10,865
1999 .156(.093)
2.541**(.370)
.075 12,272
2000 .167(.103)
2.002**(.408)
.070 11,405
Included variables as in regression (2) of table (5) apart from time fixed effects. Variable definitionsand data sources are given in Appendix A. Heteroskedasticity consistent errors are given inparentheses. * and ** indicate significance levels of 5 and 1 percent, respectively.

28
Panel CYear fd FS3 Adj-R2 N
1996 .215**(.080)
1.305(.744)
.071 14,452
1997 .198**(.073)
3.409**(.698)
.101 19,580
1998 .159*(.073)
1.537**(.490)
.083 22,426
1999 .202**(.066)
3.819**(.517)
.081 24,358
2000 .138*(.066)
1.770**(.309)
.080 21,322
Included variables as in regression (3) of table (5) apart from time fixed effects. Variable definitionsand data sources are given in Appendix A. Heteroskedasticity consistent errors are given inparentheses. * and ** indicate significance levels of 5 and 1 percent, respectively.
Panel DYear fd FS4 Adj-R2 N
1996 .199*(.079)
3.547**(.658)
.074 14,452
1997 .184*(.073)
5.012**(.430)
.105 19,580
1998 .150*(.073)
3.110**(.439)
.085 22,426
1999 .202**(.067)
3.226**(.384)
.082 24,358
2000 .167*(.066)
1.568**(.392)
.079 21,322
Included variables as in regression (4) of table (5) apart from time fixed effects. Variable definitionsand data sources are given in Appendix A. Heteroskedasticity consistent errors are given inparentheses. * and ** indicate significance levels of 5 and 1 percent, respectively.

29
Table (7). Cross-sectional analysis for different sectors
Panel ASectors fs FS1 Adj-R2 N
Agriculture .398(.972)
-2.732(2.040)
.037 1,355
Construction .130(.291)
.590(.769)
.108 2,594
Financial services .026(.320)
.786(1.735)
.121 1,360
Manufacturing .127*(.061)
.996**(.302)
.077 20,562
Retail and wholesale .379**(.079)
2.483**(.449)
.093 13,019
Transport .230(.207)
2.696**(.816)
.055 2,882
Utilities .663(.645)
.465(.849)
.122 1,542
Other -.243(.143)
1.382(.789)
.118 7,167
Data are for 1996-2000. Included variables as in regression 1 of table 5 apart from sector fixed effects.Variable definitions and data sources are given in Appendix A. Heteroskedasticity consistent errors aregiven in parentheses. * and ** indicate significance levels of 5 and 1 percent, respectively.
Panel BSectors fs FS2 Adj-R2 N
Agriculture .213(.965)
5.345*(2.269)
.041 1,355
Construction -.017(.288)
2.889**(.571)
.117 2,594
Financial services .022(.332)
.297(.946)
.121 1,360
Manufacturing .091(.061)
2.190**(.247)
.081 20,562
Retail and wholesale .382**(.079)
2.609**(.323)
.095 13,019
Transport .177(.216)
4.077**(1.080)
.063 2,882
Utilities .549(.683)
1.655(.932)
.124 1,542
Other -.269(.140)
2.051**(.562)
.119 7,167
Data are for 1996-2000. Included variables as in regression 2 of table 5 apart from sector fixed effects.Variable definitions and data sources are given in Appendix A. Heteroskedasticity consistent errors aregiven in parentheses. * and ** indicate significance levels of 5 and 1 percent, respectively.

30
Panel CSectors fd FS3 Adj-R2 N
Agriculture .322(.612)
-3.787*(1.718)
.031 2,201
Construction .126(.171)
.525(.669)
.133 5,491
Financial services -.126(.271)
7.431**(2.626)
.148 2,333
Manufacturing .160**(.044)
1.306**(.266)
.092 41,059
Retail and wholesale .293**(.055)
1.121**(.372)
.106 29,212
Transport .187(.150)
4.030**(.837)
.067 5,653
Utilities .624(.508)
.964(.817)
.121 2,418
Other -.154(.094)
2.859**(.802)
.117 13,771
Data are for 1996-2000. Included variables as in regression 3 of table 5 apart from sector fixed effects.Variable definitions and data sources are given in Appendix A. Heteroskedasticity consistent errors aregiven in parentheses. * and ** indicate significance levels of 5 and 1 percent, respectively.
Panel DSectors fd FS4 Adj-R2 N
Agriculture .186(.607)
4.640*(2.262)
.033 2,201
Construction .049(.173)
3.135**(.599)
.139 5,491
Financial services -.029(.285)
1.238(1.116)
.145 2,333
Manufacturing .149**(.044)
2.571**(.270)
.094 41,509
Retail and wholesale .283**(.054)
2.920**(.338)
.108 29,212
Transport .233(.150)
4.352**(1.131)
.070 5,653
Utilities .563(.509)
2.124**(.724)
.123 2,418
Other -.120(.093)
1.243*(.559)
.116 13,771
Data are for 1996-2000. Included variables as in regression 4 of table 5 apart from sector fixed effects.Variable definitions and data sources are given in Appendix A. Heteroskedasticity consistent errors aregiven in parentheses. * and ** indicate significance levels of 5 and 1 percent, respectively.

31
Table (8). Robustness checks
Panel Afs FS1 Adj-R2 N
1. Only domestic firms .561*(.260)
.068 38,107
2. Only Western European firms .171**(.048)
2.373**(.274) .071 46,649
3. Firm variables interacted withfs
1.521**(.476)
1.370**(.217)
.071 50,481
4. Weighted least squares .637**(.072)
-.045(.269)
.079 50,481
5. Weighted least squares forWestern European firms
.576**(.069)
2.452**(.337) .078 46,649
6. 5-year averages of firm data .178**(.064)
.844**(.304)
.076 24,042
7. Country fixed effects .194**(.047)
-1.154*(.584)
.086 50,481
8. Country fixed effects forWestern European firms
.162**(.048)
.526(.699) .087 46,649
9. No year fixed effects .197**(.047)
1.216**(.214)
.069 50,481
10. FS1 lagged .193**(.045)
1.239**(.262)
.071 43,359
Data are for 1996-2000. All regressions but (9) include unreported time dummies. The specificationsare based on regression (1) of table (5) apart from following changes: in regression (1) the sample isrestricted to firms for which fs is 0; in regression (2) the sample contains only firms from WesternEurope; in regression (3) all firm-level variables are interacted with fs and added to the basicregression; in regression (4) the weight in the weighted least squares is the inverse of the number ofobservations for each country in a given year; in regression (5) the weighted least squares is applied toWestern European companies only; in regression (6) observations are 5-year averages per firm; inregression (7) country fixed effects are included; in regression (8) the former regression is applied toWestern European companies only; in regression (9) time fixed effects are excluded; in regression (10),FS1 is replaced by its first lagged value. Detailed variable definitions and data sources are given inAppendix A. Heteroskedasticity consistent errors are given in parentheses. * and ** indicatesignificance levels of 5 and 1 percent, respectively.

32
Panel Bfs FS2 Adj-R2 N
1. Only domestic firms 2.568**(.216)
.072 38,107
2. Only Western European firms .144**(.049)
3.309**(.214) .075 46,649
3. Firms variables interactedwith fs
1.551**(.477)
2.556**(.181)
.074 50,481
4. Weighted least squares .642**(.072)
-.134(.191)
.079 50,481
5. Weighted least squares forWestern European firms
.571**(.069)
2.630**(.245) .081 46,649
6. 5-year averages of firm data .137*(.064)
2.036**(.243)
.079 24,042
7. Country fixed effects .189**(.047)
-.226(.465)
.086 50,481
8. Country fixed effects forWestern European firms
.162**(.048)
.814(.560) .088 46,649
9. No year fixed effects .154**(.047)
2.528**(.180)
.073 50,481
10. FS2 lagged .147**(.051)
2.377**(.202)
.074 43,359
Data are for 1996-2000. All regressions but (9) include unreported time dummies. The specificationsare based on regression (2) of table (5) apart from following changes: in regression (1) the sample isrestricted to firms for which fs is 0; in regression (2) the sample contains only firms from WesternEurope; in regression (3) all firm-level variables are interacted with fs and added to the basicregression; in regression (4) the weight in the weighted least squares is the inverse of the number ofobservations for each country in a given year; in regression (5) the weighted least squares is applied toWestern European companies only; in regression (6) observations are 5-year averages per firm; inregression (7) country fixed effects are included; in regression (8) the former regression is applied toWestern European companies only; in regression (9) time fixed effects are excluded; in regression (10),FS2 is replaced by its first lagged value. Detailed variable definitions and data sources are given inAppendix A. Heteroskedasticity consistent errors are given in parentheses. * and ** indicatesignificance levels of 5 and 1 percent, respectively.

33
Panel Cfd FS3 Adj-R2 N
1. Only domestic firms .736**(.218)
.081 83,512
2. Only Western European firms .149**(.033)
2.295**(.229) .082 95,257
3. Firm variables interacted withfd
1.381**(.333)
1.422**(.193)
.083 102,138
4. Weighted least squares .505**(.083)
.446(.616)
.089 102,138
5. Weighted least squares forWestern European firms
.545**(.063)
2.226**(.356) .083 95,257
6. 5-year averages of firm data .143**(.045)
1.663**(.294)
.090 42,830
7. Country fixed effects .176*(.080)
-1.296(.744)
.096 102,138
8. Country fixed effects forWestern European firms
.152**(.033)
-.609(.427) .096 95,257
9. No year fixed effects .167**(.032)
1.030**(.183)
.081 102,138
10. FS3 lagged .176**(.035)
1.535**(.260)
.083 86,897
Data are for 1996-2000. All regressions but (9) include unreported time dummies. The specificationsare based on regression (3) of table (5) apart from following changes: in regression (1) the sample isrestricted to firms for which fd is 0; in regression (2) the sample contains only firms from WesternEurope; in regression (3) all firm-level variables are interacted with fd and added to the basicregression; in regression (4) the weight in the weighted least squares is the inverse of the number ofobservations for each country in a given year; in regression (5) the weighted least squares is applied toWestern European companies only; in regression (6) observations are 5-year averages per firm; inregression (7) country fixed effects are included; in regression (8) the former regression is applied toWestern European companies only; in regression (9) time fixed effects are excluded; in regression (10),FS3 is replaced by its first lagged value. Detailed variable definitions and data sources are given inAppendix A. Heteroskedasticity consistent errors are given in parentheses. * and ** indicatesignificance levels of 5 and 1 percent, respectively.

34
Panel Dfd FS4 Adj-R2 N
1. Only domestic firms 2.727**(.216)
.083 83,512
2. Only Western European firms .144**(.033)
3.607**(.615) .084 95,257
3. Firms variables interactedwith fd
1.404**(.333)
2.752**(.192)
.085 102,138
4. Weighted least squares .490**(.082)
.915*(.451)
.089 102,138
5. Weighted least squares forWestern European firms
.544**(.064)
2.512**(.287) .085 95,257
6. 5-year averages of firm data .141**(.045)
2.536**(.286)
.091 42,830
7. Country fixed effects .171**(.032)
-.808*(.368)
.096 102,138
8. Country fixed effects forWestern European firms
.149**(.033)
.266(.422) .096 95,257
9. No year fixed effects .152**(.032)
2.491**(.190)
.083 102,138
10. FS4 lagged .166**(.035)
2.786**(.219)
.085 86,897
Data are for 1996-2000. All regressions but (9) include unreported time dummies. The specificationsare based on regression (4) of table (5) apart from following changes: in regression (1) the sample isrestricted to firms for which fd is 0; in regression (2) the sample contains only firms from WesternEurope; in regression (3) all firm-level variables are interacted with fd and added to the basicregression; in regression (4) the weight in the weighted least squares is the inverse of the number ofobservations for each country in a given year; in regression (5) the weighted least squares is applied toWestern European companies only; in regression (6) observations are 5-year averages per firm; inregression (7) country fixed effects are included; in regression (8) the former regression is applied toWestern European companies only; in regression (9) time fixed effects are excluded; in regression (10),FS4 is replaced by its first lagged value. Detailed variable definitions and data sources are given inAppendix A. Heteroskedasticity consistent errors are given in parentheses. * and ** indicatesignificance levels of 5 and 1 percent, respectively.

35
Figure (1). The tax burden and foreign ownership
Part A: FS1
The Netherlands
Romania
Greece
Poland
Italy
Bulgaria
Germany
Belgium
AustriaDenmark
Portugal
Spain
United Kingdom
France
Hungary
CroatiaFinland
Norway
Sweden
0
5
10
15
20
25
30
35
40
45
50
0 0,5 1 1,5 2 2,5 3 3,5 4Tax burden (%)
FS1
(%)
Data for FS1 and the tax burden are averages of yearly averages. FS1 for a given country in a givenyear is only computed if there are at least 35 observations. In that case the corresponding tax burden iscomputed as well. Detailed variable definitions and data sources are given in Appendix A.
Part B: FS2.
SwedenFinland
Croatia
NorwayFrance
United Kingdom
SpainPortugal
DenmarkAustria
GermanyPoland
Bulgaria
Romania Greece
ItalyBelgium The Netherlands
Hungary
0
10
20
30
40
50
60
70
80
90
0 0,5 1 1,5 2 2,5 3 3,5 4Tax Burden (%)
FS2
(%)
Data for FS2 and the tax burden are averages of yearly averages. FS2 for a given country in a givenyear is only computed if there are at least 35 observations. In that case the corresponding tax burden iscomputed as well. Detailed variable definitions and data sources are given in Appendix A.

36
Part C : FS3
Sweden
Norway
FinlandCroatia
Hungary
FranceUnited Kingdom
SpainPortugal
Denmark
Austria
Belgium Germany
Bulgaria
ItalyPoland
Greece
Romania
The Netherlands
Switzerland
Luxembourg
Latvia
Czech Rep.
Lithuania
Former Yugoslavia
0
5
10
15
20
25
30
35
40
45
50
0 0,5 1 1,5 2 2,5 3 3,5 4 4,5Tax burden (%)
FS3
(%)
Data for FS3 and the tax burden are averages of yearly averages. FS3 for a given country in a givenyear is only computed if there are at least 35 observations. In that case the corresponding tax burden iscomputed as well. Detailed variable definitions and data sources are given in Appendix A.
Part D: FS4
Hungary The Netherlands
Belgium Italy
Greece
Romania
Bulgaria
Poland
Germany
AustriaDenmark
Portugal
Spain
United KingdomFrance
NorwayCroatia
FinlandSweden
Switzerland
Luxembourg
LatviaCzech Rep.
Lithuania
Former Yugoslavia
0
10
20
30
40
50
60
0 0,5 1 1,5 2 2,5 3 3,5 4 4,5Tax Burden (%)
FS4
(%)
Data for FS4 and the tax burden are averages of yearly averages. FS4 for a given country in a givenyear is only computed if there are at least 35 observations. In that case the corresponding tax burden iscomputed as well. Detailed variable definitions and data sources are given in Appendix A.

37
Appendix A. Variable definitions and data sources
Data sources
Most firm-level data is from the January 2001 version of the AMADEUS �Top200,000� Database compiled by Bureau Van Dijk Electronic Publishing. Thisdatabase contains 241,312 entries of financial statements for private and also publicfirms in 34 European countries. Firms are included if they meet one of three criteriaregarding the magnitude of operating revenues, total assets and the number ofemployees.21 Van Dijk states that 95% of the companies in each country that meet atleast one of the three criteria are included. The 2001 database provides financialaccounts for our 1996-2000 sample period. As a rule, bankrupt companies are kept inthe database for 5 more years so that the 2001 database includes firms that wentbankrupt in the 1996-2000 period. The database provides a NACE rev1-3-digit sectorcode for each firm. Van Dijk makes use of company reports, reports from officialbodies, and of data provided by associated information providers such as auditingcompanies and national statistical offices. The information is checked andsupplemented by way of mailings and phone calls to companies and the reading ofcompany web-sites and press reports. The source of the macro data used in this studyis AMECO (DG Economic and Financial Affairs, European Commission).
Data construction and definitionsOwnership information for the year 2000 is provided in the January 2001
database. Some information on ownership is available for about 80% of thecompanies. Ownership data for the years 1996 to 1999 are culled from the Januaryversions of the databases for the years 1997 through 2000. Amadeus provides data ondirect owners and in some instances also on ultimate owners. Our ownership variablesare based on direct ownership information, as there is little information on how thesedirect owners may differ from any ultimate owners.22 Shareholders with the samenationality as the firm are labeled domestic and shareholders with a differentnationality are foreign. For many firms, the nationality of some portion of theshareholders remains unknown, because not all shareholders are listed and thenationality of some of the listed shareholders is not provided.
For firms where we can trace the nationality of all shareholders, we define fsto be the portion of the shares owned by foreign shareholders. On an aggregate basis,FS1 then is the equal-weighted foreign ownership share, while FS2 is the asset-weighted foreign ownership share. Full ownership information may not be necessaryto be able to label firms as either foreign or domestic. Countries in fact typicallyclassify investments to be FDI, if the concerned firm is, say, at least 10 percentforeign-owned. Analogously, we consider an alternative classification where a firm islabeled foreign if 50 percent or more of the shares are foreign-owned, while the firmis domestic if more than 50 percent of the shares is domestically owned. On a nationalbasis, we then define FS3 to be the share of foreign firms in the total, while FS4 is theassets of foreign firms as a share of total assets. In all instances, an aggregate foreign 21 For the UK, Germany, France, Italy, Ukraine and the Russian Federation, the inclusion thresholdsare € 15 million in operating revenues, € 30 million in assets, and 150 employees. For other countries,they are € 10 million in operating revenues, € 20 million in assets and 100 employees.22 As we focus on foreign ownership, this distinction would only matter if a direct foreign ownerfronted for an ultimate domestic owner, and vice versa.

38
ownership measure for a given country in a particular year is only computed if thereare 35 observation on which to base the calculation.
Definitions of other variables used in the regressions:
• Tax burden is the ratio of the tax accrued to total assets in percent.• Log assets is the log of the deflated total assets (in thousands of euros). The
deflator is GDP deflator which puts 1995 deflated GDP equal to 1995 currentGDP.
• Fixed assets/total assets is the ratio of the fixed assets to total assets.• Short-term debt/total assets is the ratio of the current liabilities to total assets.• Long-term debt/total debt is the ratio of the non-current liabilities to total assets.• Sector fixed effects distinguish 8 sectors based on the 3-digit NACE code:
Agriculture and fisheries (NACE 0 to 146), Manufacturing (NACE 149 to 373),Utilities (NACE 390 to 420), Construction (NACE 440 to 460), Retail andwholesale (NACE 490 to 560), Transport and communications (NACE 590 to649), Financial services (NACE 649 to 675), and Other (NACE 699 to 749).Firms in essentially public sectors (NACE equal to or above 749) are excludedfrom our sample.
• Log GDP is the log of deflated GDP in billions of ecus or euros.• Log per capita GDP is the log of the deflated GDP per capita in thousands of
ecus or euros.• Inflation is the percentage change in the Harmonized Consumer Price Index.
Sample constructionFrom Amadeus, we first selected all entries with some ownership information.
This yielded 197,114 entries for the 1996-2000 period. We then excluded entries offirms with consolidated statements to prevent �double counting� of a subsidiary as anentity in itself and as owned by a firm with a consolidated statement. Also, entries offirms in primarily public sectors were excluded. This yielded 64,379 observationswith full ownership information (or ownership information exceeding 99.5 percent ofthe shares given rounding errors). For a larger set of 128,314 observations, we coulddetermine that the firm is either in majority foreign owned or domestically owned.Next, we looked for outliers for the tax burden variable taken to be cases where taxesaccrued exceeded assets (or the taxes returned would be more than assets). Theseoutliers represent unconventional companies with very few assets or data errors. Forthe regression sample with full ownership information, we eliminated 14 such outlierswhere in all cases taxes exceeded assets. The samples were further reduced onaccount of missing variables to yield 50,481 observations in regressions (1) and (2) ofTable (5) and 102,138 observations in regressions (3) and (4).
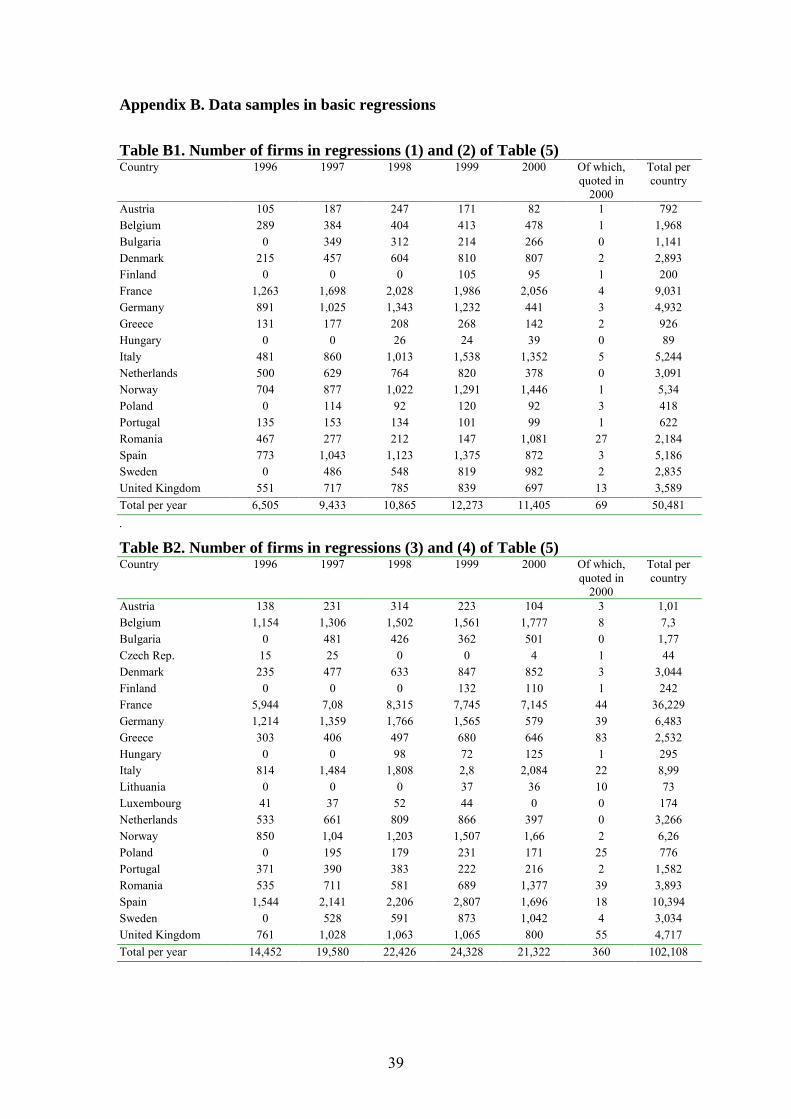
39
Appendix B. Data samples in basic regressions
Table B1. Number of firms in regressions (1) and (2) of Table (5)Country 1996 1997 1998 1999 2000 Of which,
quoted in2000
Total percountry
Austria 105 187 247 171 82 1 792Belgium 289 384 404 413 478 1 1,968Bulgaria 0 349 312 214 266 0 1,141Denmark 215 457 604 810 807 2 2,893Finland 0 0 0 105 95 1 200France 1,263 1,698 2,028 1,986 2,056 4 9,031Germany 891 1,025 1,343 1,232 441 3 4,932Greece 131 177 208 268 142 2 926Hungary 0 0 26 24 39 0 89Italy 481 860 1,013 1,538 1,352 5 5,244Netherlands 500 629 764 820 378 0 3,091Norway 704 877 1,022 1,291 1,446 1 5,34Poland 0 114 92 120 92 3 418Portugal 135 153 134 101 99 1 622Romania 467 277 212 147 1,081 27 2,184Spain 773 1,043 1,123 1,375 872 3 5,186Sweden 0 486 548 819 982 2 2,835United Kingdom 551 717 785 839 697 13 3,589Total per year 6,505 9,433 10,865 12,273 11,405 69 50,481.
Table B2. Number of firms in regressions (3) and (4) of Table (5)Country 1996 1997 1998 1999 2000 Of which,
quoted in2000
Total percountry
Austria 138 231 314 223 104 3 1,01Belgium 1,154 1,306 1,502 1,561 1,777 8 7,3Bulgaria 0 481 426 362 501 0 1,77Czech Rep. 15 25 0 0 4 1 44Denmark 235 477 633 847 852 3 3,044Finland 0 0 0 132 110 1 242France 5,944 7,08 8,315 7,745 7,145 44 36,229Germany 1,214 1,359 1,766 1,565 579 39 6,483Greece 303 406 497 680 646 83 2,532Hungary 0 0 98 72 125 1 295Italy 814 1,484 1,808 2,8 2,084 22 8,99Lithuania 0 0 0 37 36 10 73Luxembourg 41 37 52 44 0 0 174Netherlands 533 661 809 866 397 0 3,266Norway 850 1,04 1,203 1,507 1,66 2 6,26Poland 0 195 179 231 171 25 776Portugal 371 390 383 222 216 2 1,582Romania 535 711 581 689 1,377 39 3,893Spain 1,544 2,141 2,206 2,807 1,696 18 10,394Sweden 0 528 591 873 1,042 4 3,034United Kingdom 761 1,028 1,063 1,065 800 55 4,717Total per year 14,452 19,580 22,426 24,328 21,322 360 102,108
40
Appendix C. Foreign ownership data for a same-firm sample
The four aggregate foreign ownership measures, FS1, FS2, FS3 and FS4,where available, tend to be based on different firms in different years. A main reasonfor this is that firms come and go. Another reason is that the sample of firms includingin the Amadeus database may not be the same each year (one reason for this is that thedatabase selects firms based on minimum turnover, total assets and employment). Allthe same, it is interesting to see how the foreign ownership share tends to develop forthe same firms over time. This we do by constructing an alternative set of fourcountry-level foreign ownership variables based on firms for which we haveownership information over the entire 1996-2000 period. By definition, these are thelonger established and more stable firms. These alternative foreign ownershipmeasures, dubbed same-firm FS1 through FS4, again are only constructed for a givencountry and year if they can be based on at least 35 firms. Corresponding to Tables (1)and (2), information on same-firm FS1 through FS4 is contained in Tables C1 and C2.
Same-firm FS1 and FS2 are available for only for 10 countries, while same-firm values of FS3 and FS4 can be calculated for 13 countries. There are two majordifferences with the measures reported in the main text. First, the same-firm measuresby and large are significantly lower, suggesting that long-established, stable firmstend to be relatively highly domestically owned. This can reflect that foreign-ownedfirms are more prone to business failures or on average more recently established, butmore likely that they are more frequently involved in business restructurings. Second,changes in the same-firm measure of foreign ownership over time tend to be rathersmall. Hence, a relatively small part of the overall variation in foreign ownershipappears to be attributable to changes in the degree of foreign ownership in stable,long-established firms. A reason may simply be that the purchase of a domestic firmby a foreign firm leads to the demise of the domestic firm as a legal entity. In thatinstance, a foreign acquisition would not be reflected in our same-firm foreignownership measures. Be that as it may, foreign ownership, as measured by the same-firm FS2, decreased on average 0.7 percent between 1996 and 2000 in Europe, whilethe same firm FS4 increased by 2.2 percent over this period.
Table C3 presents a regression parallel to regression (2) in Table (5) using thesame-firm FS2 measure of foreign ownership. Such a regression is appropriate, ifpolicy makers base their best guess of the extent of foreign ownership by observingthe relatively long-standing and stable companies on which the same-firm FS2measure is based. The regression includes 42,415 observations on firms from 10countries. The estimates for the coefficients on fs and FS2 are statistically significant,even if they are somewhat smaller than the corresponding estimates in regression (2)of Table (5). Table C3 presents the results of robustness checks parallel to Panel B ofTable (8). A difference is the addition of a regression based on only those firms usedto calculate same-firm FS2 variable. This latter regression includes only 5,119observations and the FS2 is only significant at the 10 percent level.

41
Table C1. Foreign ownership variables FS1 and FS2 based on same firms in different yearsSame-firm data 2000 Average 1996-2000 Change in yearly average
between 1996 and 2000Countries # firms FS1 FS2 # firms FS1 FS2 FS1 FS2
Austria 7 n.a. n.a. 7 n.a. n.a. n.a. n.a.Belgium 97 33.0 33.8 97 33.0 34.8 0.0 -2.0Bulgaria 50 2.5 1.2 50 1.6 0.8 1.5 0.5Czech Rep. 29 n.a. n.a. 29 n.a. n.a. n.a. n.a.Denmark 60 43.3 20.2 60 38.3 21.0 10.0 7.6France 228 23.4 11.0 228 25.0 16.2 -3.5 -6.1Germany 66 9.1 9.2 66 7.9 5.8 1.5 4.6Greece 30 n.a. n.a. 30 n.a. n.a. n.a. n.a.Italy 63 25.6 32.0 63 23.7 30.5 1.7 -3.1Netherlands 47 8.5 25.9 47 8.3 16.6 -2.7 -2.6Norway 392 18.5 15.3 392 16.3 16.2 2.7 -1.3Poland 1 n.a. n.a. 1 n.a. n.a. n.a. n.a.Portugal 1 n.a. n.a. 1 n.a. n.a. n.a. n.a.Romania 9 n.a. n.a. 9 n.a. n.a. n.a. n.a.Spain 86 12.1 7.9 86 12.3 8.0 -1.8 -5.8Switzerland 1 n.a. n.a. 1 n.a. n.a. n.a. n.a.United Kingdom 82 15.1 8.8 82 16.0 8.7 -2.4 1.2
Europe 1,249 19.0 16.5 1,249 18.2 15.9 0.7 -0.7European Union 767 21.2 18.6 767 20.6 17.7 0.3 -0.8Western Europe 1,160 20.8 18.2 1,160 20.1 17.5 0.6 -0.8Eastern Europe 89 2.5 1.2 89 1.6 0.8 1.5 0.5FS1 and FS2 are the equal-weighted and asset weighted foreign ownership in percent. These foreign ownership measures are based on firms for which domestic and foreign ownership are fullyknown and they are computed for those firms that appear in each of the years 1996-2000 if there are at least 35 of these (see appendix A for details). The average for 1996-2000 is computedusing the available years. The changes in between 1996 and 2000 are in absolute levels. Western Europe is the EU-15 where available plus Norway and Switzerland.

42
Table C2. Foreign ownership variables FS3 and FS4 based on same firms in different yearsSame-firm data 2000 Average 1996-2000 Change in yearly average
between 1996 and 2000Countries # firms FS3 FS4 # firms FS3 FS4 FS3 FS4
Austria 8 n.a. n.a. 8 n.a. n.a. n.a. n.a.Belgium 765 7.6 19.6 765 7.8 18.9 -0.3 2.3Bulgaria 74 4.1 0.9 74 1.4 0.3 4.1 0.9Czech Rep. 164 29.3 20.3 164 29.3 18.1 2.4 3.4Denmark 67 43.3 22.8 67 39.1 24.3 9.0 5.2France 1,792 16.0 15.6 1,792 15.2 16.2 1.1 0.4Germany 118 6.8 6.0 118 6.8 4.9 0.0 1.3Greece 183 32.8 35.4 183 31.3 38.8 2.2 -5.8Italy 139 27.3 41.9 139 22.4 26.3 5.8 17.1Luxembourg 4 n.a. n.a. 4 n.a. n.a. n.a. n.a.Netherlands 53 11.3 9.3 53 10.9 13.5 -1.9 -10.7Norway 498 16.9 15.0 498 14.9 17.4 2.4 -3.7Poland 4 n.a. n.a. 4 n.a. n.a. n.a. n.a.Portugal 5 n.a. n.a. 5 n.a. n.a. n.a. n.a.Romania 184 19.0 39.1 184 12.1 30.0 11.4 20.4Spain 193 7.8 4.9 193 8.8 5.7 -2.1 -4.1Switzerland 1 n.a. n.a. 1 n.a. n.a. n.a. n.a.United Kingdom 94 17.0 8.4 94 17.9 8.7 -2.1 0.8
Europe 4,346 18.4 18.3 4,346 16.7 17.1 2.5 2.1European Union 3,421 18.9 18.2 3,421 17.8 17.5 1.3 0.7Western Europe 3,920 18.7 17.9 3,920 17.5 17.5 1.4 0.3Eastern Europe 426 17.4 20.1 426 14.2 16.1 6.0 8.2FS3 and FS4 are the equal-weighted and asset-weighted foreign ownership in percent. A firm that is at least 50 percent foreign-owned is considered foreign, while a firm that is more than 50percent domestically owned is considered domestic. FS3 and FS4 are computed only for those firms that appear in each of the years 1996-2000 if there are at least 35 of these (see appendix Afor details). The average for 1996-2000 is computed using the available years. The changes in between 1996 and 2000 are in absolute levels. Western Europe is the EU-15 where available plusIceland, Norway and Switzerland.

43
Table C3. Basic regression with FS2 based on the same-firm sample
Log assets -.244**(.017)
Fixed assets/total assets -2.943**(.115)
Short-term debt/total assets -3.954**(.124)
Long-term debt/total assets -3.469**(.125)
Agriculture 1.555**(.270)
Construction -.588**(.080)
Financial services -.194(.144)
Retail and wholesale -.134**(.047)
Transport -.192*(.089)
Utilities .438**(.091)
Other -.030(.071)
Log GDP .236**(.022)
Log per capita GDP .176**(.043)
Inflation .006**(.001)
fs .098(.051)
Same-Firm FS2 .988**(.232)
Observations 42,415
Adj-R2 .070
Data are for 1996-2000. The regression includes unreported time dummies. FS2 is computed usingfirms appearing consistently during the 5-year period. Detailed variable definitions and data sources aregiven in Appendix A. Heteroskedasticity consistent errors are given in parentheses. * and ** indicatesignificance levels of 5 and 1 percent, respectively.

44
Table C4. Robustness checks with same-firm FS2 datafs FS2 Adj-R2 N
1. Only domestic firms -.013(.240)
.067 32,155
2. Only Western European firms .101*(.051)
1.123**(.234) .069 41,274
3. Firm variables interacted withfs
1.225*(.552)
1.018**(.232)
.071 42,415
4. Weighted least squares .232**(.060)
1.014**(.265)
.070 42,415
5. Weighted least squares forWestern European firms
.243**(.060)
1.468**(.268) .069 41,274
6. 5-year averages of firm data .057(.071)
.585(.326)
.077 19,376
7. Country fixed effects .073(.051)
.500(.573)
.085 42,415
8. Country fixed effects forWestern European firms
.073(.051)
.493(.571) .085 41,274
9. No year fixed effects .093(.051)
.907**(.233)
.069 42,415
10. FS2 lagged .090(.055)
.488*(.247)
.070 36,748
11. Firms with 5 years of data .383*(.154)
1.317(.717)
.066 5,119
Data are for 1996-2000. All regressions but (9) include unreported time dummies. The specificationsare based on regression (2) of table (5) apart from the fact that FS2 is constructed using only firms thatappear every year during 1996-2000 and apart following changes: in regression (1) the sample isrestricted to firms for which fs 0; in regression (2) the sample contains only firms from WesternEurope; in regression (3) all firm-level variables are interacted with fs and added to the basicregression; in regression (4) the weight in the weighted least squares is the inverse of the number ofobservations for each country in a given year; in regression (5) the weighted least squares is applied toWestern European companies only; in regression (6) observations are 5-year averages per firm; inregression (7) country fixed effects are included; in regression (8) the former regression is applied toWestern European companies only; in regression (9) time fixed effects are excluded; in regression (10)FS2 is replaced by its first lagged value; regression (11) includes only those firms on which the same-firm FS2 variable is based. Detailed variable definitions and data sources are given in Appendix A.Heteroskedasticity consistent errors are given in parentheses. * and ** indicate significance levels of 5and 1 percent, respectively.