Embed Size (px)
Citation preview
Forage analysis
Using it to design a supplementation program
2016 Tri-State Beef Conference
Dr. Jason SmithAssistant Professor and Extension Beef Cattle SpecialistDepartment of Animal ScienceUniversity of Tennessee Institute of Agriculture
Over the next 35 - 40 minutes…
Value of conducting a forage analysis
Quantify some “generic” beef cow nutrient requirements
Characteristics of supplemental feedstuffs
Identifying the most economical supplement and designing a supplementation program that works for you
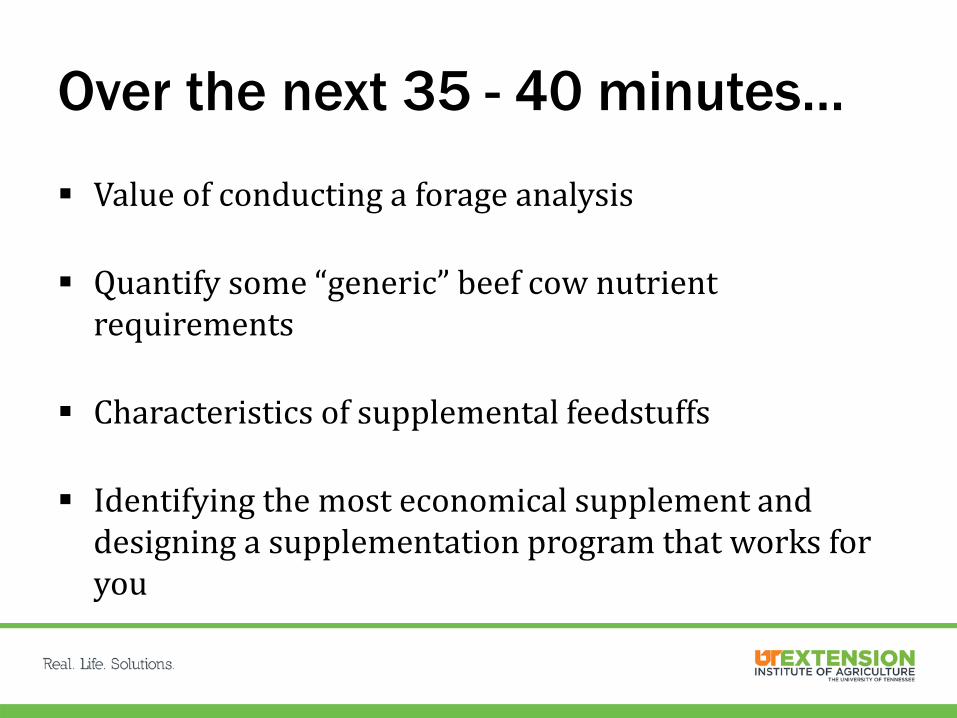
Nutritional management programs in the tri-state area
Protein/energy Minerals/vitamins
Nutritional management
Will your forages meet the nutrient requirements of your cattle?
If they won’t, you’re going to sacrifice performance
How do you know if you don’t test them?
Forage analysis Begin with a forage analysis
TN Soil, Plant, and Pest Center Beef Basic: $17.00 Beef Plus: $30.00
Very few things can yield as much of a return on investment
Shifts supplementation decisions from reactive to proactive
Can (should) be used as the first step toward developing a supplementation program that complements your forage(s)
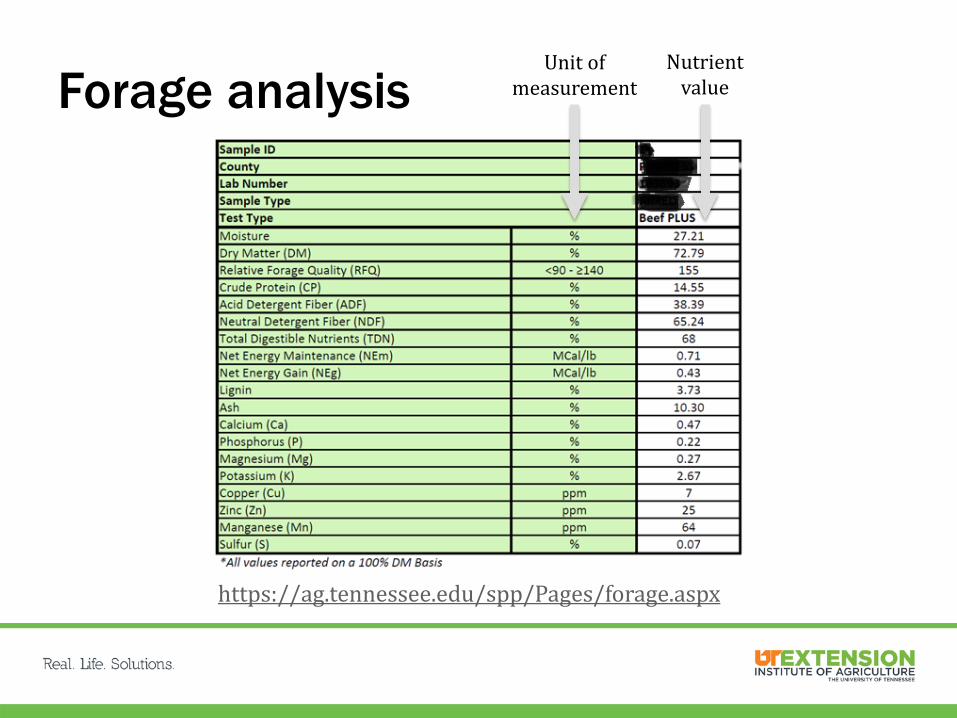
Forage analysis
https://ag.tennessee.edu/spp/Pages/forage.aspx
Unit of measurement
Nutrient value
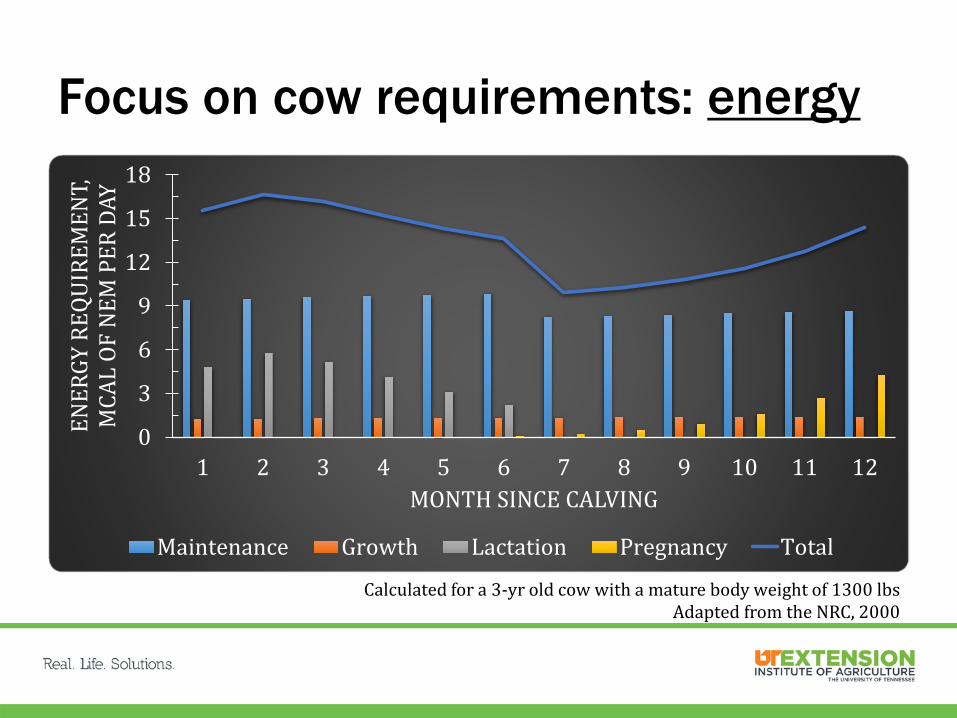
Focus on cow requirements: energy
0
3
6
9
12
15
18
1 2 3 4 5 6 7 8 9 10 11 12
ENER
GY R
EQUI
REM
ENT,
M
CAL
OF N
EM P
ER D
AY
MONTH SINCE CALVING
Maintenance Growth Lactation Pregnancy Total
Calculated for a 3-yr old cow with a mature body weight of 1300 lbsAdapted from the NRC, 2000
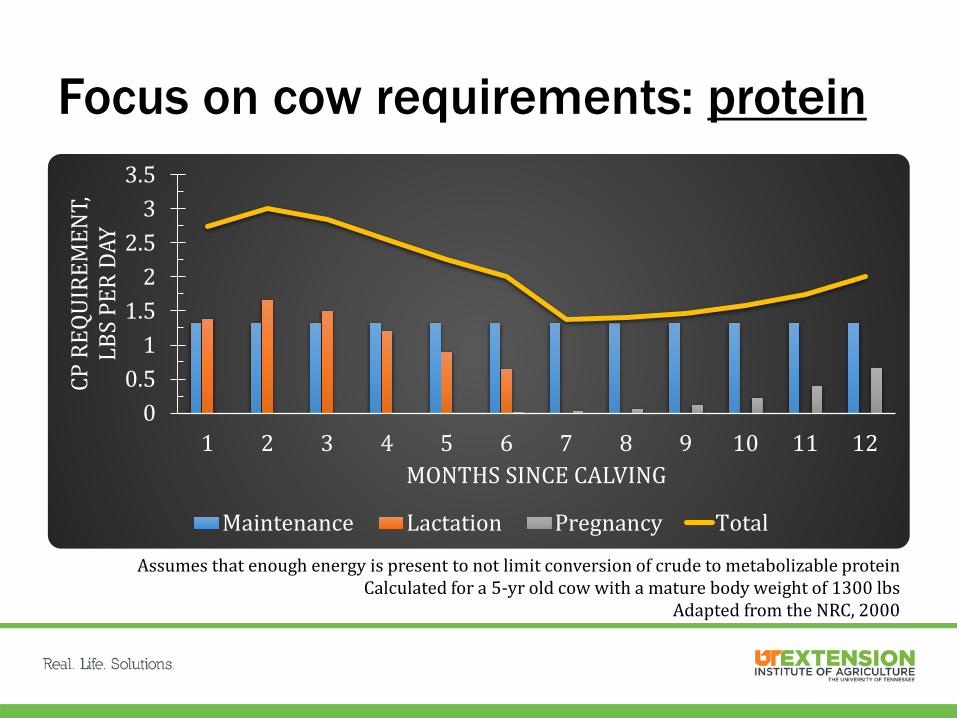
Focus on cow requirements: protein
Assumes that enough energy is present to not limit conversion of crude to metabolizable proteinCalculated for a 5-yr old cow with a mature body weight of 1300 lbs
Adapted from the NRC, 2000
00.5
11.5
22.5
33.5
1 2 3 4 5 6 7 8 9 10 11 12
CP R
EQUI
REM
ENT,
LB
S PE
R DA
Y
MONTHS SINCE CALVING
Maintenance Lactation Pregnancy Total
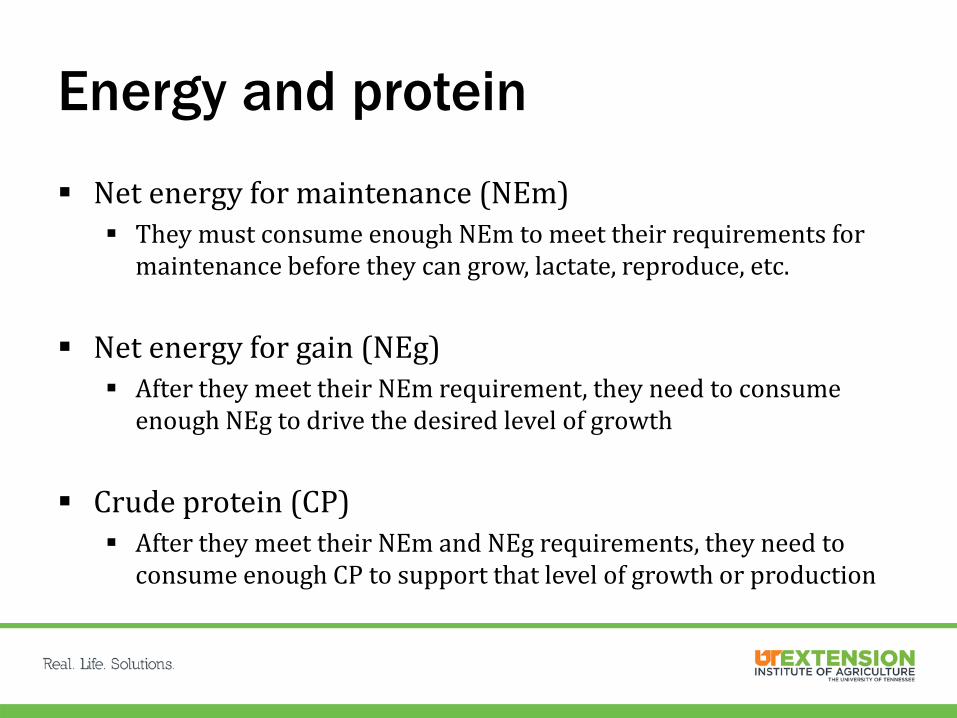
Energy and protein
Net energy for maintenance (NEm) They must consume enough NEm to meet their requirements for
maintenance before they can grow, lactate, reproduce, etc.
Net energy for gain (NEg) After they meet their NEm requirement, they need to consume
enough NEg to drive the desired level of growth
Crude protein (CP) After they meet their NEm and NEg requirements, they need to
consume enough CP to support that level of growth or production

When requirements aren’t met…
You sacrifice… Growth performance Reproduction (longevity) Health and wellbeing Carcass quality
Both direct and indirect effects Direct → the cattle whose requirements aren’t being met Indirect → their offspring (fetal programming)
Photo courtesy of Progressive Cattlemen Magazine
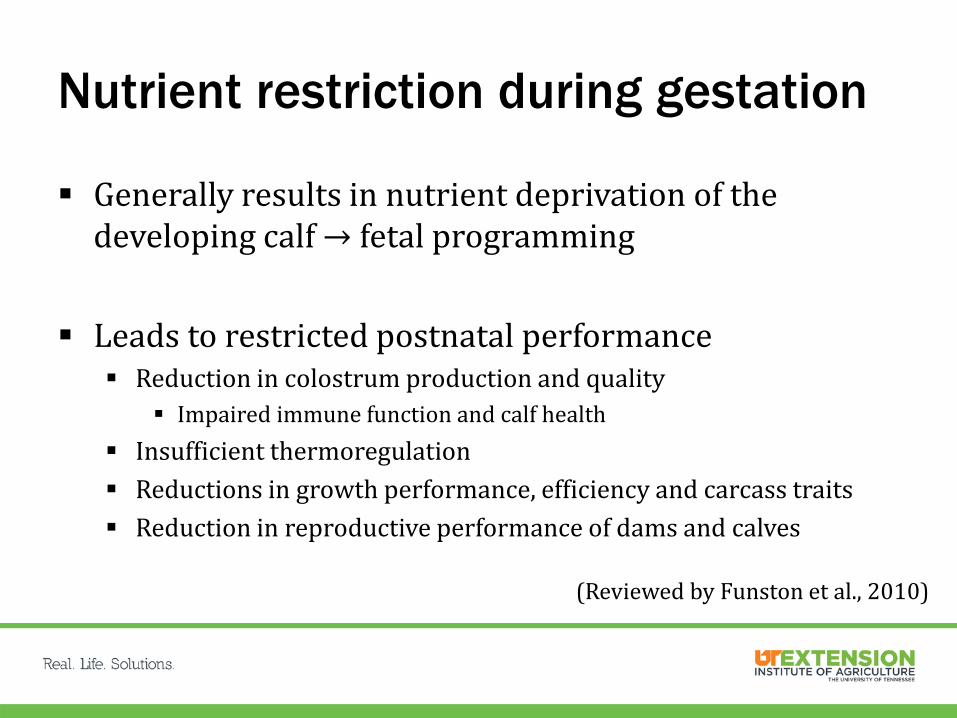
Nutrient restriction during gestation
Generally results in nutrient deprivation of the developing calf → fetal programming
Leads to restricted postnatal performance Reduction in colostrum production and quality
Impaired immune function and calf health Insufficient thermoregulation Reductions in growth performance, efficiency and carcass traits Reduction in reproductive performance of dams and calves
(Reviewed by Funston et al., 2010)
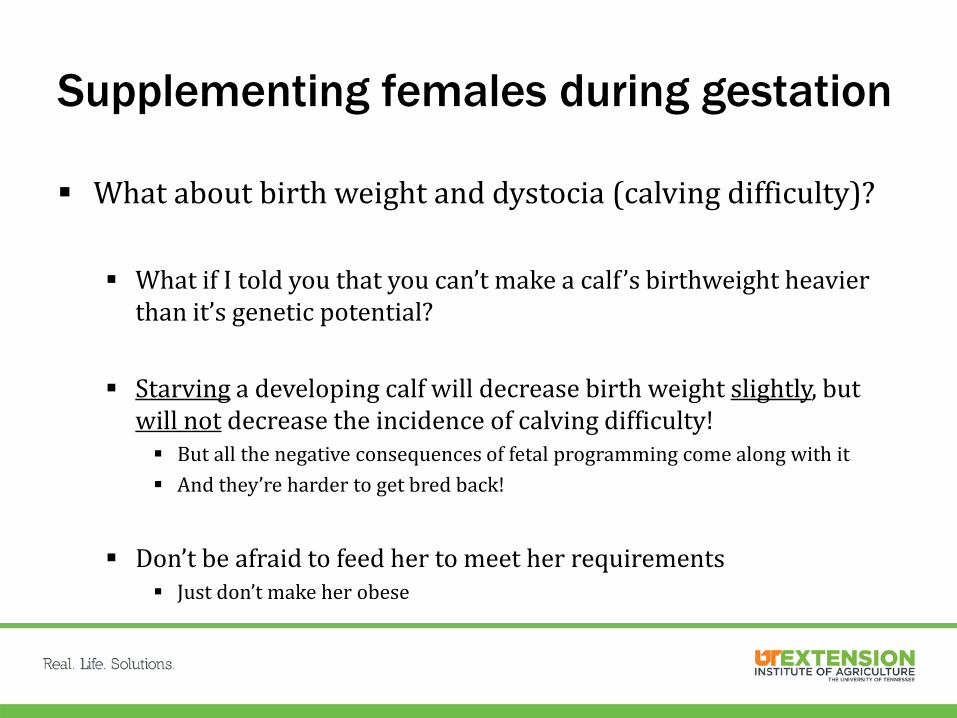
Supplementing females during gestation
What about birth weight and dystocia (calving difficulty)?
What if I told you that you can’t make a calf ’s birthweight heavier than it’s genetic potential?
Starving a developing calf will decrease birth weight slightly, but will not decrease the incidence of calving difficulty! But all the negative consequences of fetal programming come along with it And they’re harder to get bred back!
Don’t be afraid to feed her to meet her requirements Just don’t make her obese
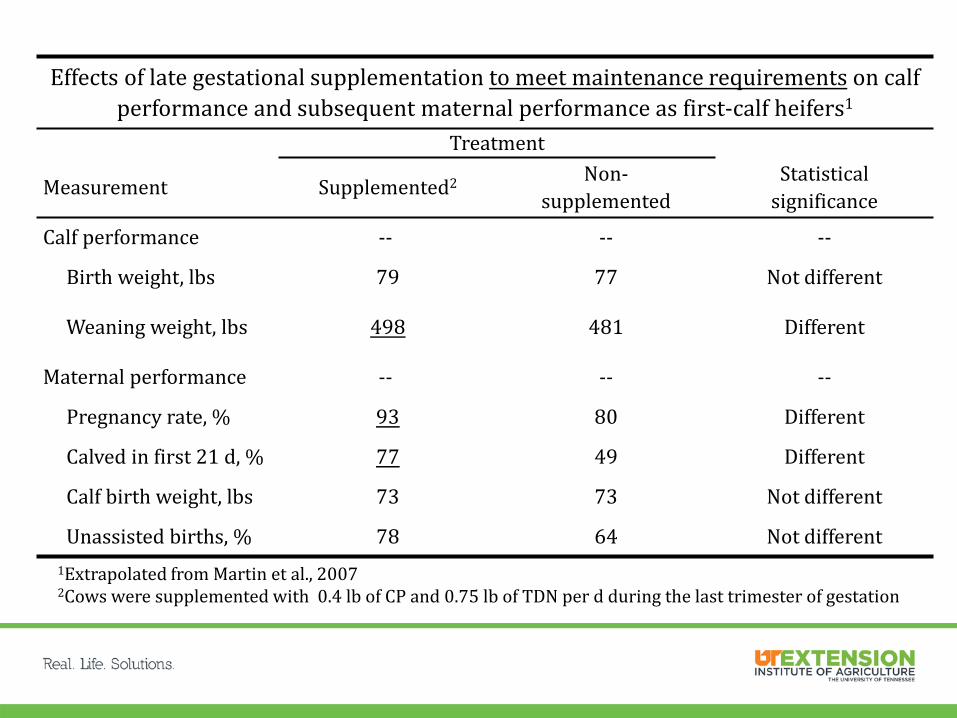
1Extrapolated from Martin et al., 20072Cows were supplemented with 0.4 lb of CP and 0.75 lb of TDN per d during the last trimester of gestation
Effects of late gestational supplementation to meet maintenance requirements on calf performance and subsequent maternal performance as first-calf heifers1
Treatment
Measurement Supplemented2 Non-supplemented
Statistical significance
Calf performance -- -- --
Birth weight, lbs 79 77 Not different
Weaning weight, lbs 498 481 Different
Maternal performance -- -- --
Pregnancy rate, % 93 80 Different
Calved in first 21 d, % 77 49 Different
Calf birth weight, lbs 73 73 Not different
Unassisted births, % 78 64 Not different
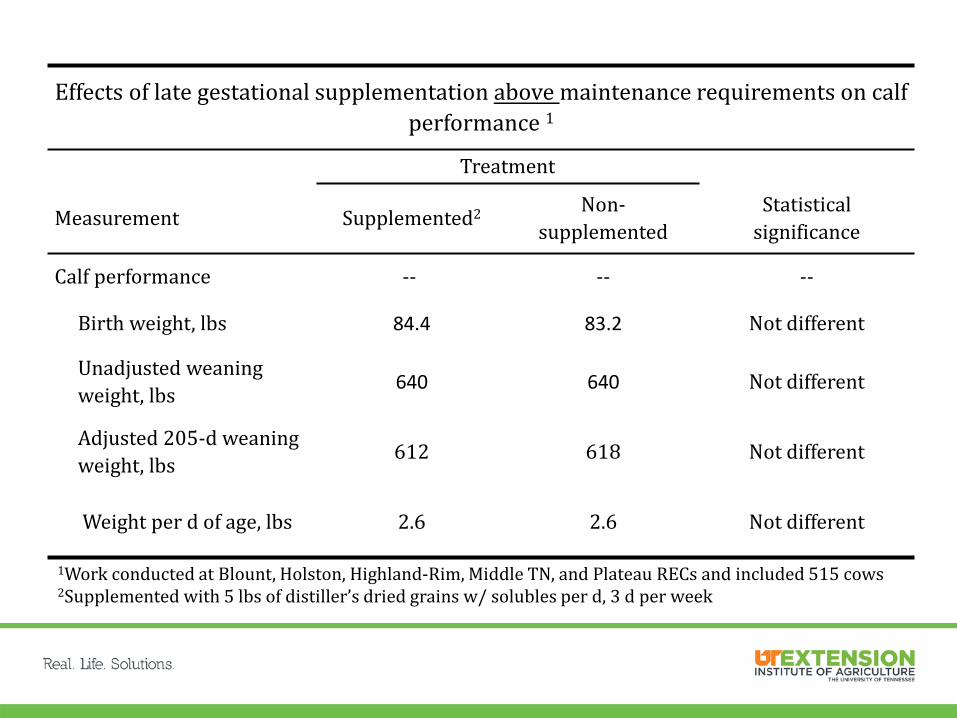
1Work conducted at Blount, Holston, Highland-Rim, Middle TN, and Plateau RECs and included 515 cows2Supplemented with 5 lbs of distiller’s dried grains w/ solubles per d, 3 d per week
Effects of late gestational supplementation above maintenance requirements on calf performance 1
Treatment
Measurement Supplemented2 Non-supplemented
Statistical significance
Calf performance -- -- --
Birth weight, lbs 84.4 83.2 Not different
Unadjusted weaningweight, lbs 640 640 Not different
Adjusted 205-d weaningweight, lbs 612 618 Not different
Weight per d of age, lbs 2.6 2.6 Not different
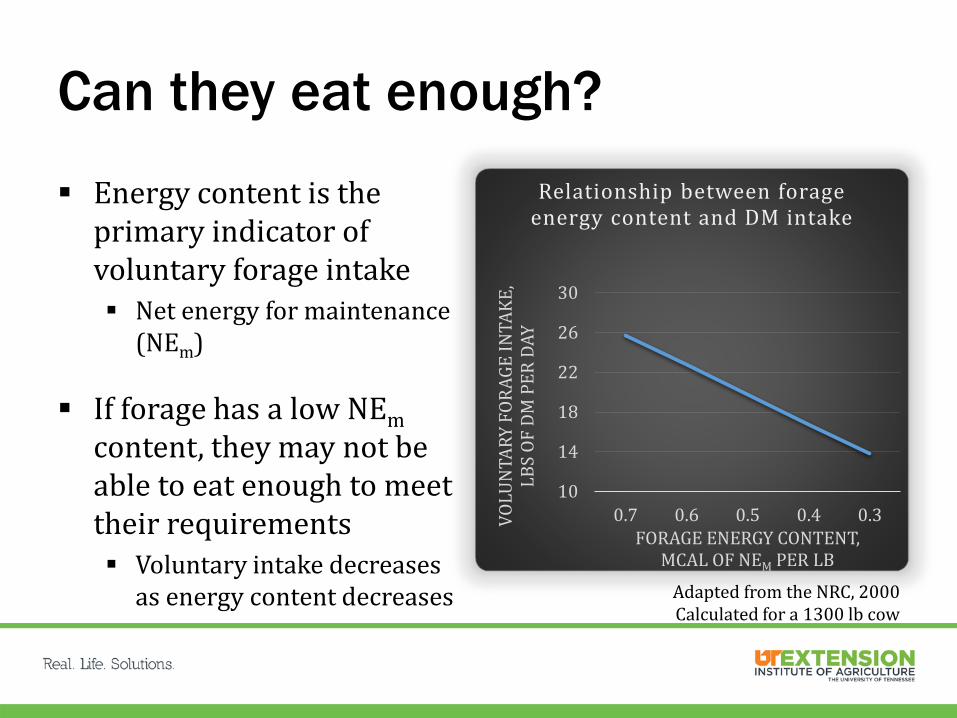
Can they eat enough?
Energy content is the primary indicator of voluntary forage intake Net energy for maintenance
(NEm)
If forage has a low NEmcontent, they may not be able to eat enough to meet their requirements Voluntary intake decreases
as energy content decreases
10
14
18
22
26
30
0.30.40.50.60.7VOLU
NTA
RY F
ORAG
E IN
TAKE
, LB
SOF
DM
PER
DAY
FORAGE ENERGY CONTENT, MCAL OF NEM PER LB
Relationship between forage energy content and DM intake
Adapted from the NRC, 2000Calculated for a 1300 lb cow
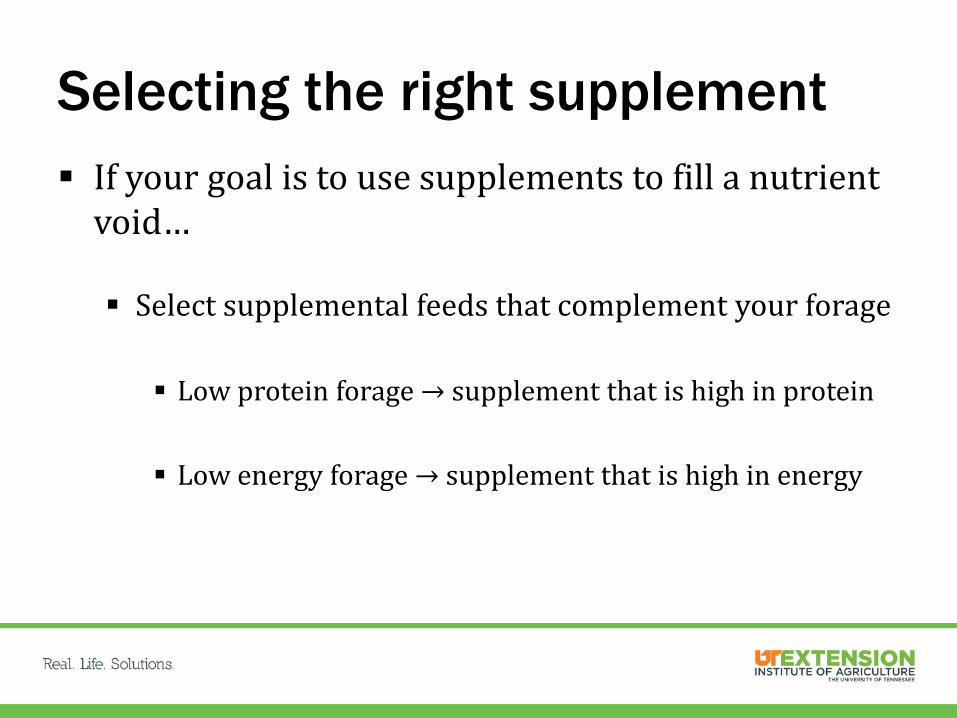
Selecting the right supplement If your goal is to use supplements to fill a nutrient
void…
Select supplemental feeds that complement your forage
Low protein forage → supplement that is high in protein
Low energy forage → supplement that is high in energy
Selecting the right supplement
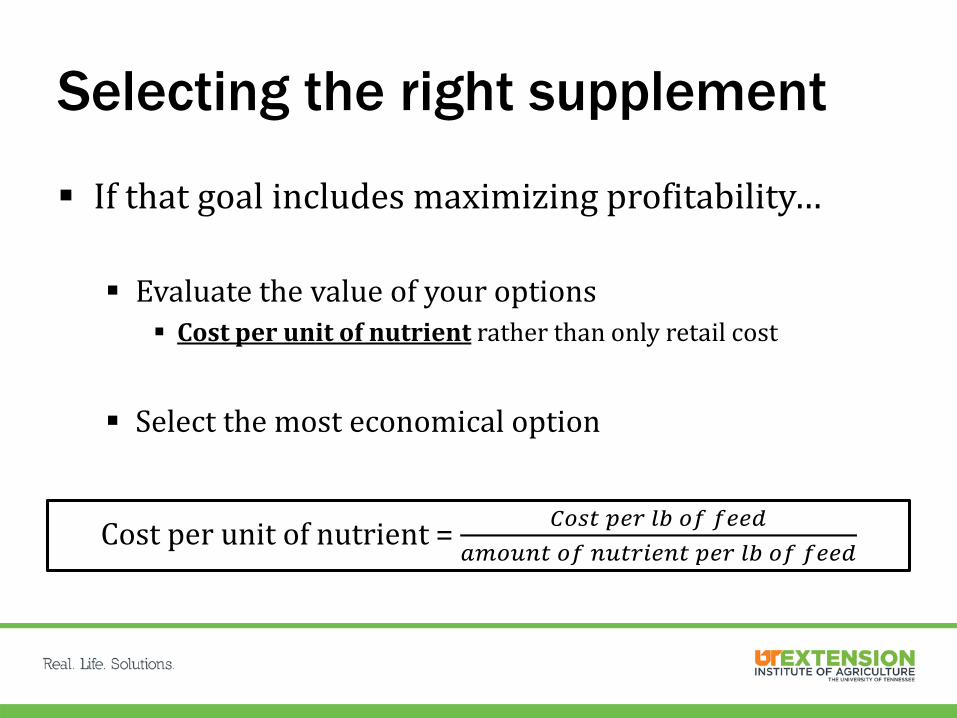
If that goal includes maximizing profitability…
Evaluate the value of your options Cost per unit of nutrient rather than only retail cost
Select the most economical option
Cost per unit of nutrient = 𝐶𝐶𝐶𝐶𝐶𝐶𝐶𝐶 𝑝𝑝𝑝𝑝𝑝𝑝 𝑙𝑙𝑙𝑙 𝐶𝐶𝑜𝑜 𝑜𝑜𝑝𝑝𝑝𝑝𝑓𝑓𝑎𝑎𝑎𝑎𝐶𝐶𝑎𝑎𝑎𝑎𝐶𝐶 𝐶𝐶𝑜𝑜 𝑎𝑎𝑎𝑎𝐶𝐶𝑝𝑝𝑛𝑛𝑝𝑝𝑎𝑎𝐶𝐶 𝑝𝑝𝑝𝑝𝑝𝑝 𝑙𝑙𝑙𝑙 𝐶𝐶𝑜𝑜 𝑜𝑜𝑝𝑝𝑝𝑝𝑓𝑓
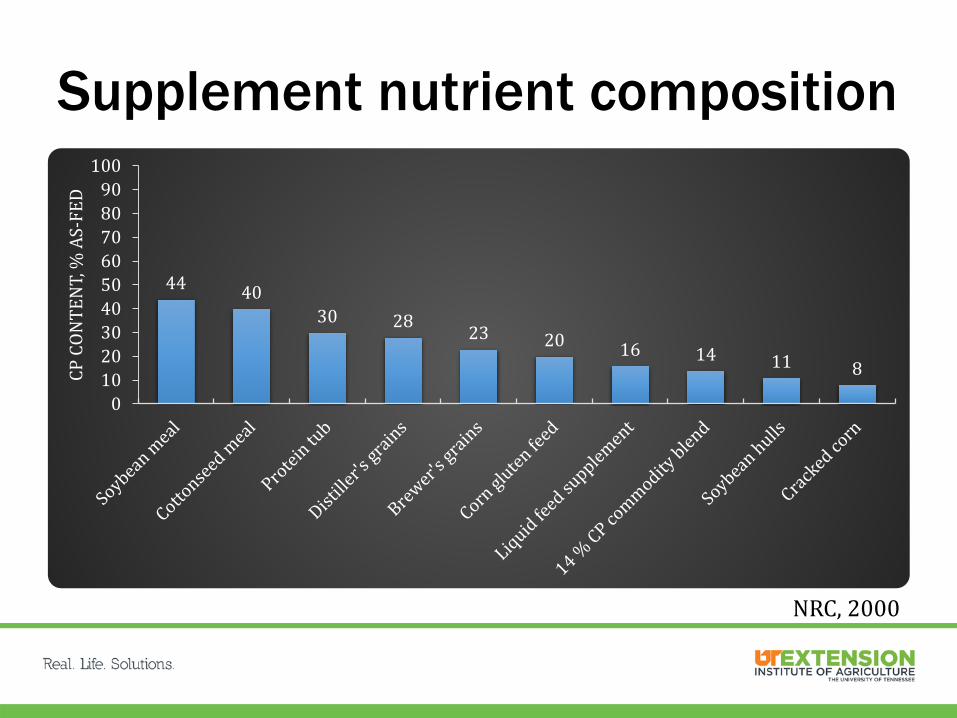
Supplement nutrient composition
44 4030 28 23 20 16 14 11 8
0102030405060708090
100
CP C
ONTE
NT,
% A
S-FE
D
NRC, 2000
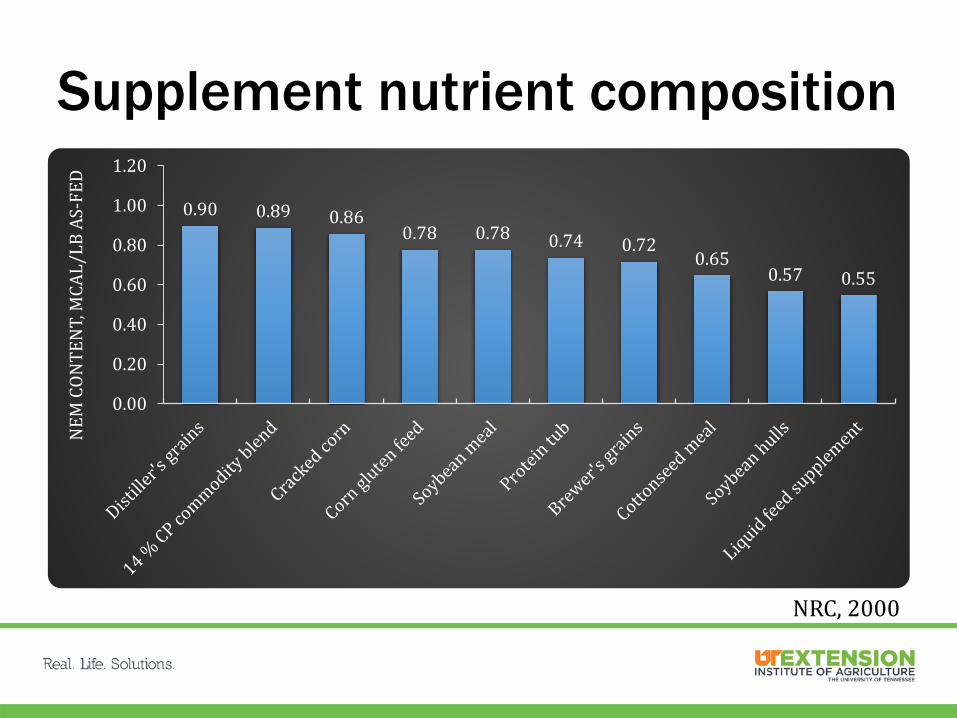
Supplement nutrient composition
0.90 0.89 0.860.78 0.78 0.74 0.72
0.650.57 0.55
0.00
0.20
0.40
0.60
0.80
1.00
1.20
NEM
CON
TEN
T, M
CAL/
LBAS
-FED
NRC, 2000
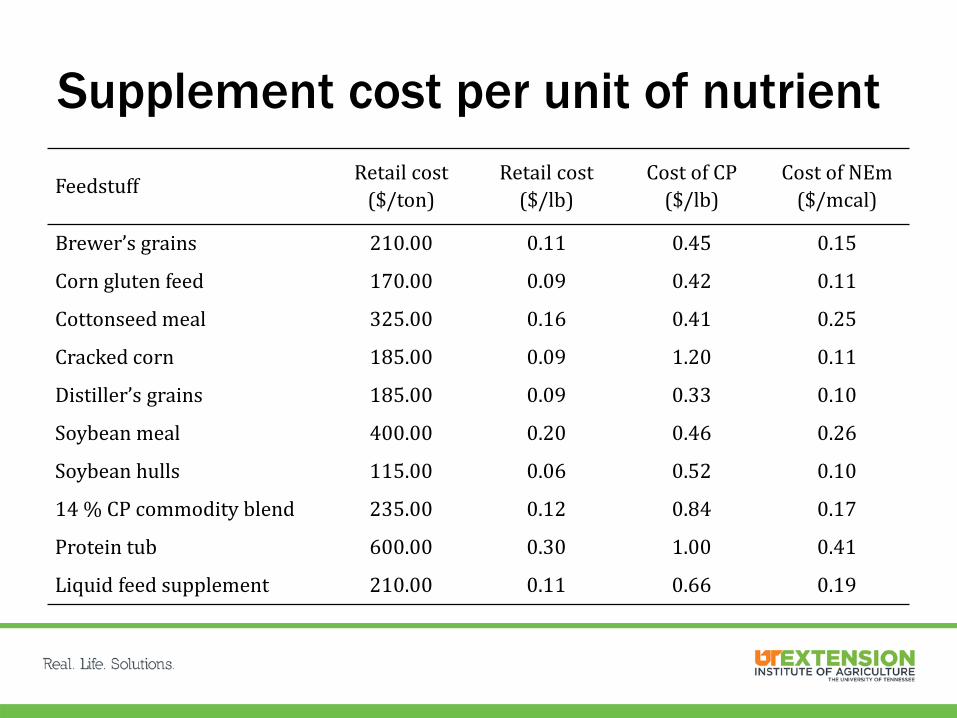
Supplement cost per unit of nutrient
Feedstuff Retail cost($/ton)
Retail cost ($/lb)
Cost of CP($/lb)
Cost of NEm($/mcal)
Brewer’s grains 210.00 0.11 0.45 0.15
Corn gluten feed 170.00 0.09 0.42 0.11
Cottonseed meal 325.00 0.16 0.41 0.25
Cracked corn 185.00 0.09 1.20 0.11
Distiller’s grains 185.00 0.09 0.33 0.10
Soybean meal 400.00 0.20 0.46 0.26
Soybean hulls 115.00 0.06 0.52 0.10
14 % CP commodity blend 235.00 0.12 0.84 0.17
Protein tub 600.00 0.30 1.00 0.41
Liquid feed supplement 210.00 0.11 0.66 0.19
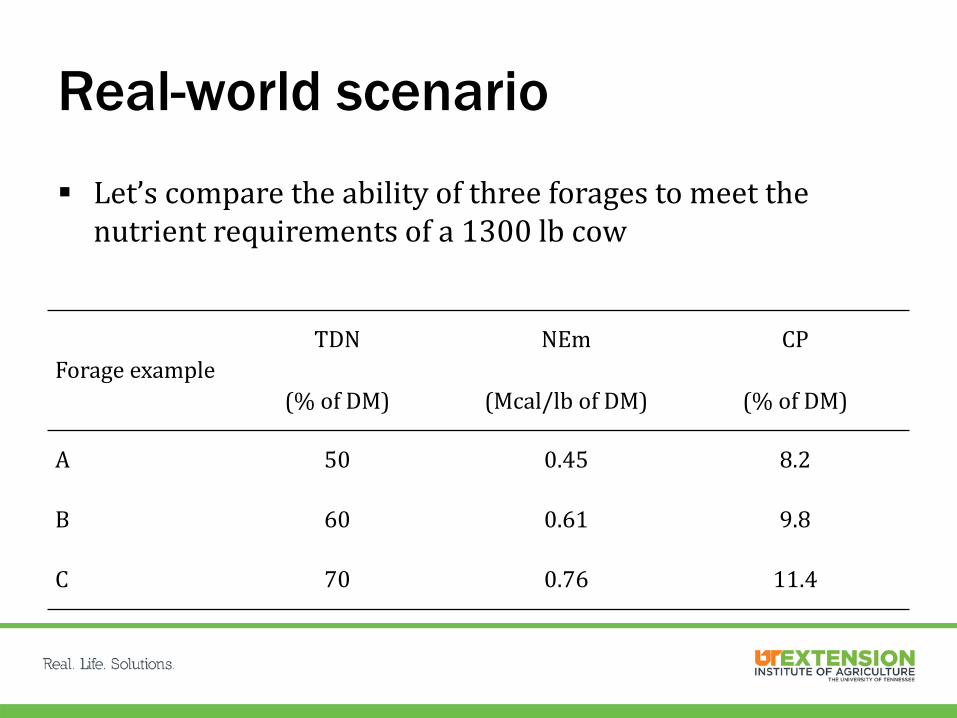
Real-world scenario
Let’s compare the ability of three forages to meet the nutrient requirements of a 1300 lb cow
Forage exampleTDN
(% of DM)
NEm
(Mcal/lb of DM)
CP
(% of DM)
A 50 0.45 8.2
B 60 0.61 9.8
C 70 0.76 11.4
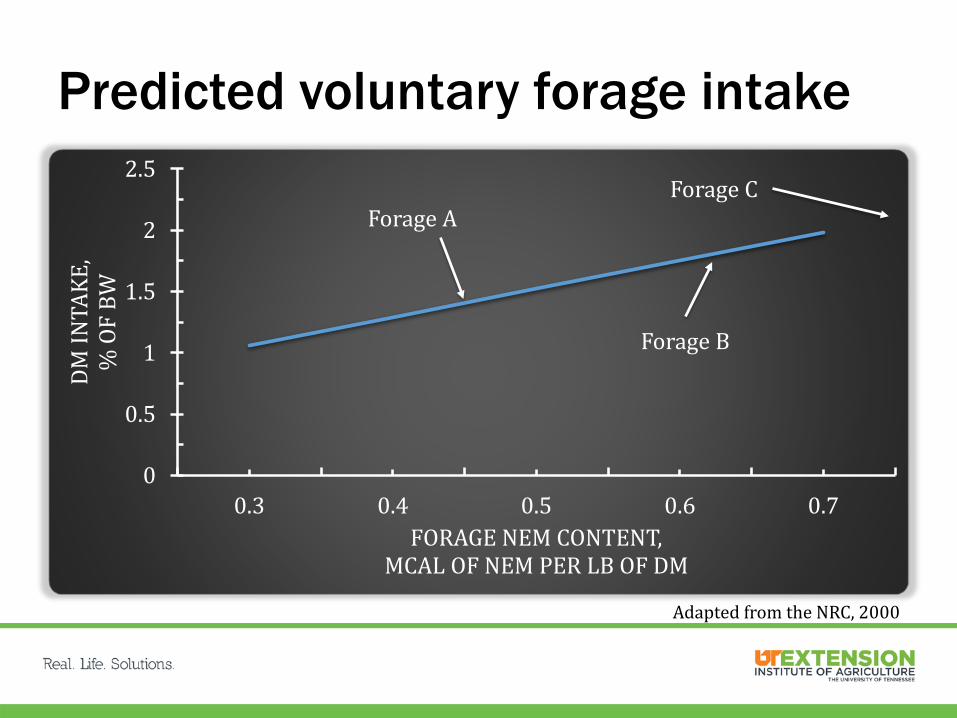
Predicted voluntary forage intake
0
0.5
1
1.5
2
2.5
0.3 0.4 0.5 0.6 0.7
DM IN
TAKE
, %
OF
BW
FORAGE NEM CONTENT, MCAL OF NEM PER LB OF DM
Forage A
Forage B
Forage C
Adapted from the NRC, 2000
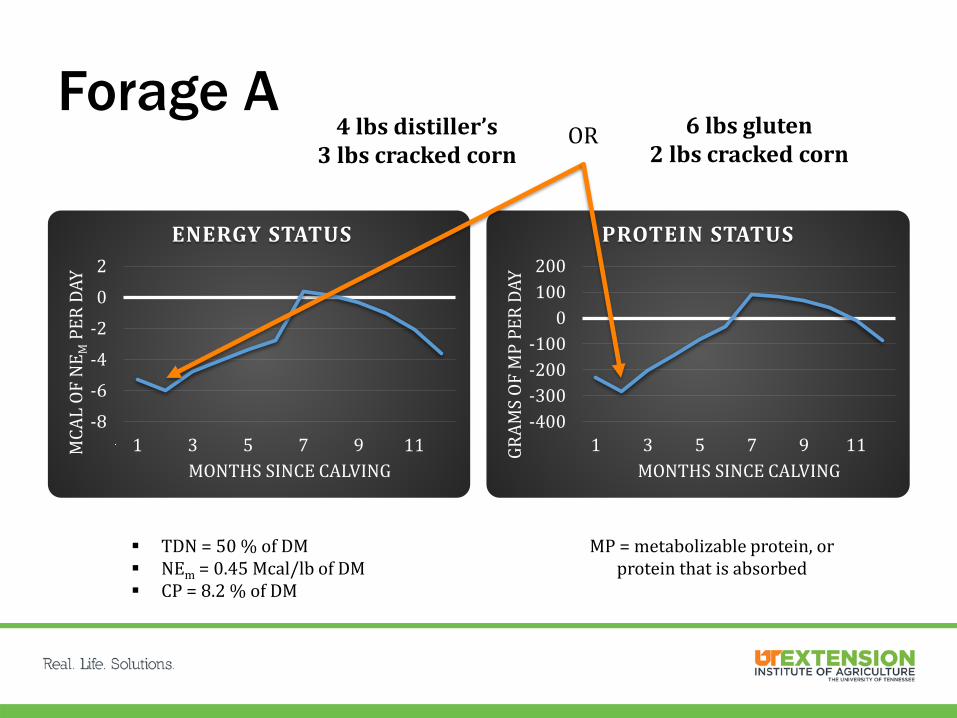
Forage A
-8-6-4-202
1 3 5 7 9 11MCA
LOF
NE M
PER
DAY
MONTHS SINCE CALVING
ENERGY STATUS
-400-300-200-100
0100200
1 3 5 7 9 11GRAM
S OF
MP
PER
DAY
MONTHS SINCE CALVING
PROTEIN STATUS
MP = metabolizable protein, or protein that is absorbed
TDN = 50 % of DM NEm = 0.45 Mcal/lb of DM CP = 8.2 % of DM
4 lbs distiller’s3 lbs cracked corn
OR 6 lbs gluten2 lbs cracked corn
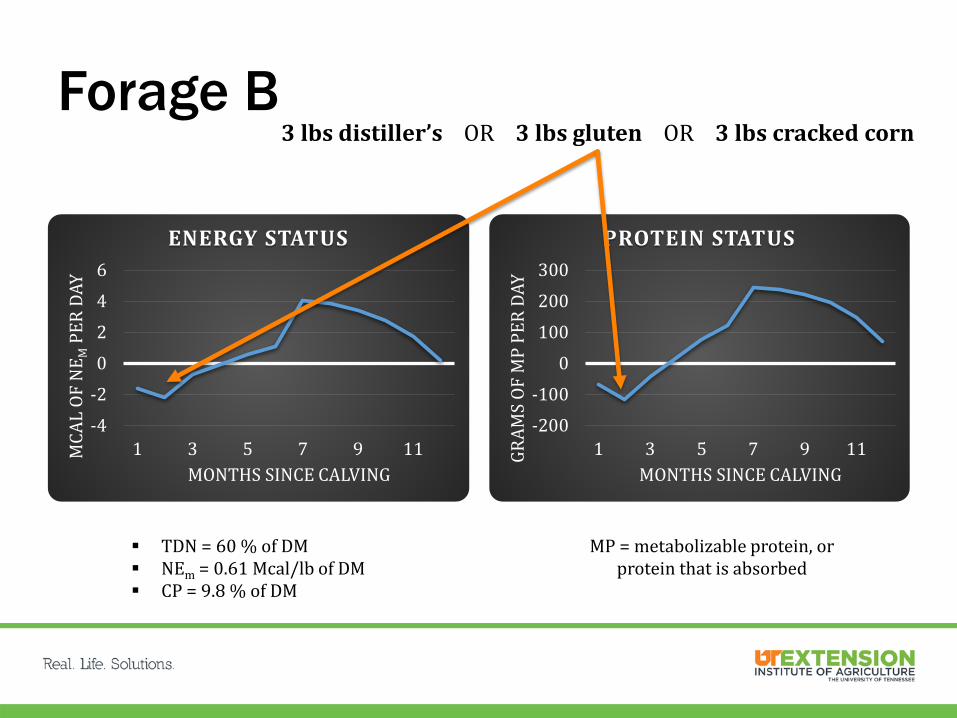
Forage B
-200-100
0100200300
1 3 5 7 9 11GRAM
S OF
MP
PER
DAY
MONTHS SINCE CALVING
PROTEIN STATUS
-4-20246
1 3 5 7 9 11MCA
LOF
NE M
PER
DAY
MONTHS SINCE CALVING
ENERGY STATUS
MP = metabolizable protein, or protein that is absorbed
TDN = 60 % of DM NEm = 0.61 Mcal/lb of DM CP = 9.8 % of DM
3 lbs distiller’s OR 3 lbs gluten OR 3 lbs cracked corn
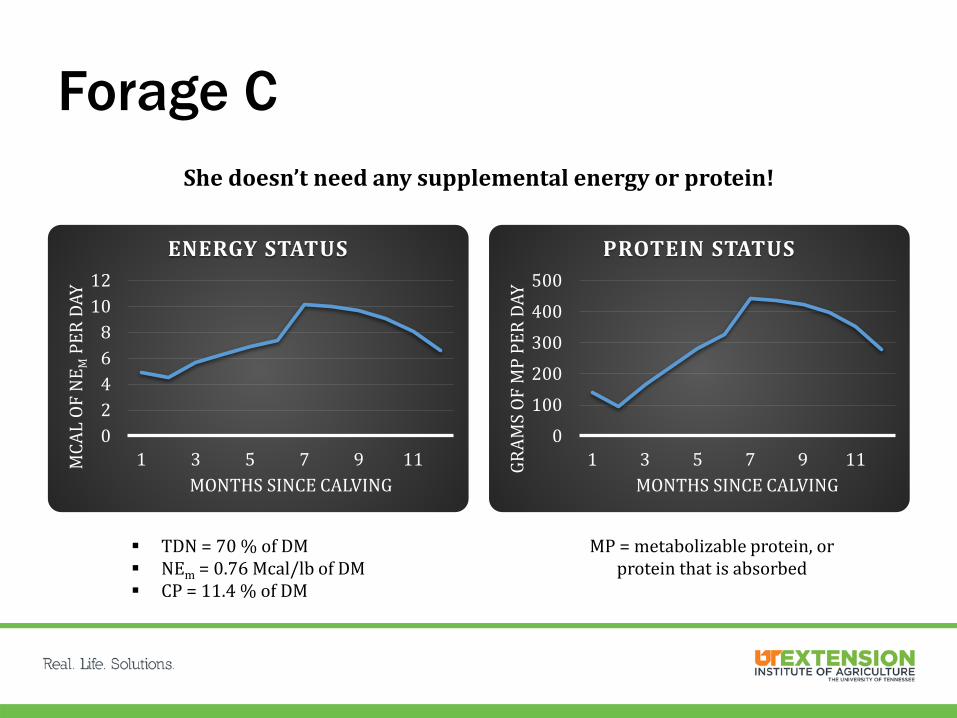
Forage C
0100200300400500
1 3 5 7 9 11GRAM
S OF
MP
PER
DAY
MONTHS SINCE CALVING
PROTEIN STATUS
02468
1012
1 3 5 7 9 11MCA
L OF
NE M
PER
DAY
MONTHS SINCE CALVING
ENERGY STATUS
MP = metabolizable protein, or protein that is absorbed
TDN = 70 % of DM NEm = 0.76 Mcal/lb of DM CP = 11.4 % of DM
She doesn’t need any supplemental energy or protein!
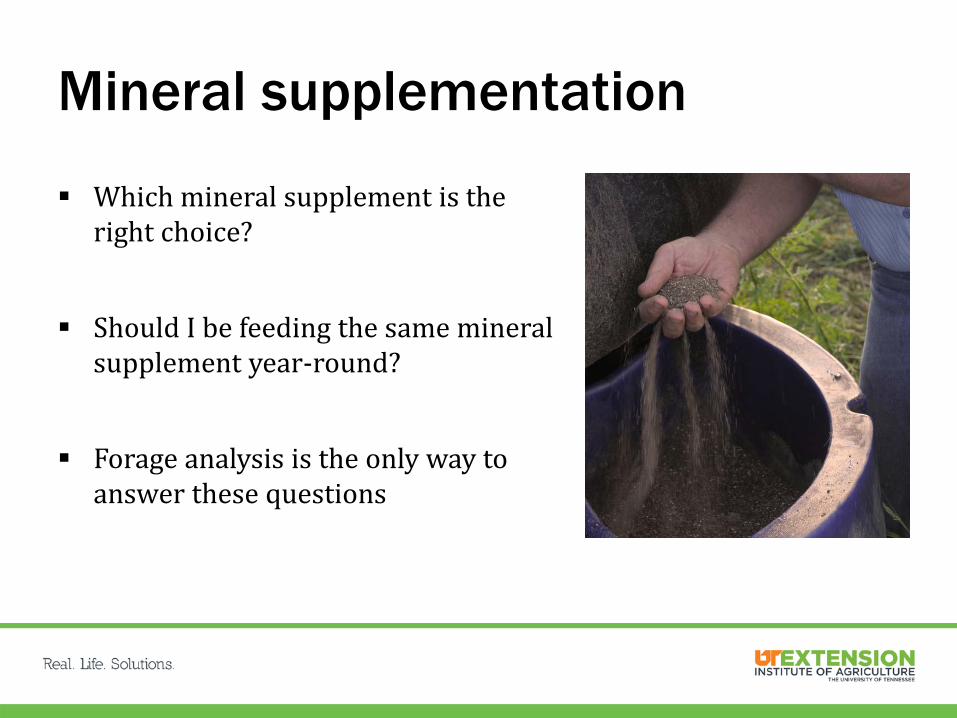
Mineral supplementation
Which mineral supplement is the right choice?
Should I be feeding the same mineral supplement year-round?
Forage analysis is the only way to answer these questions
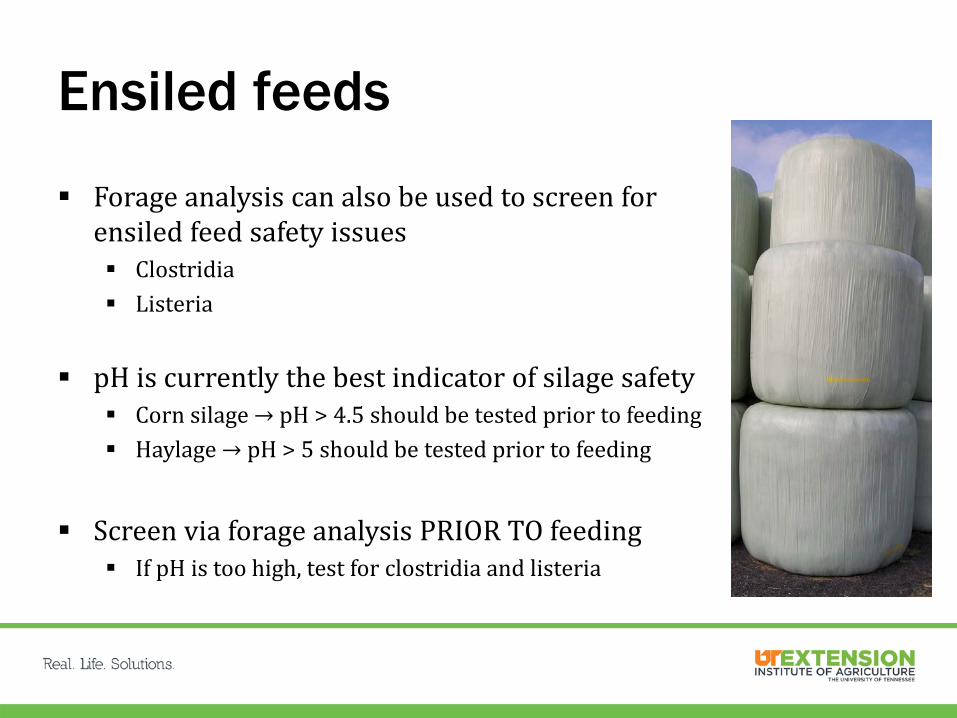
Ensiled feeds
Forage analysis can also be used to screen for ensiled feed safety issues Clostridia Listeria
pH is currently the best indicator of silage safety Corn silage → pH > 4.5 should be tested prior to feeding Haylage → pH > 5 should be tested prior to feeding
Screen via forage analysis PRIOR TO feeding If pH is too high, test for clostridia and listeria
Take-home points
Importance of a forage analysis cannot be overemphasized!
Focus on meeting the nutrient requirements of your cattle in the most economical way possible
Base supplementation decisions on nutrient needs and supplement value (cost per unit of nutrient) rather than retail cost
Closing thoughts Design a program that works for you
Just because it works for your neighbor, doesn’t mean it’ll work for you Just because it’s what you’ve done in the past, doesn’t mean it’s the
best option
Don’t be afraid to supplement your cattle if they need it View it as an investment, rather than an expense Make economically responsible supplementation decisions
When purchasing supplements… You generally get what you pay for Be skeptical of “fix-all” product claims
What’s on the horizon?
Decision-making tools Cost per unit of nutrient calculator for supplemental feedstuffs Cost per unit of nutrient calculator for different forms of the same
supplemental feedstuff
Educational materials How to conduct a forage analysis Beef cattle nutrient requirements Specific supplemental feedstuffs
Questions?