Embed Size (px)
Citation preview
In a 2009 article, Taylor addresses the question, “What do we mean by severe-to-profound hearing loss?” The article illustrates audiogram #1 and audiogram #2, shown here as Figure 1a and 1b, respectively. The article also succinctly distinguishes between the two losses from not only a patient perspective but also from the perspective of hearing aid professionals. There are many significant clinical differences between these two losses and the differences are important for recommending and fitting hearing aids as part of the rehabilitation process (Taylor, 2009).
These losses are so different that one approach to fitting a hearing aid on the steeply sloping loss (audiogram #1) may actually be an open-fit behind-the-ear (BTE) with frequency lowering technology. The other loss (audiogram #2) may warrant a more closed-fit BTE or perhaps a high gain-output capable in-the-ear (ITE) style without frequency lowering*1. For either audiogram or any style choice, prescriptions of
*Note 1: The use of frequency lowering can be shown to depend on the amount of high-frequency hearing loss (e.g., where audibility may not be restored, sometimes intentionally, by the prescribed gain-frequency response, as in the case of audiogram #1). The theories and practicalities of prescriptions such as the Australian National Acoustic Laboratories – Non-Linear 2 (NAL-NL2) and the University of Western Ontario implementation of the Desired Sensation Level Multiple Input/Output (DSL m[i/o]) can be used to help support particular approaches to fitting differing audiometric losses (Keidser, Dillon, Flax, Ching & Brewer, 2011; Keidser, Dillon, Carter & O’Brien, 2012; Scollie et al., 2005). For example, recommendation differences in the audible gain-frequency response (i.e., bandwidth) of the two prescriptions may further direct the use or nonuse of frequency lowering, as well as how much lowering to use. When hearing sensitivity is poorer in the low- and mid-frequencies, current evidence contends these listeners may not be able to use the spectral information when lowered due to associated resolution/distortion issues that accompany increasing amounts of hearing loss (i.e., the principle of desensitization discussed herein).
the gain-frequency response and compression parameters (e.g., kneepoint and ratio) to partially offset the magnitude of audiometric thresholds are recommended based on current evidence-based practice research (Valente et al., 2006). For patients who exhibit slower cognitive processes, the parameter of compression release time may need to be set to a slower amount (i.e., > 200 ms) rather than a faster amount (i.e., less than 50 ms) (Lunner, 2003). To offset signal-to-noise (SNR) ratio loss when listening in a background of noise, more closed fittings and SNR changing technologies, such as directional and remote microphones, are highly regarded and highly valued.
The high-frequency, severe-to-profound loss of audiogram #1 is quite prevalent due to age- and noise-related factors that impact hearing throughout a typical lifespan, particularly if protection devices were not available when exposure to hazardous noise occurred. The flat, severe-to-profound hearing loss of audiogram #2, which effects low- to mid-frequency hearing, has an enormous impact on individual listeners.
Amplification Options for Individuals with Severe-to-Profound Sensorineural Hearing Loss
Earl Johnson, Au.D., Ph.D.
Introduction from the EditorTreatment of individuals with severe-to-profound hearing loss has been transformed dramatically over the past four decades as a result of the development of cochlear implants as a viable option. The development of hybrid electric-acoustic devices will further expand treatment options. We cannot lose sight, however, of the legacy and viability of acoustic amplification as an effective and superior treatment option for many patients.
Earl Johnson, Au.D., Ph.D., introduces us to an evidence-based method of predicting performance with hearing aid systems that can assist the user and the fitter in understanding the expectations for performance of the hearing aids and in selecting and fitting hearing aids for individuals with severe- to-profound hearing loss.
1Amplification Options for Individuals with Severe-to-Profound Sensorineural Hearing Loss Reprinted from Innovations: Volume 4, Issue 2, 2014
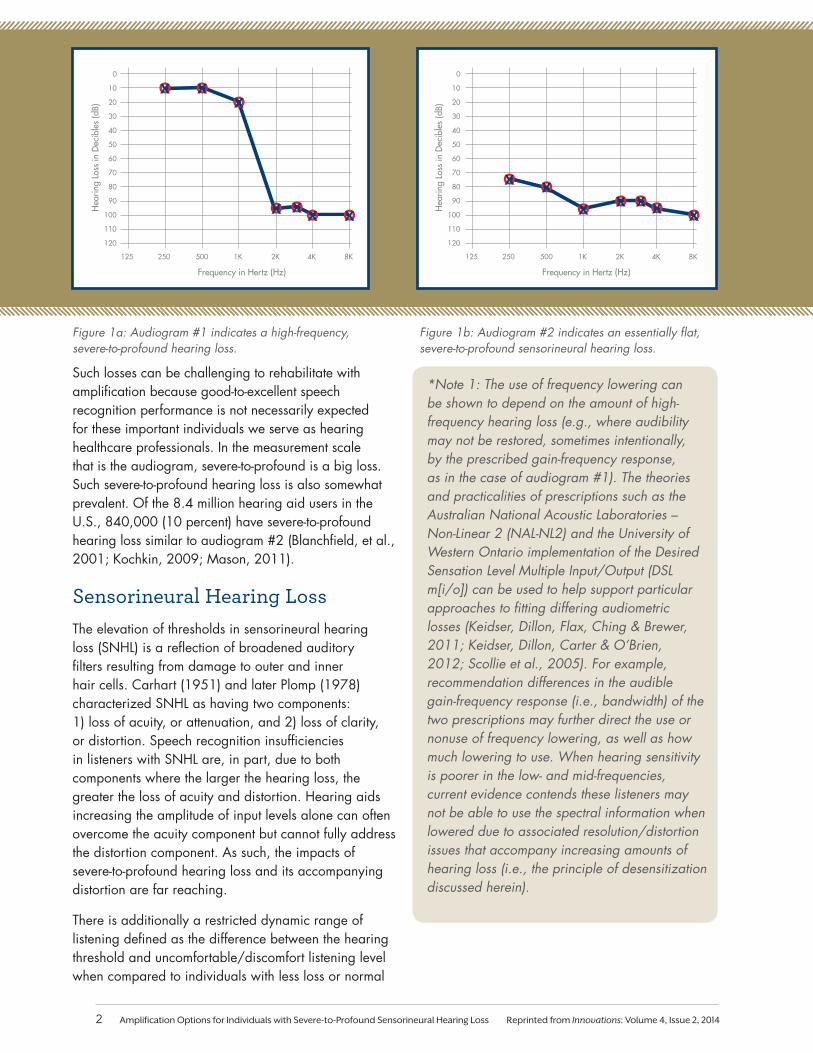
Figure 1a: Audiogram #1 indicates a high-frequency, severe-to-profound hearing loss.
Figure 1b: Audiogram #2 indicates an essentially flat, severe-to-profound sensorineural hearing loss.
Such losses can be challenging to rehabilitate with amplification because good-to-excellent speech recognition performance is not necessarily expected for these important individuals we serve as hearing healthcare professionals. In the measurement scale that is the audiogram, severe-to-profound is a big loss. Such severe-to-profound hearing loss is also somewhat prevalent. Of the 8.4 million hearing aid users in the U.S., 840,000 (10 percent) have severe-to-profound hearing loss similar to audiogram #2 (Blanchfield, et al., 2001; Kochkin, 2009; Mason, 2011).
Sensorineural Hearing LossThe elevation of thresholds in sensorineural hearing loss (SNHL) is a reflection of broadened auditory filters resulting from damage to outer and inner hair cells. Carhart (1951) and later Plomp (1978) characterized SNHL as having two components: 1) loss of acuity, or attenuation, and 2) loss of clarity, or distortion. Speech recognition insufficiencies in listeners with SNHL are, in part, due to both components where the larger the hearing loss, the greater the loss of acuity and distortion. Hearing aids increasing the amplitude of input levels alone can often overcome the acuity component but cannot fully address the distortion component. As such, the impacts of severe-to-profound hearing loss and its accompanying distortion are far reaching.
There is additionally a restricted dynamic range of listening defined as the difference between the hearing threshold and uncomfortable/discomfort listening level when compared to individuals with less loss or normal
50
60
70
80
90
100
110
120
30
40
10
20
125 250 500 1K 2K 4K 8K
0
Frequency in Hertz (Hz)
Hea
ring
Loss
in D
ecib
les
(dB)
50
60
70
80
90
100
110
120
30
40
10
20
125 250 500 1K 2K 4K 8K
0
Frequency in Hertz (Hz)
Hea
ring
Loss
in D
ecib
les
(dB)
*Note 1: The use of frequency lowering can be shown to depend on the amount of high-frequency hearing loss (e.g., where audibility may not be restored, sometimes intentionally, by the prescribed gain-frequency response, as in the case of audiogram #1). The theories and practicalities of prescriptions such as the Australian National Acoustic Laboratories – Non-Linear 2 (NAL-NL2) and the University of Western Ontario implementation of the Desired Sensation Level Multiple Input/Output (DSL m[i/o]) can be used to help support particular approaches to fitting differing audiometric losses (Keidser, Dillon, Flax, Ching & Brewer, 2011; Keidser, Dillon, Carter & O’Brien, 2012; Scollie et al., 2005). For example, recommendation differences in the audible gain-frequency response (i.e., bandwidth) of the two prescriptions may further direct the use or nonuse of frequency lowering, as well as how much lowering to use. When hearing sensitivity is poorer in the low- and mid-frequencies, current evidence contends these listeners may not be able to use the spectral information when lowered due to associated resolution/distortion issues that accompany increasing amounts of hearing loss (i.e., the principle of desensitization discussed herein).
2 Amplification Options for Individuals with Severe-to-Profound Sensorineural Hearing Loss Reprinted from Innovations: Volume 4, Issue 2, 2014
hearing sensitivity. If such severe-to-profound hearing loss is left untreated, psychosocial morbidities such as social withdrawal, feelings of isolation, anger, fatigue and depression can develop (Vernon & Andrews, 1990; Kaland & Salvatore, 2002). These individuals may also become unjustly unemployed and are often underemployed and/or undercompensated relative to peers with normal hearing (Kochkin, 2010).
Treating Sensorineural Hearing Loss with Hearing AidsOvercoming SNHL and, if present, psychosocial impacts have long been a goal of treatment via hearing aids. Hearing aids alone have a traditional microphone amplifier, receiver and battery source; however, there are limitations in how fully they can address the distortion component of hearing loss, particularly in the case of severe-to-profound loss. Because of the
limitations, instead of fitting hearing aids alone, a systems-based approach to amplification technology options and rehabilitation is often necessary. The systems-based approach can be staged and based on listening needs and outcomes of individual patients.
Thibodeau (2013) likened the systems-based approach to a hearing technology network, which requires assessment of hearing abilities, lifestyle, technology experience and financial constraints. The additional technology accompanying well-fit hearing aids can help individuals better overcome the impacts of severe-to-profound hearing loss. Thibodeau (2013) indicates this “network paradigm” or “systems-based” approach will ultimately separate the professional comprehensive service from the discount experience of purchasing inexpensive hearing aids, which generally cannot function with other hearing technology devices or personal sound amplification products (PSAPs) from consumer electronic stores or Internet sources.
Before considering systems additional to a hearing aid, more detail on the latest amplification research is pertinent to explain why the network paradigm or systems-based approach is needed by many listeners with SNHL to maximize objectively-measured speech recognition benefit and performance. Additional technologies to enhance hearing aid performance can even allow listeners with less hearing loss (e.g., mild-moderate) to outperform a listener with normal hearing in adverse listening environments having poorer SNRs (Dillon, 2012; Johnson, 2013). For this detail,
... instead of fitting hearing aids alone, a systems-based
approach to amplification technology options and
rehabilitation is often necessary. The systems-based
approach can be staged and based on listening
needs and outcomes of individual patients.
3Amplification Options for Individuals with Severe-to-Profound Sensorineural Hearing Loss Reprinted from Innovations: Volume 4, Issue 2, 2014
discussed more fully in the following paragraphs, the term desensitization is used synonymously with the term distortion in previous literature (Carhart, 1951; Plomp, 1978; Humes, 2002; Sherbecoe & Studebaker, 2003). Desensitization has now been modeled better mathematically based on the latest evidence from comprehensive speech recognition assessments of adult individuals with varying amounts of hearing loss (Ching & Dillon, 2013 Early Online).
DesensitizationReduction in the usefulness of audible speech in listeners with increasing SNHL is desensitization (Studebaker, Sherbecoe, McDaniel & Gray, 1997; Ching, Dillon & Byrne, 1998; Keidser et al., 2011; Ching, Dillon, Lockhart, van Wanrooy, & Flax, 2011; Ching & Dillon, 2013 Early Online). Again, other research has termed the demonstrated reduction using terms such as distortion/loss of clarity or the hearing loss distortion factor (Carhart, 1951; Plomp, 1978; Plomp & Dequesnoy, 1982; Ching, Dillon, Katsch & Byrne, 2001; Humes, 2002; Sherbecoe & Studebaker, 2003). The latest amplification prescription from the Australian National Acoustic Laboratories (NAL-NL2) has considered the factor of desensitization in its calculation of the recommended gain-frequency response for individual listeners of any hearing loss. In essence, the focus of NAL-NL2 is on recommending the least amount of gain that maximizes effective audibility while simultaneously limiting the loudness to which listeners are exposed to less than that of an individual with normal hearing. In this manner, the intent of the prescription is to achieve the best speech recognition performance, based on advanced speech intelligibility index modeling, while keeping loudness acceptable and in the dynamic range of the listener.
Perhaps the best way to demonstrate desensitization on speech recognition is with the Speech Intelligibility Index (SII) model itself. This model is over a half-century in the making. While based on theory, the SII model has not only been substantiated but also improved with observations of individuals, mostly adults, conducting speech recognition tasks. The SII is a standardized method of calculating audibility of a speech signal for predicting speech intelligibility (ANSI S3.5, 1997-R2007). The SII is represented by the following equation:
SII = ∑ Ii Ai
where Ii is the function that characterizes the importance of the ith frequency band for speech intelligibility and Ai expresses the proportion of the speech dynamic range in the ith frequency band that is above the listener’s
hearing threshold.
The SII model can be successfully used to predict speech recognition scores for different types of speech material for listeners with normal hearing. In years past, the model has overestimated performance for listeners with hearing loss due to a lack of agreement between
audibility and intelligibility. The overestimation is large when the hearing threshold exceeds approximately 60dB HL because suprathreshold distortion increases with accompanying damage to inner hair cells in the cochlea. Enter desensitization as an additional factor to the existing SII model.
Desensitization has been reported to not be frequency-specific and is consistent with the results and interpretation of findings from Hornsby and Ricketts (2003) and Hornsby and colleagues (2011) (Ching et al., 2011; Johnson & Dillon, 2011; Ching & Dillon, 2013). Rather, desensitization is specific to the magnitude of hearing loss. Desensitization is a
Desensitization is a broad
estimate of suprathreshold distortion based on the magnitude
of the hearing loss to reflect impaired
auditory function in domains such as frequency
resolution and temporal processing.
4 Amplification Options for Individuals with Severe-to-Profound Sensorineural Hearing Loss Reprinted from Innovations: Volume 4, Issue 2, 2014
broad estimate of suprathreshold distortion based on the magnitude of the hearing loss to reflect impaired auditory function in domains such as frequency resolution and temporal processing. Likewise, Bernstein and colleagues (2013) demonstrated improved accuracy of predicted speech intelligibility estimates when measures of suprathreshold distortion were added to models of speech intelligibility index calculations.
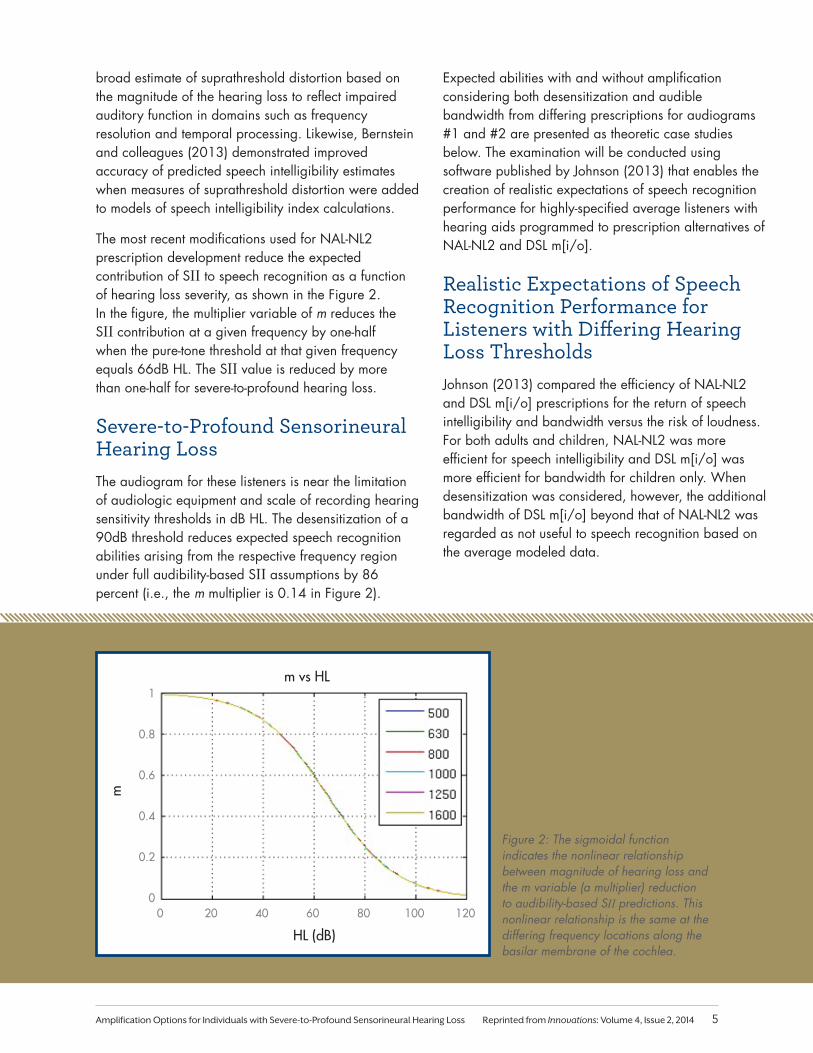
The most recent modifications used for NAL-NL2 prescription development reduce the expected contribution of SII to speech recognition as a function of hearing loss severity, as shown in the Figure 2. In the figure, the multiplier variable of m reduces the SII contribution at a given frequency by one-half when the pure-tone threshold at that given frequency equals 66dB HL. The SII value is reduced by more than one-half for severe-to-profound hearing loss.
Severe-to-Profound Sensorineural Hearing Loss The audiogram for these listeners is near the limitation of audiologic equipment and scale of recording hearing sensitivity thresholds in dB HL. The desensitization of a 90dB threshold reduces expected speech recognition abilities arising from the respective frequency region under full audibility-based SII assumptions by 86 percent (i.e., the m multiplier is 0.14 in Figure 2).
Expected abilities with and without amplification considering both desensitization and audible bandwidth from differing prescriptions for audiograms #1 and #2 are presented as theoretic case studies below. The examination will be conducted using software published by Johnson (2013) that enables the creation of realistic expectations of speech recognition performance for highly-specified average listeners with hearing aids programmed to prescription alternatives of NAL-NL2 and DSL m[i/o].
Realistic Expectations of Speech Recognition Performance for Listeners with Differing Hearing Loss ThresholdsJohnson (2013) compared the efficiency of NAL-NL2 and DSL m[i/o] prescriptions for the return of speech intelligibility and bandwidth versus the risk of loudness. For both adults and children, NAL-NL2 was more efficient for speech intelligibility and DSL m[i/o] was more efficient for bandwidth for children only. When desensitization was considered, however, the additional bandwidth of DSL m[i/o] beyond that of NAL-NL2 was regarded as not useful to speech recognition based on the average modeled data.
00
0.2
0.4
0.6
0.8
1
20 40 60 80 100 120
HL (dB)
m vs HL
m
Figure 2: The sigmoidal function indicates the nonlinear relationship between magnitude of hearing loss and the m variable (a multiplier) reduction to audibility-based SII predictions. This nonlinear relationship is the same at the differing frequency locations along the basilar membrane of the cochlea.
5Amplification Options for Individuals with Severe-to-Profound Sensorineural Hearing Loss Reprinted from Innovations: Volume 4, Issue 2, 2014
CASE STUDY EXAMPLE FOR AUDIOGRAM #1
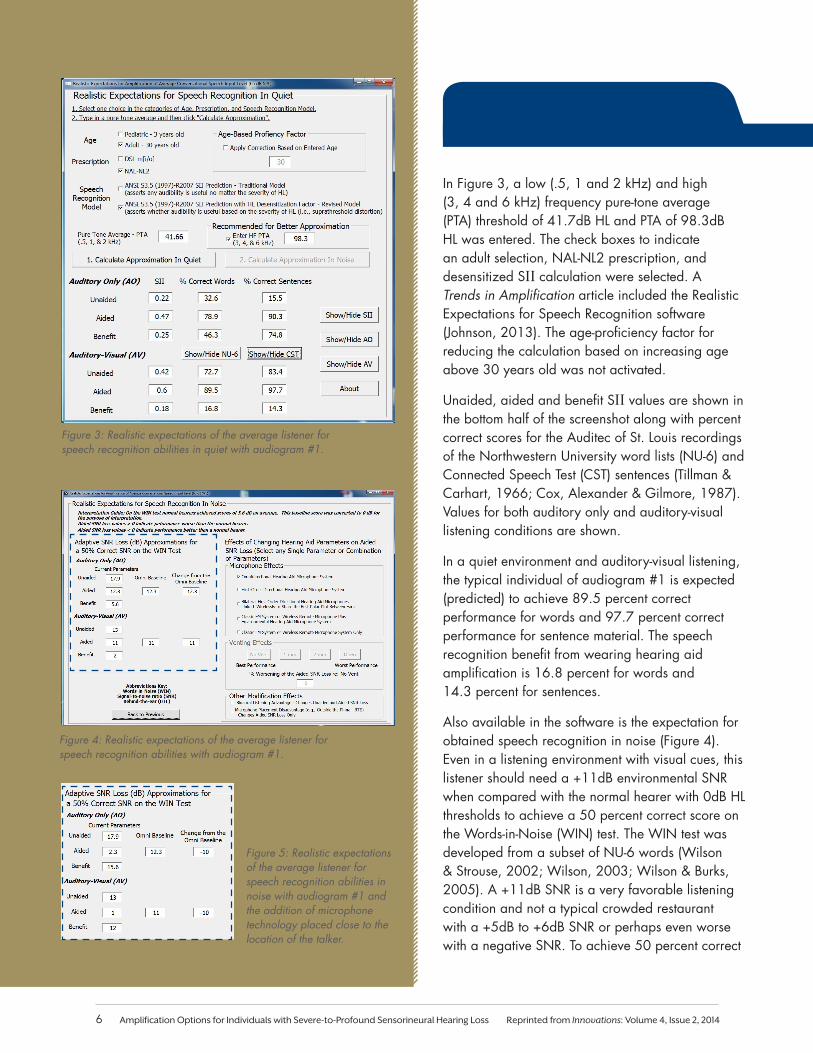
In Figure 3, a low (.5, 1 and 2 kHz) and high (3, 4 and 6 kHz) frequency pure-tone average (PTA) threshold of 41.7dB HL and PTA of 98.3dB HL was entered. The check boxes to indicate an adult selection, NAL-NL2 prescription, and desensitized SII calculation were selected. A Trends in Amplification article included the Realistic Expectations for Speech Recognition software (Johnson, 2013). The age-proficiency factor for reducing the calculation based on increasing age above 30 years old was not activated.
Unaided, aided and benefit SII values are shown in the bottom half of the screenshot along with percent correct scores for the Auditec of St. Louis recordings of the Northwestern University word lists (NU-6) and Connected Speech Test (CST) sentences (Tillman & Carhart, 1966; Cox, Alexander & Gilmore, 1987). Values for both auditory only and auditory-visual listening conditions are shown.
In a quiet environment and auditory-visual listening, the typical individual of audiogram #1 is expected (predicted) to achieve 89.5 percent correct performance for words and 97.7 percent correct performance for sentence material. The speech recognition benefit from wearing hearing aid amplification is 16.8 percent for words and 14.3 percent for sentences.
Also available in the software is the expectation for obtained speech recognition in noise (Figure 4). Even in a listening environment with visual cues, this listener should need a +11dB environmental SNR when compared with the normal hearer with 0dB HL thresholds to achieve a 50 percent correct score on the Words-in-Noise (WIN) test. The WIN test was developed from a subset of NU-6 words (Wilson & Strouse, 2002; Wilson, 2003; Wilson & Burks, 2005). A +11dB SNR is a very favorable listening condition and not a typical crowded restaurant with a +5dB to +6dB SNR or perhaps even worse with a negative SNR. To achieve 50 percent correct
Figure 3: Realistic expectations of the average listener for speech recognition abilities in quiet with audiogram #1.
Figure 5: Realistic expectations of the average listener for speech recognition abilities in noise with audiogram #1 and the addition of microphone technology placed close to the location of the talker.
Figure 4: Realistic expectations of the average listener for speech recognition abilities with audiogram #1.
6 Amplification Options for Individuals with Severe-to-Profound Sensorineural Hearing Loss Reprinted from Innovations: Volume 4, Issue 2, 2014
*Note 2: Only fixed-gain analog transmission systems such as traditional analog FM systems or simple, digital, wireless remote microphones are considered in current software calculations. Adaptive analog or adaptive digital wireless radio frequency transmission systems, such as those discussed in papers by Thibodeau (2010) and Wolfe and colleagues (2013), are not considered because the software currently provides a 50 percent correct SNR and the performance of such nonlinear transmission systems differs along the continuum of input speech and noise levels and, hence, SNRs.
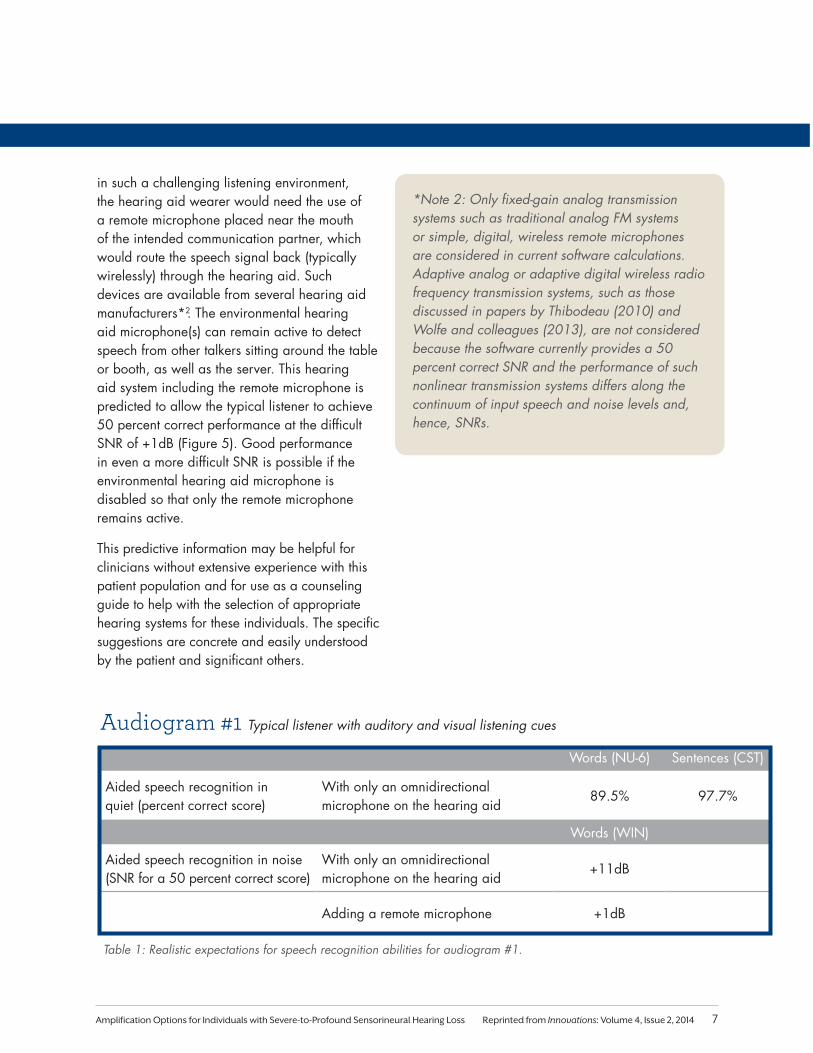
in such a challenging listening environment, the hearing aid wearer would need the use of a remote microphone placed near the mouth of the intended communication partner, which would route the speech signal back (typically wirelessly) through the hearing aid. Such devices are available from several hearing aid manufacturers*2. The environmental hearing aid microphone(s) can remain active to detect speech from other talkers sitting around the table or booth, as well as the server. This hearing aid system including the remote microphone is predicted to allow the typical listener to achieve 50 percent correct performance at the difficult SNR of +1dB (Figure 5). Good performance in even a more difficult SNR is possible if the environmental hearing aid microphone is disabled so that only the remote microphone remains active.
This predictive information may be helpful for clinicians without extensive experience with this patient population and for use as a counseling guide to help with the selection of appropriate hearing systems for these individuals. The specific suggestions are concrete and easily understood by the patient and significant others.
Words (NU-6) Sentences (CST)
Aided speech recognition in quiet (percent correct score)
With only an omnidirectional microphone on the hearing aid
89.5% 97.7%
Words (WIN)
Aided speech recognition in noise (SNR for a 50 percent correct score)
With only an omnidirectional microphone on the hearing aid
+11dB
Adding a remote microphone +1dB
Audiogram #1 Typical listener with auditory and visual listening cues
Table 1: Realistic expectations for speech recognition abilities for audiogram #1.
7Amplification Options for Individuals with Severe-to-Profound Sensorineural Hearing Loss Reprinted from Innovations: Volume 4, Issue 2, 2014
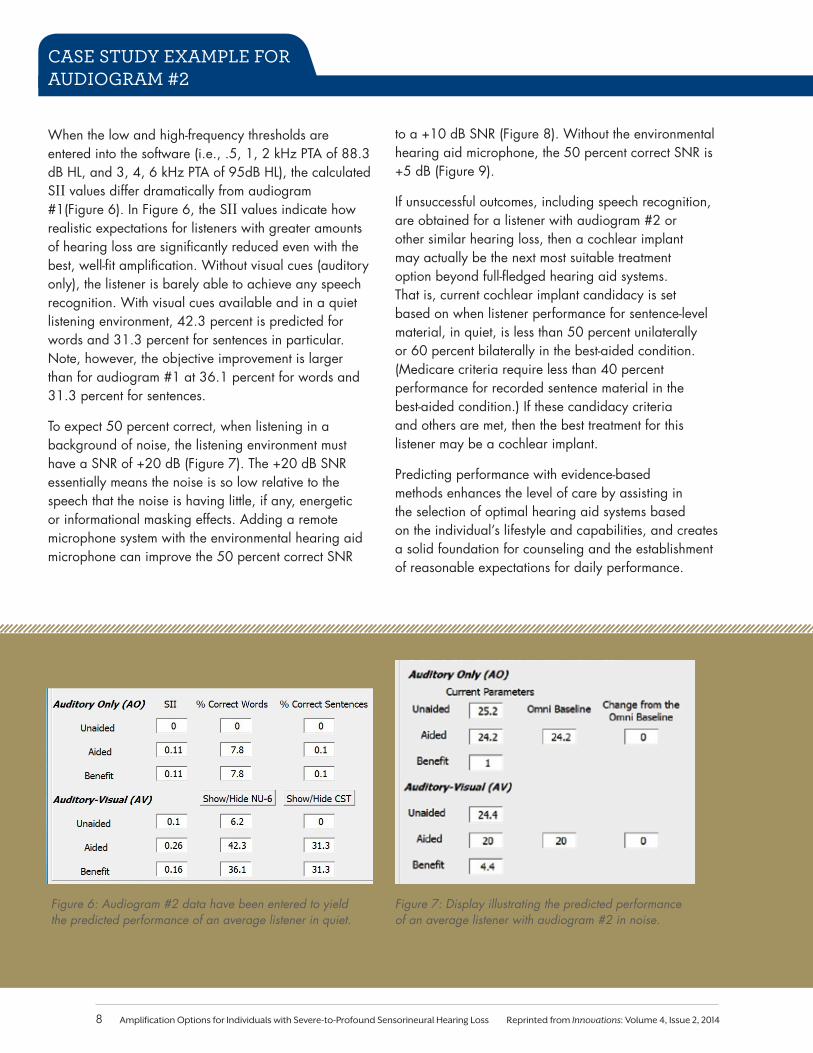
Figure 7: Display illustrating the predicted performance of an average listener with audiogram #2 in noise.
Figure 6: Audiogram #2 data have been entered to yield the predicted performance of an average listener in quiet.
to a +10 dB SNR (Figure 8). Without the environmental hearing aid microphone, the 50 percent correct SNR is +5 dB (Figure 9).
If unsuccessful outcomes, including speech recognition, are obtained for a listener with audiogram #2 or other similar hearing loss, then a cochlear implant may actually be the next most suitable treatment option beyond full-fledged hearing aid systems. That is, current cochlear implant candidacy is set based on when listener performance for sentence-level material, in quiet, is less than 50 percent unilaterally or 60 percent bilaterally in the best-aided condition. (Medicare criteria require less than 40 percent performance for recorded sentence material in the best-aided condition.) If these candidacy criteria and others are met, then the best treatment for this listener may be a cochlear implant.
Predicting performance with evidence-based methods enhances the level of care by assisting in the selection of optimal hearing aid systems based on the individual’s lifestyle and capabilities, and creates a solid foundation for counseling and the establishment of reasonable expectations for daily performance.
CASE STUDY EXAMPLE FOR AUDIOGRAM #2
When the low and high-frequency thresholds are entered into the software (i.e., .5, 1, 2 kHz PTA of 88.3 dB HL, and 3, 4, 6 kHz PTA of 95dB HL), the calculated SII values differ dramatically from audiogram #1(Figure 6). In Figure 6, the SII values indicate how realistic expectations for listeners with greater amounts of hearing loss are significantly reduced even with the best, well-fit amplification. Without visual cues (auditory only), the listener is barely able to achieve any speech recognition. With visual cues available and in a quiet listening environment, 42.3 percent is predicted for words and 31.3 percent for sentences in particular. Note, however, the objective improvement is larger than for audiogram #1 at 36.1 percent for words and 31.3 percent for sentences.
To expect 50 percent correct, when listening in a background of noise, the listening environment must have a SNR of +20 dB (Figure 7). The +20 dB SNR essentially means the noise is so low relative to the speech that the noise is having little, if any, energetic or informational masking effects. Adding a remote microphone system with the environmental hearing aid microphone can improve the 50 percent correct SNR
8 Amplification Options for Individuals with Severe-to-Profound Sensorineural Hearing Loss Reprinted from Innovations: Volume 4, Issue 2, 2014
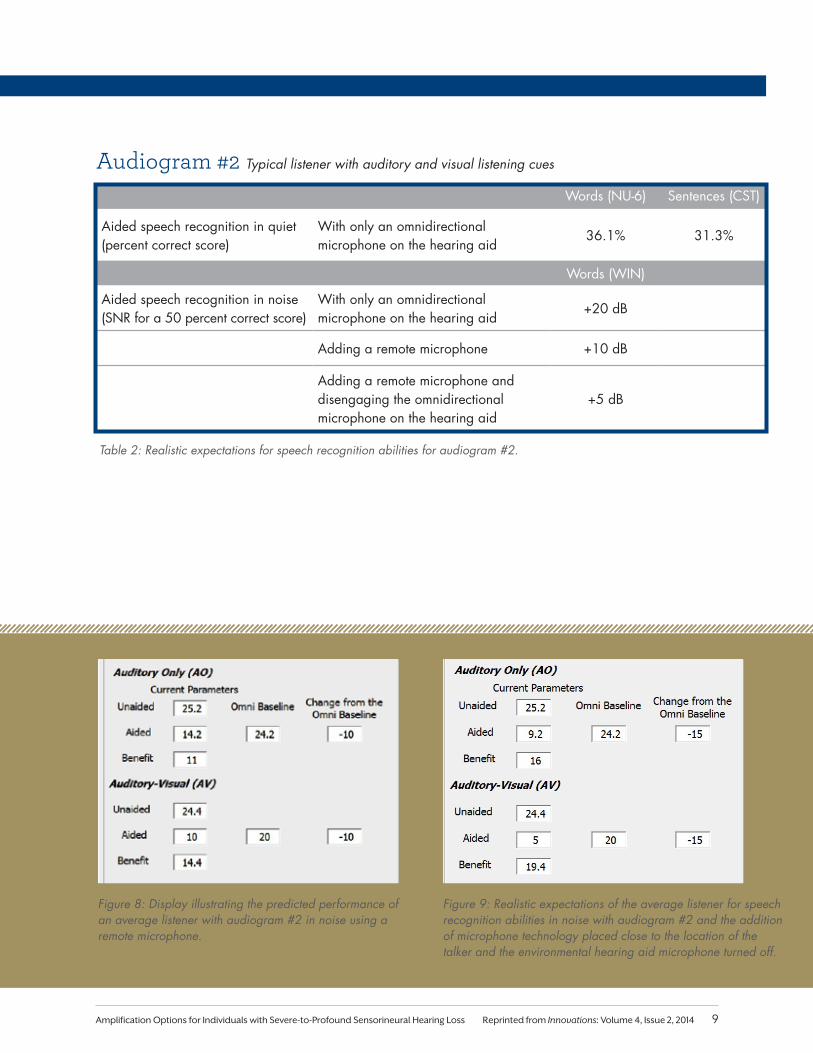
Figure 8: Display illustrating the predicted performance of an average listener with audiogram #2 in noise using a remote microphone.
Figure 9: Realistic expectations of the average listener for speech recognition abilities in noise with audiogram #2 and the addition of microphone technology placed close to the location of the talker and the environmental hearing aid microphone turned off.
Words (NU-6) Sentences (CST)
Aided speech recognition in quiet (percent correct score)
With only an omnidirectional microphone on the hearing aid
36.1% 31.3%
Words (WIN)
Aided speech recognition in noise (SNR for a 50 percent correct score)
With only an omnidirectional microphone on the hearing aid
+20 dB
Adding a remote microphone +10 dB
Adding a remote microphone and disengaging the omnidirectional microphone on the hearing aid
+5 dB
Audiogram #2 Typical listener with auditory and visual listening cues
Table 2: Realistic expectations for speech recognition abilities for audiogram #2.
9Amplification Options for Individuals with Severe-to-Profound Sensorineural Hearing Loss Reprinted from Innovations: Volume 4, Issue 2, 2014
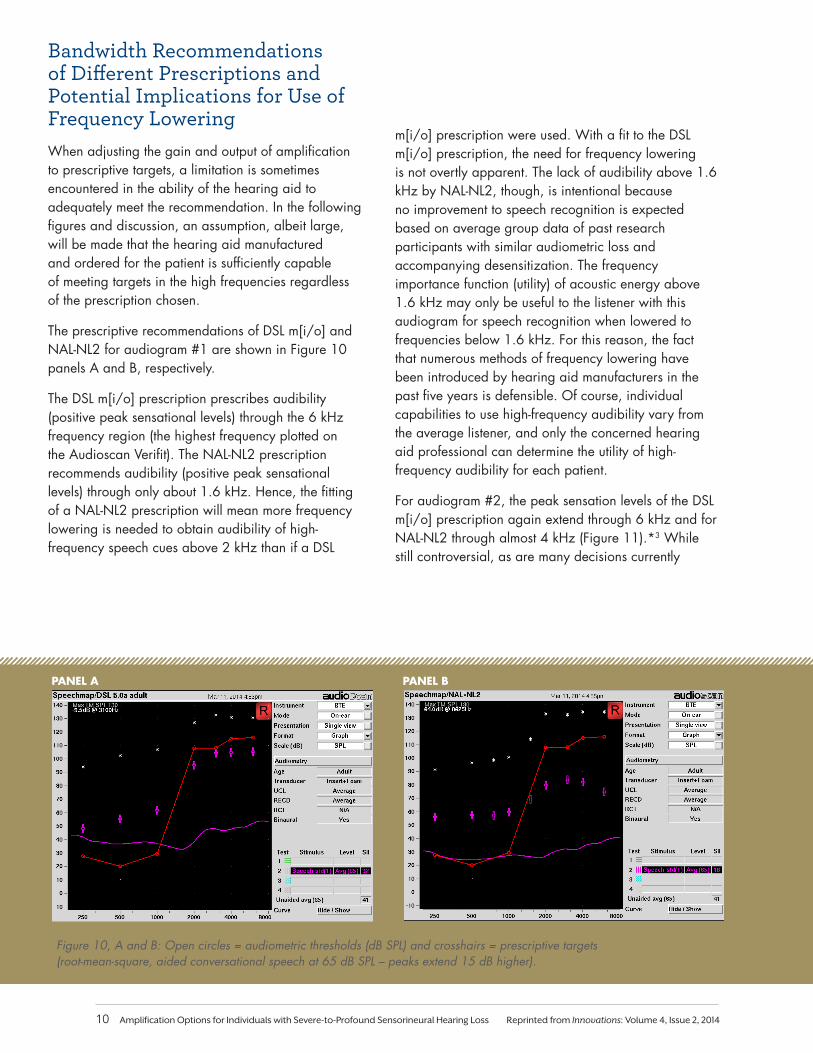
Figure 10, A and B: Open circles = audiometric thresholds (dB SPL) and crosshairs = prescriptive targets (root-mean-square, aided conversational speech at 65 dB SPL – peaks extend 15 dB higher).
Bandwidth Recommendations of Different Prescriptions and Potential Implications for Use of Frequency LoweringWhen adjusting the gain and output of amplification to prescriptive targets, a limitation is sometimes encountered in the ability of the hearing aid to adequately meet the recommendation. In the following figures and discussion, an assumption, albeit large, will be made that the hearing aid manufactured and ordered for the patient is sufficiently capable of meeting targets in the high frequencies regardless of the prescription chosen.
The prescriptive recommendations of DSL m[i/o] and NAL-NL2 for audiogram #1 are shown in Figure 10 panels A and B, respectively.
The DSL m[i/o] prescription prescribes audibility (positive peak sensational levels) through the 6 kHz frequency region (the highest frequency plotted on the Audioscan Verifit). The NAL-NL2 prescription recommends audibility (positive peak sensational levels) through only about 1.6 kHz. Hence, the fitting of a NAL-NL2 prescription will mean more frequency lowering is needed to obtain audibility of high-frequency speech cues above 2 kHz than if a DSL
m[i/o] prescription were used. With a fit to the DSL m[i/o] prescription, the need for frequency lowering is not overtly apparent. The lack of audibility above 1.6 kHz by NAL-NL2, though, is intentional because no improvement to speech recognition is expected based on average group data of past research participants with similar audiometric loss and accompanying desensitization. The frequency importance function (utility) of acoustic energy above 1.6 kHz may only be useful to the listener with this audiogram for speech recognition when lowered to frequencies below 1.6 kHz. For this reason, the fact that numerous methods of frequency lowering have been introduced by hearing aid manufacturers in the past five years is defensible. Of course, individual capabilities to use high-frequency audibility vary from the average listener, and only the concerned hearing aid professional can determine the utility of high-frequency audibility for each patient.
For audiogram #2, the peak sensation levels of the DSL m[i/o] prescription again extend through 6 kHz and for NAL-NL2 through almost 4 kHz (Figure 11).*3 While still controversial, as are many decisions currently
PANEL A PANEL B
10 Amplification Options for Individuals with Severe-to-Profound Sensorineural Hearing Loss Reprinted from Innovations: Volume 4, Issue 2, 2014
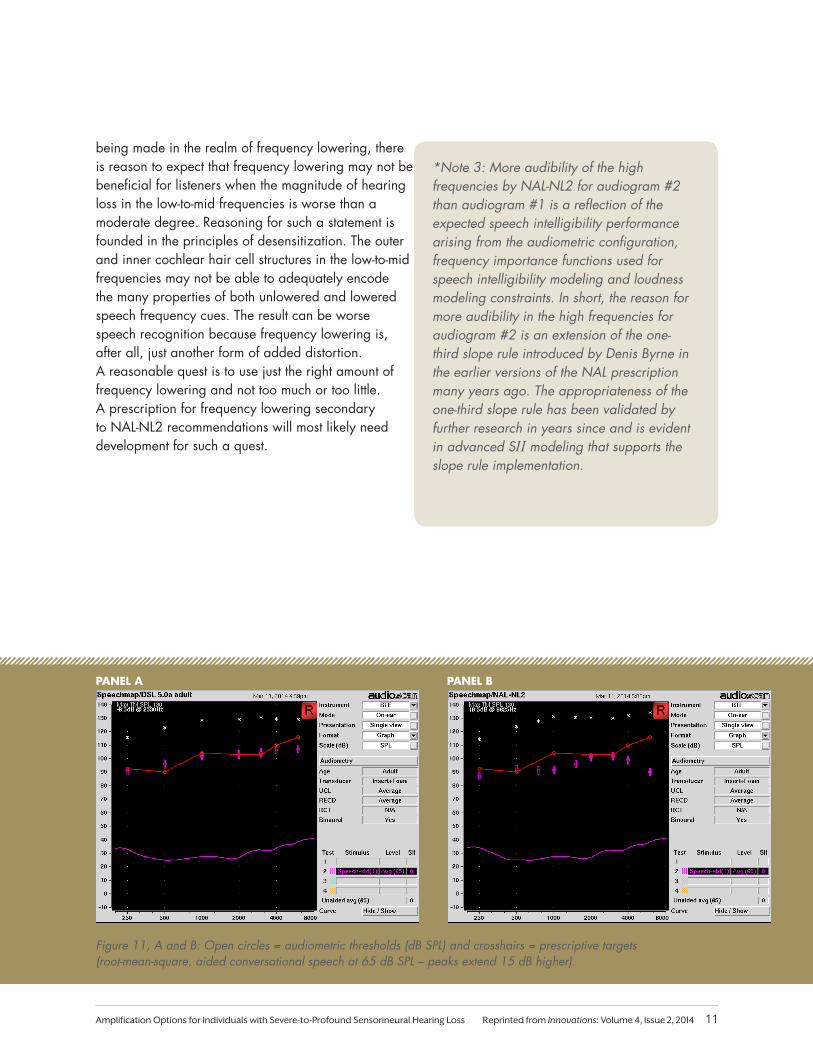
Figure 11, A and B: Open circles = audiometric thresholds (dB SPL) and crosshairs = prescriptive targets (root-mean-square, aided conversational speech at 65 dB SPL – peaks extend 15 dB higher).
PANEL A PANEL B
being made in the realm of frequency lowering, there is reason to expect that frequency lowering may not be beneficial for listeners when the magnitude of hearing loss in the low-to-mid frequencies is worse than a moderate degree. Reasoning for such a statement is founded in the principles of desensitization. The outer and inner cochlear hair cell structures in the low-to-mid frequencies may not be able to adequately encode the many properties of both unlowered and lowered speech frequency cues. The result can be worse speech recognition because frequency lowering is, after all, just another form of added distortion. A reasonable quest is to use just the right amount of frequency lowering and not too much or too little. A prescription for frequency lowering secondary to NAL-NL2 recommendations will most likely need development for such a quest.
*Note 3: More audibility of the high frequencies by NAL-NL2 for audiogram #2 than audiogram #1 is a reflection of the expected speech intelligibility performance arising from the audiometric configuration, frequency importance functions used for speech intelligibility modeling and loudness modeling constraints. In short, the reason for more audibility in the high frequencies for audiogram #2 is an extension of the one-third slope rule introduced by Denis Byrne in the earlier versions of the NAL prescription many years ago. The appropriateness of the one-third slope rule has been validated by further research in years since and is evident in advanced SII modeling that supports the slope rule implementation.
11Amplification Options for Individuals with Severe-to-Profound Sensorineural Hearing Loss Reprinted from Innovations: Volume 4, Issue 2, 2014
Disclaimers: The opinions expressed are those of the author and do not necessarily represent the official position of the U.S. Department of Veterans Affairs or the United States of America government.
This article was not prepared as part of government duties and was prepared on the author’s own time. Figures were created using the Starkey HearPro audiometric software, the Realistic Expectations for Speech Recognition software, a slide used with permission from NAL and an Audioscan Verifit from the East Tennessee State University Department of Audiology and Speech Pathology program.
Affiliations: The author is a clinical and research audiologist with the United States of America Department of Veterans Affairs at the Mountain Home, Tenn., station and an assistant professor in the East Tennessee State University Department of Audiology and Speech Pathology program.
The author is owner of Johnson Hearing Technology and Communication, PLLC, and does hold an ordering account with Starkey along with other hearing industry manufacturers.
Conclusions and SummaryThe treatment options for individuals with severe-to-profound hearing loss require the hearing healthcare professional to work closely with the individual using a patient-centered approach. Careful assessment of the auditory capabilities and needs of the patient, along with an evidence-based prediction of performance with hearing aids, is necessary to develop an appropriate treatment plan. When hearing aid systems are appropriate, in addition to the standard of care considerations for any hearing aid fitting, the professional should remain attentive to ensuring the following:
1. Effective audibility and bandwidth using sufficient amplification, yet minimizing distortion from excessive amplitude compression or frequency lowering
2. Hearing aid systems that allow for not only coupling to peripheral accessories such as telephones, but also provide sufficient SNR improvement in environments that the individual is likely to experience
A comprehensive rehabilitation approach to the patient’s listening needs and goals in combination with the right technology in a hearing aid system can make for very effective real-world fittings and big differences in the lives of many individuals with severe-to-profound hearing loss.
12 Amplification Options for Individuals with Severe-to-Profound Sensorineural Hearing Loss Reprinted from Innovations: Volume 4, Issue 2, 2014
ReferencesANSI S3.5-1997. (R2007). Methods for calculation of the speech intelligibility index. American National Standards Institute, New York, NY.
Bernstein, J., Summers, V., Grassi, E., & Grant, K. (2013). Auditory Models of Suprathreshold Distortion and Speech Intelligibility in Persons with Impaired Hearing. Journal of the Academy of Audiology, 24, 307-328.
Blanchfield, B.B., et. al. (2001). The severely to profoundly hearing-impaired population in the United States: Prevalence estimates and demographics. Journal of the Academy of Audiology, 12, 183-189.
Carhart, R. (1951). Basic principles of speech audiometry. Acta Otolarngologica, 40, 62-71.
Ching, T., Dillon, H., & Byrne, D. (1998). Speech recognition of hearing-impaired listeners: Predictions from audibility and the limited role of high-frequency amplification. Journal of the Acoustic Society of America, 103, 1128-1140.
Ching, T.Y.C., Dillon, H., Lockhart, F., van Wanrooy, E., & Flax, M. (2011). Audibility and speech intelligibility revisited: implications for amplification. In T. Dau, J.C. Dalsgaard, M.L. Jepsen, & T. Poulsen (Eds.) Speech Perception and Auditory Disorders, 3rd International Symposium on Auditory and Audiological Research. Denmark: The Danavox Jubilee Foundation.
Ching, T., Dillon, H., Katsch, R., & Byrne, D. (2001). Maximizing effective audibility in hearing aid fitting. Ear Hear, 22, 212-224.
Ching, T.Y.C. & Dillon, H. (2013 Early Online). A brief overview of factors affecting speech intelligibility of people with hearing loss: implications for amplification. American Journal of Audiology.
Cox, R.M., Alexander, G.C., & Gilmore, C. (1987). Development of the Connected Speech Test. Ear Hear, 8, 119-126.
Dillon, H. (2012). Hearing Aids (2nd Ed.). Turramurra, New South Wales, Australia. Boomerang Press.
Hornsby, B.W.Y. & Ricketts, T.A. (2003). The effects of hearing loss on the contribution of high- and low-frequency speech information to speech understand-ing. Journal of the Acoustic Society of America, 113, 1706-1717.
Hornsby, B.W.Y., Johnson, E.E., & Picou, E. (2011). Effects of degree and configuration of hearing loss on the contribution of high- and low- frequency speech information to bilateral speech understanding. Ear and Hearing, 32(5), 543-555.
Humes, L. (2002). Factors underlying the speech-recognition performance of elderly hearing-aid wearers. Journal of the Acoustic Society of America, 112, 1112-1132.
Johnson, E. (2013). Modern Prescription Theory and Application: Realistic Expectations for Speech Recognition with Hearing Aids. Trends in Amplification, 17(3), 143-170.
Johnson, E. & Dillon, H. (2011). A comparison of gain for adults from generic hearing aid prescriptive methods: Impacts on predicted loudness, frequency bandwidth, and speech intelligibility. Journal of the Academy of Audiology, 22(7), 441-459.
Kaland, M. & Salvatore, K. (2002) The psychology of hearing loss. The American Speech Hearing Association (ASHA) Leader.
Keidser, G., Dillon, H., Carter, L., & O’Brien, A. (2012). NAL-NL2 empirical adjustments. Trends in Amplification, 16, 211-223.
Keidser, G., Dillon, H., Flax, M., Ching, T., & Brewer, S. (2011). The NAL-NL2 prescription procedure. Audiology Research, 1, 88-90.
Kochkin, S. (2009). MarkeTrak VIII: 25 Year Trends in the Hearing Health Market. The Hearing Review, 16(11), 12-31
Kochkin, S. (2010). The efficacy of hearing aids in achieving compensation equity in the workplace. The Hearing Journal, 63, 9-28.
Lunner, T. (2003). Cognitive Function in Relation to Hearing Aid Use. International Journal of Audiology, Supplement, 42(1), 1S49-1S58.
Mason, T. (2011). The importance of binaural hearing. International Hearing Society 60th Annual Convention and Expo, Boston, MA.
Plomp, R. (1978). Auditory handicap of hearing impairment and the limited benefit of hearing aids. Journal of the Acoustic Society of America, 63, 533-549.
Plomp, R. & Duquesnoy, A.J. (1982). A model for the speech-reception threshold in noise without and with a hearing aid. Scandinavian Audiology 15, 95-111.
Scollie, S., Seewald, R., Cornelisse, L., et al. (2005). The desired sensation level multistage input/output algorithm. Trends in Amplification, 9, 159-197.
Studebaker, G., Sherbecoe, R., McDaniel, D., & Gray, G. (1997). Age-related changes in monosyllabic word recognition performance when audibility is held constant. Journal of the Academy of Audiology, 8, 150-162.
Sherbecoe, R. & Studebaker, G. (2003). Audibility-index functions of normal-hearing and hearing-impaired listeners’ performance on the Connected Speech Test. Ear and Hearing, 24, 71-88.
Taylor, B. (2009). Adults with severe hearing losses: Practical approaches to making hearing aid selection decisions. AudiologyOnline Course #13319. Retrieved from http://www.audiologyonline.com/articles/adults-with-severe-hearing-losses-887
Thibodeau, L. (2010). Benefits of adaptive FM systems on speech recognition in noise for listeners who use hearing aids. American Journal of Audiology, 19, 36-45.
Thibodeau, L. (2013). Wireless technology for persons with hearing loss. Innovations, 3(4), 20-25.
Tillman, T. & Carhart, R. (1966). An expanded test for speech discrimination utiliz-ing CNC monosyllabic words: Northwestern University auditory test no. 6 (USAF School of Aerospace Medicine Report No. SAM-TR-66-55). In J. B. Chalklin, I.M. Ventry, & R.F. Dixon (Eds.) Hearing measurement: A book of readings, 2nd Edition (pp. 226-235). Reading, MA: Addison Wesley.
Wilson, R. (2003). Development of a speech-in-multitalker-babble paradigm to as-sess word-recognition performance. Journal of the American Academy of Audiology, 14(9), 453–470.
Wilson, R. & Burks, C. (2005). Use of 35 words for evaluation of hearing loss in signal-to-babble ratio: A clinical protocol. Journal of Rehabilitation Research and Development, 42(6), 839-852.
Wilson, R. & Strouse, A. (2002). Northwestern University Auditory Test No. 6 in multi-talker babble: a preliminary report. Journal of Rehabilitation Research and Development, 39(1), 105–114.
Wolfe, J., Morias, M., Schafer, E., Mills, E., Mulders, H.E., Goldbeck, F., ... Lianos, L. (2013). Evaluation of speech recognition of cochlear implant recipients using a personal digital adaptive radio frequency system. Journal of the American Academy of Audiology, 24, 714-724.
Valente, M., Abrams, H., Benson, D., Chisolm, T., Citron, D., Hampton, D. Loavenbruck, A., Ricketts, T., Solodar, H., & Sweetow, R. (2006). Guidelines for the audiologic management of adult hearing impairment, Audiology Today, 18(5), 32-37.
Vernon, M. & Andrews, J. (1990) The psychology of deafness. New York, NY: Longman.
13Amplification Options for Individuals with Severe-to-Profound Sensorineural Hearing Loss Reprinted from Innovations: Volume 4, Issue 2, 2014

© 2014 Starkey Hearing Technologies. All Rights Reserved. 6/14 WTPR2628-00-EE-SG
StarkeyHearingTechnologies.com
Global Headquarters6700 Washington Ave S Eden Prairie, MN 55344