Embed Size (px)
Citation preview
Fertilizer N Management – More than Just Rate –
For Improved Crop Yields and Water Quality Clifford S. Snyder, PhD, CCA
Nitrogen Program Director (North America and Global)
International Plant Nutrition Institute Conway, Arkansas, USA 72034
Fluid Fertilizer Technology Conference Louisville, KY Dec. 8-9, 2015
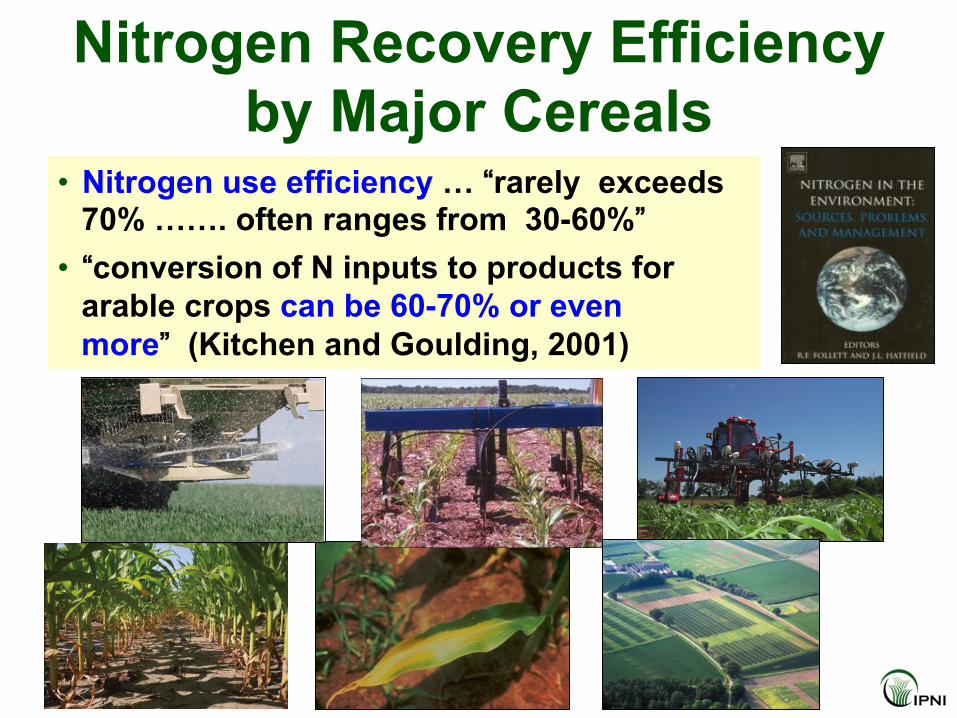
Nitrogen Recovery Efficiency by Major Cereals
• Nitrogen use efficiency … “rarely exceeds 70% ……. often ranges from 30-60%”
• “conversion of N inputs to products for arable crops can be 60-70% or even more” (Kitchen and Goulding, 2001)
Our Premise …… or Position More in the Crop = Less in the Environment
• Improved crop yields, and greater crop nutrient recovery and soil retention, should result in less risk of nutrient loss to water and air resources
• Without detailed tracking of fertilizer N BMP implementation within watersheds, there is no definitive way of identifying the cause of water quality changes
• Increased water quality monitoring and modeling will reflect whether agriculture is improving, ….. or not
• The larger the watershed, and the larger the waterbody, the greater the potential lag time in seeing water quality improvements
• Agronomically appropriate N rates are a fundamental part of the 4Rs
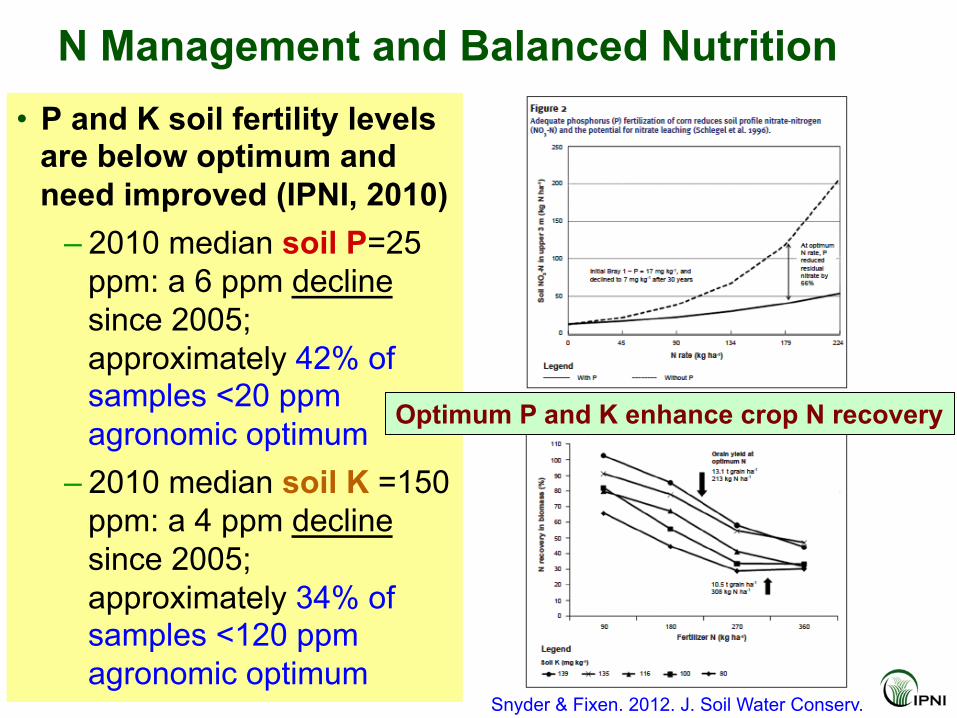
N Management and Balanced Nutrition • P and K soil fertility levels
are below optimum and need improved (IPNI, 2010)
– 2010 median soil P=25 ppm: a 6 ppm decline since 2005; approximately 42% of samples <20 ppm agronomic optimum
– 2010 median soil K =150 ppm: a 4 ppm decline since 2005; approximately 34% of samples <120 ppm agronomic optimum
Snyder & Fixen. 2012. J. Soil Water Conserv.
Optimum P and K enhance crop N recovery
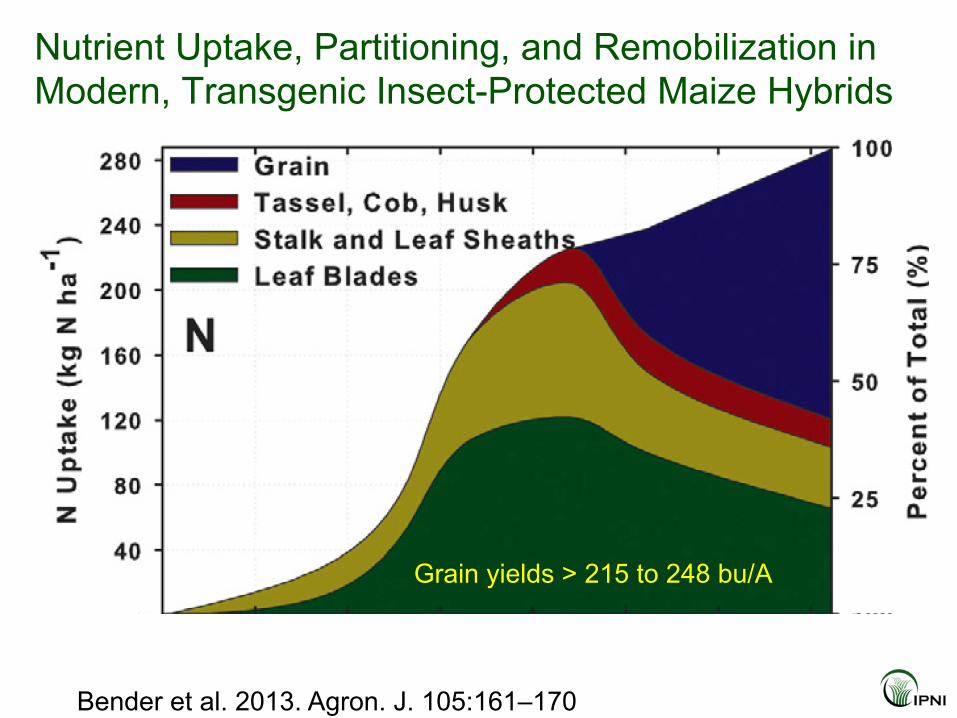
Nutrient Uptake, Partitioning, and Remobilization in Modern, Transgenic Insect-Protected Maize Hybrids
Bender et al. 2013. Agron. J. 105:161–170
Grain yields > 215 to 248 bu/A
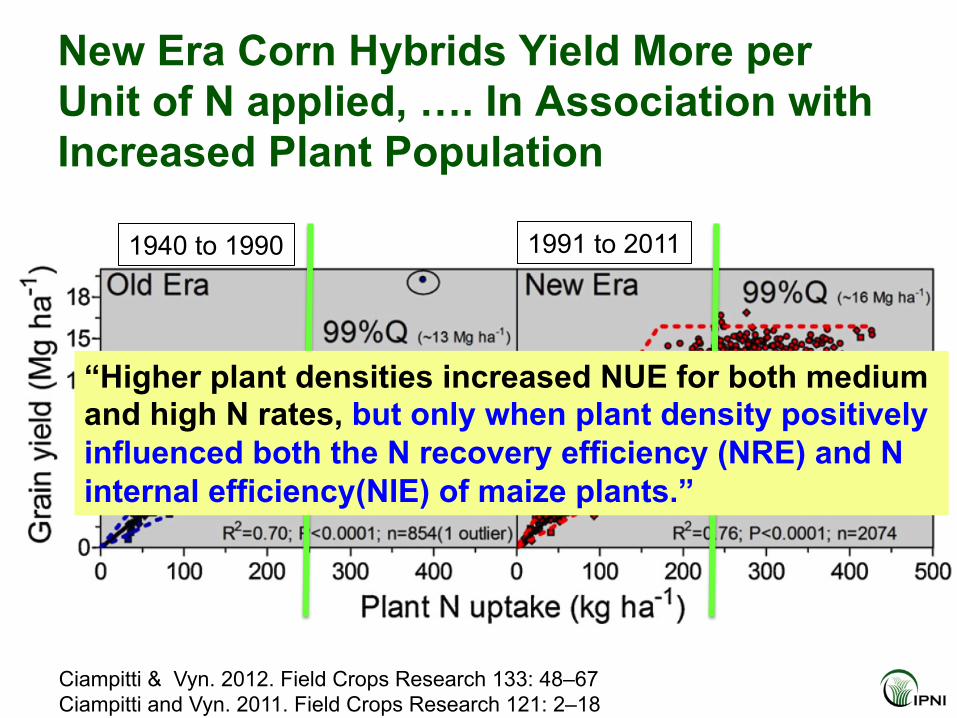
New Era Corn Hybrids Yield More per Unit of N applied, …. In Association with Increased Plant Population
Ciampitti & Vyn. 2012. Field Crops Research 133: 48–67 Ciampitti and Vyn. 2011. Field Crops Research 121: 2–18
1940 to 1990 1991 to 2011
“Higher plant densities increased NUE for both medium and high N rates, but only when plant density positively influenced both the N recovery efficiency (NRE) and N internal efficiency(NIE) of maize plants.”
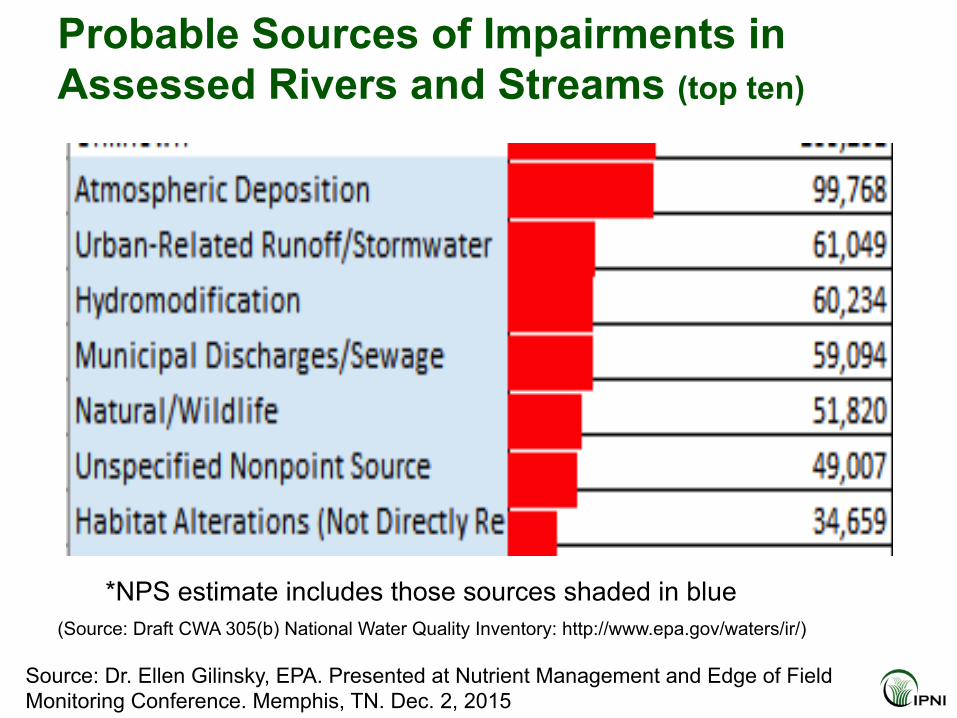
Probable Sources of Impairments in Assessed Rivers and Streams (top ten)
*NPS estimate includes those sources shaded in blue (Source: Draft CWA 305(b) National Water Quality Inventory: http://www.epa.gov/waters/ir/)
Source: Dr. Ellen Gilinsky, EPA. Presented at Nutrient Management and Edge of Field Monitoring Conference. Memphis, TN. Dec. 2, 2015
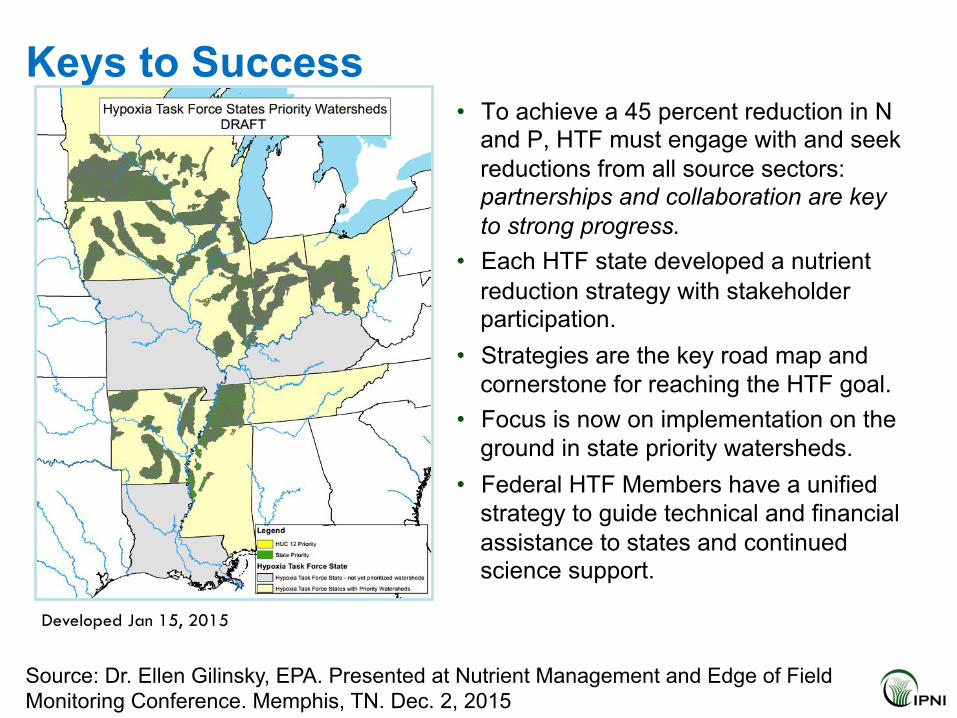
Keys to Success • To achieve a 45 percent reduction in N
and P, HTF must engage with and seek reductions from all source sectors: partnerships and collaboration are key to strong progress.
• Each HTF state developed a nutrient reduction strategy with stakeholder participation.
• Strategies are the key road map and cornerstone for reaching the HTF goal.
• Focus is now on implementation on the ground in state priority watersheds.
• Federal HTF Members have a unified strategy to guide technical and financial assistance to states and continued science support.
Developed Jan 15, 2015
Source: Dr. Ellen Gilinsky, EPA. Presented at Nutrient Management and Edge of Field Monitoring Conference. Memphis, TN. Dec. 2, 2015
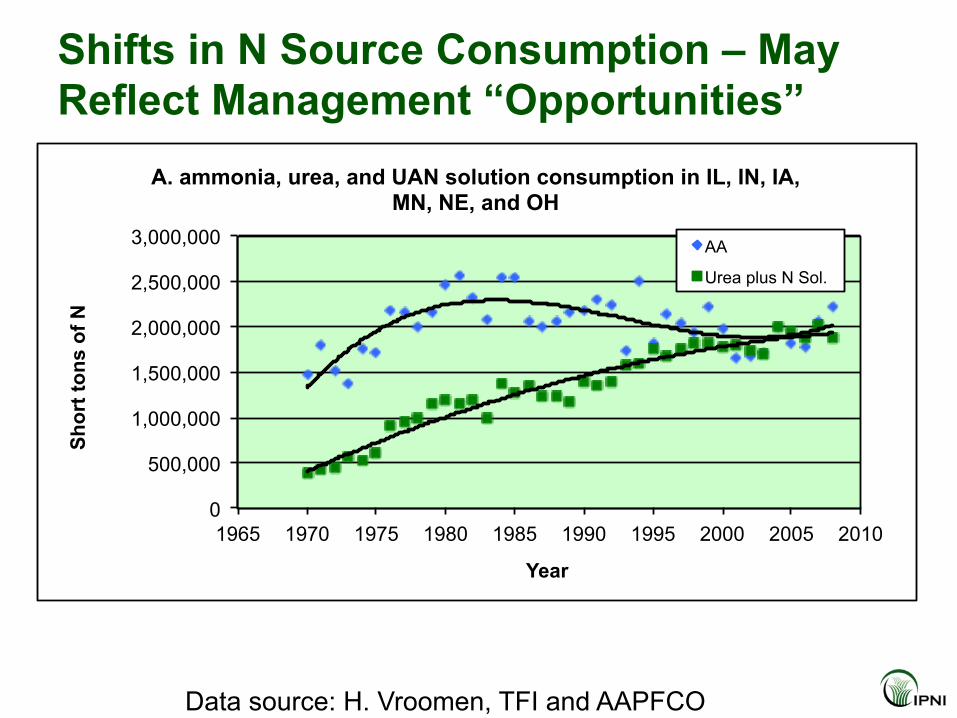
0
500,000
1,000,000
1,500,000
2,000,000
2,500,000
3,000,000
1965 1970 1975 1980 1985 1990 1995 2000 2005 2010
Shor
t ton
s of
N
Year
A. ammonia, urea, and UAN solution consumption in IL, IN, IA, MN, NE, and OH
AA
Urea plus N Sol.
Data source: H. Vroomen, TFI and AAPFCO
Shifts in N Source Consumption – May Reflect Management “Opportunities”
Data source: H. Vroomen, TFI and AAPFCO
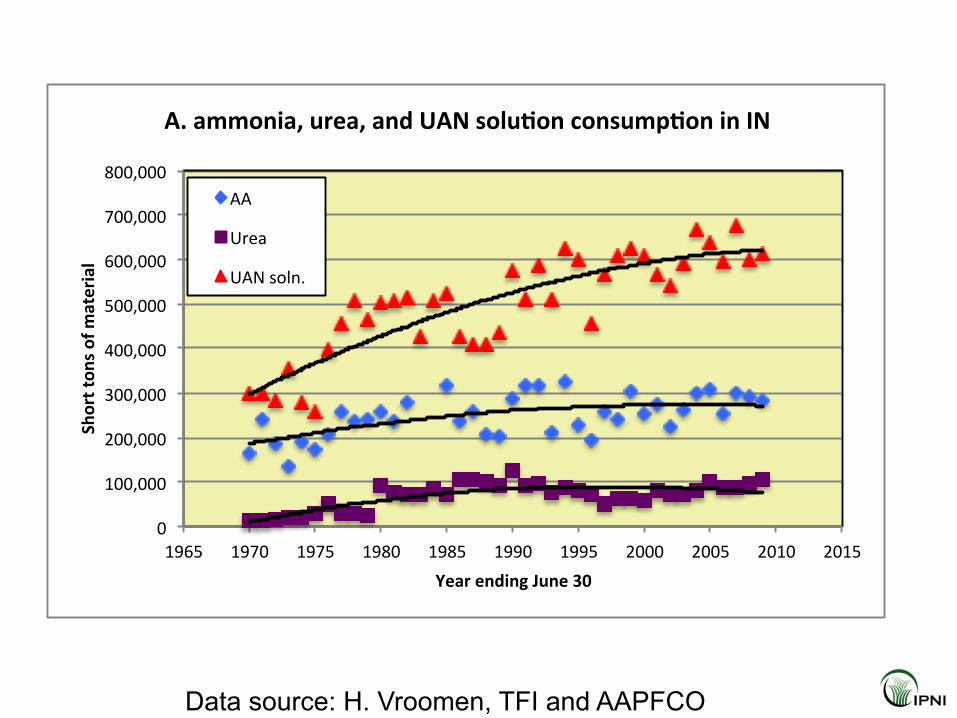
0"
100,000"
200,000"
300,000"
400,000"
500,000"
600,000"
700,000"
800,000"
1965" 1970" 1975" 1980" 1985" 1990" 1995" 2000" 2005" 2010" 2015"
Short&ton
s&of&m
aterial&
Year&ending&June&30&
A.&ammonia,&urea,&and&UAN&solu;on&consump;on&in&IN&
AA"
Urea"
UAN"soln."
0"
20,000"
40,000"
60,000"
80,000"
100,000"
120,000"
140,000"
160,000"
1965" 1970" 1975" 1980" 1985" 1990" 1995" 2000" 2005" 2010" 2015"
Short&ton
s&of&m
aterial&
Year&ending&June&30&
A.&ammonia,&urea,&and&UAN&solu;on&consump;on&in&KY&
AA"
Urea"
UAN"soln."
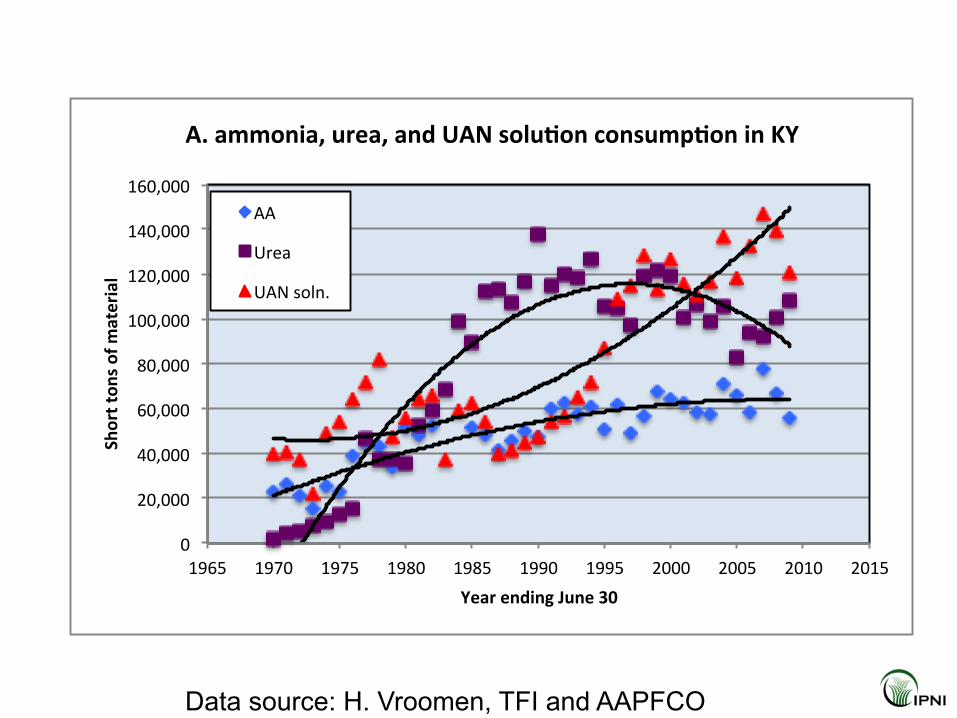
Data source: H. Vroomen, TFI and AAPFCO
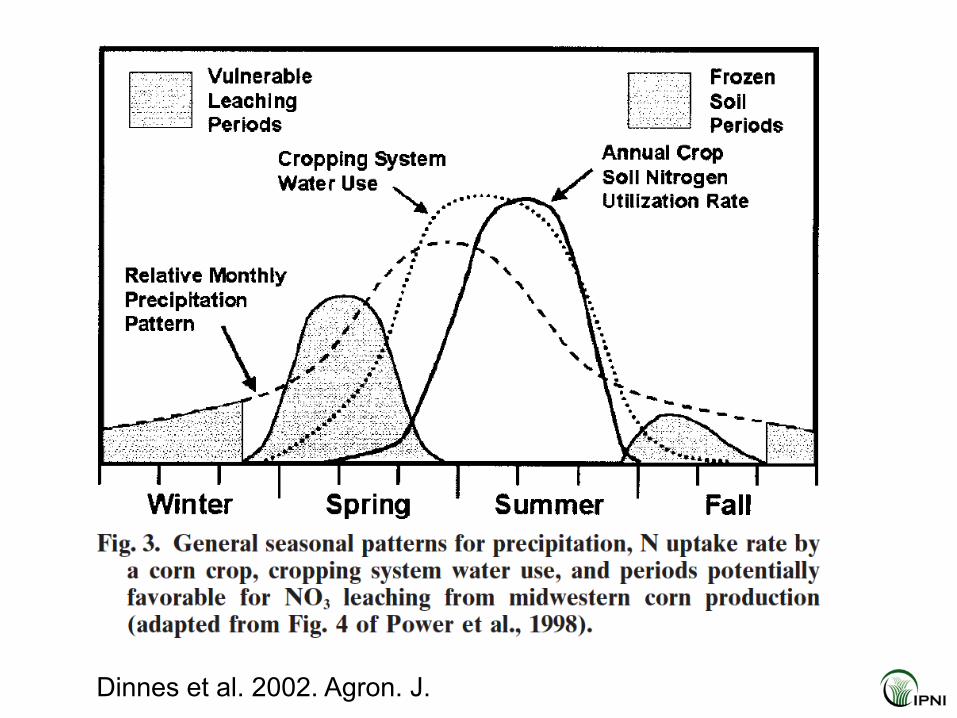
Dinnes et al. 2002. Agron. J.

• “ ……. Fertilizer N management, particularly rate and time of application, plays a dominant role in the loss of nitrate to surface waters.”
Source: Randall, G.W. 1997. Nitrate-N in surface waters as influenced by climatic conditions and agricultural practices. In Proc. Agric. and Hypoxia in the Mississippi Watershed Conf., St. Louis, MO. 14–15 July 1997. Am. Farm Bureau Federation, Park Ridge, IL. (and cited by Dinnes et al. 2002. Agron. J. 94:153–171)
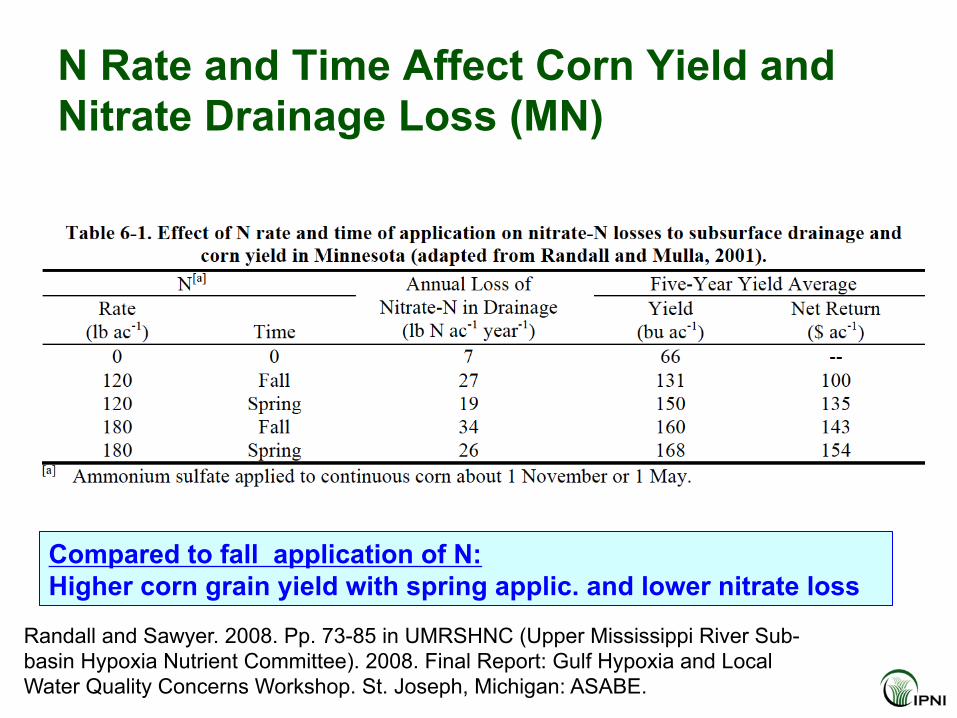
N Rate and Time Affect Corn Yield and Nitrate Drainage Loss (MN)
Randall and Sawyer. 2008. Pp. 73-85 in UMRSHNC (Upper Mississippi River Sub-basin Hypoxia Nutrient Committee). 2008. Final Report: Gulf Hypoxia and Local Water Quality Concerns Workshop. St. Joseph, Michigan: ASABE.
Compared to fall application of N: Higher corn grain yield with spring applic. and lower nitrate loss
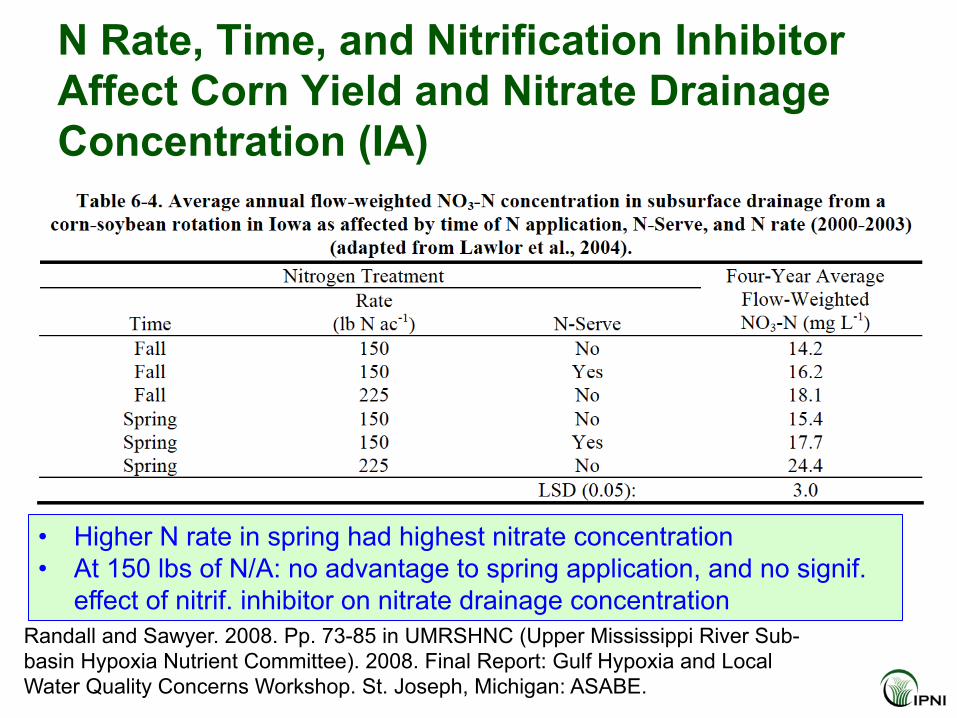
N Rate, Time, and Nitrification Inhibitor Affect Corn Yield and Nitrate Drainage Concentration (IA)
Randall and Sawyer. 2008. Pp. 73-85 in UMRSHNC (Upper Mississippi River Sub-basin Hypoxia Nutrient Committee). 2008. Final Report: Gulf Hypoxia and Local Water Quality Concerns Workshop. St. Joseph, Michigan: ASABE.
• Higher N rate in spring had highest nitrate concentration • At 150 lbs of N/A: no advantage to spring application, and no signif.
effect of nitrif. inhibitor on nitrate drainage concentration
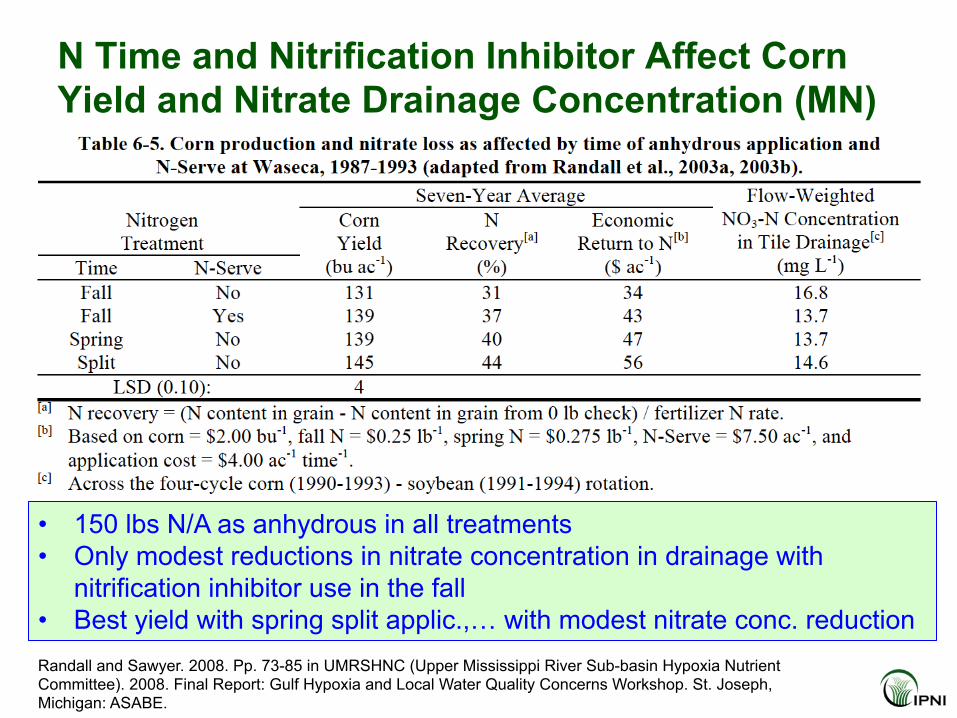
N Time and Nitrification Inhibitor Affect Corn Yield and Nitrate Drainage Concentration (MN)
Randall and Sawyer. 2008. Pp. 73-85 in UMRSHNC (Upper Mississippi River Sub-basin Hypoxia Nutrient Committee). 2008. Final Report: Gulf Hypoxia and Local Water Quality Concerns Workshop. St. Joseph, Michigan: ASABE.
• 150 lbs N/A as anhydrous in all treatments • Only modest reductions in nitrate concentration in drainage with
nitrification inhibitor use in the fall • Best yield with spring split applic.,… with modest nitrate conc. reduction
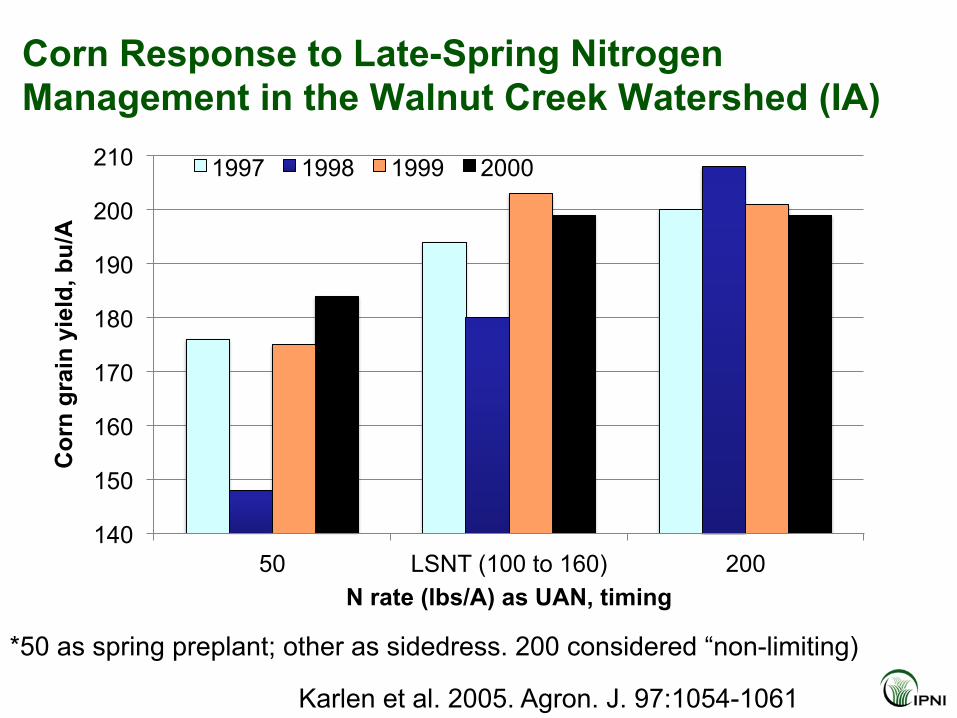
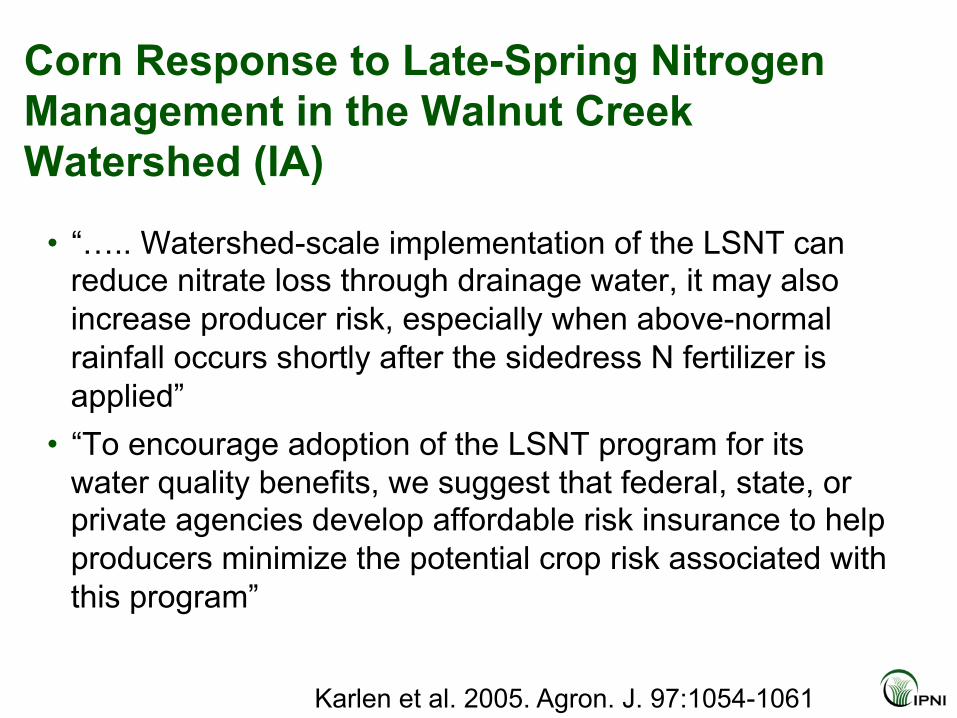
Corn Response to Late-Spring Nitrogen Management in the Walnut Creek Watershed (IA)
140
150
160
170
180
190
200
210
50 LSNT (100 to 160) 200
Cor
n gr
ain
yiel
d, b
u/A
N rate (lbs/A) as UAN, timing
1997 1998 1999 2000
*50 as spring preplant; other as sidedress. 200 considered “non-limiting)
Karlen et al. 2005. Agron. J. 97:1054-1061
Corn Response to Late-Spring Nitrogen Management in the Walnut Creek Watershed (IA)
• “….. Watershed-scale implementation of the LSNT can reduce nitrate loss through drainage water, it may also increase producer risk, especially when above-normal rainfall occurs shortly after the sidedress N fertilizer is applied”
• “To encourage adoption of the LSNT program for its water quality benefits, we suggest that federal, state, or private agencies develop affordable risk insurance to help producers minimize the potential crop risk associated with this program”
Karlen et al. 2005. Agron. J. 97:1054-1061
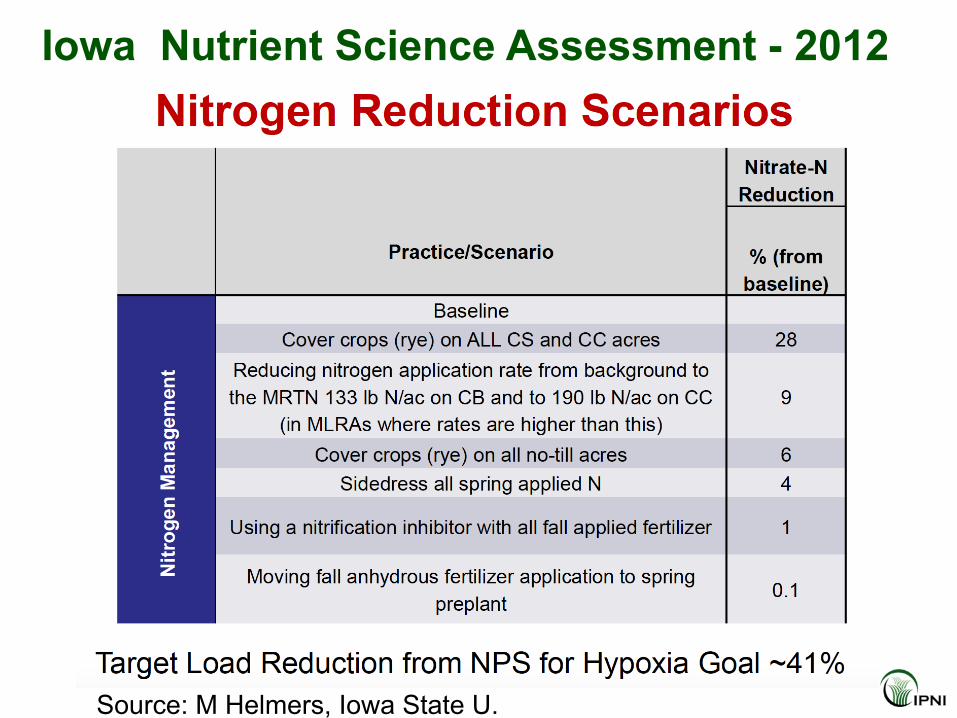
Iowa Nutrient Science Assessment - 2012
Source: M Helmers, Iowa State U.
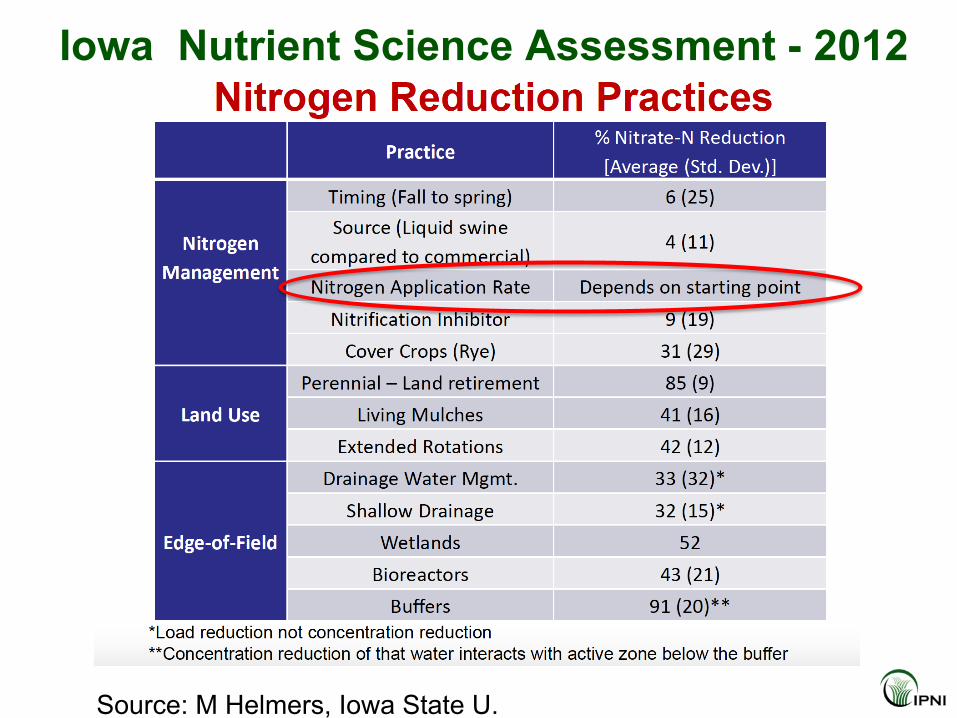
Iowa Nutrient Science Assessment - 2012
Source: M Helmers, Iowa State U.
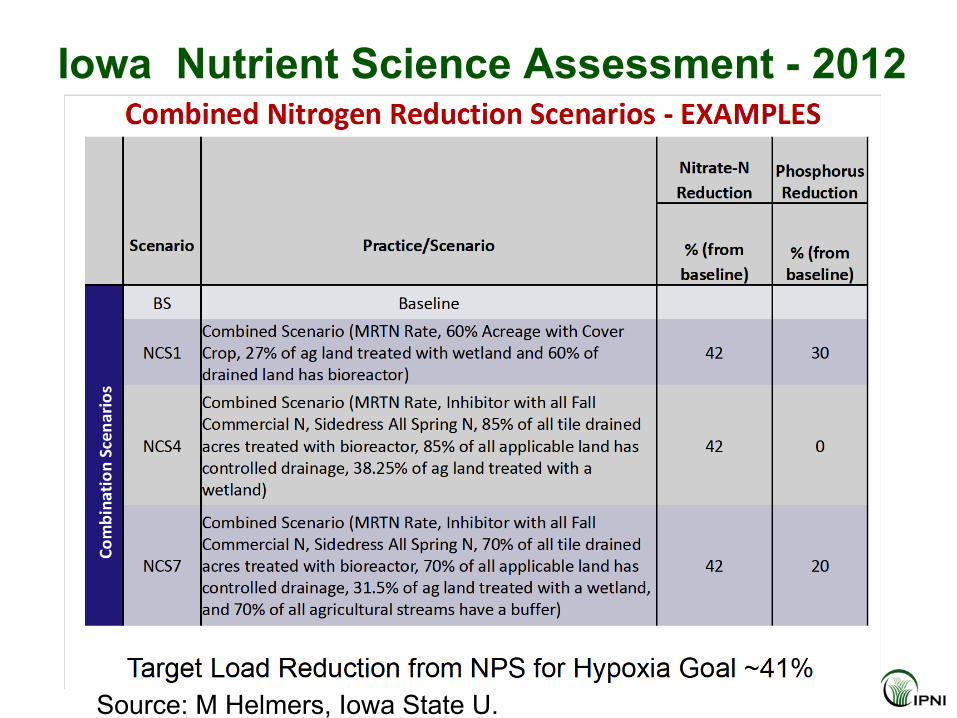
Iowa Nutrient Science Assessment - 2012
Source: M Helmers, Iowa State U.
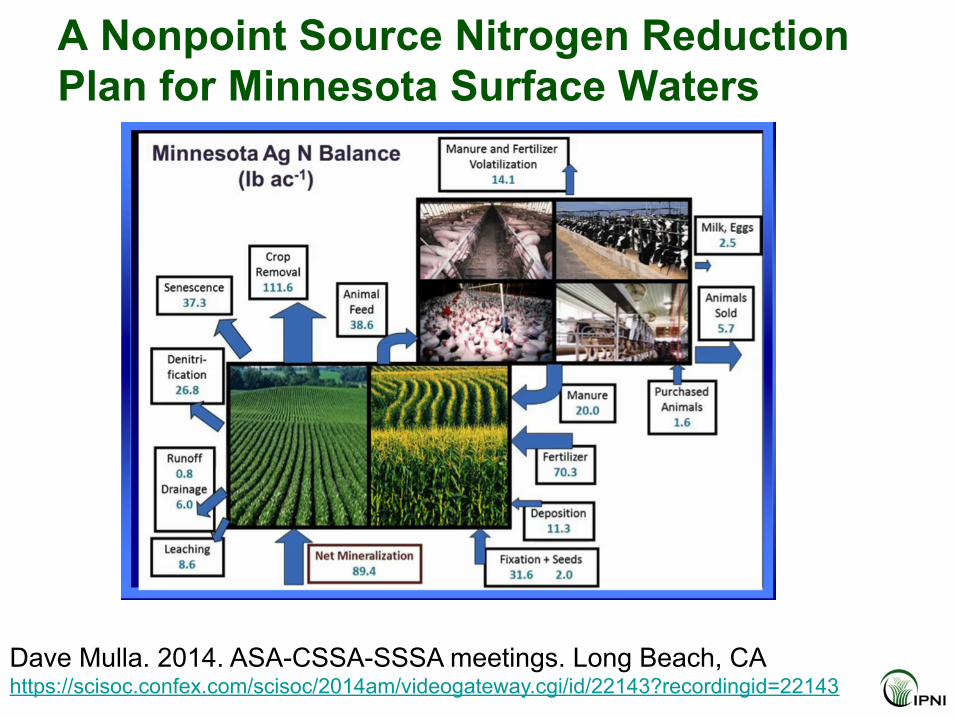
A Nonpoint Source Nitrogen Reduction Plan for Minnesota Surface Waters
Dave Mulla. 2014. ASA-CSSA-SSSA meetings. Long Beach, CA https://scisoc.confex.com/scisoc/2014am/videogateway.cgi/id/22143?recordingid=22143
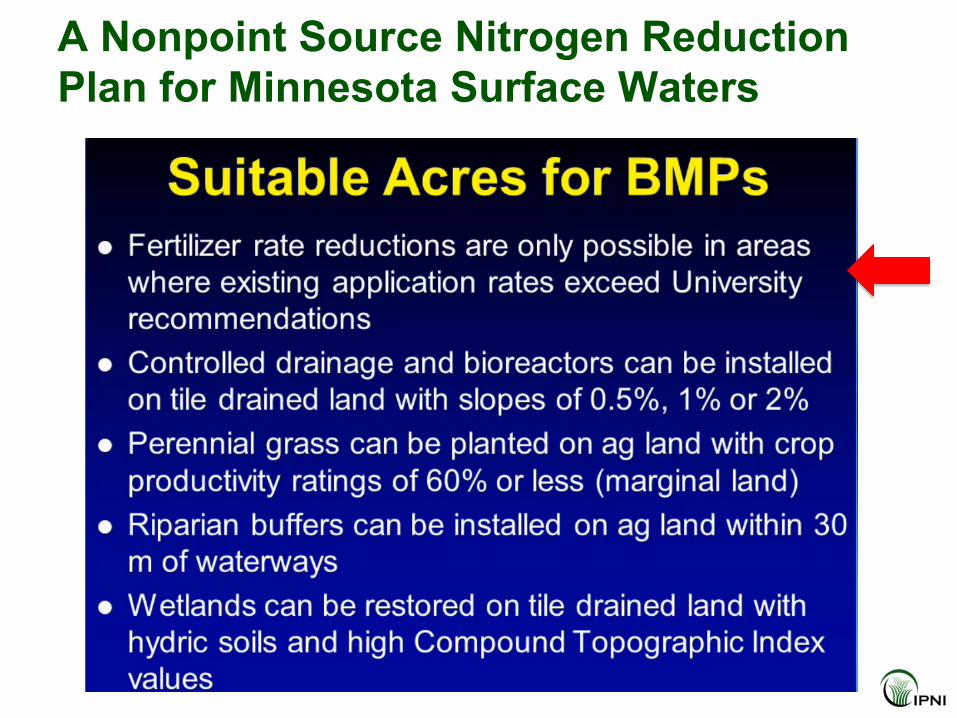
A Nonpoint Source Nitrogen Reduction Plan for Minnesota Surface Waters
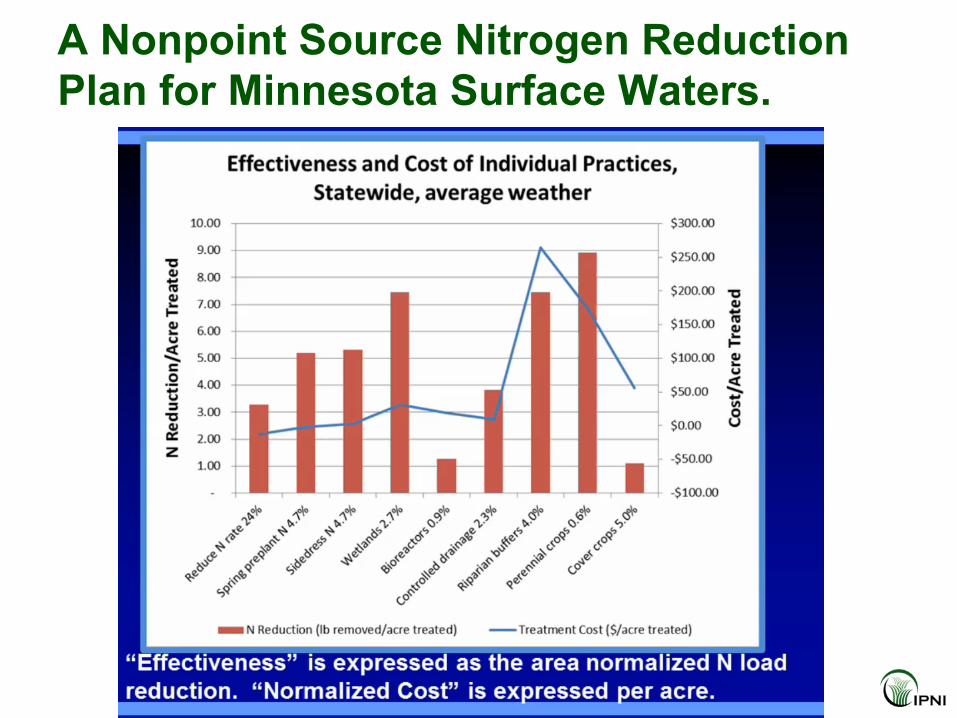
A Nonpoint Source Nitrogen Reduction Plan for Minnesota Surface Waters.
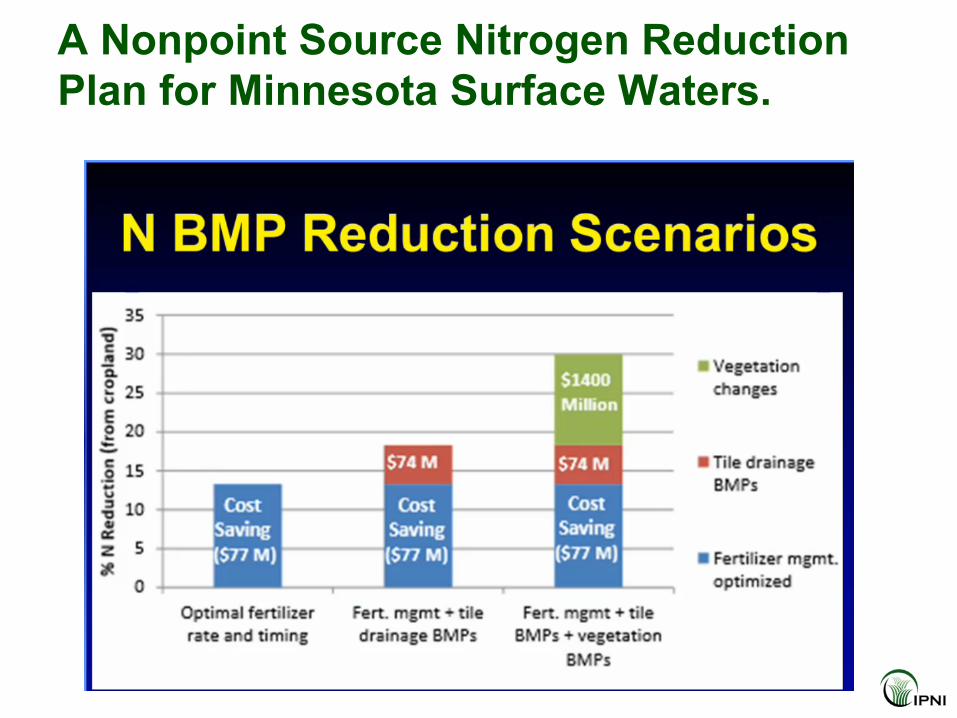
A Nonpoint Source Nitrogen Reduction Plan for Minnesota Surface Waters.
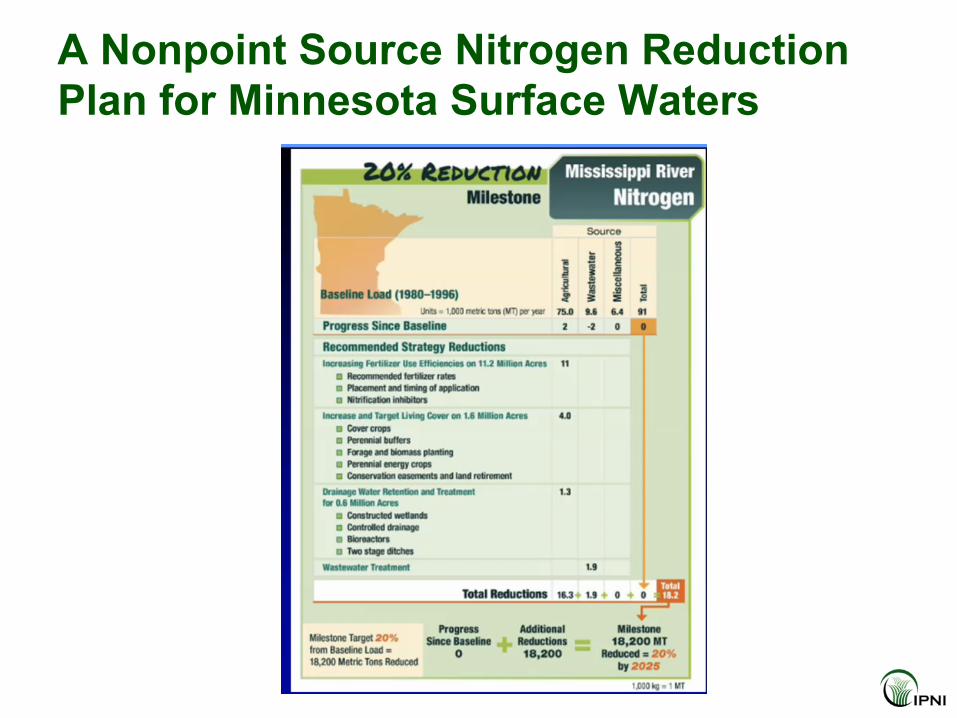
A Nonpoint Source Nitrogen Reduction Plan for Minnesota Surface Waters
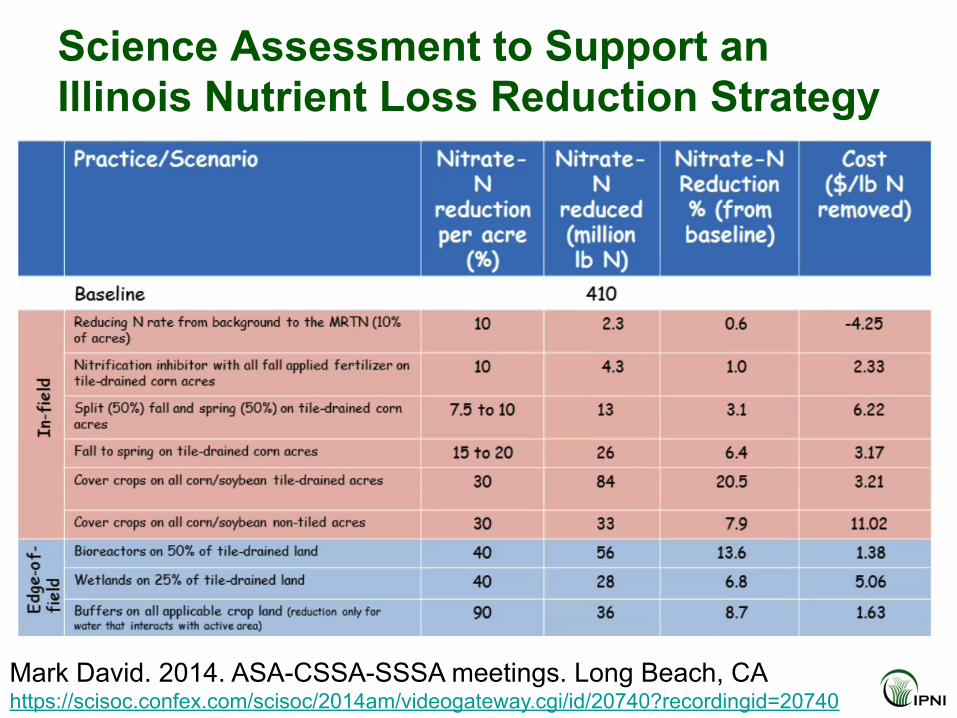
Science Assessment to Support an Illinois Nutrient Loss Reduction Strategy
Mark David. 2014. ASA-CSSA-SSSA meetings. Long Beach, CA https://scisoc.confex.com/scisoc/2014am/videogateway.cgi/id/20740?recordingid=20740
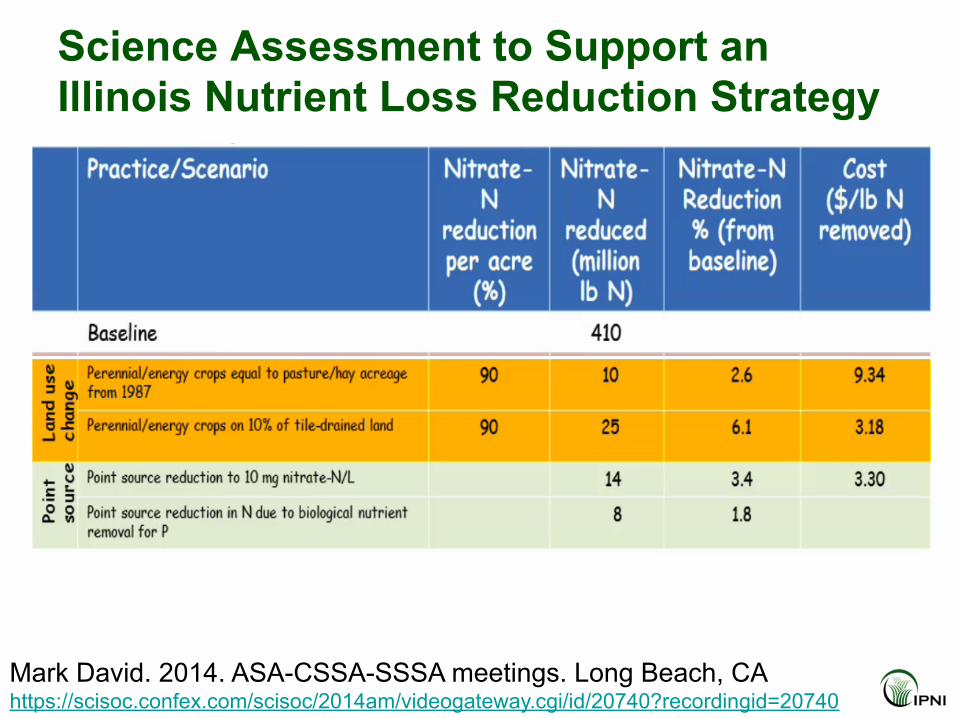
Science Assessment to Support an Illinois Nutrient Loss Reduction Strategy
Mark David. 2014. ASA-CSSA-SSSA meetings. Long Beach, CA https://scisoc.confex.com/scisoc/2014am/videogateway.cgi/id/20740?recordingid=20740

Mark David. 2014. ASA-CSSA-SSSA meetings. Long Beach, CA https://scisoc.confex.com/scisoc/2014am/videogateway.cgi/id/20740?recordingid=20740
Mark David. 2014. ASA-CSSA-SSSA meetings. Long Beach, CA https://scisoc.confex.com/scisoc/2014am/videogateway.cgi/id/20740?recordingid=20740
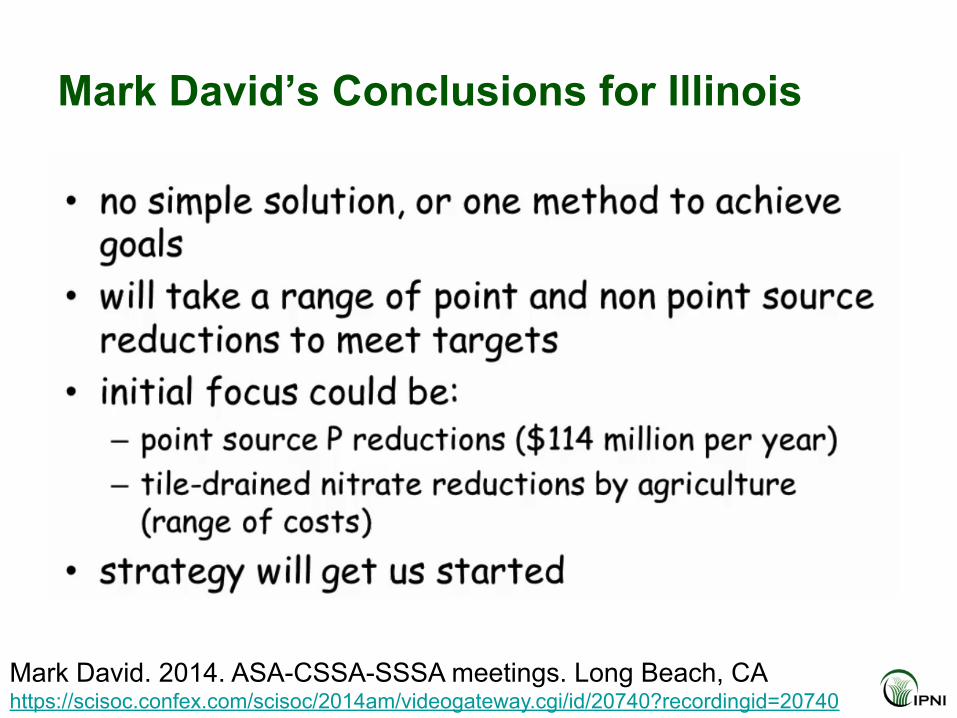
Mark David’s Conclusions for Illinois
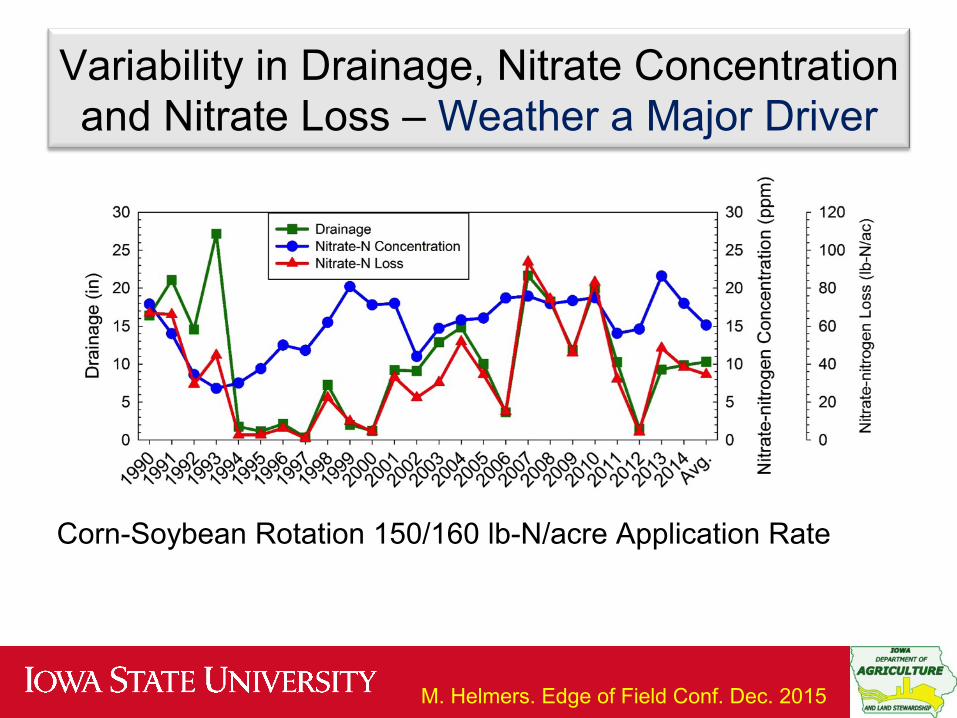
1990
1991
1992
1993
1994
1995
1996
1997
1998
1999
2000
2001
2002
2003
2004
Averag
e
Dra
inag
e (in
)
0
5
10
15
20
25
30
Nitr
ate-
nitro
gen
Con
cent
ratio
n (p
pm)
0
5
10
15
20
25
30
Nitr
ate-
nitro
gen
Loss
(lb-
N/a
c)
0
20
40
60
80DrainageNitrate-N ConcentrationNitrate-N Loss
Corn-Soybean Rotation 150/160 lb-N/acre Application Rate
Variability in Drainage, Nitrate Concentration and Nitrate Loss – Weather a Major Driver
M. Helmers. Edge of Field Conf. Dec. 2015
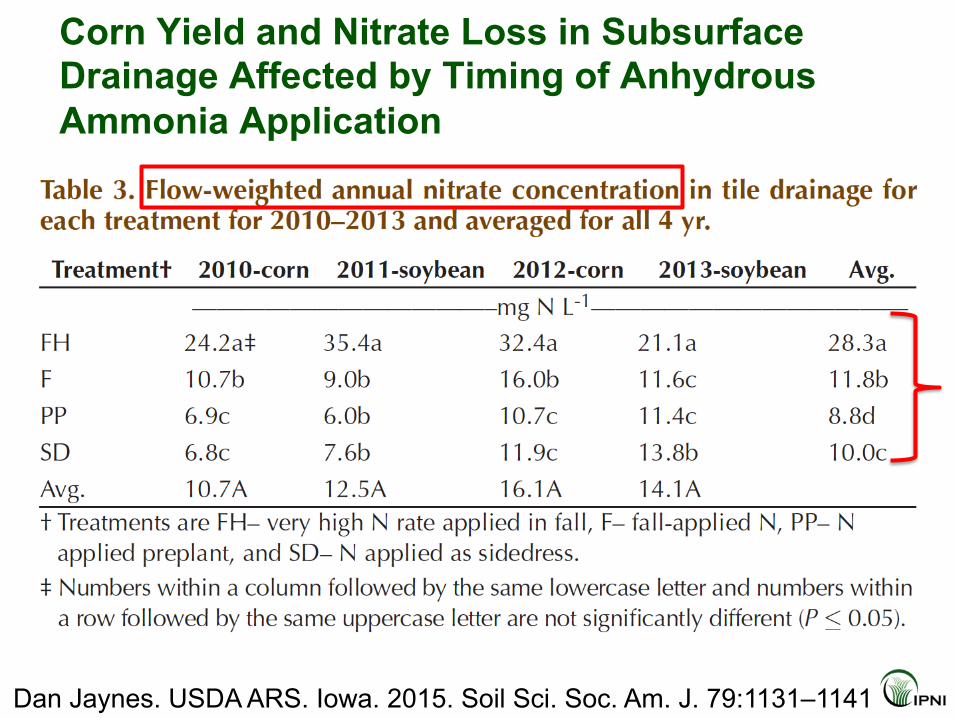
Dan Jaynes. USDA ARS. Iowa. 2015. Soil Sci. Soc. Am. J. 79:1131–1141
Corn Yield and Nitrate Loss in Subsurface Drainage Affected by Timing of Anhydrous Ammonia Application
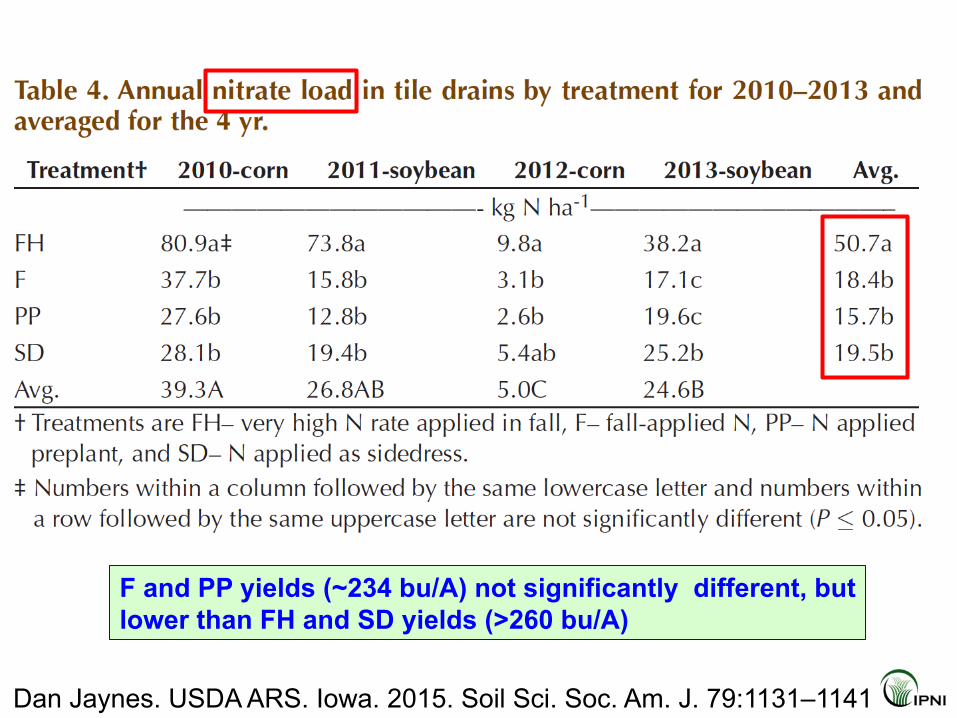
Dan Jaynes. USDA ARS. Iowa. 2015. Soil Sci. Soc. Am. J. 79:1131–1141
F and PP yields (~234 bu/A) not significantly different, but lower than FH and SD yields (>260 bu/A)
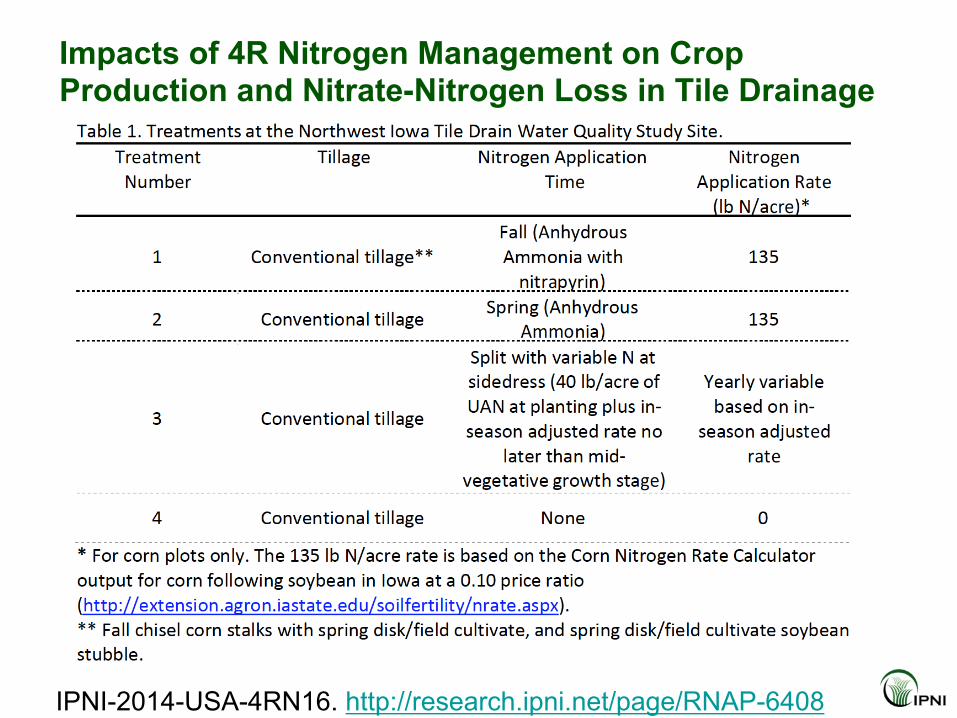
Impacts of 4R Nitrogen Management on Crop Production and Nitrate-Nitrogen Loss in Tile Drainage
IPNI-2014-USA-4RN16. http://research.ipni.net/page/RNAP-6408

reconstructed prairie
corn - soybean row crops, ZERO TILLAGE
Experimental Watershed Treatments
12 watersheds: Balanced Incomplete Block Design: 3 reps X 4 treatments X 3 blocks
0% 10% 10% 20%
Iowa State U., M. Helmers. Edge of Field Conf. Dec. 2015
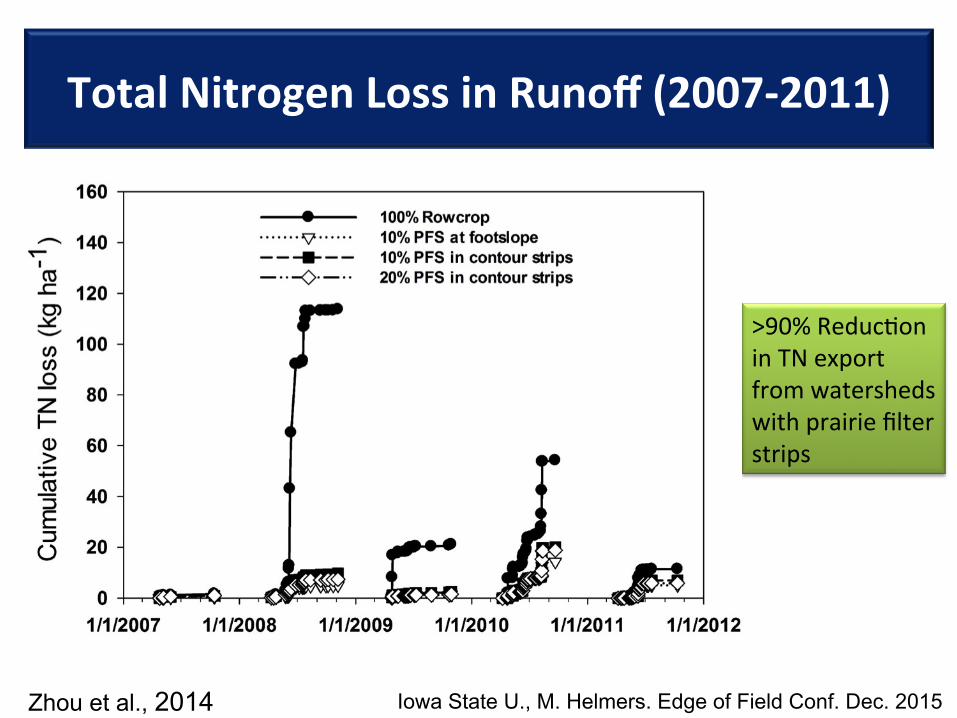
Total Nitrogen Loss in Runoff (2007-‐2011)
Zhou et al., 2014
>90% Reduc+on in TN export from watersheds with prairie filter strips
Iowa State U., M. Helmers. Edge of Field Conf. Dec. 2015
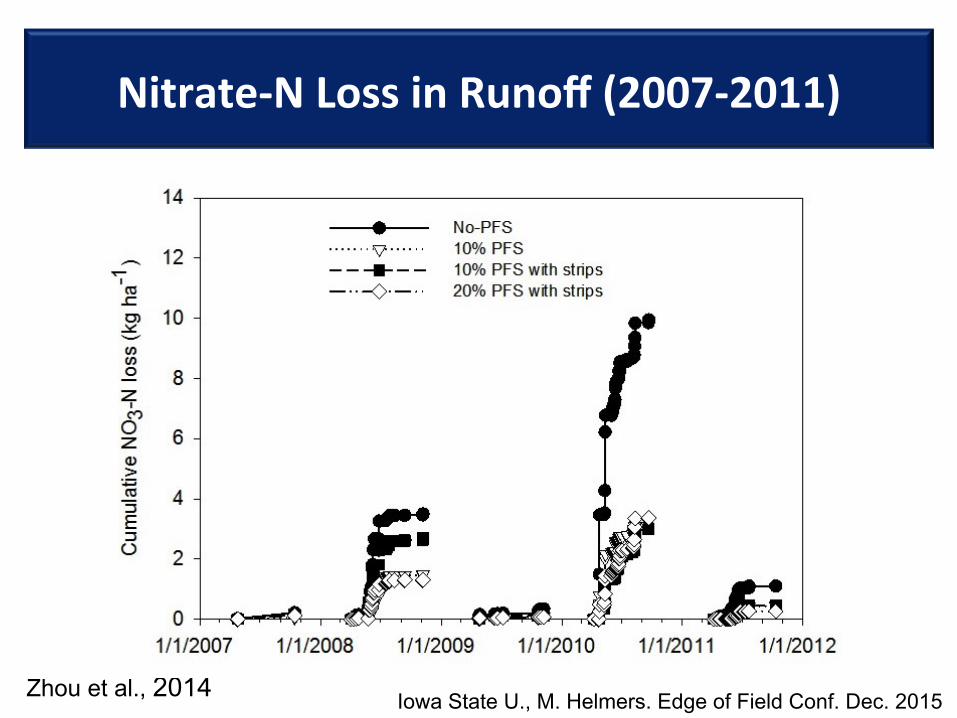
Nitrate-‐N Loss in Runoff (2007-‐2011)
Zhou et al., 2014 Iowa State U., M. Helmers. Edge of Field Conf. Dec. 2015
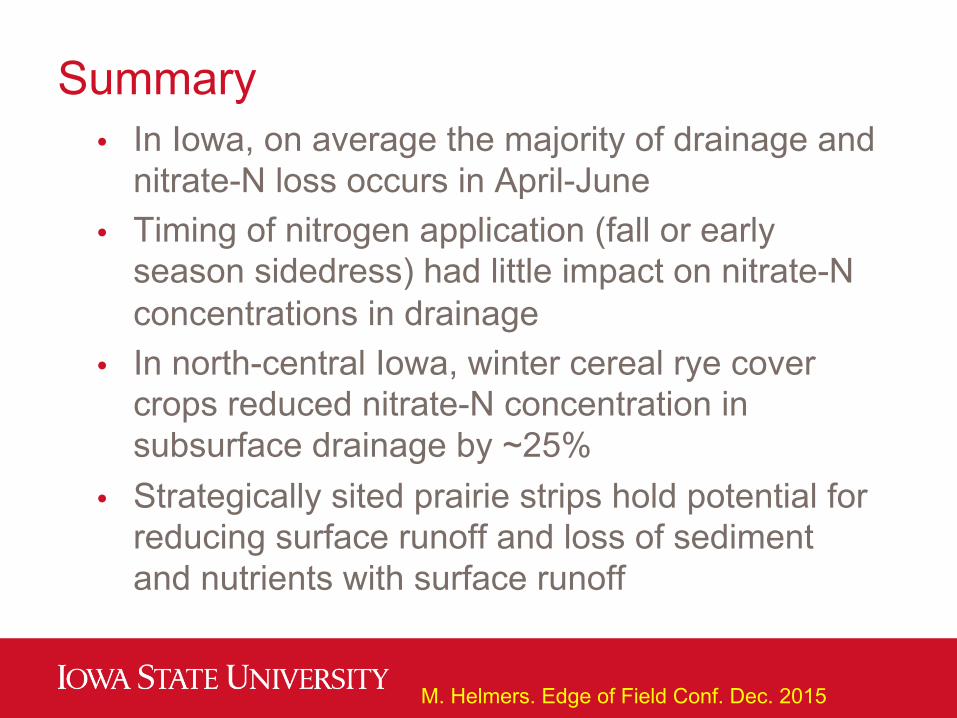
Summary • In Iowa, on average the majority of drainage and
nitrate-N loss occurs in April-June • Timing of nitrogen application (fall or early
season sidedress) had little impact on nitrate-N concentrations in drainage
• In north-central Iowa, winter cereal rye cover crops reduced nitrate-N concentration in subsurface drainage by ~25%
• Strategically sited prairie strips hold potential for reducing surface runoff and loss of sediment and nutrients with surface runoff
M. Helmers. Edge of Field Conf. Dec. 2015
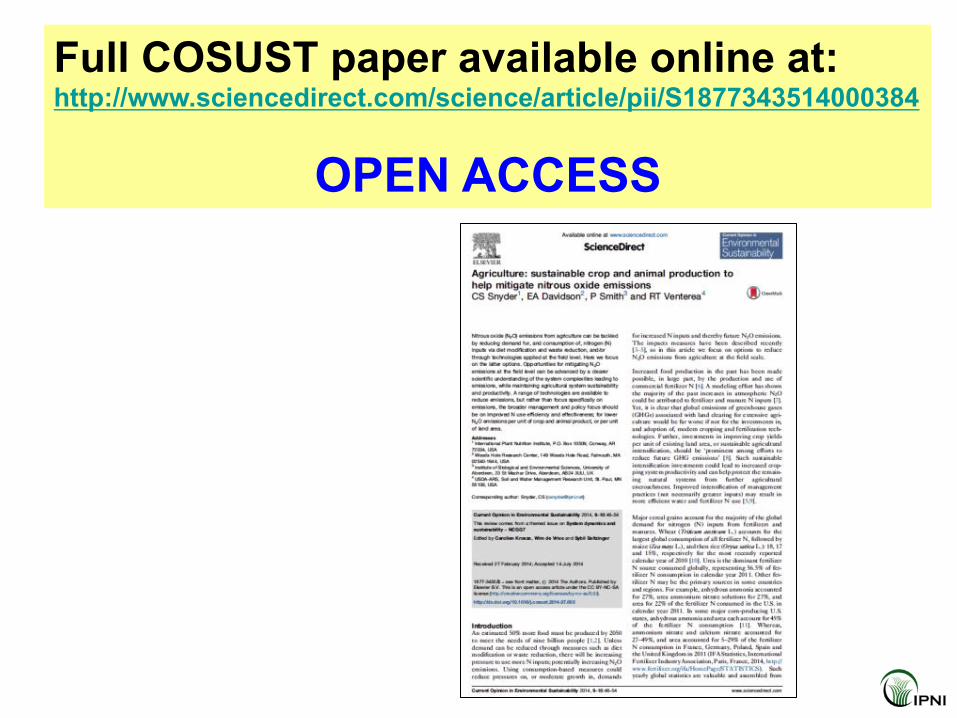
Full COSUST paper available online at: http://www.sciencedirect.com/science/article/pii/S1877343514000384
OPEN ACCESS

Recent Examples of N Management Changes on N2O Emission Reduction (1 of 4)
Comparison technology or N practice
Reference technology or
fertilizer N practice
Emission reduction
(%) Comment [COSUST paper reference]
Urea with urease inhibitor (UI) Urea alone Nil
Meta analysis; 35 studies [36] 1
Nitrification inhibitor (NI) or polymer coated urea (PCU)
Conventional N, no inhibitor or polymer
coating 35-38
Urea Anhydrous ammonia 50 15-yr.-old corn-soybean system [33] 2
Change in time, source, place
Standard or reference N management 20-80
Summary of >20 studies [37] 1
Urea ammonium nitrate (UAN) with NI UAN with no inhibitor 19-67
Side-dressed UAN, subsurface colter-applied at V4-V6 [41] 2
1 range of agricultural crops 2 corn (maize)
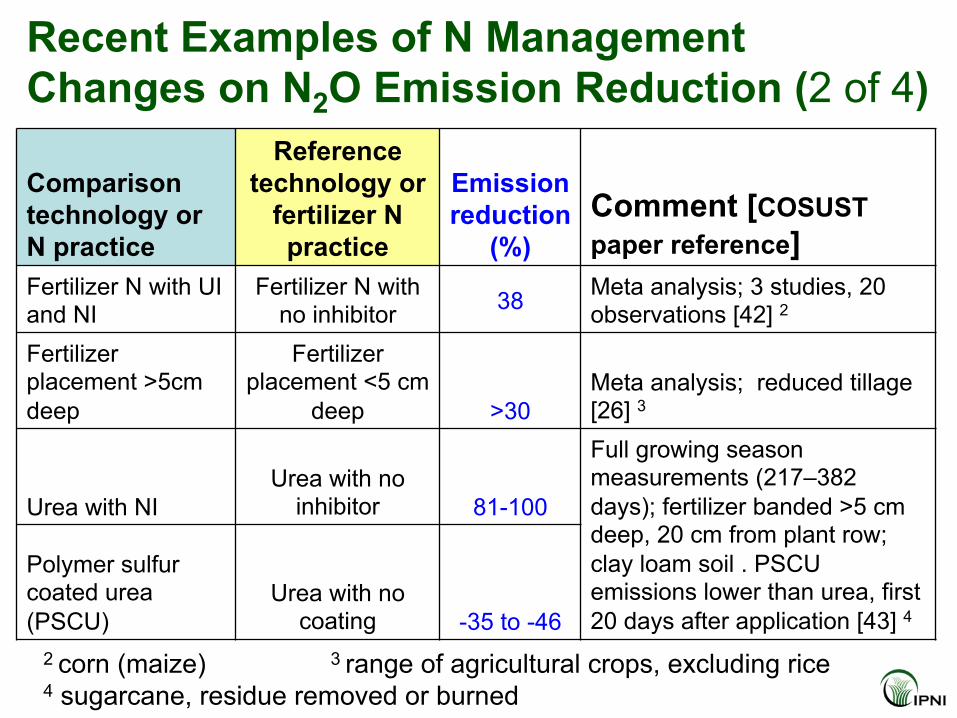
Recent Examples of N Management Changes on N2O Emission Reduction (2 of 4)
Comparison technology or N practice
Reference technology or
fertilizer N practice
Emission reduction
(%) Comment [COSUST paper reference]
Fertilizer N with UI and NI
Fertilizer N with no inhibitor 38 Meta analysis; 3 studies, 20
observations [42] 2 Fertilizer placement >5cm deep
Fertilizer placement <5 cm
deep >30 Meta analysis; reduced tillage [26] 3
Urea with NI Urea with no
inhibitor 81-100
Full growing season measurements (217–382 days); fertilizer banded >5 cm deep, 20 cm from plant row; clay loam soil . PSCU emissions lower than urea, first 20 days after application [43] 4
Polymer sulfur coated urea (PSCU)
Urea with no coating -35 to -46
2 corn (maize) 3 range of agricultural crops, excluding rice 4 sugarcane, residue removed or burned
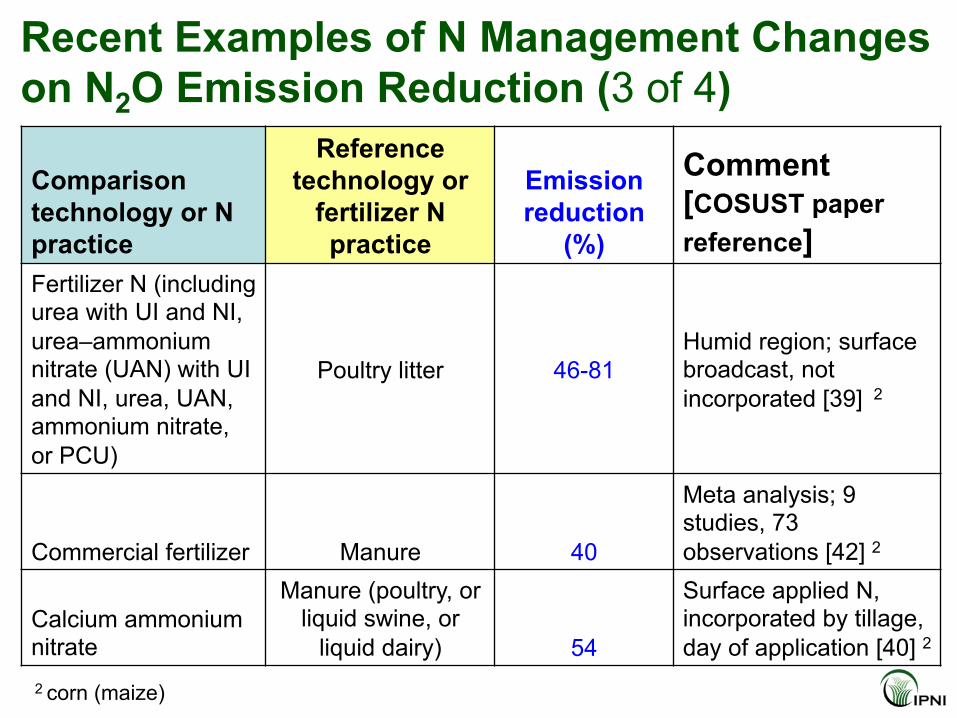
Recent Examples of N Management Changes on N2O Emission Reduction (3 of 4)
Comparison technology or N practice
Reference technology or
fertilizer N practice
Emission reduction
(%)
Comment [COSUST paper reference]
Fertilizer N (including urea with UI and NI, urea–ammonium nitrate (UAN) with UI and NI, urea, UAN, ammonium nitrate, or PCU)
Poultry litter 46-81 Humid region; surface broadcast, not incorporated [39] 2
Commercial fertilizer Manure 40
Meta analysis; 9 studies, 73 observations [42] 2
Calcium ammonium nitrate
Manure (poultry, or liquid swine, or
liquid dairy) 54
Surface applied N, incorporated by tillage, day of application [40] 2
2 corn (maize)
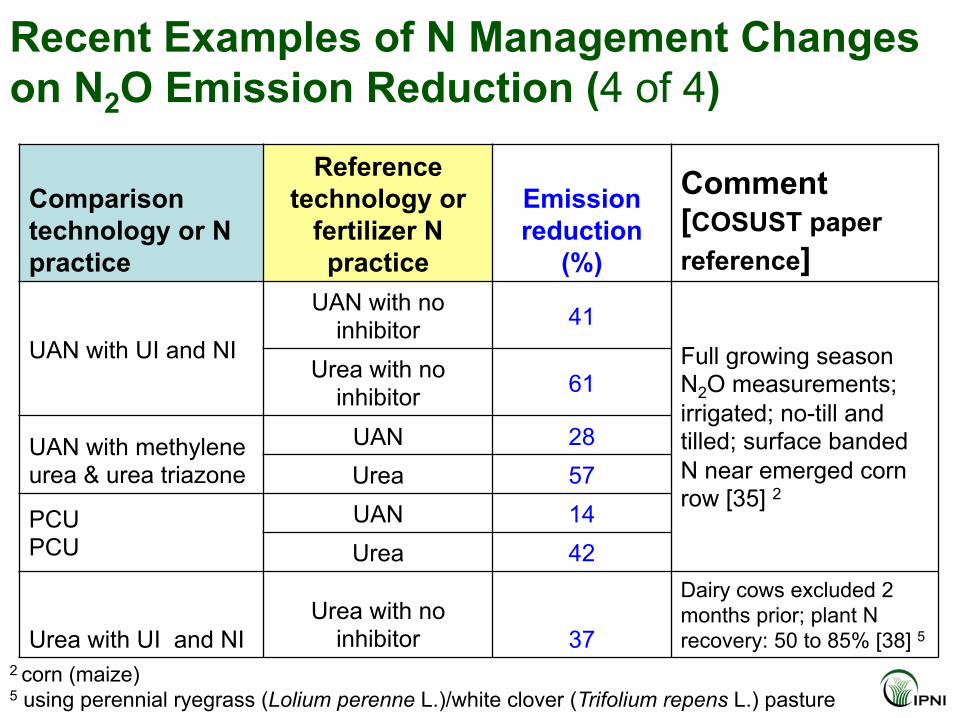
Recent Examples of N Management Changes on N2O Emission Reduction (4 of 4)
Comparison technology or N practice
Reference technology or
fertilizer N practice
Emission reduction
(%)
Comment [COSUST paper reference]
UAN with UI and NI
UAN with no inhibitor 41
Full growing season N2O measurements; irrigated; no-till and tilled; surface banded N near emerged corn row [35] 2
Urea with no inhibitor 61
UAN with methylene urea & urea triazone
UAN 28 Urea 57
PCU PCU
UAN 14 Urea 42
Urea with UI and NI Urea with no
inhibitor 37
Dairy cows excluded 2 months prior; plant N recovery: 50 to 85% [38] 5
2 corn (maize) 5 using perennial ryegrass (Lolium perenne L.)/white clover (Trifolium repens L.) pasture
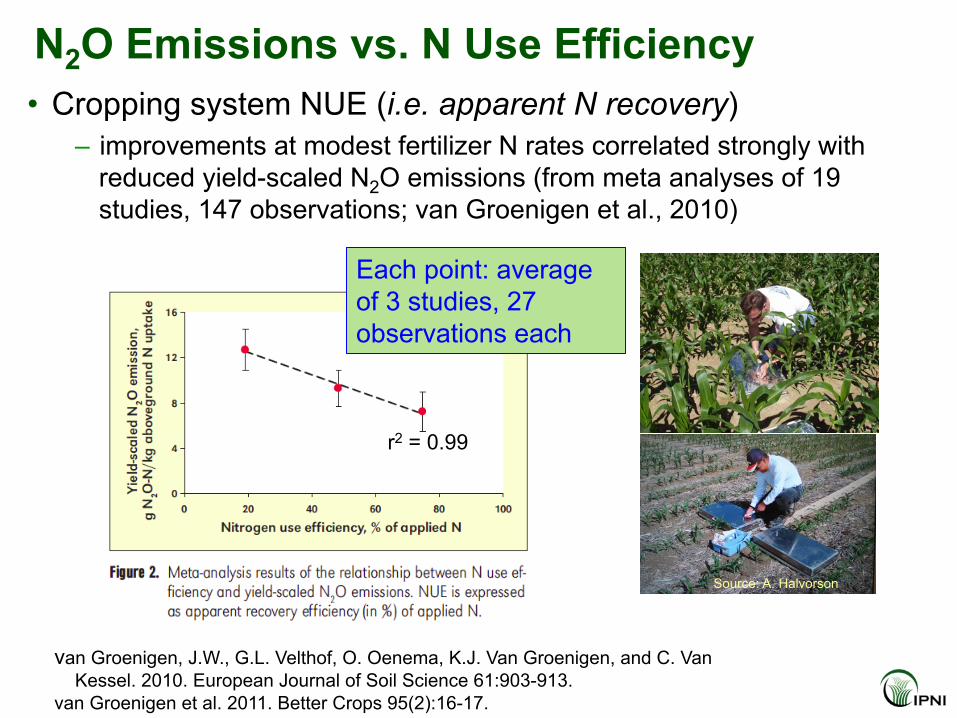
N2O Emissions vs. N Use Efficiency • Cropping system NUE (i.e. apparent N recovery)
– improvements at modest fertilizer N rates correlated strongly with reduced yield-scaled N2O emissions (from meta analyses of 19 studies, 147 observations; van Groenigen et al., 2010)
van Groenigen, J.W., G.L. Velthof, O. Oenema, K.J. Van Groenigen, and C. Van Kessel. 2010. European Journal of Soil Science 61:903-913. van Groenigen et al. 2011. Better Crops 95(2):16-17.
Source: A. Halvorson
Each point: average of 3 studies, 27 observations each
r2 = 0.99
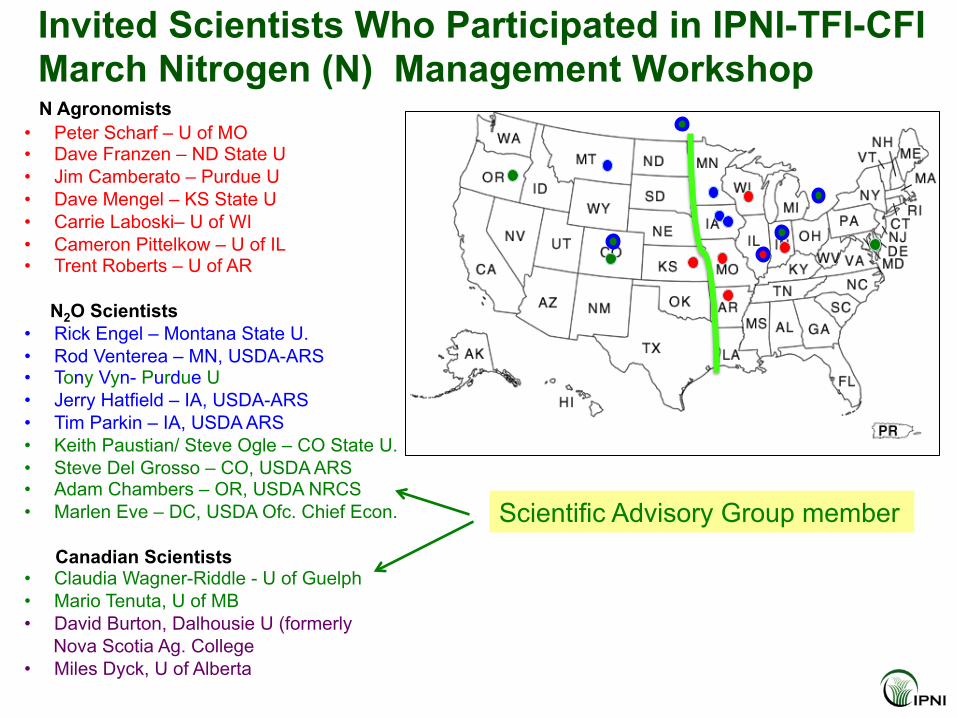
N Agronomists • Peter Scharf – U of MO • Dave Franzen – ND State U • Jim Camberato – Purdue U • Dave Mengel – KS State U • Carrie Laboski– U of WI • Cameron Pittelkow – U of IL • Trent Roberts – U of AR N2O Scientists • Rick Engel – Montana State U. • Rod Venterea – MN, USDA-ARS • Tony Vyn- Purdue U • Jerry Hatfield – IA, USDA-ARS • Tim Parkin – IA, USDA ARS • Keith Paustian/ Steve Ogle – CO State U. • Steve Del Grosso – CO, USDA ARS • Adam Chambers – OR, USDA NRCS • Marlen Eve – DC, USDA Ofc. Chief Econ.
Canadian Scientists • Claudia Wagner-Riddle - U of Guelph • Mario Tenuta, U of MB • David Burton, Dalhousie U (formerly
Nova Scotia Ag. College • Miles Dyck, U of Alberta
Invited Scientists Who Participated in IPNI-TFI-CFI March Nitrogen (N) Management Workshop
Scientific Advisory Group member
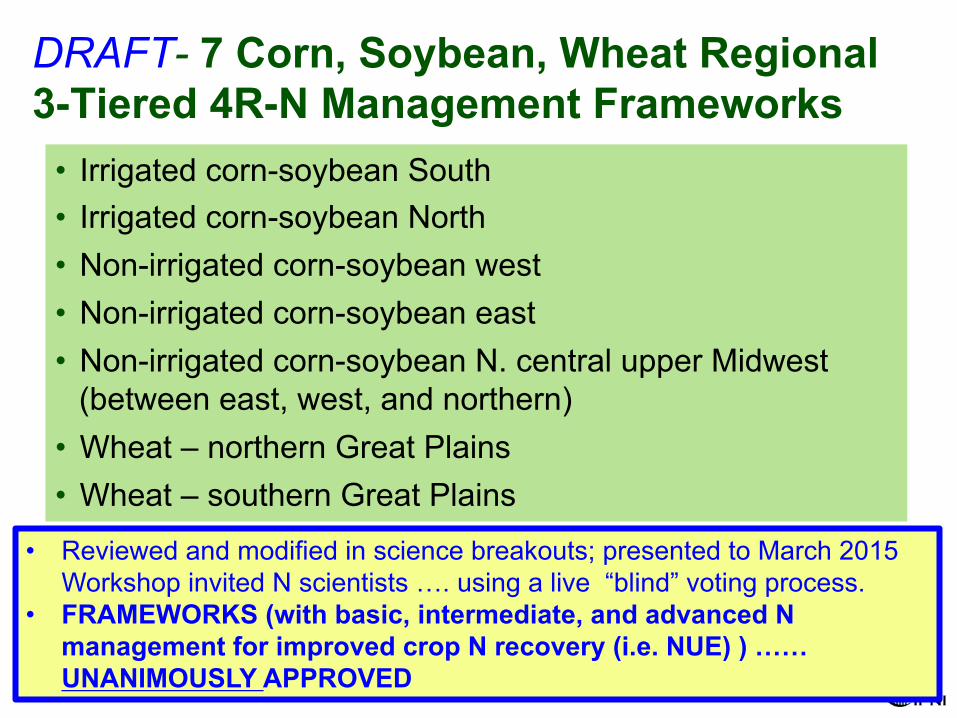
DRAFT- 7 Corn, Soybean, Wheat Regional 3-Tiered 4R-N Management Frameworks
• Irrigated corn-soybean South • Irrigated corn-soybean North • Non-irrigated corn-soybean west • Non-irrigated corn-soybean east • Non-irrigated corn-soybean N. central upper Midwest
(between east, west, and northern) • Wheat – northern Great Plains • Wheat – southern Great Plains
• Reviewed and modified in science breakouts; presented to March 2015 Workshop invited N scientists …. using a live “blind” voting process.
• FRAMEWORKS (with basic, intermediate, and advanced N management for improved crop N recovery (i.e. NUE) ) …… UNANIMOUSLY APPROVED

3-Tiers of 4R-N Management
• Below Basic BMPs (best management practices) – 25% of the growers
• Basic – practices adopted by approximately 50%
• Intermediate – practices adopted by approximately 20%
• Advanced – practices adopted by approximately 5%
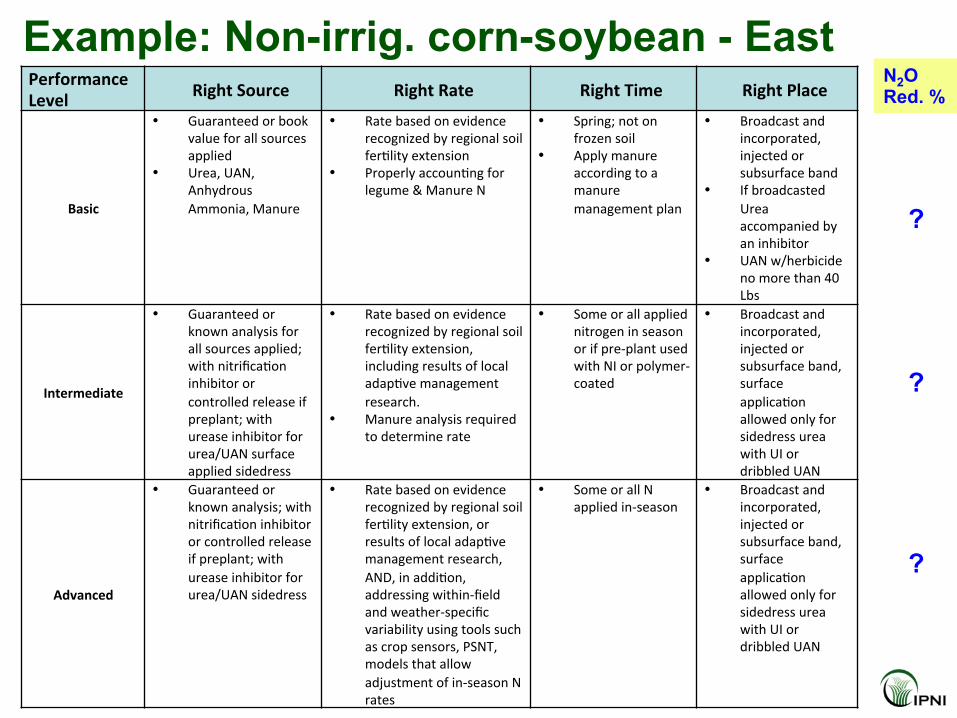
Performance Level Right Source Right Rate Right Time Right Place
Basic
• Guaranteed or book value for all sources applied
• Urea, UAN, Anhydrous Ammonia, Manure
• Rate based on evidence recognized by regional soil fer+lity extension
• Properly accoun+ng for legume & Manure N
• Spring; not on frozen soil
• Apply manure according to a manure management plan
• Broadcast and incorporated, injected or subsurface band
• If broadcasted Urea accompanied by an inhibitor
• UAN w/herbicide no more than 40 Lbs
Intermediate
• Guaranteed or known analysis for all sources applied; with nitrifica+on inhibitor or controlled release if preplant; with urease inhibitor for urea/UAN surface applied sidedress
• Rate based on evidence recognized by regional soil fer+lity extension, including results of local adap+ve management research.
• Manure analysis required to determine rate
• Some or all applied nitrogen in season or if pre-‐plant used with NI or polymer-‐coated
• Broadcast and incorporated, injected or subsurface band, surface applica+on allowed only for sidedress urea with UI or dribbled UAN
Advanced
• Guaranteed or known analysis; with nitrifica+on inhibitor or controlled release if preplant; with urease inhibitor for urea/UAN sidedress
• Rate based on evidence recognized by regional soil fer+lity extension, or results of local adap+ve management research, AND, in addi+on, addressing within-‐field and weather-‐specific variability using tools such as crop sensors, PSNT, models that allow adjustment of in-‐season N rates
• Some or all N applied in-‐season
• Broadcast and incorporated, injected or subsurface band, surface applica+on allowed only for sidedress urea with UI or dribbled UAN
Example: Non-irrig. corn-soybean - East N2O Red. %
?
?
?

Performance Level Right Source
Basic
• Guaranteed or book value for all sources applied
• Urea, UAN, Anhydrous Ammonia, Manure
Intermediate
• Guaranteed or known analysis for all sources applied; with nitrifica+on inhibitor or controlled release if preplant; with urease inhibitor for urea/UAN surface applied sidedress
Advanced
• Guaranteed or known analysis; with nitrifica+on inhibitor or controlled release if preplant; with urease inhibitor for urea/UAN sidedress
Example: Non-irrig. corn-soybean - East
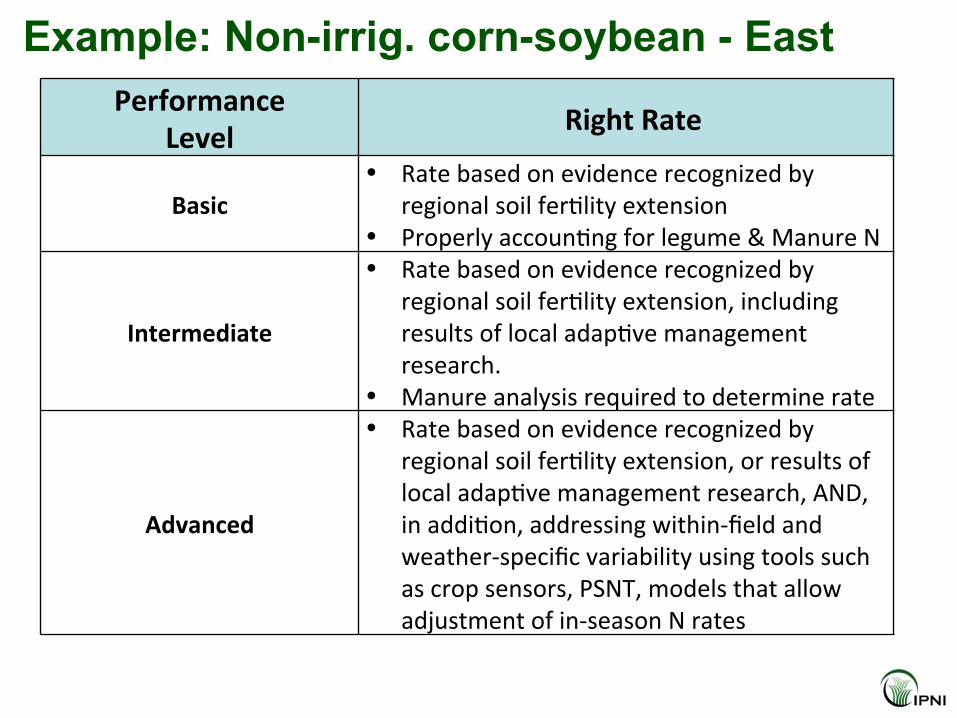
Performance Level Right Rate
Basic • Rate based on evidence recognized by
regional soil fer+lity extension • Properly accoun+ng for legume & Manure N
Intermediate
• Rate based on evidence recognized by regional soil fer+lity extension, including results of local adap+ve management research.
• Manure analysis required to determine rate
Advanced
• Rate based on evidence recognized by regional soil fer+lity extension, or results of local adap+ve management research, AND, in addi+on, addressing within-‐field and weather-‐specific variability using tools such as crop sensors, PSNT, models that allow adjustment of in-‐season N rates
Example: Non-irrig. corn-soybean - East
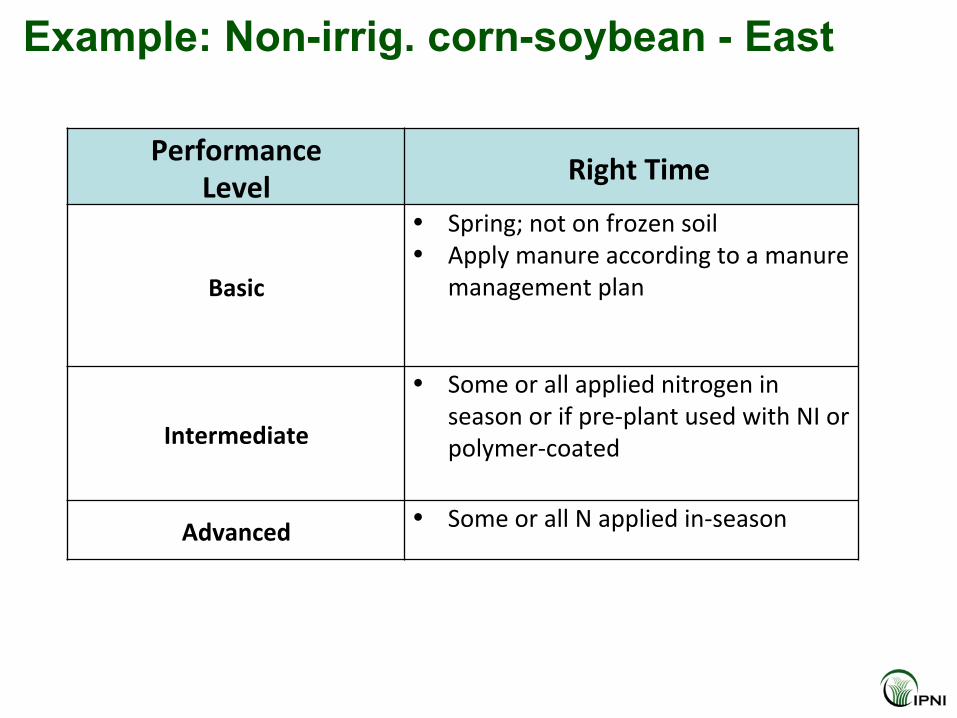
Performance Level Right Time
Basic
• Spring; not on frozen soil • Apply manure according to a manure
management plan
Intermediate
• Some or all applied nitrogen in season or if pre-‐plant used with NI or polymer-‐coated
Advanced • Some or all N applied in-‐season
Example: Non-irrig. corn-soybean - East
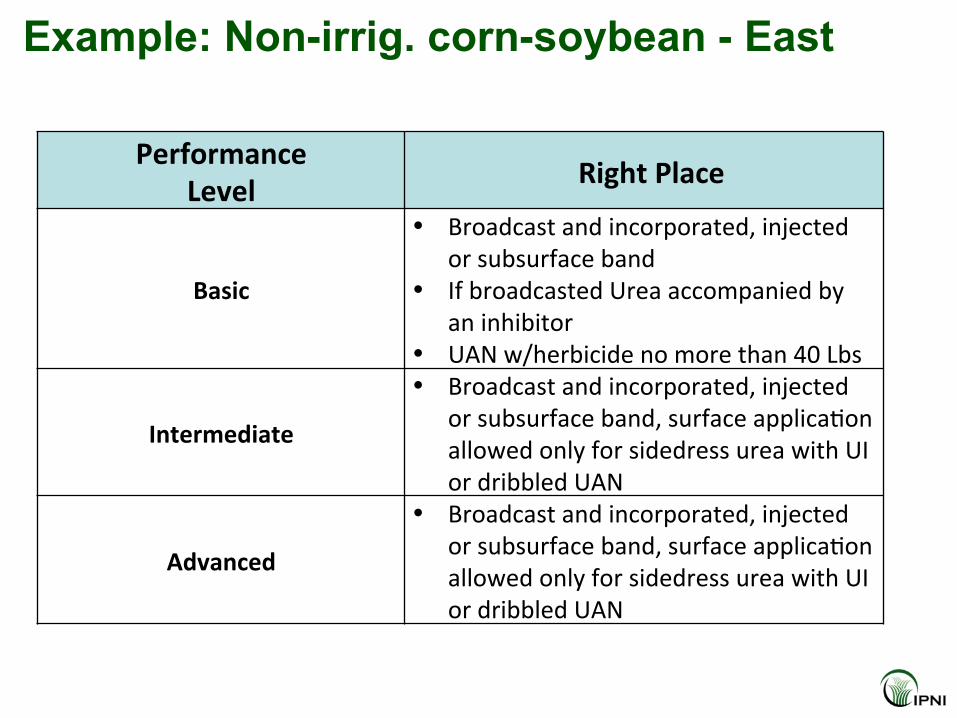
Performance Level Right Place
Basic
• Broadcast and incorporated, injected or subsurface band
• If broadcasted Urea accompanied by an inhibitor
• UAN w/herbicide no more than 40 Lbs
Intermediate
• Broadcast and incorporated, injected or subsurface band, surface applica+on allowed only for sidedress urea with UI or dribbled UAN
Advanced
• Broadcast and incorporated, injected or subsurface band, surface applica+on allowed only for sidedress urea with UI or dribbled UAN
Example: Non-irrig. corn-soybean - East
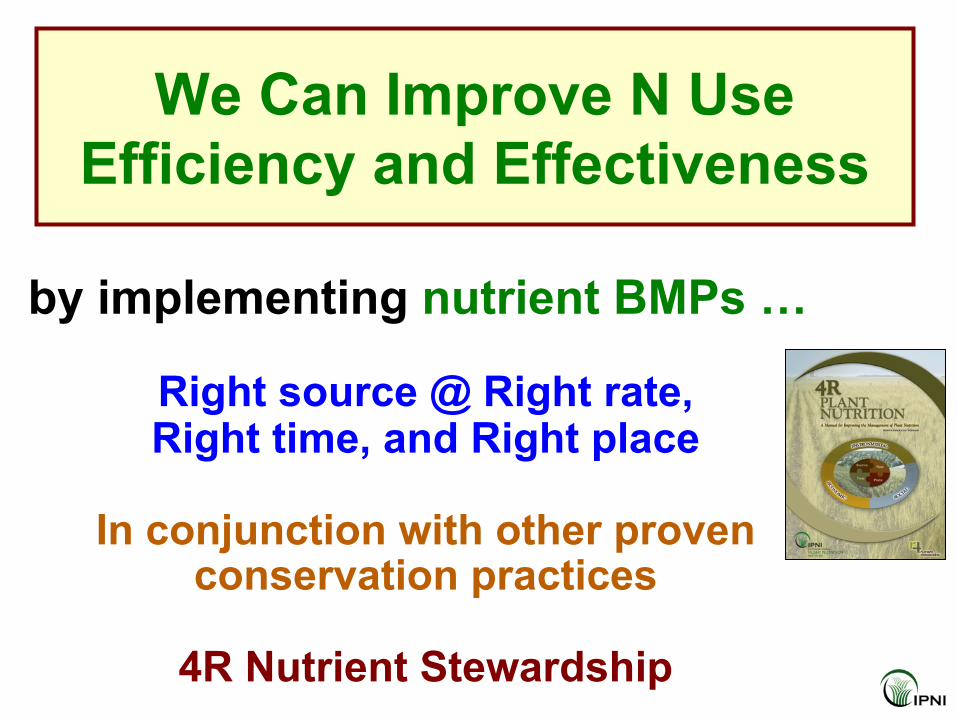
We Can Improve N Use Efficiency and Effectiveness
by implementing nutrient BMPs …
Right source @ Right rate, Right time, and Right place
In conjunction with other proven
conservation practices
4R Nutrient Stewardship

www.ipni.net
Better Crops, Better Environment … through Science
QUESTIONS ?
IPNI 4R Research Projects and Reports http://research.ipni.net/toc/category/4r_research_fund