Embed Size (px)
Citation preview
NAIA FOOTBALL REGULAR-SEASON RECORDS updated 7/6/2009
Official football statistics began with the 1952 season and are based on information submitted to the NAIA. Beginning with the 1991 season, all individual and team statistics included games in the NAIA Championship Series. Official career records include players who played at least three seasons (in a four-year career) or two seasons (in a three-year career) or a minimum of two seasons. To qualify for a career record in a particular division, an individual must have played a majority of his career in that division. TEAM RECORDS SINGLE GAME TOTAL OFFENSE Most Plays: 110, Dana (Neb.) vs. Hastings (Neb.), October 30, 2004 (9 rush, 101 pass) Most Yards Gained: 914, Lenoir-Rhyne (N.C.) vs. Davidson (N.C.), 1975 (837 rush, 77 pass) RUSHING Most Rushes: 92, Wisconsin-River Falls vs. Wisconsin-Platteville, 1989 (464 yards) Most Yards Gained: 837, Lenoir-Rhyne (N.C.) vs. Davidson (N.C.), 1975 (68 attempts) Most Touchdowns: 12, Union (Ky.) vs. Chowan (N.C.), 1994 12, Concordia-Moorhead (Minn.) vs. Macalester (Minn.), 1977 PASSING Most Attempts: 101, Dana (Neb.) vs. Hastings (Neb.) (56 completions), 10/30/04 92, Hanover (Ind.) vs. Georgetown (Ky.) (41 completions), 1991 Most Attempts, Both Teams: 154, Huron (S.D.) (79) vs. Black Hills State (S.D.) (75), (84 completions), 1994 Most Completions: 61, Iowa Wesleyan vs. Harding (Ark.), 1991 (86 attempts) Most Had Intercepted: 11, Bemidji State (Minn.) vs. St. Cloud State (Minn.), 1970 Most Attempts Without Interception: 63, Hamline (Minn.) vs. St. John’s (Minn.), 1955 (34 completions) Most Yards Gained: 636, Huron (S.D.) vs. Black Hills State (S.D.), 1995 Most Touchdown Passes: 11, North Park (Ill.) vs. North Central (Ill.), 1968 Most Touchdown Passes, Both Teams: 14, North Park (Ill.) (11) vs. North Central (Ill.) (3), 1968 PUNTING Most Punts: 15, Cumberland (Tenn.) vs. Pacific Lutheran (Wash.), 1993 Highest Average Per Punt (Min. 5 punts): 57.5, Colorado Mines vs. Fort Lewis (Colo.), 1989 (8 for 460) SCORING Most Points: 106, Fort Valley State (Ga.) vs. Knoxville (Tenn.), 1969 (14 TD’s, 11 PAT’s, 1 safety) Most Points, Both Teams: 141, Southwestern (Kan.) (79) vs. Sterling (Kan.) (62), 1994 Most Touchdowns Scored: 15, North Park (Ill.) vs. North Central (Ill.), 1968 15, Alcorn State (Miss.) vs. Paul Quinn (Texas), 1967
Most Points After Touchdown Made by Kicking: 14, North Park (Ill.) vs. North Central (Ill.), 1968 (15 attempts) Most Two-Point Attempts: 11, Fort Valley State (Ga.) vs. Knoxville (Tenn.), 1969 (9 made) Most Two-Point Conversions: 9, Fort Valley State (Ga.) vs. Knoxville (Tenn.), 1969 (11 attempts) Most Field Goals Made: 6, Carroll (Mont.) vs. Western Montana, 1993 6, West Virginia State vs. Virginia State, 1991 6, Iowa Wesleyan vs. St. Francis (Ill.), 198 6, Adams State (Colo.) vs. Western State (Colo.), 1980 PENALTIES Most Penalties: 28, Northern Arizona vs. La Verne (Calif.), 1958 (155 yards) Most Yards Penalized: 284, West Virginia State vs. Concord (W.Va.), 1990 TOTAL DEFENSE Fewest Total Offense Yards Allowed: Minus 47, Western New England (Mass.) vs. Western Connecticut, 1981 Fewest Rushing Yards Allowed: Minus 94, St. Francis (Ill.) vs. St. Ambrose (Iowa), 1991 Fewest Passing Yards Allowed: Minus 5, Western Washington vs. Central Washington, 1989 Most Sacks Recorded by: 14, Malone (Ohio) vs. Thomas More (Ky.), October 18, 2003 INTERCEPTIONS Most Passes Intercepted by: 11, St. Cloud State (Minn.) vs. Bemidji State (Minn.), 1970 Most Yards on Interception Returns: 229, Hillsdale (Mich.) vs. Northwood (Mich.), 1967 Most Touchdowns on Interception Returns: 3, Cumberlands (Ky.) vs. Mississippi College, Sept. 13, 2008 3, William Penn (Iowa) vs. Bethel (Tenn.), 2001 3, Hillsdale (Mich.) vs. Northwood (Mich.), 1967
SEASON TOTAL OFFENSE Most Plays Per Game: 94.2, Illinois Benedictine, 1976 (942 in 10) Most Yards Gained: 8175, Georgetown (Ky.), 1999 5464, Ohio Dominican University, 2007 Most Yards Gained Per Game: 583.9, Georgetown (Ky.), 1999 (8,175 in 14) 540.7, Georgetown (Ky.), 1991 (7,570 in 14) 420.0, Ohio Dominican University, 2007 (5,464 in 13) Highest Average Gain Per Play: 8.49, Mississippi Vocational, 1956 (4,867 in 573) Highest Average Gain Per Play (min. 800 plays) 7.79, Texas A&I, 1976 (6,269 in 805) RUSHING Most Rushes Per Game Average: 78.9, Panhandle State (Okla.), 1963 (789 in 10) Most Yards Gained:
4348, Olivet Nazarene (Ill.), 1990 (766 rushes) Most Yards Gained Per Game: 442.7, Greenville (Ill.), 1989 (3,989 in 9) Highest Average Gain Per Rush (min. 500 rushes): 7.0, Pittsburg State (Kan.), 1987 (3,946 in 564) 7.0, Benedictine (Kan.), 1985 (3,869 in 553) 7.0, Baker (Kan.), 1980 (3,901 in 560) 7.0, William Jewell (Mo.), 1952 (3,795 in 537) Highest Average Gain Per Rush (min. 600 rushes): 6.13, Pittsburg State (Kan.), 1986 (3,875 in 632) 6.125, Cumberland (Ky.), 2004 (3,920 in 640) Most Touchdowns: 74, Northwestern Oklahoma State, 2003 61, Georgetown (Ky.), 1991 57, Ohio Dominican, 2007 PASSING Most Attempts: 715, Iowa Wesleyan, 1991 (468 completions) Most Attempts Per Game: 61.1, Huron (S.D.), 1994 (611 in 10) 61.1, Whitworth (Wash.), 1986 (550 in 9) Most Completions: 468, Iowa Wesleyan, 1991 (715 attempts) Most Completions Per Game: 39.0, Iowa Wesleyan, 1991 (468 in 12) Most Yards Gained: 5583, Ohio Dominican University, 2007 (440 completed, 646 attempted) 4824, Central Washington, 1995 (381 completed, 608 attempted) Most Yards Gained Per Game: 429.5, Ohio Dominican University, 2007 (5583 in 13 games) 422.5, Huron (S.D.), 1994 (4225 in 10 games) Highest Average Gain Per Attempt (min. 175 attempts) 10.69, Texas A&I, 1976 (2,373 in 222) Highest Average Gain Per Attempt (min. 290 attempts): 9.34, Northwestern (Iowa), 1982 (2,979 in 319) 9.34, Abilene Christian (Texas), 1977 (2,915 in 312) Highest Average Gain Per Attempt (min. 325 attempts): 10.4, Bethany (Kan.), 1995 (3,488 in 336) Highest Average Gain Per Completion (min. 100 completions): 21.66, Wisconsin-Superior, 1988 (2,686 in 124) Highest Average Gain Per Completion (min. 200 completions): 17.14, Central Methodist (Mo.), 1978 (3,720 in 217) Highest Percentage Completed (min. 200 attempts): .681, Ohio Dominican University, 2007 (440 of 646) .660, Southern Oregon, 1965 (177 of 268) Highest Percentage Completed (min. 350 attempts): .681, Ohio Dominican University, 2007 (440 of 646) .659, Hardin-Simmons (Texas), 1994 (257 of 390) Most Touchdown Passes 57, Sioux Falls (S.D.), 1996 Most Touchdown Passes Per Game: 5.1, Southwest State (Minn.), 1991 (51 in 10) PUNTING Most Punts: 106, Wisconsin-Superior, 1977 (3,404 yards) Highest Punting Average: 48.0, Adams State (Colo.), 1966 (36 for 1,728) SCORING
Most Points: 744, Georgetown (Ky.), 1991 (14 games) Most Points Per Game: 54.7, Florida A&M, 1961 (492 in 9) PENALTIES Most Yards Penalized: 1,356, Hampton (Va.), 1977 (124 penalties in 11 games) TOTAL DEFENSE Fewest Yards Allowed: 495, Florida A&M, 1961 (141 rush, 354 pass) Fewest Yards Allowed Per Game: 70.7, Florida A&M, 1961 (495 in 7) Lowest Average Yards Allowed Per Play: 1.25, Franklin (Ind.), 1989 (957 in 765) RUSHING DEFENSE Fewest Yards Allowed: Minus 109, Central State (Ohio), 1989 (384 attempts) Fewest Yards Allowed Per Game: Minus 9.9, Central State (Ohio), 1989 (Minus 109 in 11) Lowest Average Yards Allowed Per Rush: Minus 0.1, Delaware State, 1970 (Minus 39 in 269) PASS DEFENSE Fewest Yards Allowed: 162, Carthage (Wis.), 1955 (65 attempts) Fewest Yards Allowed Per Game: 20.2, Carthage (Wis.), 1955 (162 in 8) Fewest Yards Allowed Per Attempt: 1.8, Langston (Okla.), 1961 (195 in 107) Fewest Yards Allowed Per Completion: 6.4, Cameron (Okla.), 1971 (530 in 83) Lowest Completion Percentage Allowed: .230, Westminster (Pa.), 1995 (47 of 204) Most Passes Intercepted by: 42, Newberry (S.C.), 1971 Most Passes Intercepted by Per Game: 3.8, Newberry (S.C.), 1971 (42 in 11) Most Touchdowns on Interception Returns: 7, Findlay (Ohio), 1995 SCORING DEFENSE Fewest Points Allowed Per Game: 1.3, St. Mary of the Plains (Kan.), 1989 (13 in 10) MISCELLANEOUS Most Consecutive Victories 42, Texas A&I (Nov. 17, 1973 thru Oct. 1, 1977) Most Consecutive Games Unbeaten: 46, Texas A&I (Nov. 17, 1973 thru Oct. 29, 1977; 4 ties) Most Consecutive Losses: 50, Macalester (Minn.) (Oct. 5, 1974 thru Sept. 6, 1980) Most Consecutive Games Without a Victory: 50, Macalester (Minn.) (Oct. 5, 1974 thru Sept. 6, 1980) Most Consecutive Games Without Being Shut Out: 187, Pacific Lutheran (Wash.) (Sept. 20, 1980 thru present) Highest Score by Team in Loss: 62, Sterling (Kan.) vs. Southwestern (Kan.) (79), 1994 Last Scoreless Tie:
Wisconsin-Stevens Point vs. Baker (Kan.), Sept. 7, 1991 Most Overtimes in a Single Game: 5, Malone (Ohio) vs. Walsh (Ohio), October 4, 2003 Most Tie Games In a Season: 3, Austin College (Texas), 1987 3, Central Arkansas, 1982 3, Northern State (S.D.), 1978 3, Rocky Mountain (Mont.), 1971 Most Shutouts: 8, St. Mary of the Plains (Kan.), 1989
INDIVIDUAL RECORDS SINGLE GAME TOTAL OFFENSE Most Plays: 101, Tom Lensch, Dana (Neb.) vs. Hastings (Neb.), October 30, 2004 (101 pass attempts) Most Yards Gained: 601, Brian Ainsworth, New Mexico Highlands vs. Western State (Colo.), 1987 (16 rush, 585 pass) RUSHING Most Rushes: 54, Derrick Harris, Eureka (Ill.) vs. Concordia (Wis.), 1992 (208 yards) Most Yards Gained 409, Derrick Williams, Eastern Montana vs. Montana Tech, 1976 (42 rushes) Most Touchdowns Scored by Rushing: 8, Anthony Dodson, Greenville (Ill.) vs. Blackburn (Ill.), 1991 8, Jackie Jackson, Southwestern (Kan.) vs. McPherson (Kan.), 1984 8, Junior Wolf, Panhandle State (Okla.) vs. St. Mary of the Plains (Kan.), 1958 Longest Rush: 99 yards, A.J. Cooley, Shorter (Ga.) College vs. North Greenville (N.C.) University, Oct. 18, 2008 99 yards, Ahmad Broadnax, University of the Cumberlands (Ky.) vs. Mt. Saint Joseph (Ohio), Sept. 24, 1994 99 yards, Ted Pretasky, Wisconsin-La Crosse vs. Wisconsin-River Falls, 1987 99 yards, Bob Stitt, Doane (Neb.) vs. Northwestern (Iowa), 1985 99 yards, Jed Knuttlia, Hamline (Minn.) vs. St. Thomas (Minn.), 1968 99 yards, George Phillips, Concord (W.Va.) vs. Davis & Elkins (W.Va.), 1960 PASSING Most Attempts: 101, Tom Lensch, Dana (Neb.) vs. Hastings (Neb.), October 30, 2004 (comp. 56, 3 INT) Most Completions: 61, Dustin Dewald, Iowa Wesleyan vs. Harding (Ark.), 1991 Most Passes Had Intercepted 10, Mark Ryhanych, Concord (W.Va.) vs. Shepherd (W.Va.), 1986 Most Passes Attempted Without Interception: 63, Brandon Jonco, Cumberland (Tenn.) vs. Pikeville (Ky.), October 8, 2005 (36 completions) Most Yards Gained: 636, Don Fellows, Huron (S.D.) vs. Black Hills State (S.D.), 1995 Most Touchdown Passes: 10, Bruce Swanson, North Park (Ill.) vs. North Central (Ill.), 1968 Longest Pass: 99 yards, by several individuals (last - Justin Campbell to Jason Bryant, Northwestern Oklahoma vs. Missouri Valley, 1994; Jamie Stinson to Sunny Lofton, Peru State (Neb.) vs. Iowa Wesleyan, 1994) RECEIVING Most Passes Caught: 23, Chris George, Glenville State (W.Va.) vs. West Virginia Wesleyan, 1994 (308 yards) 23, Wilson Holland, New Mexico Highlands vs. Kearney State (Neb.), 1989 (231 yards) Most Yards Gained: 384, Carlton Jackson, West Virginia State vs. Glenville State (W.Va.), 1990 (18 catches)
Most Touchdown Passes Caught: 8, Paul Zaeske, North Park (Ill.) vs. North Central (Ill.), 1968 (11 catches) PUNTING Most Punts: 14, Mike Sipe, Shepherd (W.Va.) vs. Concord (W.Va.), 1986 Longest Punt: 97, Earl Hurst, Emporia State (Kan.) vs. Central Missouri State, 1964 INTERCEPTIONS Most Interceptions: 6, Eddie Watson, Arkansas-Pine Bluff vs. Wiley (Texas), 1965 (46 yards) Most Yards on Interception Returns: 174, Pat Apke, Carson-Newman (Tenn.) vs. Mars Hill (N.C.), 1983 Longest Interception Return: 100 yards, several individuals PUNT RETURNS Most Punt Returns: 10, Kevin King, Simon Fraser (B.C.) vs. Lewis & Clark (Ore.), 1987 10, Craig Plymal, Concord (W.Va.) vs. Shepherd (W.Va.), 1986 (155 yards) 10, Ellis Wangelin, Wisconsin-River Falls vs. Wisconsin-Platteville, 1985 (87 yards) Most Yards on Punt Returns: 199, Vince Mitchell, Fairmont State (W.Va.) vs. West Virginia State, 1986 (6 returns) Most Touchdowns on Punt Returns: 2, Tyree Davis, Central Arkansas vs. Arkansas-Monticello, 1992 2, Angelo James, Westmar (Iowa) vs. South Dakota-Springfield, 1979 Longest Punt Return: 97, Ron Fuller, Evangel (Mo.) vs. Missouri Southern, 1981 KICKOFF RETURNS Most Kickoff Returns: 8, Jamie Diamond, Lewis & Clark (Ore.) vs. Simon Fraser (B.C.), 1994 8, Nick Mazzoli, Simon Fraser (B.C.) vs. Central Washington, 1990 8, Barney Gertler, Lewis & Clark (Ore.) vs. Simon Fraser (B.C.), 1989 8, Terry Thomas, Wayne State (Neb.) vs. Emporia State (Kan.), 1988 (126 yards) 8, Lenell White, Montana Tech vs. Carroll (Mont.), 1988 (144 yards) 8, Brooks Hoff, Pacific (Ore.) vs. Simon Fraser (B.C.), 1986 8, Steve Muran, Westmar (Iowa) vs. Buena Vista (Iowa), 1984 (115 yards) Most Yards on Kickoff Returns: 276, Tom Dufresne, Hamline (Minn.) vs. Minnesota-Duluth, 1972 (7 returns) Most Touchdowns Scored on Kickoff Returns: 2, Nick Butler, Culver-Stockton (Mo.) vs. Benedictine (Kan.), 1994 2, Schearon Stewart, Lewis & Clark (Ore.) vs. Eastern Oregon, 1991 2, Tom Dufresne, Hamline (Minn.) vs. Minnesota-Duluth, 1972 Longest Kickoff Return: 100 yards, several individuals SCORING Most Points Scored: 48, Anthony Dodson, Greenville (Ill.) vs. Blackburn (Ill.), 1991 (8 TD’s) 48, Jackie Jackson, Southwestern (Kan.) vs. McPherson (Kan.), 1984 (8 TD’s) 48, Paul Zaeske, North Park (Ill.) vs. North Central (Ill.), 1968 (8 TD’s) 48, Junior Wolf, Panhandle State (Okla.) vs. St. Mary of the Plains (Kan.), 1958 (8 TD’s) Most Touchdowns Scored: 8, Anthony Dodson, Greenville (Ill.) vs. Blackburn (Ill.), 1991 (48 points) 8, Jackie Jackson, Southwestern (Kan.) vs. McPherson (Kan.), 1984 (48 points) 8, Paul Zaeske, North Park (Ill.) vs. North Central (Ill.), 1968 (48 points) 8, Junior Wolf, Panhandle State (Okla.) vs. St. Mary of the Plains (Kan.), 1958 (48 points) Most Field Goals Made: 6, Bryan Hillborn, Carroll (Mont.) vs. Western Montana, 1993
6, Chuck Wood, West Virginia State vs. Virginia State, 1991 6, Steve Wasko, Iowa Wesleyan vs. St. Francis (Ill.), 1986 6, Rocky Paulson, Adams State (Colo.) vs. Western State (Colo.), 1980 Most Field Goals Attempted: 8, Peter LaBarge, Western Washington vs. Lewis & Clark (Ore.), 1988 Most Extra Points Made by Kicking: 14, Art Anderson, North Park (Ill.) vs. North Central (Ill.), 1968 (15 attempts) Most Extra Points Attempted by Kicking: 15, Art Anderson, North Park (Ill.) vs. North Central (Ill.), 1968 (14 made) Most Points Scored by Kicking: 20, Steve Wasko, Iowa Wesleyan vs. St. Francis (Ill.), 1986 (6 FG’s, 2 PAT’s) 20, Clarence Joseph, Central State (Ohio) vs. Kentucky State, 1982 (5 FG’s, 5 PAT’s)
SEASON TOTAL OFFENSE Most Plays: 890, Tom Lensch, Dana (Neb.), 2004 (3,896 yards) 696, Dustin Dewald, Iowa Wesleyan, 1991 (4,320 yards) Most Plays Per Game: 69.0, Kevin Kott, Eastern New Mexico, 1983 (690 in 10) Most Yards Gained: 5,464, Cris Reisert, Ohio Dominican University, 2007 (30 rush, 5,434 pass) 4,944, Jon Kitna, Central Washington, 1995 (328 rush, 4,616 pass) Most Yards Gained Per Game: 420.3, Cris Reisert, Ohio Dominican University, 2007 (5,464 in 13) 409.4, David Short, Rocky Mountain (Mont.), 1998 (4,094 in 10) Highest Average Gain Per Play (min. 350 plays): 8.99, Jorge Munoz, Bethany (Kan.), 1995 (353 for 3,174) Most Touchdowns Responsible For: 57, Cris Reisert, Ohio Dominican University, 2007 (54 passing, 3 rushing) 57, Marc Weekly, Pacific Lutheran (Wash.), 1993 RUSHING Most Rushes: 381, Dave Perrigo, Northwestern (Iowa), 2000 (2,504 yards) Most Rushes Per Game: 34.4, Roger Vann, Wisconsin-Eau Claire, 1981 (344 in 10) Most Yards Gained: 2504, Dave Perrigo, Northwestern (Iowa), 2000 (381 rushes) Most Yards Gained Per Game: 207.4, Brian DiLiberto, Tiffin (Ohio), 1993 (2,281 in 11) Highest Average Gain Per Rush (min. 150 rushes): 9.35, Monte Weathers, Pittsburg State (Kan.), 1987 (150 for 1,402) Highest Average Gain Per Rush (min. 200 rushes): 8.13, Bob White, Western New Mexico, 1951 (202 for 1,643) Highest Average Gain Per Rush (min. 250 rushes): 7.8, Derrick Ward, Ottawa (Kan.), 2003 (263 for 2061) Most Touchdowns Scored: 32, Jo Jo Jones, Lambuth (Tenn.), 1994 32, Roger Butler, Tabor (Kan.), 2005 PASSING Most Attempts: 665, Dustin Dewald, Iowa Wesleyan, 1991 (440 completions) Most Attempts Per Game: 57.1, Don Fellows, Huron (S.D.), 1995 (571 in 10) Most Completions: 440, Dustin Dewald, Iowa Wesleyan, 1991 (665 attempts)
421, Cris Reisert, Ohio Dominican University, 2007 (606 attempts) Most Completions Per Game: 39.1, Jason Truman, Western Montana, 1995 (391 in 10) Highest Completion Percentage (min. 225 attempts): .769, Danny Miles, Southern Oregon, 1965 (190 of 247) .695, Cris Reisert, Ohio Dominican University, 2007 (421 of 606) Highest Completion Percentage (min. 350 attempts): .695, Cris Reisert, Ohio Dominican University, 2007 (421 of 606) .693, Cris Reisert, Ohio Dominican, 2006 (244 of 352) Most Intercepted: 43, Steve Hendry, Wisconsin-Superior, 1982 (480 attempts) Lowest Percentage Intercepted (min. 200 attempts): 1.0, Craig Kupp, Pacific Lutheran (Wash.), 1989 (3 of 286) Lowest Percentage Intercepted (min. 300 attempts): 0.75, Kurtiss Riggs, Sioux Falls (S.D.), 1996 (3 of 400) Most Consecutive Attempts Without An Interception: 290, Kurtiss Riggs, Sioux Falls (S.D.), 1996 Most Yards: 5,434, Cris Reisert, Ohio Dominican University, 2007 4,885, Craig Fobbe, Morningside (Iowa), 2005 Most Yards Per Game: 418.0, Cris Reisert, Ohio Dominican University, 2007 (5,434 in 13) 411.1, Jeff Loots, Southwest State (Minn.), 1991 (4,111 in 10) Most Yards Gained Per Attempt (min. 225 attempts): 10.59, Lee McKinstrey, Northwestern (Iowa), 1982 (245 for 2,595) Most Yards Gained Per Attempt (min. 300 attempts): 11.3, Jayson Merrill, Western State (Colo.), 1991 (309 for 3,484) Most Yards Gained Per Completion (min. 125 completions): 20.04, Don Dalton, Western Carolina (N.C.), 1969 (131 for 2,626) Most Yards Gained Per Completion (min. 175 completions): 18.19, Eddie Eviston, Georgetown (Ky.), 1999 (216 for 3,930) Most Touchdown Passes: 55, Kurtiss Riggs, Sioux Falls (S.D.), 1996 54, Cris Reisert, Ohio Dominican University, 2007 Highest Percentage for Touchdowns (min. 150-299 attempts): 15.1, Lee McKinstrey, Northwestern (Iowa), 1982 (37 of 245) Highest Percentage for Touchdowns (min. 300 attempts): 13.2, Marc Weekly, Pacific Lutheran (Wash.), 1993 (46 of 348) RECEIVING Most Passes Caught: 144, Chris George, Glenville State (W.Va.), 1993 (2,221 yards) Most Passes Caught Per Game: 12.6, Wayne Hawkins, Southwest State (Minn.), 1991 (126 in 10) Most Yards Gained: 2221, Chris George, Glenville State (W.Va.), 1993 (144 catches) Most Yards Gained Per Game: 170.69, Chris George, Glenville State (W.Va.), 1993 (2,219 in 13) Highest Average Gain Per Catch (min. 30 catches): 30.63, Dan Dratzer, Missouri Valley, 1970 (30 for 919) Highest Average Gain Per Catch (min. 40 catches): 27.81, Cody Brown, Georgetown (Ky.), 2000 (43 for 1,196) 26.73, Clay Lowry, Sam Houston State (Texas), 1978 (45 for 1,203) Highest Average Gain Per Catch (min. 55 catches): 22.56, Keith Crawford, Howard Payne (Texas), 1992 (66 for 1,489) Most Touchdown Passes Caught: 23, Jeremy Dutcher, St. Francis (Ind.), 2000 (80 catches) PUNTING Most Punts: 106, Bob Blake, Wisconsin-Superior, 1977 (3,404 yards)
Highest Average (min. 20 punts): 49.06, Steve Ecker, Shippensburg (Pa.), 1965 (32 for 1,570) Highest Average (min. 40 punts): 49.02, James Wise, Tuskegee (Ala.), 1965 (57 for 2,794) INTERCEPTIONS Most Interceptions: 15, Mike Page, Minot State (N.D.), 1992 (227 yards) 15, Kevin Gribbin, Westminster (Pa.), 1987 (107 yards) 15, Tom Rowland, Illinois College, 1967 (86 yards) Most Interceptions Per Game: 1.88, Tom Rowland, Illinois College, 1967 (15 in 8) Most Yards on Interception Returns: 287, Tadd Holliman, McPherson (Kan.), 1991 (8 interceptions) Highest Average Gain Per Interception Return (min. 6 returns): 43.83, Clayton Holmes, Carson-Newman (Tenn.), 1990 (263 in 6) Most Touchdowns Scored on Interception Returns: 4, Frank Parks, Georgetown (Ky.), 1998 PUNT RETURNS Most Punt Returns: 50, Bill Ewusiak, Fairmont State (W.Va.), 1966 (500 yards) Most Yards of Punt Returns: 1196, Bill Ewusiak, Fairmont State (W.Va.), 1967 (44 returns) Highest Average Gain Per Punt Return (min. 1.2 per game): 36.0, Dave Meylink, Northwestern (Iowa), 1969 (14 for 504) Most Touchdowns Scored on Punt Returns: 5, Marvin Coleman, Central State (Ohio), 1993 KICKOFF RETURNS Most Kickoff Returns: 46, Pete Iten, Minnesota-Morris, 1994 (942 yards) Most Yards on Kickoff Returns: 1005, Lloyd Nolan, Central Methodist (Mo.), 1999 (27 returns) Highest Average Gain Per Kickoff Return (min. 1.2 per game): 37.77, Greg Harrison, Azusa Pacific (Calif.), 1978 (13 for 491) Most Touchdowns Scored on Kickoff Return: 4, Tard Smith, Dakota State (S.D.), 1993 SCORING Most Points Scored: 210, Jo Jo Jones, Lambuth (Tenn.), 1994 (34 TD’s, 3 PAT’s) Most Points Scored Per Game: 19.0, Todd Johnson, Trinity (Ill.), 1993 (190 in 10) Most Touchdowns Scored: 34, Jo Jo Jones, Lambuth (Tenn.), 1994 Most Touchdowns Scored Per Game: 3.1, Todd Johnson, Trinity (Ill.), 1993 (31 in 10) 3.1, Wilbert Montgomery, Abilene Christian (Texas), 1973 (31 in 10) Most Consecutive Games Scoring a Touchdown: 23, Greg Thomas, Clinch Valley (Va.) (1994-95) Most Field Goals Made: 27, Shane Longest, Saint Xavier University (Ill.), 2007 23, Derek Doerfler, Baker University (Kan.), 2007 22, Herve Roussel, Wayne State (Neb.), 1984 Most Field Goals Made Per Game: 2.1, Shane Longest, Saint Xavier University (Ill.), 2007 (27 in 13) 2.1, Derek Doerfler, Baker University (Kan.), 2007 (23 in 11) 2.1, Tracy Bennett, Mesa State (Colo.), 1986 (21 in 10) Longest Field Goal: 69 yards, Ove Johannson, Abilene Christian (Texas) vs. East Texas State, 1976
Most Field Goals Attempted: 37, Shane Longest, Saint Xavier University (Ill.), 2007 (27 made) 32, Derek Doerfler, Baker University (Kan.), 2007 (23 made) 31, Tracy Bennett, Mesa State (Colo.), 1986 (21 made) 31, Herve Roussel, Wayne State (Neb.), 1984 (22 made) Highest Percentage of Field Goals Made (min. 15 attempts): .941, Ben Hansen, Azusa Pacific University, 2007, (16 of 17) .938, Tim Saiz, New Mexico Highlands, 1985 (15 of 16) Highest Percentage of Field Goals Made (min. 20 attempts): .909, Marcus Miller, Carroll (Mont.), 2007 (20 of 22) .810, Halley Ferrell, Lindenwood (Mo.), 2007 (17 of 21) .800, Jeff Parker, Gardner-Webb (N.C.), 1987 (16 of 20) Most Extra Points Made by Kicking: 82, Bob Wasson, Georgetown (Ky.), 1991 (93 attempts) 82, Kevin Davis, Georgetown (Ky.), 1999 (92 attempts) Most Extra Points Attempted by Kicking: 93, Bob Wasson, Georgetown (Ky.), 1991 (82 made) 92, Kevin Davis, Georgetown (Ky.), 1999 (82 made) Highest Percentage of Extra Points Made by Kicking (min. 50 attempts): .984, Tom Sellers, Findlay (Ohio), 1995 (61 of 62) Most Points Scored by Kicking: 128, Shane Longest, Saint Xavier (Ill.), 2007 (47 PATs, 27 FGs) 110, Rhett Crites, Carroll (Mont.), 2003 (77 PATs, 11 FGs) 100, Kevin Davis, Georgetown (Ky.), 1999 (82 PATs, 6 FGs) 99, Tracy Bennett, Mesa State (Colo.), 1988 (60 PAT’s, 13 FG’s) CAREER TOTAL OFFENSE Most Plays: 2007, Kirk Baumgartner, Wisconsin-Stevens Point, 1986-89 (12,767 yards) Most Plays Per Game: 52.5, Jeff Loots, Southwest State (Minn.), 1990-92 (1,469 in 28) Most Yards Gained: 13,979, Tyler Emmert, Carroll (Mont.), 2002-05 Most Yards Gained Per Game: 350.18, Jeff Loots, Southwest State (Minn.), 1990-92 (10,116 in 28) Highest Average Gain Per Play (min. 950 plays): 7.78, Jed Drenning, Glenville State (W.Va.), 1991-93 (1,455 for 11,319) Most Touchdowns Responsible for: 143, Marc Weekly, Pacific Lutheran (Wash.), 1990-93 RUSHING Most Rushes: 1163, Bobby Hedrick, Elon (N.C.), 1977-80 (5,194 yards) Most Rushes Per Game: 28.3, Joe Brinson, St. Mary of the Plains (Kan.), 1983-86 (1,104 in 39) Most Yards Gained: 5738, Derek Besgrove, Walsh (Ohio), 2000-03 Most Yards Gained Per Game (min. 3,000 yards): 152.74, Elbert Dubenion, Bluffton (Ohio), 1995-58 (4,735 in 31) Highest Average Gain Per Rush (min. 500 rushes): 9.43, Elbert Dubenion, Bluffton (Ohio), 1955-58 (502 for 4,735) Most Touchdowns Scored: 75, Dusty McGrorty, Southern Oregon, 2000-03 PASSING Most Attempts: 1,710, Cris Reisert, Ohio Dominican, 2005-08 (1,149 completions) 1,710, Kirk Baumgartner, Wisconsin-Stevens Point, 1986-89 (887 completions) Most Attempts Per Game:
47.71, Dustin Dewald, Iowa Wesleyan, 1989-91 (1,555 in 33) Most Completions: 1,149, Cris Reisert, Ohio Dominican, 2005-08 (1,710 attempts) 1,037, Tyler Emmert, Carroll (Mont.), 2002-05 990, Dustin Dewald, Iowa Wesleyan, 1989-91 (1,555 attempts) Most Completions Per Game: 30.00, Dustin Dewald, Iowa Wesleyan, 1989-91 (990 in 33) Highest Percentage Completed (min. 500 completions): .704, Tyler Emmert, Carroll (Mont.), 2002-05 (1037 of 1473) Most Interceptions: 117, Steve Hendry, Wisconsin-Superior, 1980-83 (1,343 attempts) Most Yards Gained: 13,388, Cris Reisert, Ohio Dominican, 2005-08 (1,149 for 1,710) Most Yards Gained Per Game: 361.29, Jeff Loots, Southwest State (Minn.), 1990-92 (10,116 in 28) Most Yards Gained Per Attempt (min. 600 attempts): 9.57, Eddie Eviston, Georgetown (Ky.), 1998-2001 (1,138 for 10,885) 9.15, Kurtiss Riggs, Sioux Falls (S.D.), 1993-96 (801 for 7,329) Most Yards Gained Per Completion (min. 300 completions): 17.28, Shane Davolt, William Jewell, (Mo.), 1990-92 (330 for 5,705) Most Touchdown Passes: 120, Cris Reisert, Ohio Dominican, 2005-08 113, Marc Weekly, Pacific Lutheran (Wash.), 1990-93 Highest Percentage for Touchdowns (min. 500 attempts): 11.1, Ed Buzzell, Ottawa (Kan.), 1962-65 (72 of 650) RECEIVING Most Passes Caught: 430, Chris George, Glenville State (W.Va.), 1991-94 (6,177 yards) Most Passes Caught Per Game: 9.77, Chris George, Glenville State (W.Va.), 1991-94 (430 in 44) Most Yards Gained: 6177, Chris George, Glenville State (W.Va.), 1991-94 (430 catches) Most Yards Gained Per Game: 140.39, Chris George, Glenville State (W.Va.), 1991-94 (6,177 in 44) Highest Average Gain Per Catch (min. 200 catches): 19.10, Jeremy Dutcher, St. Francis (Ind.), 1998-00 (225 for 4,298) Highest Average Gain Per Catch (min. 135 catches): 21.8, Willie Richardson, Jackson State (Miss.), 1959-62 (166 for 3,616) Most Touchdown Passes Caught: 59, Alvin Ashley, Southwest State (Minn.), 1990-93 (252 catches) PUNTING Most Punts: 270, Karl Kimsey, Panhandle State (Okla.), 1971-74 270, Paul Swanson, Winona State (Minn.), 1969-72 Highest Average Per Punt (min. 100 punts): 44.56, Carl Birdsong, Southwestern Oklahoma, 1979-80 (102 for 4,545) Highest Average Per Punt (min. 150 punts): 42.7, John Standfield, Mississippi Valley State, 1975-78 (242 for 10,343) INTERCEPTIONS Most Interceptions: 36, Ronnie Shelley, Troy State (Ala.), 1966-69 (501 yards) 36, Alfredo Avila, Sul Ross State (Texas), 1963-66 Most Yards on Interception Returns: 615, Paul Carter, St. Francis (Ind.), 2004-05, 07-08 PUNT RETURNS Most Punt Returns: 120, Aldridge Jones, Westminster (Pa.), 1990-93 (1,465 yards)
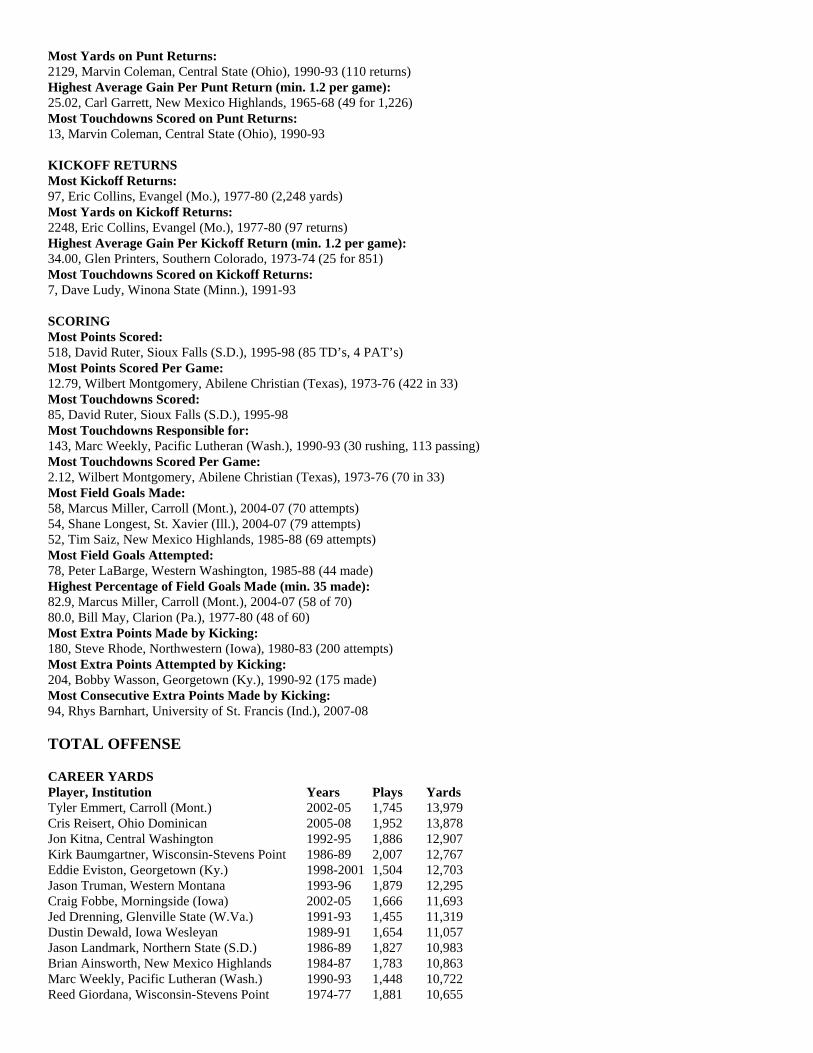
Most Yards on Punt Returns: 2129, Marvin Coleman, Central State (Ohio), 1990-93 (110 returns) Highest Average Gain Per Punt Return (min. 1.2 per game): 25.02, Carl Garrett, New Mexico Highlands, 1965-68 (49 for 1,226) Most Touchdowns Scored on Punt Returns: 13, Marvin Coleman, Central State (Ohio), 1990-93 KICKOFF RETURNS Most Kickoff Returns: 97, Eric Collins, Evangel (Mo.), 1977-80 (2,248 yards) Most Yards on Kickoff Returns: 2248, Eric Collins, Evangel (Mo.), 1977-80 (97 returns) Highest Average Gain Per Kickoff Return (min. 1.2 per game): 34.00, Glen Printers, Southern Colorado, 1973-74 (25 for 851) Most Touchdowns Scored on Kickoff Returns: 7, Dave Ludy, Winona State (Minn.), 1991-93 SCORING Most Points Scored: 518, David Ruter, Sioux Falls (S.D.), 1995-98 (85 TD’s, 4 PAT’s) Most Points Scored Per Game: 12.79, Wilbert Montgomery, Abilene Christian (Texas), 1973-76 (422 in 33) Most Touchdowns Scored: 85, David Ruter, Sioux Falls (S.D.), 1995-98 Most Touchdowns Responsible for: 143, Marc Weekly, Pacific Lutheran (Wash.), 1990-93 (30 rushing, 113 passing) Most Touchdowns Scored Per Game: 2.12, Wilbert Montgomery, Abilene Christian (Texas), 1973-76 (70 in 33) Most Field Goals Made: 58, Marcus Miller, Carroll (Mont.), 2004-07 (70 attempts) 54, Shane Longest, St. Xavier (Ill.), 2004-07 (79 attempts) 52, Tim Saiz, New Mexico Highlands, 1985-88 (69 attempts) Most Field Goals Attempted: 78, Peter LaBarge, Western Washington, 1985-88 (44 made) Highest Percentage of Field Goals Made (min. 35 made): 82.9, Marcus Miller, Carroll (Mont.), 2004-07 (58 of 70) 80.0, Bill May, Clarion (Pa.), 1977-80 (48 of 60) Most Extra Points Made by Kicking: 180, Steve Rhode, Northwestern (Iowa), 1980-83 (200 attempts) Most Extra Points Attempted by Kicking: 204, Bobby Wasson, Georgetown (Ky.), 1990-92 (175 made) Most Consecutive Extra Points Made by Kicking: 94, Rhys Barnhart, University of St. Francis (Ind.), 2007-08 TOTAL OFFENSE CAREER YARDS Player, Institution Years Plays Yards Tyler Emmert, Carroll (Mont.) 2002-05 1,745 13,979 Cris Reisert, Ohio Dominican 2005-08 1,952 13,878 Jon Kitna, Central Washington 1992-95 1,886 12,907 Kirk Baumgartner, Wisconsin-Stevens Point 1986-89 2,007 12,767 Eddie Eviston, Georgetown (Ky.) 1998-2001 1,504 12,703 Jason Truman, Western Montana 1993-96 1,879 12,295 Craig Fobbe, Morningside (Iowa) 2002-05 1,666 11,693 Jed Drenning, Glenville State (W.Va.) 1991-93 1,455 11,319 Dustin Dewald, Iowa Wesleyan 1989-91 1,654 11,057 Jason Landmark, Northern State (S.D.) 1986-89 1,827 10,983 Brian Ainsworth, New Mexico Highlands 1984-87 1,783 10,863 Marc Weekly, Pacific Lutheran (Wash.) 1990-93 1,448 10,722 Reed Giordana, Wisconsin-Stevens Point 1974-77 1,881 10,655
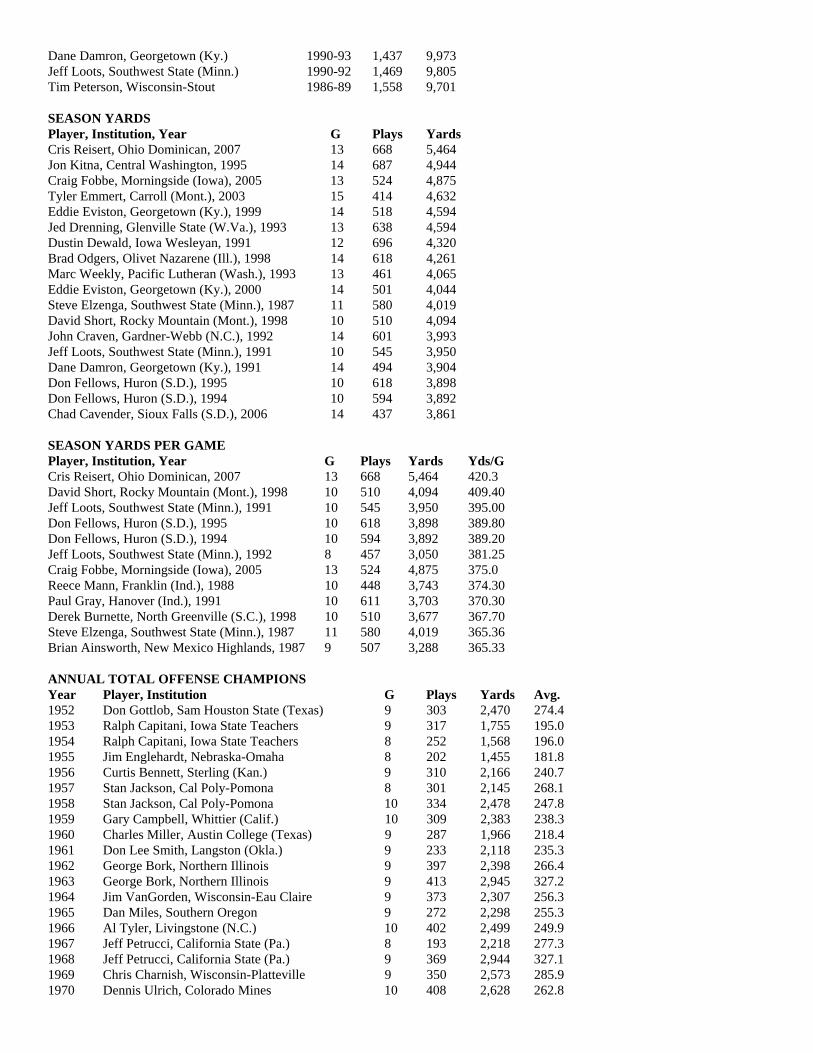
Dane Damron, Georgetown (Ky.) 1990-93 1,437 9,973 Jeff Loots, Southwest State (Minn.) 1990-92 1,469 9,805 Tim Peterson, Wisconsin-Stout 1986-89 1,558 9,701 SEASON YARDS Player, Institution, Year G Plays Yards Cris Reisert, Ohio Dominican, 2007 13 668 5,464 Jon Kitna, Central Washington, 1995 14 687 4,944 Craig Fobbe, Morningside (Iowa), 2005 13 524 4,875 Tyler Emmert, Carroll (Mont.), 2003 15 414 4,632 Eddie Eviston, Georgetown (Ky.), 1999 14 518 4,594 Jed Drenning, Glenville State (W.Va.), 1993 13 638 4,594 Dustin Dewald, Iowa Wesleyan, 1991 12 696 4,320 Brad Odgers, Olivet Nazarene (Ill.), 1998 14 618 4,261 Marc Weekly, Pacific Lutheran (Wash.), 1993 13 461 4,065 Eddie Eviston, Georgetown (Ky.), 2000 14 501 4,044 Steve Elzenga, Southwest State (Minn.), 1987 11 580 4,019 David Short, Rocky Mountain (Mont.), 1998 10 510 4,094 John Craven, Gardner-Webb (N.C.), 1992 14 601 3,993 Jeff Loots, Southwest State (Minn.), 1991 10 545 3,950 Dane Damron, Georgetown (Ky.), 1991 14 494 3,904 Don Fellows, Huron (S.D.), 1995 10 618 3,898 Don Fellows, Huron (S.D.), 1994 10 594 3,892 Chad Cavender, Sioux Falls (S.D.), 2006 14 437 3,861 SEASON YARDS PER GAME Player, Institution, Year G Plays Yards Yds/G Cris Reisert, Ohio Dominican, 2007 13 668 5,464 420.3 David Short, Rocky Mountain (Mont.), 1998 10 510 4,094 409.40 Jeff Loots, Southwest State (Minn.), 1991 10 545 3,950 395.00 Don Fellows, Huron (S.D.), 1995 10 618 3,898 389.80 Don Fellows, Huron (S.D.), 1994 10 594 3,892 389.20 Jeff Loots, Southwest State (Minn.), 1992 8 457 3,050 381.25 Craig Fobbe, Morningside (Iowa), 2005 13 524 4,875 375.0 Reece Mann, Franklin (Ind.), 1988 10 448 3,743 374.30 Paul Gray, Hanover (Ind.), 1991 10 611 3,703 370.30 Derek Burnette, North Greenville (S.C.), 1998 10 510 3,677 367.70 Steve Elzenga, Southwest State (Minn.), 1987 11 580 4,019 365.36 Brian Ainsworth, New Mexico Highlands, 1987 9 507 3,288 365.33 ANNUAL TOTAL OFFENSE CHAMPIONS Year Player, Institution G Plays Yards Avg. 1952 Don Gottlob, Sam Houston State (Texas) 9 303 2,470 274.4 1953 Ralph Capitani, Iowa State Teachers 9 317 1,755 195.0 1954 Ralph Capitani, Iowa State Teachers 8 252 1,568 196.0 1955 Jim Englehardt, Nebraska-Omaha 8 202 1,455 181.8 1956 Curtis Bennett, Sterling (Kan.) 9 310 2,166 240.7 1957 Stan Jackson, Cal Poly-Pomona 8 301 2,145 268.1 1958 Stan Jackson, Cal Poly-Pomona 10 334 2,478 247.8 1959 Gary Campbell, Whittier (Calif.) 10 309 2,383 238.3 1960 Charles Miller, Austin College (Texas) 9 287 1,966 218.4 1961 Don Lee Smith, Langston (Okla.) 9 233 2,118 235.3 1962 George Bork, Northern Illinois 9 397 2,398 266.4 1963 George Bork, Northern Illinois 9 413 2,945 327.2 1964 Jim VanGorden, Wisconsin-Eau Claire 9 373 2,307 256.3 1965 Dan Miles, Southern Oregon 9 272 2,298 255.3 1966 Al Tyler, Livingstone (N.C.) 10 402 2,499 249.9 1967 Jeff Petrucci, California State (Pa.) 8 193 2,218 277.3 1968 Jeff Petrucci, California State (Pa.) 9 369 2,944 327.1 1969 Chris Charnish, Wisconsin-Platteville 9 350 2,573 285.9 1970 Dennis Ulrich, Colorado Mines 10 408 2,628 262.8
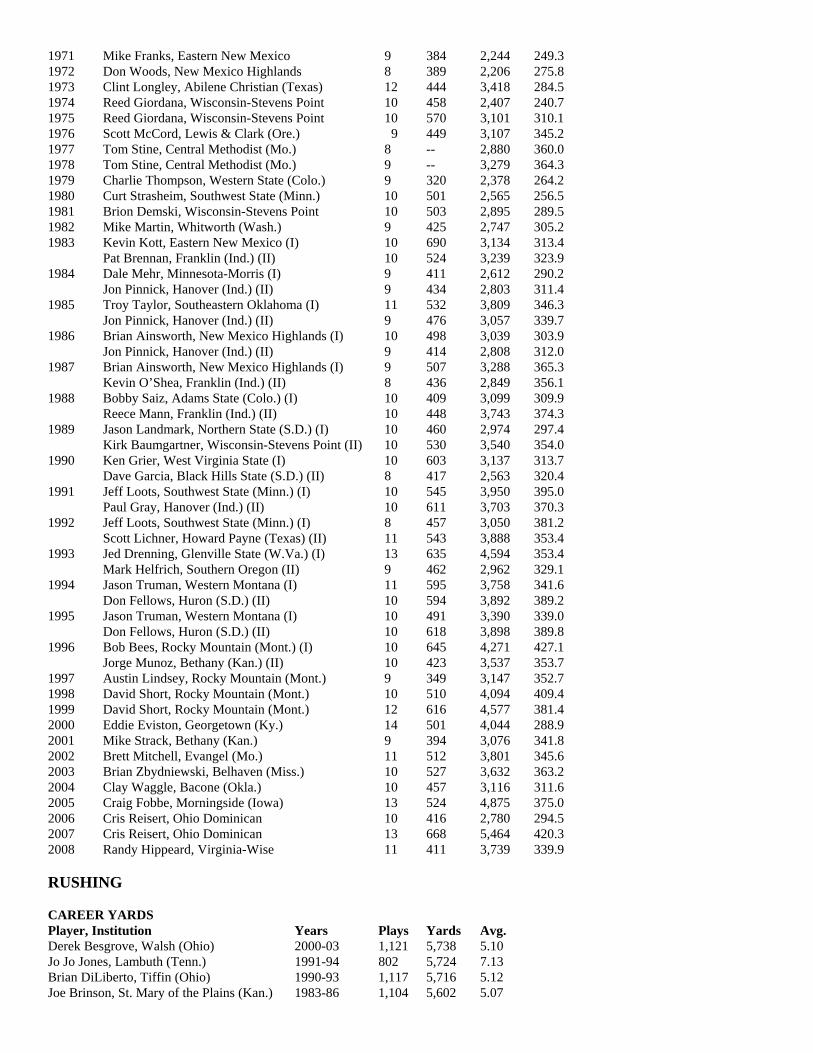
1971 Mike Franks, Eastern New Mexico 9 384 2,244 249.3 1972 Don Woods, New Mexico Highlands 8 389 2,206 275.8 1973 Clint Longley, Abilene Christian (Texas) 12 444 3,418 284.5 1974 Reed Giordana, Wisconsin-Stevens Point 10 458 2,407 240.7 1975 Reed Giordana, Wisconsin-Stevens Point 10 570 3,101 310.1 1976 Scott McCord, Lewis & Clark (Ore.) 9 449 3,107 345.2 1977 Tom Stine, Central Methodist (Mo.) 8 -- 2,880 360.0 1978 Tom Stine, Central Methodist (Mo.) 9 -- 3,279 364.3 1979 Charlie Thompson, Western State (Colo.) 9 320 2,378 264.2 1980 Curt Strasheim, Southwest State (Minn.) 10 501 2,565 256.5 1981 Brion Demski, Wisconsin-Stevens Point 10 503 2,895 289.5 1982 Mike Martin, Whitworth (Wash.) 9 425 2,747 305.2 1983 Kevin Kott, Eastern New Mexico (I) 10 690 3,134 313.4 Pat Brennan, Franklin (Ind.) (II) 10 524 3,239 323.9 1984 Dale Mehr, Minnesota-Morris (I) 9 411 2,612 290.2 Jon Pinnick, Hanover (Ind.) (II) 9 434 2,803 311.4 1985 Troy Taylor, Southeastern Oklahoma (I) 11 532 3,809 346.3 Jon Pinnick, Hanover (Ind.) (II) 9 476 3,057 339.7 1986 Brian Ainsworth, New Mexico Highlands (I) 10 498 3,039 303.9 Jon Pinnick, Hanover (Ind.) (II) 9 414 2,808 312.0 1987 Brian Ainsworth, New Mexico Highlands (I) 9 507 3,288 365.3 Kevin O’Shea, Franklin (Ind.) (II) 8 436 2,849 356.1 1988 Bobby Saiz, Adams State (Colo.) (I) 10 409 3,099 309.9 Reece Mann, Franklin (Ind.) (II) 10 448 3,743 374.3 1989 Jason Landmark, Northern State (S.D.) (I) 10 460 2,974 297.4 Kirk Baumgartner, Wisconsin-Stevens Point (II) 10 530 3,540 354.0 1990 Ken Grier, West Virginia State (I) 10 603 3,137 313.7 Dave Garcia, Black Hills State (S.D.) (II) 8 417 2,563 320.4 1991 Jeff Loots, Southwest State (Minn.) (I) 10 545 3,950 395.0 Paul Gray, Hanover (Ind.) (II) 10 611 3,703 370.3 1992 Jeff Loots, Southwest State (Minn.) (I) 8 457 3,050 381.2 Scott Lichner, Howard Payne (Texas) (II) 11 543 3,888 353.4 1993 Jed Drenning, Glenville State (W.Va.) (I) 13 635 4,594 353.4 Mark Helfrich, Southern Oregon (II) 9 462 2,962 329.1 1994 Jason Truman, Western Montana (I) 11 595 3,758 341.6 Don Fellows, Huron (S.D.) (II) 10 594 3,892 389.2 1995 Jason Truman, Western Montana (I) 10 491 3,390 339.0 Don Fellows, Huron (S.D.) (II) 10 618 3,898 389.8 1996 Bob Bees, Rocky Mountain (Mont.) (I) 10 645 4,271 427.1 Jorge Munoz, Bethany (Kan.) (II) 10 423 3,537 353.7 1997 Austin Lindsey, Rocky Mountain (Mont.) 9 349 3,147 352.7 1998 David Short, Rocky Mountain (Mont.) 10 510 4,094 409.4 1999 David Short, Rocky Mountain (Mont.) 12 616 4,577 381.4 2000 Eddie Eviston, Georgetown (Ky.) 14 501 4,044 288.9 2001 Mike Strack, Bethany (Kan.) 9 394 3,076 341.8 2002 Brett Mitchell, Evangel (Mo.) 11 512 3,801 345.6 2003 Brian Zbydniewski, Belhaven (Miss.) 10 527 3,632 363.2 2004 Clay Waggle, Bacone (Okla.) 10 457 3,116 311.6 2005 Craig Fobbe, Morningside (Iowa) 13 524 4,875 375.0 2006 Cris Reisert, Ohio Dominican 10 416 2,780 294.5 2007 Cris Reisert, Ohio Dominican 13 668 5,464 420.3 2008 Randy Hippeard, Virginia-Wise 11 411 3,739 339.9 RUSHING CAREER YARDS Player, Institution Years Plays Yards Avg. Derek Besgrove, Walsh (Ohio) 2000-03 1,121 5,738 5.10 Jo Jo Jones, Lambuth (Tenn.) 1991-94 802 5,724 7.13 Brian DiLiberto, Tiffin (Ohio) 1990-93 1,117 5,716 5.12 Joe Brinson, St. Mary of the Plains (Kan.) 1983-86 1,104 5,602 5.07
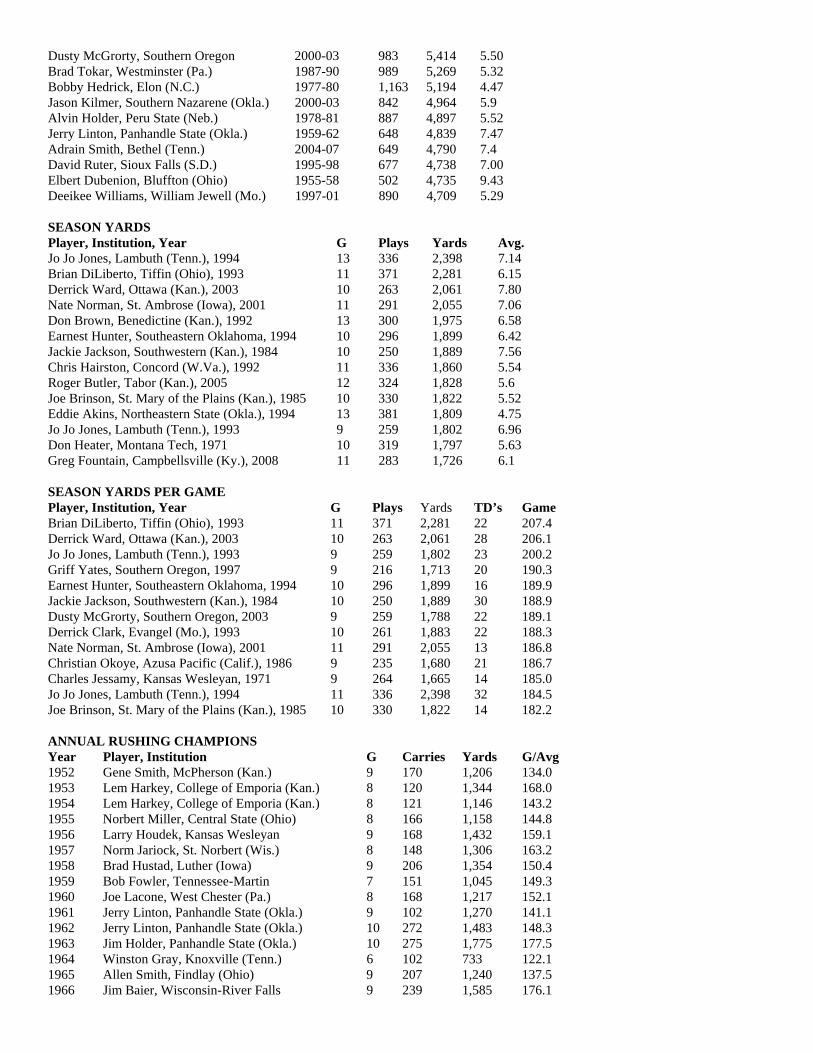
Dusty McGrorty, Southern Oregon 2000-03 983 5,414 5.50 Brad Tokar, Westminster (Pa.) 1987-90 989 5,269 5.32 Bobby Hedrick, Elon (N.C.) 1977-80 1,163 5,194 4.47 Jason Kilmer, Southern Nazarene (Okla.) 2000-03 842 4,964 5.9 Alvin Holder, Peru State (Neb.) 1978-81 887 4,897 5.52 Jerry Linton, Panhandle State (Okla.) 1959-62 648 4,839 7.47 Adrain Smith, Bethel (Tenn.) 2004-07 649 4,790 7.4 David Ruter, Sioux Falls (S.D.) 1995-98 677 4,738 7.00 Elbert Dubenion, Bluffton (Ohio) 1955-58 502 4,735 9.43 Deeikee Williams, William Jewell (Mo.) 1997-01 890 4,709 5.29 SEASON YARDS Player, Institution, Year G Plays Yards Avg. Jo Jo Jones, Lambuth (Tenn.), 1994 13 336 2,398 7.14 Brian DiLiberto, Tiffin (Ohio), 1993 11 371 2,281 6.15 Derrick Ward, Ottawa (Kan.), 2003 10 263 2,061 7.80 Nate Norman, St. Ambrose (Iowa), 2001 11 291 2,055 7.06 Don Brown, Benedictine (Kan.), 1992 13 300 1,975 6.58 Earnest Hunter, Southeastern Oklahoma, 1994 10 296 1,899 6.42 Jackie Jackson, Southwestern (Kan.), 1984 10 250 1,889 7.56 Chris Hairston, Concord (W.Va.), 1992 11 336 1,860 5.54 Roger Butler, Tabor (Kan.), 2005 12 324 1,828 5.6 Joe Brinson, St. Mary of the Plains (Kan.), 1985 10 330 1,822 5.52 Eddie Akins, Northeastern State (Okla.), 1994 13 381 1,809 4.75 Jo Jo Jones, Lambuth (Tenn.), 1993 9 259 1,802 6.96 Don Heater, Montana Tech, 1971 10 319 1,797 5.63 Greg Fountain, Campbellsville (Ky.), 2008 11 283 1,726 6.1 SEASON YARDS PER GAME Player, Institution, Year G Plays Yards TD’s Game Brian DiLiberto, Tiffin (Ohio), 1993 11 371 2,281 22 207.4 Derrick Ward, Ottawa (Kan.), 2003 10 263 2,061 28 206.1 Jo Jo Jones, Lambuth (Tenn.), 1993 9 259 1,802 23 200.2 Griff Yates, Southern Oregon, 1997 9 216 1,713 20 190.3 Earnest Hunter, Southeastern Oklahoma, 1994 10 296 1,899 16 189.9 Jackie Jackson, Southwestern (Kan.), 1984 10 250 1,889 30 188.9 Dusty McGrorty, Southern Oregon, 2003 9 259 1,788 22 189.1 Derrick Clark, Evangel (Mo.), 1993 10 261 1,883 22 188.3 Nate Norman, St. Ambrose (Iowa), 2001 11 291 2,055 13 186.8 Christian Okoye, Azusa Pacific (Calif.), 1986 9 235 1,680 21 186.7 Charles Jessamy, Kansas Wesleyan, 1971 9 264 1,665 14 185.0 Jo Jo Jones, Lambuth (Tenn.), 1994 11 336 2,398 32 184.5 Joe Brinson, St. Mary of the Plains (Kan.), 1985 10 330 1,822 14 182.2 ANNUAL RUSHING CHAMPIONS Year Player, Institution G Carries Yards G/Avg 1952 Gene Smith, McPherson (Kan.) 9 170 1,206 134.0 1953 Lem Harkey, College of Emporia (Kan.) 8 120 1,344 168.0 1954 Lem Harkey, College of Emporia (Kan.) 8 121 1,146 143.2 1955 Norbert Miller, Central State (Ohio) 8 166 1,158 144.8 1956 Larry Houdek, Kansas Wesleyan 9 168 1,432 159.1 1957 Norm Jariock, St. Norbert (Wis.) 8 148 1,306 163.2 1958 Brad Hustad, Luther (Iowa) 9 206 1,354 150.4 1959 Bob Fowler, Tennessee-Martin 7 151 1,045 149.3 1960 Joe Lacone, West Chester (Pa.) 8 168 1,217 152.1 1961 Jerry Linton, Panhandle State (Okla.) 9 102 1,270 141.1 1962 Jerry Linton, Panhandle State (Okla.) 10 272 1,483 148.3 1963 Jim Holder, Panhandle State (Okla.) 10 275 1,775 177.5 1964 Winston Gray, Knoxville (Tenn.) 6 102 733 122.1 1965 Allen Smith, Findlay (Ohio) 9 207 1,240 137.5 1966 Jim Baier, Wisconsin-River Falls 9 239 1,585 176.1
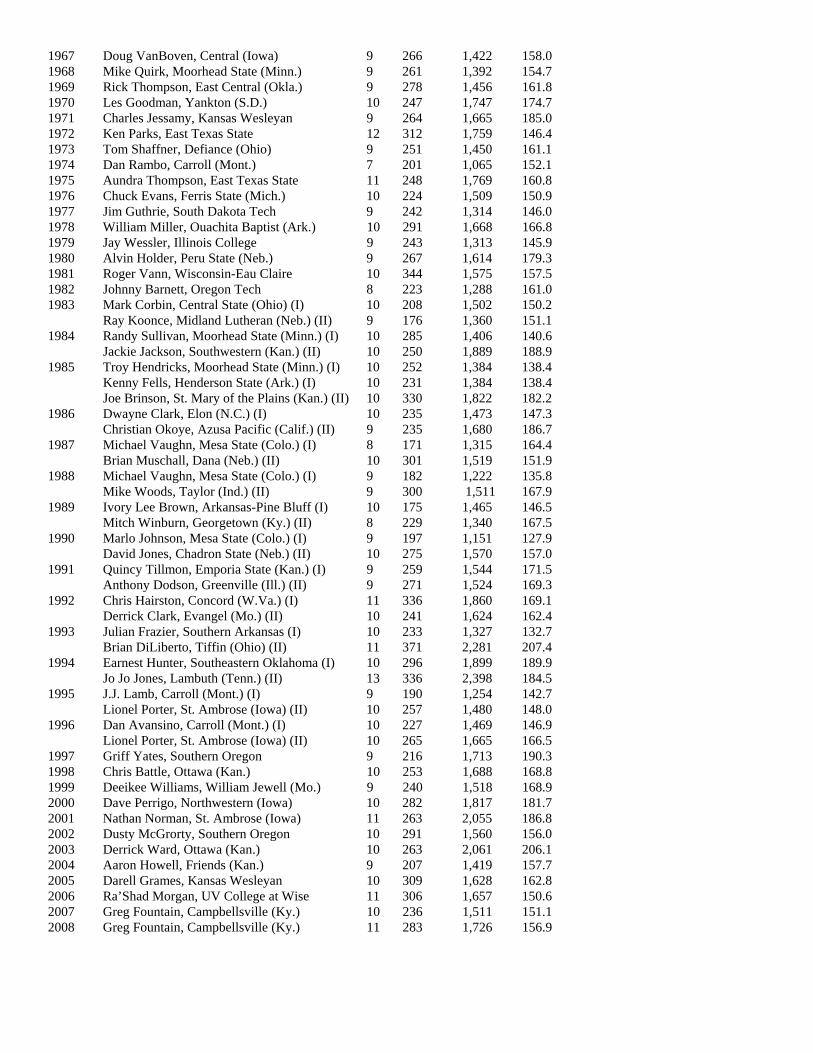
1967 Doug VanBoven, Central (Iowa) 9 266 1,422 158.0 1968 Mike Quirk, Moorhead State (Minn.) 9 261 1,392 154.7 1969 Rick Thompson, East Central (Okla.) 9 278 1,456 161.8 1970 Les Goodman, Yankton (S.D.) 10 247 1,747 174.7 1971 Charles Jessamy, Kansas Wesleyan 9 264 1,665 185.0 1972 Ken Parks, East Texas State 12 312 1,759 146.4 1973 Tom Shaffner, Defiance (Ohio) 9 251 1,450 161.1 1974 Dan Rambo, Carroll (Mont.) 7 201 1,065 152.1 1975 Aundra Thompson, East Texas State 11 248 1,769 160.8 1976 Chuck Evans, Ferris State (Mich.) 10 224 1,509 150.9 1977 Jim Guthrie, South Dakota Tech 9 242 1,314 146.0 1978 William Miller, Ouachita Baptist (Ark.) 10 291 1,668 166.8 1979 Jay Wessler, Illinois College 9 243 1,313 145.9 1980 Alvin Holder, Peru State (Neb.) 9 267 1,614 179.3 1981 Roger Vann, Wisconsin-Eau Claire 10 344 1,575 157.5 1982 Johnny Barnett, Oregon Tech 8 223 1,288 161.0 1983 Mark Corbin, Central State (Ohio) (I) 10 208 1,502 150.2 Ray Koonce, Midland Lutheran (Neb.) (II) 9 176 1,360 151.1 1984 Randy Sullivan, Moorhead State (Minn.) (I) 10 285 1,406 140.6 Jackie Jackson, Southwestern (Kan.) (II) 10 250 1,889 188.9 1985 Troy Hendricks, Moorhead State (Minn.) (I) 10 252 1,384 138.4 Kenny Fells, Henderson State (Ark.) (I) 10 231 1,384 138.4 Joe Brinson, St. Mary of the Plains (Kan.) (II) 10 330 1,822 182.2 1986 Dwayne Clark, Elon (N.C.) (I) 10 235 1,473 147.3 Christian Okoye, Azusa Pacific (Calif.) (II) 9 235 1,680 186.7 1987 Michael Vaughn, Mesa State (Colo.) (I) 8 171 1,315 164.4 Brian Muschall, Dana (Neb.) (II) 10 301 1,519 151.9 1988 Michael Vaughn, Mesa State (Colo.) (I) 9 182 1,222 135.8 Mike Woods, Taylor (Ind.) (II) 9 300 1,511 167.9 1989 Ivory Lee Brown, Arkansas-Pine Bluff (I) 10 175 1,465 146.5 Mitch Winburn, Georgetown (Ky.) (II) 8 229 1,340 167.5 1990 Marlo Johnson, Mesa State (Colo.) (I) 9 197 1,151 127.9 David Jones, Chadron State (Neb.) (II) 10 275 1,570 157.0 1991 Quincy Tillmon, Emporia State (Kan.) (I) 9 259 1,544 171.5 Anthony Dodson, Greenville (Ill.) (II) 9 271 1,524 169.3 1992 Chris Hairston, Concord (W.Va.) (I) 11 336 1,860 169.1 Derrick Clark, Evangel (Mo.) (II) 10 241 1,624 162.4 1993 Julian Frazier, Southern Arkansas (I) 10 233 1,327 132.7 Brian DiLiberto, Tiffin (Ohio) (II) 11 371 2,281 207.4 1994 Earnest Hunter, Southeastern Oklahoma (I) 10 296 1,899 189.9 Jo Jo Jones, Lambuth (Tenn.) (II) 13 336 2,398 184.5 1995 J.J. Lamb, Carroll (Mont.) (I) 9 190 1,254 142.7 Lionel Porter, St. Ambrose (Iowa) (II) 10 257 1,480 148.0 1996 Dan Avansino, Carroll (Mont.) (I) 10 227 1,469 146.9 Lionel Porter, St. Ambrose (Iowa) (II) 10 265 1,665 166.5 1997 Griff Yates, Southern Oregon 9 216 1,713 190.3 1998 Chris Battle, Ottawa (Kan.) 10 253 1,688 168.8 1999 Deeikee Williams, William Jewell (Mo.) 9 240 1,518 168.9 2000 Dave Perrigo, Northwestern (Iowa) 10 282 1,817 181.7 2001 Nathan Norman, St. Ambrose (Iowa) 11 263 2,055 186.8 2002 Dusty McGrorty, Southern Oregon 10 291 1,560 156.0 2003 Derrick Ward, Ottawa (Kan.) 10 263 2,061 206.1 2004 Aaron Howell, Friends (Kan.) 9 207 1,419 157.7 2005 Darell Grames, Kansas Wesleyan 10 309 1,628 162.8 2006 Ra’Shad Morgan, UV College at Wise 11 306 1,657 150.6 2007 Greg Fountain, Campbellsville (Ky.) 10 236 1,511 151.1 2008 Greg Fountain, Campbellsville (Ky.) 11 283 1,726 156.9
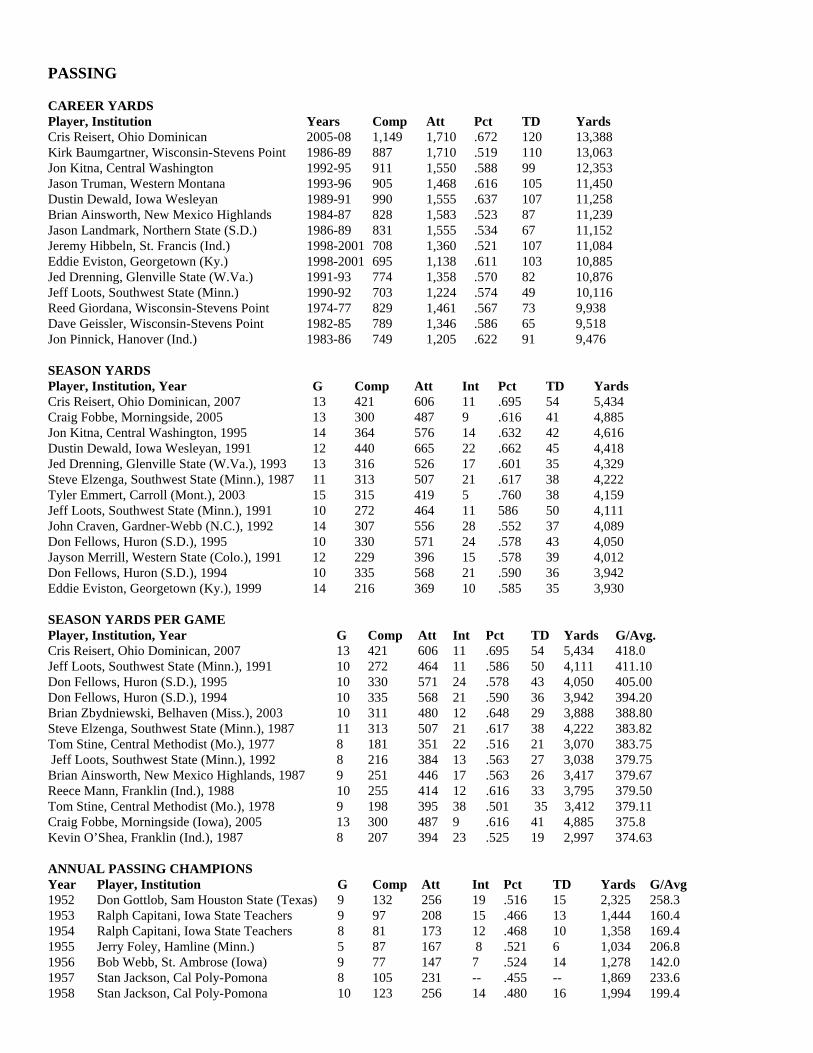
PASSING CAREER YARDS Player, Institution Years Comp Att Pct TD Yards Cris Reisert, Ohio Dominican 2005-08 1,149 1,710 .672 120 13,388 Kirk Baumgartner, Wisconsin-Stevens Point 1986-89 887 1,710 .519 110 13,063 Jon Kitna, Central Washington 1992-95 911 1,550 .588 99 12,353 Jason Truman, Western Montana 1993-96 905 1,468 .616 105 11,450 Dustin Dewald, Iowa Wesleyan 1989-91 990 1,555 .637 107 11,258 Brian Ainsworth, New Mexico Highlands 1984-87 828 1,583 .523 87 11,239 Jason Landmark, Northern State (S.D.) 1986-89 831 1,555 .534 67 11,152 Jeremy Hibbeln, St. Francis (Ind.) 1998-2001 708 1,360 .521 107 11,084 Eddie Eviston, Georgetown (Ky.) 1998-2001 695 1,138 .611 103 10,885 Jed Drenning, Glenville State (W.Va.) 1991-93 774 1,358 .570 82 10,876 Jeff Loots, Southwest State (Minn.) 1990-92 703 1,224 .574 49 10,116 Reed Giordana, Wisconsin-Stevens Point 1974-77 829 1,461 .567 73 9,938 Dave Geissler, Wisconsin-Stevens Point 1982-85 789 1,346 .586 65 9,518 Jon Pinnick, Hanover (Ind.) 1983-86 749 1,205 .622 91 9,476 SEASON YARDS Player, Institution, Year G Comp Att Int Pct TD Yards Cris Reisert, Ohio Dominican, 2007 13 421 606 11 .695 54 5,434 Craig Fobbe, Morningside, 2005 13 300 487 9 .616 41 4,885 Jon Kitna, Central Washington, 1995 14 364 576 14 .632 42 4,616 Dustin Dewald, Iowa Wesleyan, 1991 12 440 665 22 .662 45 4,418 Jed Drenning, Glenville State (W.Va.), 1993 13 316 526 17 .601 35 4,329 Steve Elzenga, Southwest State (Minn.), 1987 11 313 507 21 .617 38 4,222 Tyler Emmert, Carroll (Mont.), 2003 15 315 419 5 .760 38 4,159 Jeff Loots, Southwest State (Minn.), 1991 10 272 464 11 586 50 4,111 John Craven, Gardner-Webb (N.C.), 1992 14 307 556 28 .552 37 4,089 Don Fellows, Huron (S.D.), 1995 10 330 571 24 .578 43 4,050 Jayson Merrill, Western State (Colo.), 1991 12 229 396 15 .578 39 4,012 Don Fellows, Huron (S.D.), 1994 10 335 568 21 .590 36 3,942 Eddie Eviston, Georgetown (Ky.), 1999 14 216 369 10 .585 35 3,930 SEASON YARDS PER GAME Player, Institution, Year G Comp Att Int Pct TD Yards G/Avg. Cris Reisert, Ohio Dominican, 2007 13 421 606 11 .695 54 5,434 418.0 Jeff Loots, Southwest State (Minn.), 1991 10 272 464 11 .586 50 4,111 411.10 Don Fellows, Huron (S.D.), 1995 10 330 571 24 .578 43 4,050 405.00 Don Fellows, Huron (S.D.), 1994 10 335 568 21 .590 36 3,942 394.20 Brian Zbydniewski, Belhaven (Miss.), 2003 10 311 480 12 .648 29 3,888 388.80 Steve Elzenga, Southwest State (Minn.), 1987 11 313 507 21 .617 38 4,222 383.82 Tom Stine, Central Methodist (Mo.), 1977 8 181 351 22 .516 21 3,070 383.75 Jeff Loots, Southwest State (Minn.), 1992 8 216 384 13 .563 27 3,038 379.75 Brian Ainsworth, New Mexico Highlands, 1987 9 251 446 17 .563 26 3,417 379.67 Reece Mann, Franklin (Ind.), 1988 10 255 414 12 .616 33 3,795 379.50 Tom Stine, Central Methodist (Mo.), 1978 9 198 395 38 .501 35 3,412 379.11 Craig Fobbe, Morningside (Iowa), 2005 13 300 487 9 .616 41 4,885 375.8 Kevin O’Shea, Franklin (Ind.), 1987 8 207 394 23 .525 19 2,997 374.63 ANNUAL PASSING CHAMPIONS Year Player, Institution G Comp Att Int Pct TD Yards G/Avg 1952 Don Gottlob, Sam Houston State (Texas) 9 132 256 19 .516 15 2,325 258.3 1953 Ralph Capitani, Iowa State Teachers 9 97 208 15 .466 13 1,444 160.4 1954 Ralph Capitani, Iowa State Teachers 8 81 173 12 .468 10 1,358 169.4 1955 Jerry Foley, Hamline (Minn.) 5 87 167 8 .521 6 1,034 206.8 1956 Bob Webb, St. Ambrose (Iowa) 9 77 147 7 .524 14 1,278 142.0 1957 Stan Jackson, Cal Poly-Pomona 8 105 231 -- .455 -- 1,869 233.6 1958 Stan Jackson, Cal Poly-Pomona 10 123 256 14 .480 16 1,994 199.4
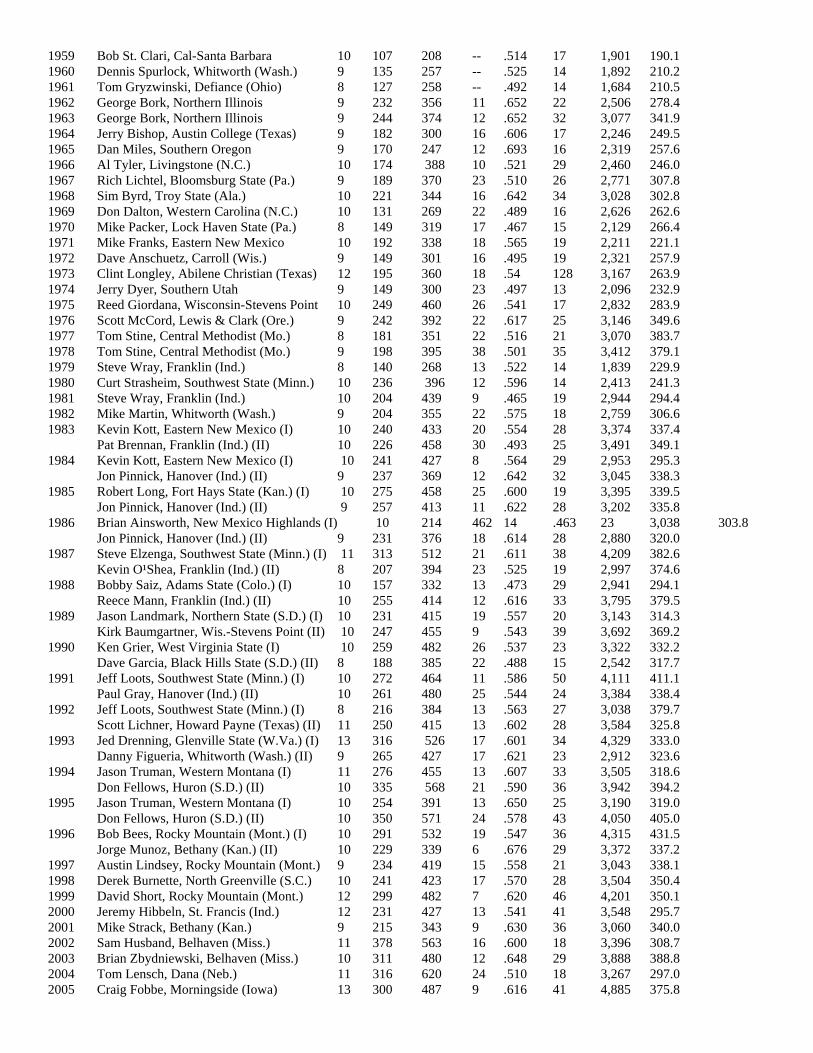
1959 Bob St. Clari, Cal-Santa Barbara 10 107 208 -- .514 17 1,901 190.1 1960 Dennis Spurlock, Whitworth (Wash.) 9 135 257 -- .525 14 1,892 210.2 1961 Tom Gryzwinski, Defiance (Ohio) 8 127 258 -- .492 14 1,684 210.5 1962 George Bork, Northern Illinois 9 232 356 11 .652 22 2,506 278.4 1963 George Bork, Northern Illinois 9 244 374 12 .652 32 3,077 341.9 1964 Jerry Bishop, Austin College (Texas) 9 182 300 16 .606 17 2,246 249.5 1965 Dan Miles, Southern Oregon 9 170 247 12 .693 16 2,319 257.6 1966 Al Tyler, Livingstone (N.C.) 10 174 388 10 .521 29 2,460 246.0 1967 Rich Lichtel, Bloomsburg State (Pa.) 9 189 370 23 .510 26 2,771 307.8 1968 Sim Byrd, Troy State (Ala.) 10 221 344 16 .642 34 3,028 302.8 1969 Don Dalton, Western Carolina (N.C.) 10 131 269 22 .489 16 2,626 262.6 1970 Mike Packer, Lock Haven State (Pa.) 8 149 319 17 .467 15 2,129 266.4 1971 Mike Franks, Eastern New Mexico 10 192 338 18 .565 19 2,211 221.1 1972 Dave Anschuetz, Carroll (Wis.) 9 149 301 16 .495 19 2,321 257.9 1973 Clint Longley, Abilene Christian (Texas) 12 195 360 18 .54 128 3,167 263.9 1974 Jerry Dyer, Southern Utah 9 149 300 23 .497 13 2,096 232.9 1975 Reed Giordana, Wisconsin-Stevens Point 10 249 460 26 .541 17 2,832 283.9 1976 Scott McCord, Lewis & Clark (Ore.) 9 242 392 22 .617 25 3,146 349.6 1977 Tom Stine, Central Methodist (Mo.) 8 181 351 22 .516 21 3,070 383.7 1978 Tom Stine, Central Methodist (Mo.) 9 198 395 38 .501 35 3,412 379.1 1979 Steve Wray, Franklin (Ind.) 8 140 268 13 .522 14 1,839 229.9 1980 Curt Strasheim, Southwest State (Minn.) 10 236 396 12 .596 14 2,413 241.3 1981 Steve Wray, Franklin (Ind.) 10 204 439 9 .465 19 2,944 294.4 1982 Mike Martin, Whitworth (Wash.) 9 204 355 22 .575 18 2,759 306.6 1983 Kevin Kott, Eastern New Mexico (I) 10 240 433 20 .554 28 3,374 337.4 Pat Brennan, Franklin (Ind.) (II) 10 226 458 30 .493 25 3,491 349.1 1984 Kevin Kott, Eastern New Mexico (I) 10 241 427 8 .564 29 2,953 295.3 Jon Pinnick, Hanover (Ind.) (II) 9 237 369 12 .642 32 3,045 338.3 1985 Robert Long, Fort Hays State (Kan.) (I) 10 275 458 25 .600 19 3,395 339.5 Jon Pinnick, Hanover (Ind.) (II) 9 257 413 11 .622 28 3,202 335.8 1986 Brian Ainsworth, New Mexico Highlands (I) 10 214 462 14 .463 23 3,038 303.8 Jon Pinnick, Hanover (Ind.) (II) 9 231 376 18 .614 28 2,880 320.0 1987 Steve Elzenga, Southwest State (Minn.) (I) 11 313 512 21 .611 38 4,209 382.6 Kevin O¹Shea, Franklin (Ind.) (II) 8 207 394 23 .525 19 2,997 374.6 1988 Bobby Saiz, Adams State (Colo.) (I) 10 157 332 13 .473 29 2,941 294.1 Reece Mann, Franklin (Ind.) (II) 10 255 414 12 .616 33 3,795 379.5 1989 Jason Landmark, Northern State (S.D.) (I) 10 231 415 19 .557 20 3,143 314.3 Kirk Baumgartner, Wis.-Stevens Point (II) 10 247 455 9 .543 39 3,692 369.2 1990 Ken Grier, West Virginia State (I) 10 259 482 26 .537 23 3,322 332.2 Dave Garcia, Black Hills State (S.D.) (II) 8 188 385 22 .488 15 2,542 317.7 1991 Jeff Loots, Southwest State (Minn.) (I) 10 272 464 11 .586 50 4,111 411.1 Paul Gray, Hanover (Ind.) (II) 10 261 480 25 .544 24 3,384 338.4 1992 Jeff Loots, Southwest State (Minn.) (I) 8 216 384 13 .563 27 3,038 379.7 Scott Lichner, Howard Payne (Texas) (II) 11 250 415 13 .602 28 3,584 325.8 1993 Jed Drenning, Glenville State (W.Va.) (I) 13 316 526 17 .601 34 4,329 333.0 Danny Figueria, Whitworth (Wash.) (II) 9 265 427 17 .621 23 2,912 323.6 1994 Jason Truman, Western Montana (I) 11 276 455 13 .607 33 3,505 318.6 Don Fellows, Huron (S.D.) (II) 10 335 568 21 .590 36 3,942 394.2 1995 Jason Truman, Western Montana (I) 10 254 391 13 .650 25 3,190 319.0 Don Fellows, Huron (S.D.) (II) 10 350 571 24 .578 43 4,050 405.0 1996 Bob Bees, Rocky Mountain (Mont.) (I) 10 291 532 19 .547 36 4,315 431.5 Jorge Munoz, Bethany (Kan.) (II) 10 229 339 6 .676 29 3,372 337.2 1997 Austin Lindsey, Rocky Mountain (Mont.) 9 234 419 15 .558 21 3,043 338.1 1998 Derek Burnette, North Greenville (S.C.) 10 241 423 17 .570 28 3,504 350.4 1999 David Short, Rocky Mountain (Mont.) 12 299 482 7 .620 46 4,201 350.1 2000 Jeremy Hibbeln, St. Francis (Ind.) 12 231 427 13 .541 41 3,548 295.7 2001 Mike Strack, Bethany (Kan.) 9 215 343 9 .630 36 3,060 340.0 2002 Sam Husband, Belhaven (Miss.) 11 378 563 16 .600 18 3,396 308.7 2003 Brian Zbydniewski, Belhaven (Miss.) 10 311 480 12 .648 29 3,888 388.8 2004 Tom Lensch, Dana (Neb.) 11 316 620 24 .510 18 3,267 297.0 2005 Craig Fobbe, Morningside (Iowa) 13 300 487 9 .616 41 4,885 375.8
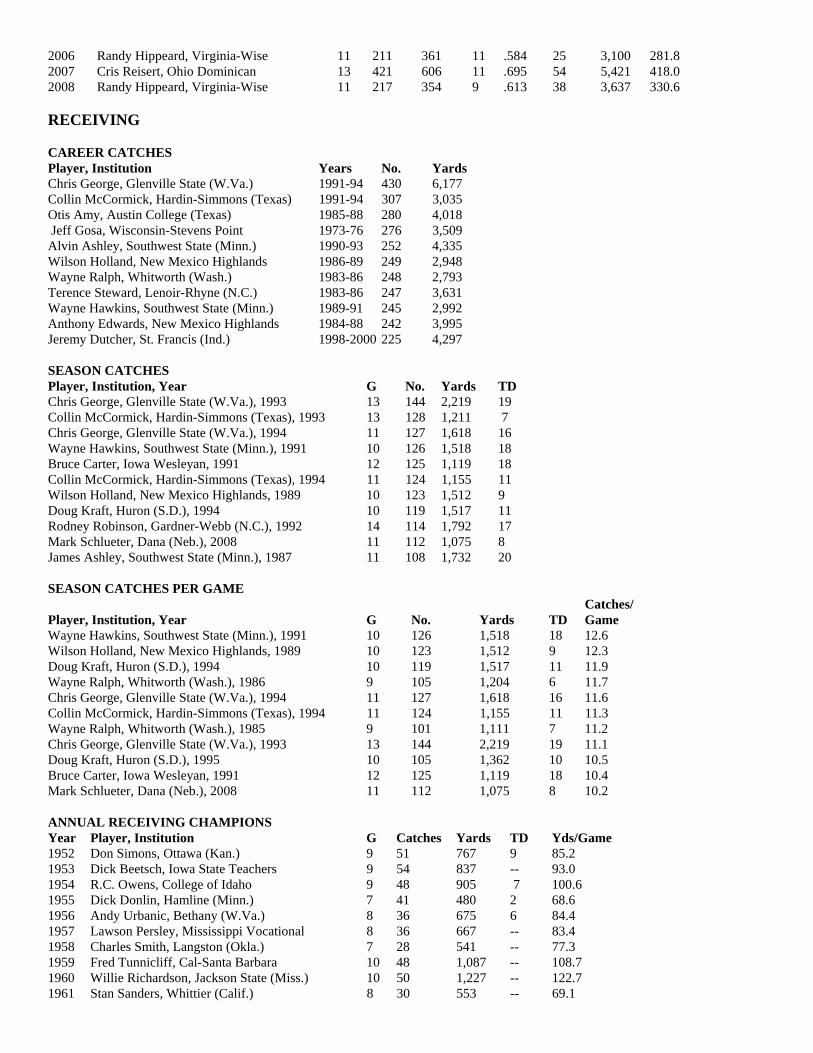
2006 Randy Hippeard, Virginia-Wise 11 211 361 11 .584 25 3,100 281.8 2007 Cris Reisert, Ohio Dominican 13 421 606 11 .695 54 5,421 418.0 2008 Randy Hippeard, Virginia-Wise 11 217 354 9 .613 38 3,637 330.6 RECEIVING CAREER CATCHES Player, Institution Years No. Yards Chris George, Glenville State (W.Va.) 1991-94 430 6,177 Collin McCormick, Hardin-Simmons (Texas) 1991-94 307 3,035 Otis Amy, Austin College (Texas) 1985-88 280 4,018 Jeff Gosa, Wisconsin-Stevens Point 1973-76 276 3,509 Alvin Ashley, Southwest State (Minn.) 1990-93 252 4,335 Wilson Holland, New Mexico Highlands 1986-89 249 2,948 Wayne Ralph, Whitworth (Wash.) 1983-86 248 2,793 Terence Steward, Lenoir-Rhyne (N.C.) 1983-86 247 3,631 Wayne Hawkins, Southwest State (Minn.) 1989-91 245 2,992 Anthony Edwards, New Mexico Highlands 1984-88 242 3,995 Jeremy Dutcher, St. Francis (Ind.) 1998-2000 225 4,297 SEASON CATCHES Player, Institution, Year G No. Yards TD Chris George, Glenville State (W.Va.), 1993 13 144 2,219 19 Collin McCormick, Hardin-Simmons (Texas), 1993 13 128 1,211 7 Chris George, Glenville State (W.Va.), 1994 11 127 1,618 16 Wayne Hawkins, Southwest State (Minn.), 1991 10 126 1,518 18 Bruce Carter, Iowa Wesleyan, 1991 12 125 1,119 18 Collin McCormick, Hardin-Simmons (Texas), 1994 11 124 1,155 11 Wilson Holland, New Mexico Highlands, 1989 10 123 1,512 9 Doug Kraft, Huron (S.D.), 1994 10 119 1,517 11 Rodney Robinson, Gardner-Webb (N.C.), 1992 14 114 1,792 17 Mark Schlueter, Dana (Neb.), 2008 11 112 1,075 8 James Ashley, Southwest State (Minn.), 1987 11 108 1,732 20 SEASON CATCHES PER GAME Catches/ Player, Institution, Year G No. Yards TD Game Wayne Hawkins, Southwest State (Minn.), 1991 10 126 1,518 18 12.6 Wilson Holland, New Mexico Highlands, 1989 10 123 1,512 9 12.3 Doug Kraft, Huron (S.D.), 1994 10 119 1,517 11 11.9 Wayne Ralph, Whitworth (Wash.), 1986 9 105 1,204 6 11.7 Chris George, Glenville State (W.Va.), 1994 11 127 1,618 16 11.6 Collin McCormick, Hardin-Simmons (Texas), 1994 11 124 1,155 11 11.3 Wayne Ralph, Whitworth (Wash.), 1985 9 101 1,111 7 11.2 Chris George, Glenville State (W.Va.), 1993 13 144 2,219 19 11.1 Doug Kraft, Huron (S.D.), 1995 10 105 1,362 10 10.5 Bruce Carter, Iowa Wesleyan, 1991 12 125 1,119 18 10.4 Mark Schlueter, Dana (Neb.), 2008 11 112 1,075 8 10.2 ANNUAL RECEIVING CHAMPIONS Year Player, Institution G Catches Yards TD Yds/Game 1952 Don Simons, Ottawa (Kan.) 9 51 767 9 85.2 1953 Dick Beetsch, Iowa State Teachers 9 54 837 -- 93.0 1954 R.C. Owens, College of Idaho 9 48 905 7 100.6 1955 Dick Donlin, Hamline (Minn.) 7 41 480 2 68.6 1956 Andy Urbanic, Bethany (W.Va.) 8 36 675 6 84.4 1957 Lawson Persley, Mississippi Vocational 8 36 667 -- 83.4 1958 Charles Smith, Langston (Okla.) 7 28 541 -- 77.3 1959 Fred Tunnicliff, Cal-Santa Barbara 10 48 1,087 -- 108.7 1960 Willie Richardson, Jackson State (Miss.) 10 50 1,227 -- 122.7 1961 Stan Sanders, Whittier (Calif.) 8 30 553 -- 69.1
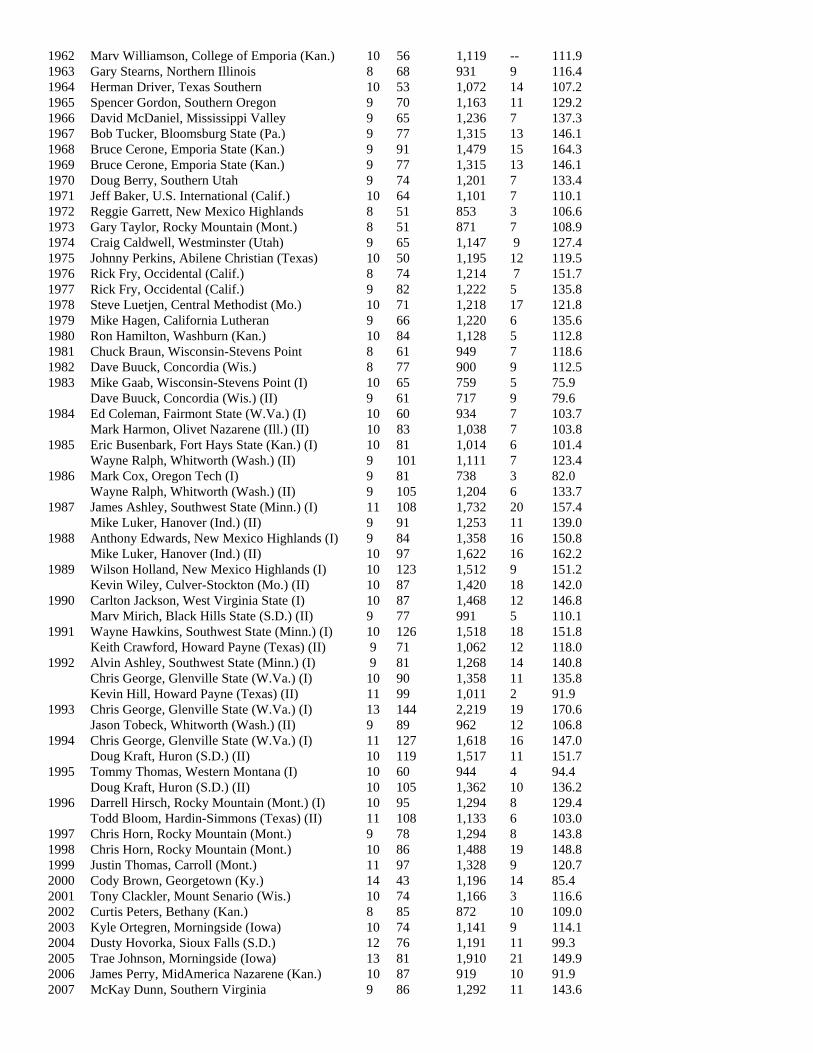
1962 Marv Williamson, College of Emporia (Kan.) 10 56 1,119 -- 111.9 1963 Gary Stearns, Northern Illinois 8 68 931 9 116.4 1964 Herman Driver, Texas Southern 10 53 1,072 14 107.2 1965 Spencer Gordon, Southern Oregon 9 70 1,163 11 129.2 1966 David McDaniel, Mississippi Valley 9 65 1,236 7 137.3 1967 Bob Tucker, Bloomsburg State (Pa.) 9 77 1,315 13 146.1 1968 Bruce Cerone, Emporia State (Kan.) 9 91 1,479 15 164.3 1969 Bruce Cerone, Emporia State (Kan.) 9 77 1,315 13 146.1 1970 Doug Berry, Southern Utah 9 74 1,201 7 133.4 1971 Jeff Baker, U.S. International (Calif.) 10 64 1,101 7 110.1 1972 Reggie Garrett, New Mexico Highlands 8 51 853 3 106.6 1973 Gary Taylor, Rocky Mountain (Mont.) 8 51 871 7 108.9 1974 Craig Caldwell, Westminster (Utah) 9 65 1,147 9 127.4 1975 Johnny Perkins, Abilene Christian (Texas) 10 50 1,195 12 119.5 1976 Rick Fry, Occidental (Calif.) 8 74 1,214 7 151.7 1977 Rick Fry, Occidental (Calif.) 9 82 1,222 5 135.8 1978 Steve Luetjen, Central Methodist (Mo.) 10 71 1,218 17 121.8 1979 Mike Hagen, California Lutheran 9 66 1,220 6 135.6 1980 Ron Hamilton, Washburn (Kan.) 10 84 1,128 5 112.8 1981 Chuck Braun, Wisconsin-Stevens Point 8 61 949 7 118.6 1982 Dave Buuck, Concordia (Wis.) 8 77 900 9 112.5 1983 Mike Gaab, Wisconsin-Stevens Point (I) 10 65 759 5 75.9 Dave Buuck, Concordia (Wis.) (II) 9 61 717 9 79.6 1984 Ed Coleman, Fairmont State (W.Va.) (I) 10 60 934 7 103.7 Mark Harmon, Olivet Nazarene (Ill.) (II) 10 83 1,038 7 103.8 1985 Eric Busenbark, Fort Hays State (Kan.) (I) 10 81 1,014 6 101.4 Wayne Ralph, Whitworth (Wash.) (II) 9 101 1,111 7 123.4 1986 Mark Cox, Oregon Tech (I) 9 81 738 3 82.0 Wayne Ralph, Whitworth (Wash.) (II) 9 105 1,204 6 133.7 1987 James Ashley, Southwest State (Minn.) (I) 11 108 1,732 20 157.4 Mike Luker, Hanover (Ind.) (II) 9 91 1,253 11 139.0 1988 Anthony Edwards, New Mexico Highlands (I) 9 84 1,358 16 150.8 Mike Luker, Hanover (Ind.) (II) 10 97 1,622 16 162.2 1989 Wilson Holland, New Mexico Highlands (I) 10 123 1,512 9 151.2 Kevin Wiley, Culver-Stockton (Mo.) (II) 10 87 1,420 18 142.0 1990 Carlton Jackson, West Virginia State (I) 10 87 1,468 12 146.8 Marv Mirich, Black Hills State (S.D.) (II) 9 77 991 5 110.1 1991 Wayne Hawkins, Southwest State (Minn.) (I) 10 126 1,518 18 151.8 Keith Crawford, Howard Payne (Texas) (II) 9 71 1,062 12 118.0 1992 Alvin Ashley, Southwest State (Minn.) (I) 9 81 1,268 14 140.8 Chris George, Glenville State (W.Va.) (I) 10 90 1,358 11 135.8 Kevin Hill, Howard Payne (Texas) (II) 11 99 1,011 2 91.9 1993 Chris George, Glenville State (W.Va.) (I) 13 144 2,219 19 170.6 Jason Tobeck, Whitworth (Wash.) (II) 9 89 962 12 106.8 1994 Chris George, Glenville State (W.Va.) (I) 11 127 1,618 16 147.0 Doug Kraft, Huron (S.D.) (II) 10 119 1,517 11 151.7 1995 Tommy Thomas, Western Montana (I) 10 60 944 4 94.4 Doug Kraft, Huron (S.D.) (II) 10 105 1,362 10 136.2 1996 Darrell Hirsch, Rocky Mountain (Mont.) (I) 10 95 1,294 8 129.4 Todd Bloom, Hardin-Simmons (Texas) (II) 11 108 1,133 6 103.0 1997 Chris Horn, Rocky Mountain (Mont.) 9 78 1,294 8 143.8 1998 Chris Horn, Rocky Mountain (Mont.) 10 86 1,488 19 148.8 1999 Justin Thomas, Carroll (Mont.) 11 97 1,328 9 120.7 2000 Cody Brown, Georgetown (Ky.) 14 43 1,196 14 85.4 2001 Tony Clackler, Mount Senario (Wis.) 10 74 1,166 3 116.6 2002 Curtis Peters, Bethany (Kan.) 8 85 872 10 109.0 2003 Kyle Ortegren, Morningside (Iowa) 10 74 1,141 9 114.1 2004 Dusty Hovorka, Sioux Falls (S.D.) 12 76 1,191 11 99.3 2005 Trae Johnson, Morningside (Iowa) 13 81 1,910 21 149.9 2006 James Perry, MidAmerica Nazarene (Kan.) 10 87 919 10 91.9 2007 McKay Dunn, Southern Virginia 9 86 1,292 11 143.6
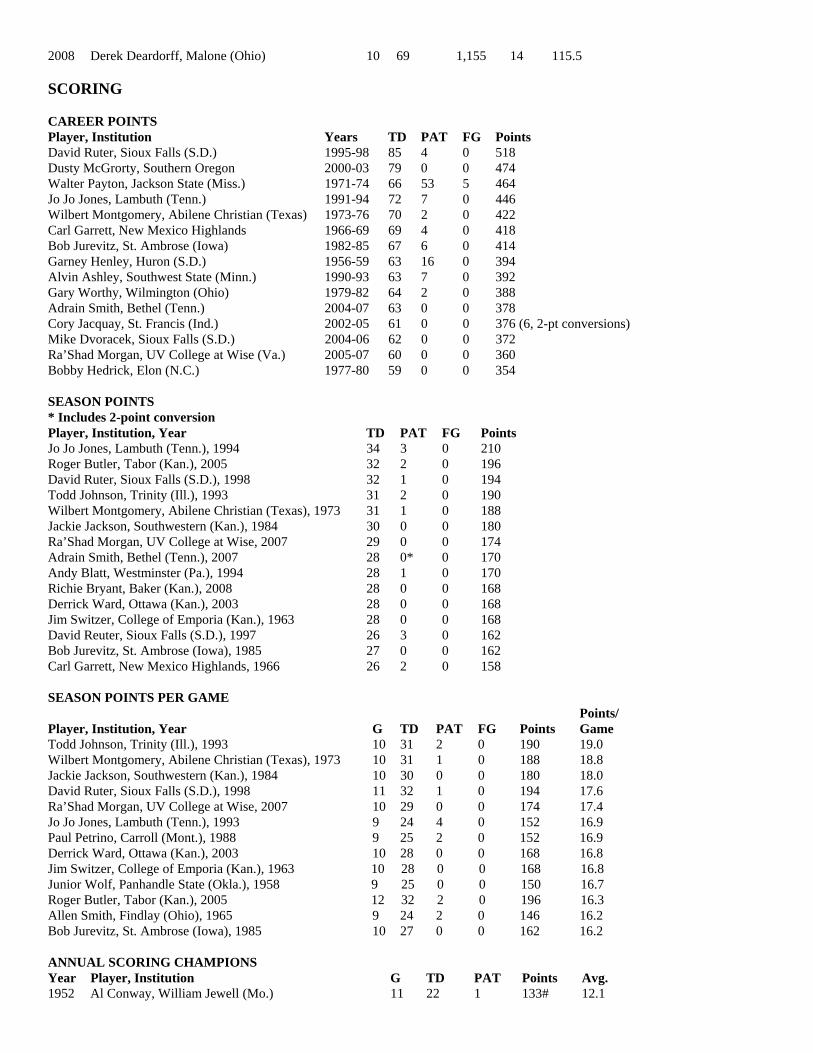
2008 Derek Deardorff, Malone (Ohio) 10 69 1,155 14 115.5 SCORING CAREER POINTS Player, Institution Years TD PAT FG Points David Ruter, Sioux Falls (S.D.) 1995-98 85 4 0 518 Dusty McGrorty, Southern Oregon 2000-03 79 0 0 474 Walter Payton, Jackson State (Miss.) 1971-74 66 53 5 464 Jo Jo Jones, Lambuth (Tenn.) 1991-94 72 7 0 446 Wilbert Montgomery, Abilene Christian (Texas) 1973-76 70 2 0 422 Carl Garrett, New Mexico Highlands 1966-69 69 4 0 418 Bob Jurevitz, St. Ambrose (Iowa) 1982-85 67 6 0 414 Garney Henley, Huron (S.D.) 1956-59 63 16 0 394 Alvin Ashley, Southwest State (Minn.) 1990-93 63 7 0 392 Gary Worthy, Wilmington (Ohio) 1979-82 64 2 0 388 Adrain Smith, Bethel (Tenn.) 2004-07 63 0 0 378 Cory Jacquay, St. Francis (Ind.) 2002-05 61 0 0 376 (6, 2-pt conversions) Mike Dvoracek, Sioux Falls (S.D.) 2004-06 62 0 0 372 Ra’Shad Morgan, UV College at Wise (Va.) 2005-07 60 0 0 360 Bobby Hedrick, Elon (N.C.) 1977-80 59 0 0 354 SEASON POINTS * Includes 2-point conversion Player, Institution, Year TD PAT FG Points Jo Jo Jones, Lambuth (Tenn.), 1994 34 3 0 210 Roger Butler, Tabor (Kan.), 2005 32 2 0 196 David Ruter, Sioux Falls (S.D.), 1998 32 1 0 194 Todd Johnson, Trinity (Ill.), 1993 31 2 0 190 Wilbert Montgomery, Abilene Christian (Texas), 1973 31 1 0 188 Jackie Jackson, Southwestern (Kan.), 1984 30 0 0 180 Ra’Shad Morgan, UV College at Wise, 2007 29 0 0 174 Adrain Smith, Bethel (Tenn.), 2007 28 0* 0 170 Andy Blatt, Westminster (Pa.), 1994 28 1 0 170 Richie Bryant, Baker (Kan.), 2008 28 0 0 168 Derrick Ward, Ottawa (Kan.), 2003 28 0 0 168 Jim Switzer, College of Emporia (Kan.), 1963 28 0 0 168 David Reuter, Sioux Falls (S.D.), 1997 26 3 0 162 Bob Jurevitz, St. Ambrose (Iowa), 1985 27 0 0 162 Carl Garrett, New Mexico Highlands, 1966 26 2 0 158 SEASON POINTS PER GAME Points/ Player, Institution, Year G TD PAT FG Points Game Todd Johnson, Trinity (Ill.), 1993 10 31 2 0 190 19.0 Wilbert Montgomery, Abilene Christian (Texas), 1973 10 31 1 0 188 18.8 Jackie Jackson, Southwestern (Kan.), 1984 10 30 0 0 180 18.0 David Ruter, Sioux Falls (S.D.), 1998 11 32 1 0 194 17.6 Ra’Shad Morgan, UV College at Wise, 2007 10 29 0 0 174 17.4 Jo Jo Jones, Lambuth (Tenn.), 1993 9 24 4 0 152 16.9 Paul Petrino, Carroll (Mont.), 1988 9 25 2 0 152 16.9 Derrick Ward, Ottawa (Kan.), 2003 10 28 0 0 168 16.8 Jim Switzer, College of Emporia (Kan.), 1963 10 28 0 0 168 16.8 Junior Wolf, Panhandle State (Okla.), 1958 9 25 0 0 150 16.7 Roger Butler, Tabor (Kan.), 2005 12 32 2 0 196 16.3 Allen Smith, Findlay (Ohio), 1965 9 24 2 0 146 16.2 Bob Jurevitz, St. Ambrose (Iowa), 1985 10 27 0 0 162 16.2 ANNUAL SCORING CHAMPIONS Year Player, Institution G TD PAT Points Avg. 1952 Al Conway, William Jewell (Mo.) 11 22 1 133# 12.1
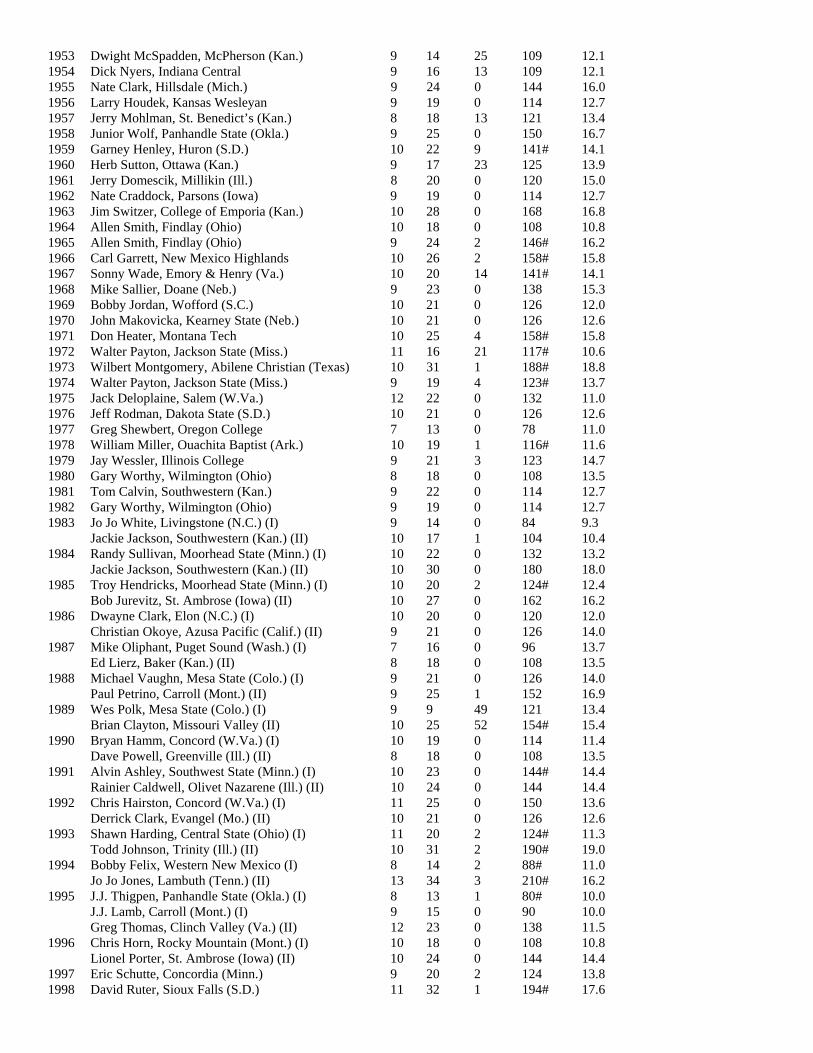
1953 Dwight McSpadden, McPherson (Kan.) 9 14 25 109 12.1 1954 Dick Nyers, Indiana Central 9 16 13 109 12.1 1955 Nate Clark, Hillsdale (Mich.) 9 24 0 144 16.0 1956 Larry Houdek, Kansas Wesleyan 9 19 0 114 12.7 1957 Jerry Mohlman, St. Benedict’s (Kan.) 8 18 13 121 13.4 1958 Junior Wolf, Panhandle State (Okla.) 9 25 0 150 16.7 1959 Garney Henley, Huron (S.D.) 10 22 9 141# 14.1 1960 Herb Sutton, Ottawa (Kan.) 9 17 23 125 13.9 1961 Jerry Domescik, Millikin (Ill.) 8 20 0 120 15.0 1962 Nate Craddock, Parsons (Iowa) 9 19 0 114 12.7 1963 Jim Switzer, College of Emporia (Kan.) 10 28 0 168 16.8 1964 Allen Smith, Findlay (Ohio) 10 18 0 108 10.8 1965 Allen Smith, Findlay (Ohio) 9 24 2 146# 16.2 1966 Carl Garrett, New Mexico Highlands 10 26 2 158# 15.8 1967 Sonny Wade, Emory & Henry (Va.) 10 20 14 141# 14.1 1968 Mike Sallier, Doane (Neb.) 9 23 0 138 15.3 1969 Bobby Jordan, Wofford (S.C.) 10 21 0 126 12.0 1970 John Makovicka, Kearney State (Neb.) 10 21 0 126 12.6 1971 Don Heater, Montana Tech 10 25 4 158# 15.8 1972 Walter Payton, Jackson State (Miss.) 11 16 21 117# 10.6 1973 Wilbert Montgomery, Abilene Christian (Texas) 10 31 1 188# 18.8 1974 Walter Payton, Jackson State (Miss.) 9 19 4 123# 13.7 1975 Jack Deloplaine, Salem (W.Va.) 12 22 0 132 11.0 1976 Jeff Rodman, Dakota State (S.D.) 10 21 0 126 12.6 1977 Greg Shewbert, Oregon College 7 13 0 78 11.0 1978 William Miller, Ouachita Baptist (Ark.) 10 19 1 116# 11.6 1979 Jay Wessler, Illinois College 9 21 3 123 14.7 1980 Gary Worthy, Wilmington (Ohio) 8 18 0 108 13.5 1981 Tom Calvin, Southwestern (Kan.) 9 22 0 114 12.7 1982 Gary Worthy, Wilmington (Ohio) 9 19 0 114 12.7 1983 Jo Jo White, Livingstone (N.C.) (I) 9 14 0 84 9.3 Jackie Jackson, Southwestern (Kan.) (II) 10 17 1 104 10.4 1984 Randy Sullivan, Moorhead State (Minn.) (I) 10 22 0 132 13.2 Jackie Jackson, Southwestern (Kan.) (II) 10 30 0 180 18.0 1985 Troy Hendricks, Moorhead State (Minn.) (I) 10 20 2 124# 12.4 Bob Jurevitz, St. Ambrose (Iowa) (II) 10 27 0 162 16.2 1986 Dwayne Clark, Elon (N.C.) (I) 10 20 0 120 12.0 Christian Okoye, Azusa Pacific (Calif.) (II) 9 21 0 126 14.0 1987 Mike Oliphant, Puget Sound (Wash.) (I) 7 16 0 96 13.7 Ed Lierz, Baker (Kan.) (II) 8 18 0 108 13.5 1988 Michael Vaughn, Mesa State (Colo.) (I) 9 21 0 126 14.0 Paul Petrino, Carroll (Mont.) (II) 9 25 1 152 16.9 1989 Wes Polk, Mesa State (Colo.) (I) 9 9 49 121 13.4 Brian Clayton, Missouri Valley (II) 10 25 52 154# 15.4 1990 Bryan Hamm, Concord (W.Va.) (I) 10 19 0 114 11.4 Dave Powell, Greenville (Ill.) (II) 8 18 0 108 13.5 1991 Alvin Ashley, Southwest State (Minn.) (I) 10 23 0 144# 14.4 Rainier Caldwell, Olivet Nazarene (Ill.) (II) 10 24 0 144 14.4 1992 Chris Hairston, Concord (W.Va.) (I) 11 25 0 150 13.6 Derrick Clark, Evangel (Mo.) (II) 10 21 0 126 12.6 1993 Shawn Harding, Central State (Ohio) (I) 11 20 2 124# 11.3 Todd Johnson, Trinity (Ill.) (II) 10 31 2 190# 19.0 1994 Bobby Felix, Western New Mexico (I) 8 14 2 88# 11.0 Jo Jo Jones, Lambuth (Tenn.) (II) 13 34 3 210# 16.2 1995 J.J. Thigpen, Panhandle State (Okla.) (I) 8 13 1 80# 10.0 J.J. Lamb, Carroll (Mont.) (I) 9 15 0 90 10.0 Greg Thomas, Clinch Valley (Va.) (II) 12 23 0 138 11.5 1996 Chris Horn, Rocky Mountain (Mont.) (I) 10 18 0 108 10.8 Lionel Porter, St. Ambrose (Iowa) (II) 10 24 0 144 14.4 1997 Eric Schutte, Concordia (Minn.) 9 20 2 124 13.8 1998 David Ruter, Sioux Falls (S.D.) 11 32 1 194# 17.6

1999 Herbert Goodman, Graceland (Iowa) 10 24 0 150 15.0 2000 Travis Souice, Hastings (Neb.) 9 21 0 126 14.0 David Perrigo, Northwestern (Iowa) 10 23 1 140 14.0 2001 Dusty McGrorty, Southern Oregon 11 25 0 150 13.6 2002 Bo Bienkowski, Hastings (Neb.) 10 25 0 150 15.0 2003 Derrick Ward, Ottawa (Kan.) 10 28 0 168 16.8 2004 Eric Moody, Hastings (Neb.) 12 23 0 138 11.5 2005 Roger Butler, Tabor (Kan.) 12 32 2 196 16.3 2006 Ra’Shad Morgan, UV College at Wise 11 25 0 150 13.6 2007 Ra’Shad Morgan, UV College at Wise 10 29 0 174 17.4 2008 Richie Bryant, Baker (Kan.) 12 28 0 168 14.0 # includes two-point conversions and field goals PUNTING CAREER AVERAGE (minimum 90 punts) Player, Institution Years No. Yards Avg. Carl Birdsong, Southwestern Oklahoma 1979-80 102 4,545 44.56 Don Cockroft, Adams State (Colo.) 1964-66 95 4,231 44.53 Tim Baer, Colorado Mines 1986-89 235 10,406 44.28 Jeff Guy, Western State (Colo.) 1983-85 113 4,967 43.96 Russ Pilcher, Carroll (Mont.) 1964-66 124 5,424 43.74 Rick Mashburn, Lenoir-Rhyne (N.C.) 1978-79 112 4,807 42.92 Mike McRee, Lenoir-Rhyne (N.C.) 1967-70 112 4,805 42.90 Bruce Swanson, North Park (Ill.) 1965-68 180 7,720 42.89 Warner Robertson, Maryland-Eastern Shore 1968-70 131 5,578 42.58 Joe Hugon, Cameron (Okla.) 1977-79 174 7,406 42.56 SEASON AVERAGE (Qualifiers for National Report) Player, Institution, Year No. Yards Avg. Steve Ecker, Shippensburg (Pa.), 1965 32 1,570 49.06 James Wise, Tuskegee (Ala.), 1965 57 2,794 49.02 Grover Perkins, Southern (La.), 1961 21 1,016 48.38 Don Cockroft, Adams State (Colo.), 1966 36 1,728 48.00 Jack Patterson, William Jewell (Mo.), 1965 29 1,377 47.50 Alfred Holmes, Elizabeth City State (N.C.), 1974 59 2,762 46.81 Patrick Bannister, North Greenville (S.C.), 1998 46 2,150 46.74 Mike Coulton, La Verne (Calif.), 1969 60 2,797 46.62 Don Skopinski, California State (Pa.), 1958 25 1,165 46.60 Valrie Erskine, Alabama A&M, 1966 36 1,672 46.44 ANNUAL PUNTING CHAMPIONS Year Player, Institution No. Yards Avg. 1952 Virg Stan, Western State (Colo.) 37 1,622 43.8 1953 Ray Dunbar, Arkansas Teachers 36 1,603 44.5 1954 Dick Burns, William Jewell (Mo.) 32 1,283 40.1 1955 Don Baker, North Texas State 30 1,349 45.0 1956 Marion Zody, Ashland (Ohio) 34 1,475 43.4 1957 Lawson Persley, Mississippi Vocational 37 1,658 44.8 1958 Don Skopinski, California State (Pa.) 25 1,165 46.6 1959 Willis Young, Bethany (W.Va.) 28 1,246 44.5 1960 Don Morstein, Western Montana 20 914 45.7 1961 Grover Perkins, Southern (La.) 21 1,016 48.4 1962 Ron Crouse, Catawba (N.C.) 36 1,615 44.9 1963 Steve Bailey, Kentucky State 39 1,747 44.8 1964 Jerome Bell, Central State (Okla.) 28 1,278 45.5 1965 Steve Ecker, Shippensburg (Pa.) 32 1,570 49.1 1966 Don Cockroft, Adams State (Colo.) 36 1,728 48.0 1967 Gary Lloyd, California Lutheran 27 1,252 46.3
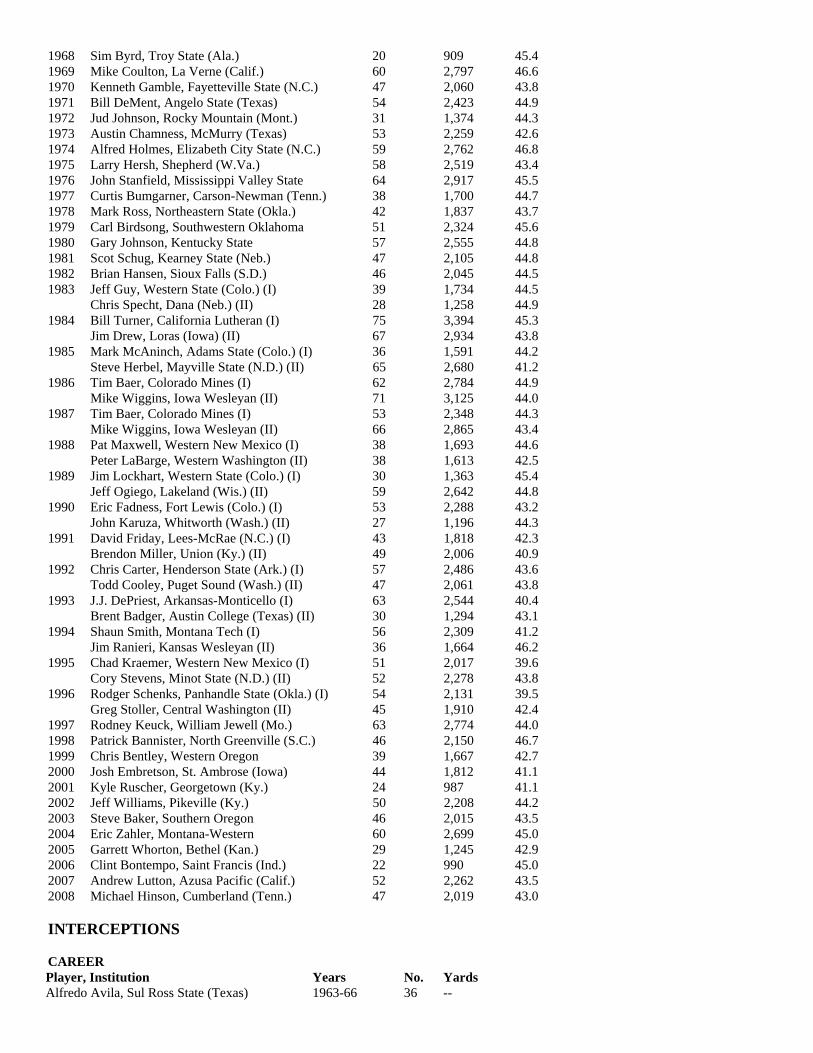
1968 Sim Byrd, Troy State (Ala.) 20 909 45.4 1969 Mike Coulton, La Verne (Calif.) 60 2,797 46.6 1970 Kenneth Gamble, Fayetteville State (N.C.) 47 2,060 43.8 1971 Bill DeMent, Angelo State (Texas) 54 2,423 44.9 1972 Jud Johnson, Rocky Mountain (Mont.) 31 1,374 44.3 1973 Austin Chamness, McMurry (Texas) 53 2,259 42.6 1974 Alfred Holmes, Elizabeth City State (N.C.) 59 2,762 46.8 1975 Larry Hersh, Shepherd (W.Va.) 58 2,519 43.4 1976 John Stanfield, Mississippi Valley State 64 2,917 45.5 1977 Curtis Bumgarner, Carson-Newman (Tenn.) 38 1,700 44.7 1978 Mark Ross, Northeastern State (Okla.) 42 1,837 43.7 1979 Carl Birdsong, Southwestern Oklahoma 51 2,324 45.6 1980 Gary Johnson, Kentucky State 57 2,555 44.8 1981 Scot Schug, Kearney State (Neb.) 47 2,105 44.8 1982 Brian Hansen, Sioux Falls (S.D.) 46 2,045 44.5 1983 Jeff Guy, Western State (Colo.) (I) 39 1,734 44.5 Chris Specht, Dana (Neb.) (II) 28 1,258 44.9 1984 Bill Turner, California Lutheran (I) 75 3,394 45.3 Jim Drew, Loras (Iowa) (II) 67 2,934 43.8 1985 Mark McAninch, Adams State (Colo.) (I) 36 1,591 44.2 Steve Herbel, Mayville State (N.D.) (II) 65 2,680 41.2 1986 Tim Baer, Colorado Mines (I) 62 2,784 44.9 Mike Wiggins, Iowa Wesleyan (II) 71 3,125 44.0 1987 Tim Baer, Colorado Mines (I) 53 2,348 44.3 Mike Wiggins, Iowa Wesleyan (II) 66 2,865 43.4 1988 Pat Maxwell, Western New Mexico (I) 38 1,693 44.6 Peter LaBarge, Western Washington (II) 38 1,613 42.5 1989 Jim Lockhart, Western State (Colo.) (I) 30 1,363 45.4 Jeff Ogiego, Lakeland (Wis.) (II) 59 2,642 44.8 1990 Eric Fadness, Fort Lewis (Colo.) (I) 53 2,288 43.2 John Karuza, Whitworth (Wash.) (II) 27 1,196 44.3 1991 David Friday, Lees-McRae (N.C.) (I) 43 1,818 42.3 Brendon Miller, Union (Ky.) (II) 49 2,006 40.9 1992 Chris Carter, Henderson State (Ark.) (I) 57 2,486 43.6 Todd Cooley, Puget Sound (Wash.) (II) 47 2,061 43.8 1993 J.J. DePriest, Arkansas-Monticello (I) 63 2,544 40.4 Brent Badger, Austin College (Texas) (II) 30 1,294 43.1 1994 Shaun Smith, Montana Tech (I) 56 2,309 41.2 Jim Ranieri, Kansas Wesleyan (II) 36 1,664 46.2 1995 Chad Kraemer, Western New Mexico (I) 51 2,017 39.6 Cory Stevens, Minot State (N.D.) (II) 52 2,278 43.8 1996 Rodger Schenks, Panhandle State (Okla.) (I) 54 2,131 39.5 Greg Stoller, Central Washington (II) 45 1,910 42.4 1997 Rodney Keuck, William Jewell (Mo.) 63 2,774 44.0 1998 Patrick Bannister, North Greenville (S.C.) 46 2,150 46.7 1999 Chris Bentley, Western Oregon 39 1,667 42.7 2000 Josh Embretson, St. Ambrose (Iowa) 44 1,812 41.1 2001 Kyle Ruscher, Georgetown (Ky.) 24 987 41.1 2002 Jeff Williams, Pikeville (Ky.) 50 2,208 44.2 2003 Steve Baker, Southern Oregon 46 2,015 43.5 2004 Eric Zahler, Montana-Western 60 2,699 45.0 2005 Garrett Whorton, Bethel (Kan.) 29 1,245 42.9 2006 Clint Bontempo, Saint Francis (Ind.) 22 990 45.0 2007 Andrew Lutton, Azusa Pacific (Calif.) 52 2,262 43.5 2008 Michael Hinson, Cumberland (Tenn.) 47 2,019 43.0 INTERCEPTIONS CAREER Player, Institution Years No. Yards Alfredo Avila, Sul Ross State (Texas) 1963-66 36 --
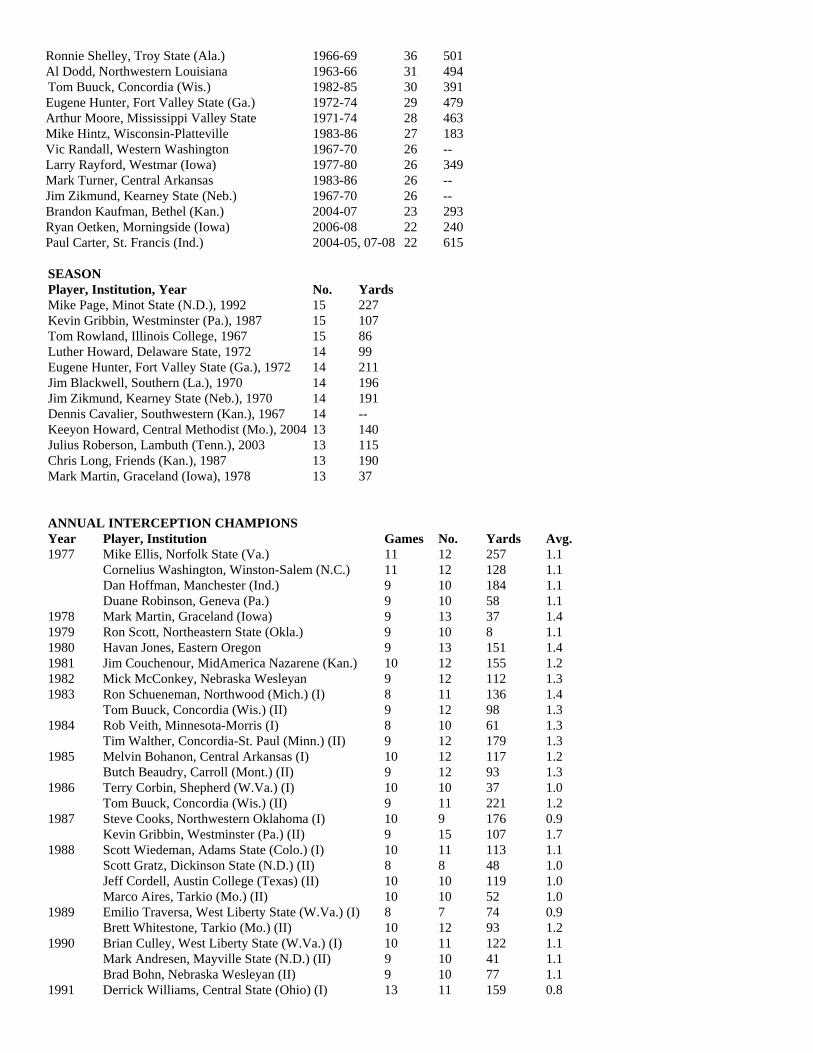
Ronnie Shelley, Troy State (Ala.) 1966-69 36 501 Al Dodd, Northwestern Louisiana 1963-66 31 494 Tom Buuck, Concordia (Wis.) 1982-85 30 391 Eugene Hunter, Fort Valley State (Ga.) 1972-74 29 479 Arthur Moore, Mississippi Valley State 1971-74 28 463 Mike Hintz, Wisconsin-Platteville 1983-86 27 183 Vic Randall, Western Washington 1967-70 26 -- Larry Rayford, Westmar (Iowa) 1977-80 26 349 Mark Turner, Central Arkansas 1983-86 26 -- Jim Zikmund, Kearney State (Neb.) 1967-70 26 -- Brandon Kaufman, Bethel (Kan.) 2004-07 23 293 Ryan Oetken, Morningside (Iowa) 2006-08 22 240 Paul Carter, St. Francis (Ind.) 2004-05, 07-08 22 615 SEASON Player, Institution, Year No. Yards Mike Page, Minot State (N.D.), 1992 15 227 Kevin Gribbin, Westminster (Pa.), 1987 15 107 Tom Rowland, Illinois College, 1967 15 86 Luther Howard, Delaware State, 1972 14 99 Eugene Hunter, Fort Valley State (Ga.), 1972 14 211 Jim Blackwell, Southern (La.), 1970 14 196 Jim Zikmund, Kearney State (Neb.), 1970 14 191 Dennis Cavalier, Southwestern (Kan.), 1967 14 -- Keeyon Howard, Central Methodist (Mo.), 2004 13 140 Julius Roberson, Lambuth (Tenn.), 2003 13 115 Chris Long, Friends (Kan.), 1987 13 190 Mark Martin, Graceland (Iowa), 1978 13 37 ANNUAL INTERCEPTION CHAMPIONS Year Player, Institution Games No. Yards Avg. 1977 Mike Ellis, Norfolk State (Va.) 11 12 257 1.1 Cornelius Washington, Winston-Salem (N.C.) 11 12 128 1.1 Dan Hoffman, Manchester (Ind.) 9 10 184 1.1 Duane Robinson, Geneva (Pa.) 9 10 58 1.1 1978 Mark Martin, Graceland (Iowa) 9 13 37 1.4 1979 Ron Scott, Northeastern State (Okla.) 9 10 8 1.1 1980 Havan Jones, Eastern Oregon 9 13 151 1.4 1981 Jim Couchenour, MidAmerica Nazarene (Kan.) 10 12 155 1.2 1982 Mick McConkey, Nebraska Wesleyan 9 12 112 1.3 1983 Ron Schueneman, Northwood (Mich.) (I) 8 11 136 1.4 Tom Buuck, Concordia (Wis.) (II) 9 12 98 1.3 1984 Rob Veith, Minnesota-Morris (I) 8 10 61 1.3 Tim Walther, Concordia-St. Paul (Minn.) (II) 9 12 179 1.3 1985 Melvin Bohanon, Central Arkansas (I) 10 12 117 1.2 Butch Beaudry, Carroll (Mont.) (II) 9 12 93 1.3 1986 Terry Corbin, Shepherd (W.Va.) (I) 10 10 37 1.0 Tom Buuck, Concordia (Wis.) (II) 9 11 221 1.2 1987 Steve Cooks, Northwestern Oklahoma (I) 10 9 176 0.9 Kevin Gribbin, Westminster (Pa.) (II) 9 15 107 1.7 1988 Scott Wiedeman, Adams State (Colo.) (I) 10 11 113 1.1 Scott Gratz, Dickinson State (N.D.) (II) 8 8 48 1.0 Jeff Cordell, Austin College (Texas) (II) 10 10 119 1.0 Marco Aires, Tarkio (Mo.) (II) 10 10 52 1.0 1989 Emilio Traversa, West Liberty State (W.Va.) (I) 8 7 74 0.9 Brett Whitestone, Tarkio (Mo.) (II) 10 12 93 1.2 1990 Brian Culley, West Liberty State (W.Va.) (I) 10 11 122 1.1 Mark Andresen, Mayville State (N.D.) (II) 9 10 41 1.1 Brad Bohn, Nebraska Wesleyan (II) 9 10 77 1.1 1991 Derrick Williams, Central State (Ohio) (I) 13 11 159 0.8
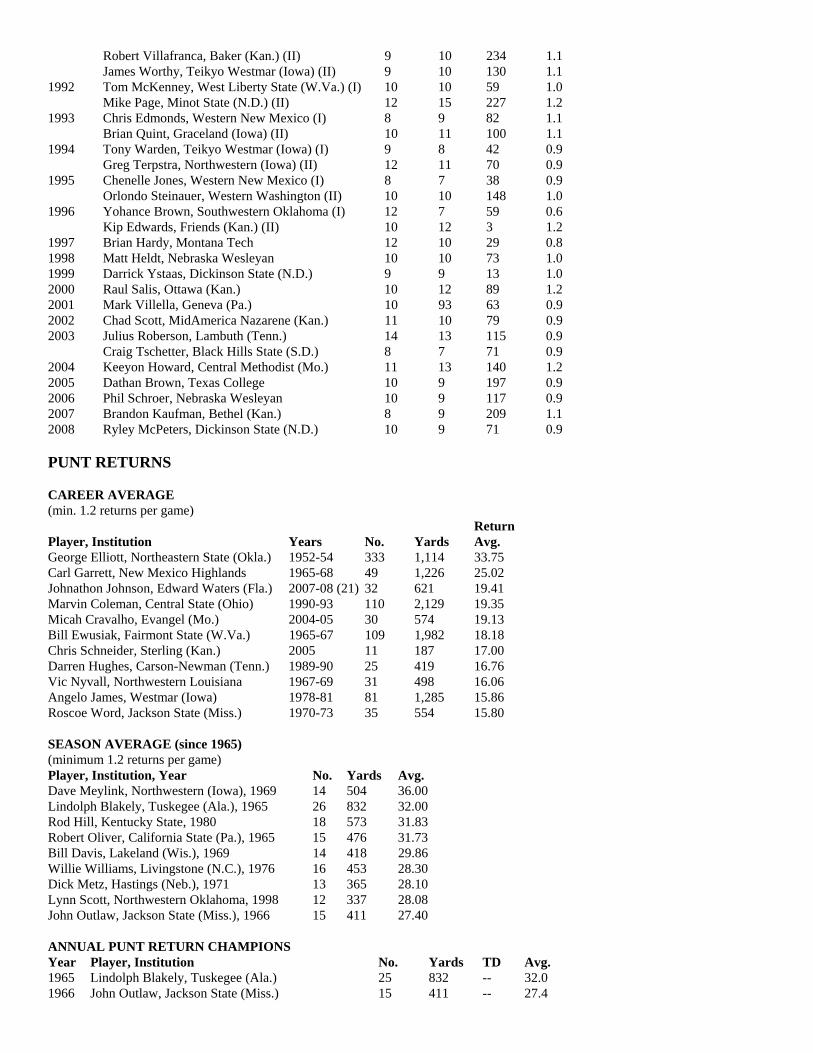
Robert Villafranca, Baker (Kan.) (II) 9 10 234 1.1 James Worthy, Teikyo Westmar (Iowa) (II) 9 10 130 1.1 1992 Tom McKenney, West Liberty State (W.Va.) (I) 10 10 59 1.0 Mike Page, Minot State (N.D.) (II) 12 15 227 1.2 1993 Chris Edmonds, Western New Mexico (I) 8 9 82 1.1 Brian Quint, Graceland (Iowa) (II) 10 11 100 1.1 1994 Tony Warden, Teikyo Westmar (Iowa) (I) 9 8 42 0.9 Greg Terpstra, Northwestern (Iowa) (II) 12 11 70 0.9 1995 Chenelle Jones, Western New Mexico (I) 8 7 38 0.9 Orlondo Steinauer, Western Washington (II) 10 10 148 1.0 1996 Yohance Brown, Southwestern Oklahoma (I) 12 7 59 0.6 Kip Edwards, Friends (Kan.) (II) 10 12 3 1.2 1997 Brian Hardy, Montana Tech 12 10 29 0.8 1998 Matt Heldt, Nebraska Wesleyan 10 10 73 1.0 1999 Darrick Ystaas, Dickinson State (N.D.) 9 9 13 1.0 2000 Raul Salis, Ottawa (Kan.) 10 12 89 1.2 2001 Mark Villella, Geneva (Pa.) 10 93 63 0.9 2002 Chad Scott, MidAmerica Nazarene (Kan.) 11 10 79 0.9 2003 Julius Roberson, Lambuth (Tenn.) 14 13 115 0.9 Craig Tschetter, Black Hills State (S.D.) 8 7 71 0.9 2004 Keeyon Howard, Central Methodist (Mo.) 11 13 140 1.2 2005 Dathan Brown, Texas College 10 9 197 0.9 2006 Phil Schroer, Nebraska Wesleyan 10 9 117 0.9 2007 Brandon Kaufman, Bethel (Kan.) 8 9 209 1.1 2008 Ryley McPeters, Dickinson State (N.D.) 10 9 71 0.9 PUNT RETURNS CAREER AVERAGE (min. 1.2 returns per game) Return Player, Institution Years No. Yards Avg. George Elliott, Northeastern State (Okla.) 1952-54 333 1,114 33.75 Carl Garrett, New Mexico Highlands 1965-68 49 1,226 25.02 Johnathon Johnson, Edward Waters (Fla.) 2007-08 (21) 32 621 19.41 Marvin Coleman, Central State (Ohio) 1990-93 110 2,129 19.35 Micah Cravalho, Evangel (Mo.) 2004-05 30 574 19.13 Bill Ewusiak, Fairmont State (W.Va.) 1965-67 109 1,982 18.18 Chris Schneider, Sterling (Kan.) 2005 11 187 17.00 Darren Hughes, Carson-Newman (Tenn.) 1989-90 25 419 16.76 Vic Nyvall, Northwestern Louisiana 1967-69 31 498 16.06 Angelo James, Westmar (Iowa) 1978-81 81 1,285 15.86 Roscoe Word, Jackson State (Miss.) 1970-73 35 554 15.80 SEASON AVERAGE (since 1965) (minimum 1.2 returns per game) Player, Institution, Year No. Yards Avg. Dave Meylink, Northwestern (Iowa), 1969 14 504 36.00 Lindolph Blakely, Tuskegee (Ala.), 1965 26 832 32.00 Rod Hill, Kentucky State, 1980 18 573 31.83 Robert Oliver, California State (Pa.), 1965 15 476 31.73 Bill Davis, Lakeland (Wis.), 1969 14 418 29.86 Willie Williams, Livingstone (N.C.), 1976 16 453 28.30 Dick Metz, Hastings (Neb.), 1971 13 365 28.10 Lynn Scott, Northwestern Oklahoma, 1998 12 337 28.08 John Outlaw, Jackson State (Miss.), 1966 15 411 27.40 ANNUAL PUNT RETURN CHAMPIONS Year Player, Institution No. Yards TD Avg. 1965 Lindolph Blakely, Tuskegee (Ala.) 25 832 -- 32.0 1966 John Outlaw, Jackson State (Miss.) 15 411 -- 27.4
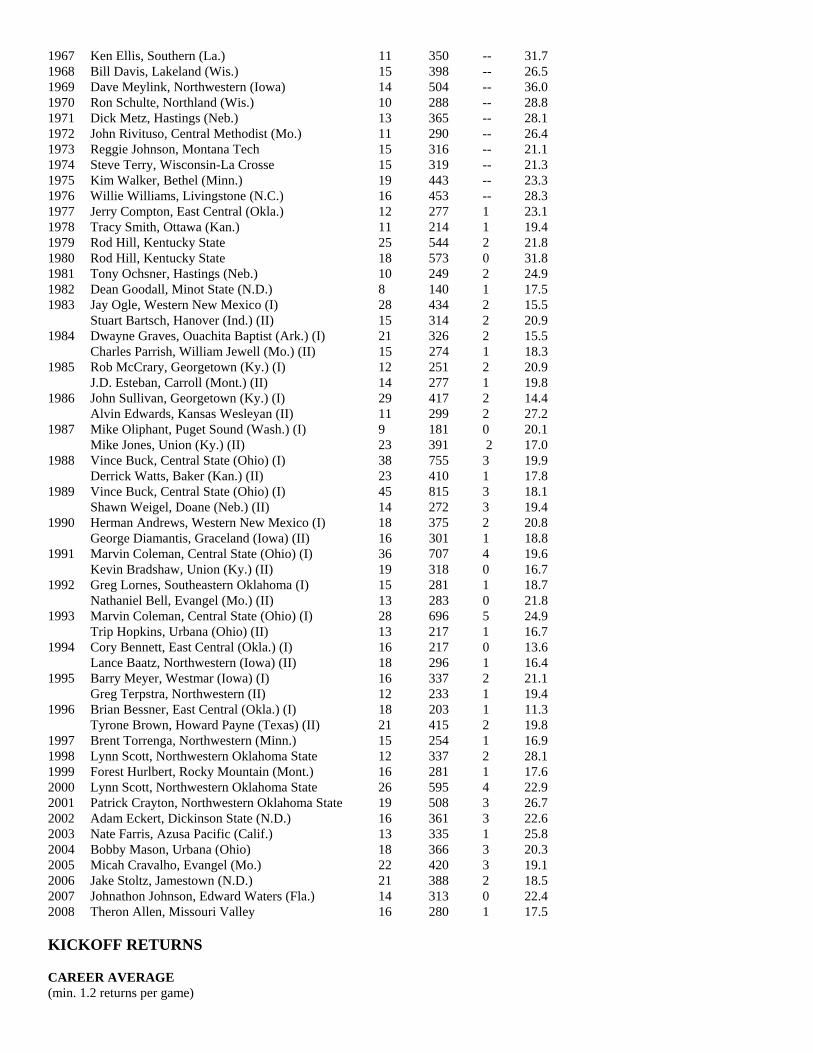
1967 Ken Ellis, Southern (La.) 11 350 -- 31.7 1968 Bill Davis, Lakeland (Wis.) 15 398 -- 26.5 1969 Dave Meylink, Northwestern (Iowa) 14 504 -- 36.0 1970 Ron Schulte, Northland (Wis.) 10 288 -- 28.8 1971 Dick Metz, Hastings (Neb.) 13 365 -- 28.1 1972 John Rivituso, Central Methodist (Mo.) 11 290 -- 26.4 1973 Reggie Johnson, Montana Tech 15 316 -- 21.1 1974 Steve Terry, Wisconsin-La Crosse 15 319 -- 21.3 1975 Kim Walker, Bethel (Minn.) 19 443 -- 23.3 1976 Willie Williams, Livingstone (N.C.) 16 453 -- 28.3 1977 Jerry Compton, East Central (Okla.) 12 277 1 23.1 1978 Tracy Smith, Ottawa (Kan.) 11 214 1 19.4 1979 Rod Hill, Kentucky State 25 544 2 21.8 1980 Rod Hill, Kentucky State 18 573 0 31.8 1981 Tony Ochsner, Hastings (Neb.) 10 249 2 24.9 1982 Dean Goodall, Minot State (N.D.) 8 140 1 17.5 1983 Jay Ogle, Western New Mexico (I) 28 434 2 15.5 Stuart Bartsch, Hanover (Ind.) (II) 15 314 2 20.9 1984 Dwayne Graves, Ouachita Baptist (Ark.) (I) 21 326 2 15.5 Charles Parrish, William Jewell (Mo.) (II) 15 274 1 18.3 1985 Rob McCrary, Georgetown (Ky.) (I) 12 251 2 20.9 J.D. Esteban, Carroll (Mont.) (II) 14 277 1 19.8 1986 John Sullivan, Georgetown (Ky.) (I) 29 417 2 14.4 Alvin Edwards, Kansas Wesleyan (II) 11 299 2 27.2 1987 Mike Oliphant, Puget Sound (Wash.) (I) 9 181 0 20.1 Mike Jones, Union (Ky.) (II) 23 391 2 17.0 1988 Vince Buck, Central State (Ohio) (I) 38 755 3 19.9 Derrick Watts, Baker (Kan.) (II) 23 410 1 17.8 1989 Vince Buck, Central State (Ohio) (I) 45 815 3 18.1 Shawn Weigel, Doane (Neb.) (II) 14 272 3 19.4 1990 Herman Andrews, Western New Mexico (I) 18 375 2 20.8 George Diamantis, Graceland (Iowa) (II) 16 301 1 18.8 1991 Marvin Coleman, Central State (Ohio) (I) 36 707 4 19.6 Kevin Bradshaw, Union (Ky.) (II) 19 318 0 16.7 1992 Greg Lornes, Southeastern Oklahoma (I) 15 281 1 18.7 Nathaniel Bell, Evangel (Mo.) (II) 13 283 0 21.8 1993 Marvin Coleman, Central State (Ohio) (I) 28 696 5 24.9 Trip Hopkins, Urbana (Ohio) (II) 13 217 1 16.7 1994 Cory Bennett, East Central (Okla.) (I) 16 217 0 13.6 Lance Baatz, Northwestern (Iowa) (II) 18 296 1 16.4 1995 Barry Meyer, Westmar (Iowa) (I) 16 337 2 21.1 Greg Terpstra, Northwestern (II) 12 233 1 19.4 1996 Brian Bessner, East Central (Okla.) (I) 18 203 1 11.3 Tyrone Brown, Howard Payne (Texas) (II) 21 415 2 19.8 1997 Brent Torrenga, Northwestern (Minn.) 15 254 1 16.9 1998 Lynn Scott, Northwestern Oklahoma State 12 337 2 28.1 1999 Forest Hurlbert, Rocky Mountain (Mont.) 16 281 1 17.6 2000 Lynn Scott, Northwestern Oklahoma State 26 595 4 22.9 2001 Patrick Crayton, Northwestern Oklahoma State 19 508 3 26.7 2002 Adam Eckert, Dickinson State (N.D.) 16 361 3 22.6 2003 Nate Farris, Azusa Pacific (Calif.) 13 335 1 25.8 2004 Bobby Mason, Urbana (Ohio) 18 366 3 20.3 2005 Micah Cravalho, Evangel (Mo.) 22 420 3 19.1 2006 Jake Stoltz, Jamestown (N.D.) 21 388 2 18.5 2007 Johnathon Johnson, Edward Waters (Fla.) 14 313 0 22.4 2008 Theron Allen, Missouri Valley 16 280 1 17.5 KICKOFF RETURNS CAREER AVERAGE (min. 1.2 returns per game)
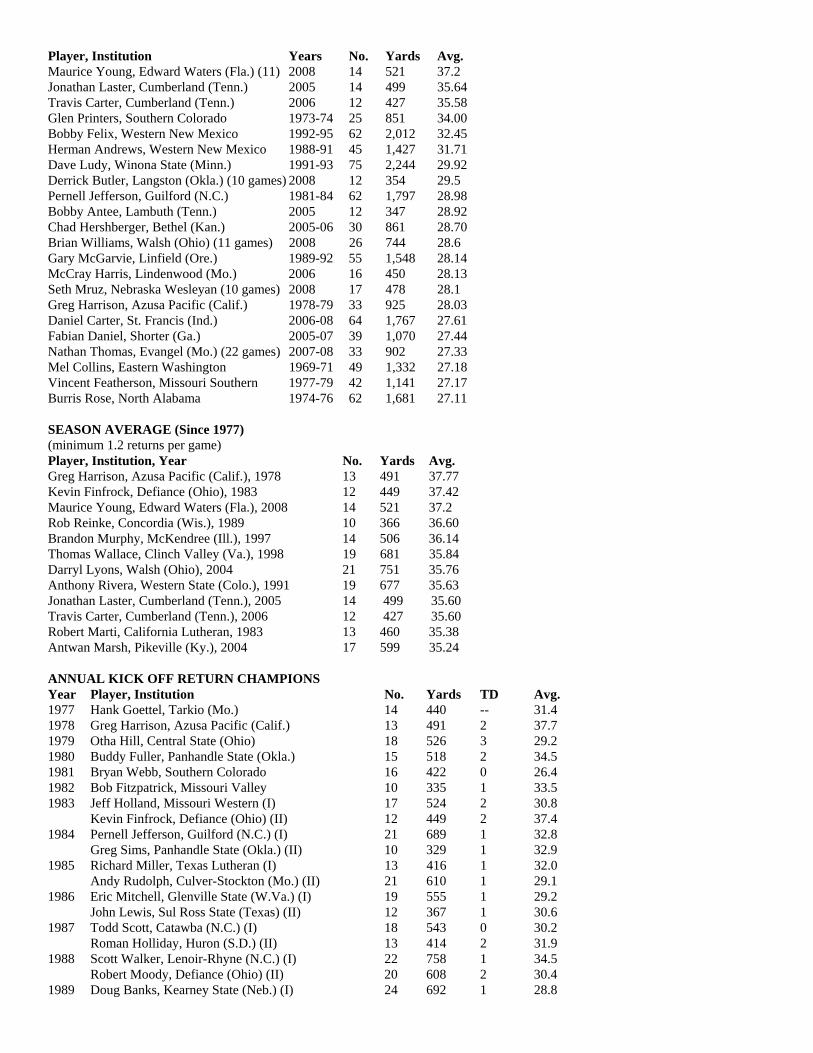
Player, Institution Years No. Yards Avg. Maurice Young, Edward Waters (Fla.) (11) 2008 14 521 37.2 Jonathan Laster, Cumberland (Tenn.) 2005 14 499 35.64 Travis Carter, Cumberland (Tenn.) 2006 12 427 35.58 Glen Printers, Southern Colorado 1973-74 25 851 34.00 Bobby Felix, Western New Mexico 1992-95 62 2,012 32.45 Herman Andrews, Western New Mexico 1988-91 45 1,427 31.71 Dave Ludy, Winona State (Minn.) 1991-93 75 2,244 29.92 Derrick Butler, Langston (Okla.) (10 games) 2008 12 354 29.5 Pernell Jefferson, Guilford (N.C.) 1981-84 62 1,797 28.98 Bobby Antee, Lambuth (Tenn.) 2005 12 347 28.92 Chad Hershberger, Bethel (Kan.) 2005-06 30 861 28.70 Brian Williams, Walsh (Ohio) (11 games) 2008 26 744 28.6 Gary McGarvie, Linfield (Ore.) 1989-92 55 1,548 28.14 McCray Harris, Lindenwood (Mo.) 2006 16 450 28.13 Seth Mruz, Nebraska Wesleyan (10 games) 2008 17 478 28.1 Greg Harrison, Azusa Pacific (Calif.) 1978-79 33 925 28.03 Daniel Carter, St. Francis (Ind.) 2006-08 64 1,767 27.61 Fabian Daniel, Shorter (Ga.) 2005-07 39 1,070 27.44 Nathan Thomas, Evangel (Mo.) (22 games) 2007-08 33 902 27.33 Mel Collins, Eastern Washington 1969-71 49 1,332 27.18 Vincent Featherson, Missouri Southern 1977-79 42 1,141 27.17 Burris Rose, North Alabama 1974-76 62 1,681 27.11 SEASON AVERAGE (Since 1977) (minimum 1.2 returns per game) Player, Institution, Year No. Yards Avg. Greg Harrison, Azusa Pacific (Calif.), 1978 13 491 37.77 Kevin Finfrock, Defiance (Ohio), 1983 12 449 37.42 Maurice Young, Edward Waters (Fla.), 2008 14 521 37.2 Rob Reinke, Concordia (Wis.), 1989 10 366 36.60 Brandon Murphy, McKendree (Ill.), 1997 14 506 36.14 Thomas Wallace, Clinch Valley (Va.), 1998 19 681 35.84 Darryl Lyons, Walsh (Ohio), 2004 21 751 35.76 Anthony Rivera, Western State (Colo.), 1991 19 677 35.63 Jonathan Laster, Cumberland (Tenn.), 2005 14 499 35.60 Travis Carter, Cumberland (Tenn.), 2006 12 427 35.60 Robert Marti, California Lutheran, 1983 13 460 35.38 Antwan Marsh, Pikeville (Ky.), 2004 17 599 35.24 ANNUAL KICK OFF RETURN CHAMPIONS Year Player, Institution No. Yards TD Avg. 1977 Hank Goettel, Tarkio (Mo.) 14 440 -- 31.4 1978 Greg Harrison, Azusa Pacific (Calif.) 13 491 2 37.7 1979 Otha Hill, Central State (Ohio) 18 526 3 29.2 1980 Buddy Fuller, Panhandle State (Okla.) 15 518 2 34.5 1981 Bryan Webb, Southern Colorado 16 422 0 26.4 1982 Bob Fitzpatrick, Missouri Valley 10 335 1 33.5 1983 Jeff Holland, Missouri Western (I) 17 524 2 30.8 Kevin Finfrock, Defiance (Ohio) (II) 12 449 2 37.4 1984 Pernell Jefferson, Guilford (N.C.) (I) 21 689 1 32.8 Greg Sims, Panhandle State (Okla.) (II) 10 329 1 32.9 1985 Richard Miller, Texas Lutheran (I) 13 416 1 32.0 Andy Rudolph, Culver-Stockton (Mo.) (II) 21 610 1 29.1 1986 Eric Mitchell, Glenville State (W.Va.) (I) 19 555 1 29.2 John Lewis, Sul Ross State (Texas) (II) 12 367 1 30.6 1987 Todd Scott, Catawba (N.C.) (I) 18 543 0 30.2 Roman Holliday, Huron (S.D.) (II) 13 414 2 31.9 1988 Scott Walker, Lenoir-Rhyne (N.C.) (I) 22 758 1 34.5 Robert Moody, Defiance (Ohio) (II) 20 608 2 30.4 1989 Doug Banks, Kearney State (Neb.) (I) 24 692 1 28.8
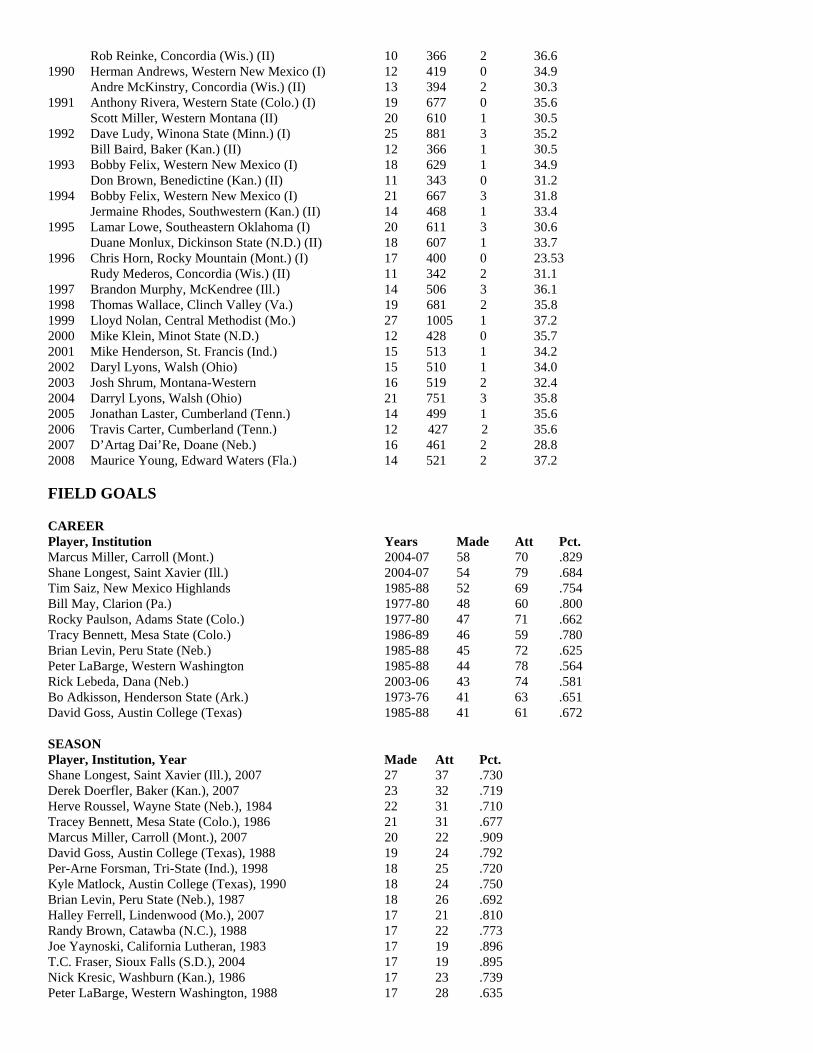
Rob Reinke, Concordia (Wis.) (II) 10 366 2 36.6 1990 Herman Andrews, Western New Mexico (I) 12 419 0 34.9 Andre McKinstry, Concordia (Wis.) (II) 13 394 2 30.3 1991 Anthony Rivera, Western State (Colo.) (I) 19 677 0 35.6 Scott Miller, Western Montana (II) 20 610 1 30.5 1992 Dave Ludy, Winona State (Minn.) (I) 25 881 3 35.2 Bill Baird, Baker (Kan.) (II) 12 366 1 30.5 1993 Bobby Felix, Western New Mexico (I) 18 629 1 34.9 Don Brown, Benedictine (Kan.) (II) 11 343 0 31.2 1994 Bobby Felix, Western New Mexico (I) 21 667 3 31.8 Jermaine Rhodes, Southwestern (Kan.) (II) 14 468 1 33.4 1995 Lamar Lowe, Southeastern Oklahoma (I) 20 611 3 30.6 Duane Monlux, Dickinson State (N.D.) (II) 18 607 1 33.7 1996 Chris Horn, Rocky Mountain (Mont.) (I) 17 400 0 23.53 Rudy Mederos, Concordia (Wis.) (II) 11 342 2 31.1 1997 Brandon Murphy, McKendree (Ill.) 14 506 3 36.1 1998 Thomas Wallace, Clinch Valley (Va.) 19 681 2 35.8 1999 Lloyd Nolan, Central Methodist (Mo.) 27 1005 1 37.2 2000 Mike Klein, Minot State (N.D.) 12 428 0 35.7 2001 Mike Henderson, St. Francis (Ind.) 15 513 1 34.2 2002 Daryl Lyons, Walsh (Ohio) 15 510 1 34.0 2003 Josh Shrum, Montana-Western 16 519 2 32.4 2004 Darryl Lyons, Walsh (Ohio) 21 751 3 35.8 2005 Jonathan Laster, Cumberland (Tenn.) 14 499 1 35.6 2006 Travis Carter, Cumberland (Tenn.) 12 427 2 35.6 2007 D’Artag Dai’Re, Doane (Neb.) 16 461 2 28.8 2008 Maurice Young, Edward Waters (Fla.) 14 521 2 37.2 FIELD GOALS CAREER Player, Institution Years Made Att Pct. Marcus Miller, Carroll (Mont.) 2004-07 58 70 .829 Shane Longest, Saint Xavier (Ill.) 2004-07 54 79 .684 Tim Saiz, New Mexico Highlands 1985-88 52 69 .754 Bill May, Clarion (Pa.) 1977-80 48 60 .800 Rocky Paulson, Adams State (Colo.) 1977-80 47 71 .662 Tracy Bennett, Mesa State (Colo.) 1986-89 46 59 .780 Brian Levin, Peru State (Neb.) 1985-88 45 72 .625 Peter LaBarge, Western Washington 1985-88 44 78 .564 Rick Lebeda, Dana (Neb.) 2003-06 43 74 .581 Bo Adkisson, Henderson State (Ark.) 1973-76 41 63 .651 David Goss, Austin College (Texas) 1985-88 41 61 .672 SEASON Player, Institution, Year Made Att Pct. Shane Longest, Saint Xavier (Ill.), 2007 27 37 .730 Derek Doerfler, Baker (Kan.), 2007 23 32 .719 Herve Roussel, Wayne State (Neb.), 1984 22 31 .710 Tracey Bennett, Mesa State (Colo.), 1986 21 31 .677 Marcus Miller, Carroll (Mont.), 2007 20 22 .909 David Goss, Austin College (Texas), 1988 19 24 .792 Per-Arne Forsman, Tri-State (Ind.), 1998 18 25 .720 Kyle Matlock, Austin College (Texas), 1990 18 24 .750 Brian Levin, Peru State (Neb.), 1987 18 26 .692 Halley Ferrell, Lindenwood (Mo.), 2007 17 21 .810 Randy Brown, Catawba (N.C.), 1988 17 22 .773 Joe Yaynoski, California Lutheran, 1983 17 19 .896 T.C. Fraser, Sioux Falls (S.D.), 2004 17 19 .895 Nick Kresic, Washburn (Kan.), 1986 17 23 .739 Peter LaBarge, Western Washington, 1988 17 28 .635
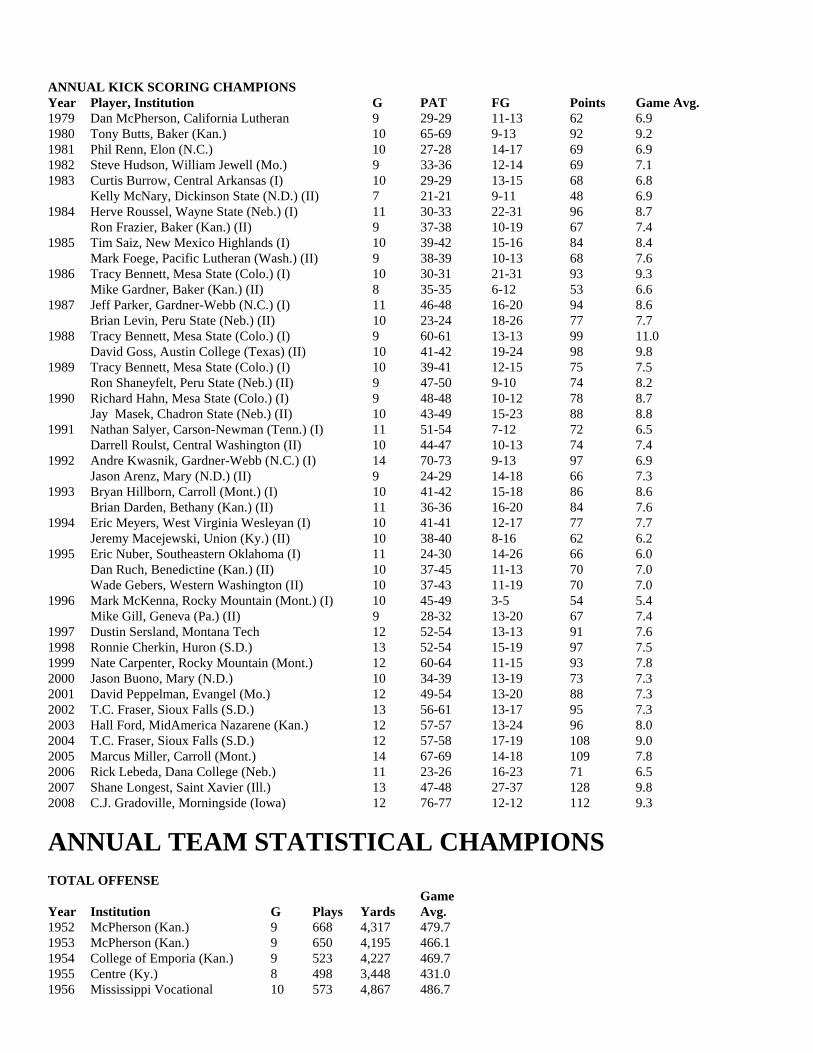
ANNUAL KICK SCORING CHAMPIONS Year Player, Institution G PAT FG Points Game Avg. 1979 Dan McPherson, California Lutheran 9 29-29 11-13 62 6.9 1980 Tony Butts, Baker (Kan.) 10 65-69 9-13 92 9.2 1981 Phil Renn, Elon (N.C.) 10 27-28 14-17 69 6.9 1982 Steve Hudson, William Jewell (Mo.) 9 33-36 12-14 69 7.1 1983 Curtis Burrow, Central Arkansas (I) 10 29-29 13-15 68 6.8 Kelly McNary, Dickinson State (N.D.) (II) 7 21-21 9-11 48 6.9 1984 Herve Roussel, Wayne State (Neb.) (I) 11 30-33 22-31 96 8.7 Ron Frazier, Baker (Kan.) (II) 9 37-38 10-19 67 7.4 1985 Tim Saiz, New Mexico Highlands (I) 10 39-42 15-16 84 8.4 Mark Foege, Pacific Lutheran (Wash.) (II) 9 38-39 10-13 68 7.6 1986 Tracy Bennett, Mesa State (Colo.) (I) 10 30-31 21-31 93 9.3 Mike Gardner, Baker (Kan.) (II) 8 35-35 6-12 53 6.6 1987 Jeff Parker, Gardner-Webb (N.C.) (I) 11 46-48 16-20 94 8.6 Brian Levin, Peru State (Neb.) (II) 10 23-24 18-26 77 7.7 1988 Tracy Bennett, Mesa State (Colo.) (I) 9 60-61 13-13 99 11.0 David Goss, Austin College (Texas) (II) 10 41-42 19-24 98 9.8 1989 Tracy Bennett, Mesa State (Colo.) (I) 10 39-41 12-15 75 7.5 Ron Shaneyfelt, Peru State (Neb.) (II) 9 47-50 9-10 74 8.2 1990 Richard Hahn, Mesa State (Colo.) (I) 9 48-48 10-12 78 8.7 Jay Masek, Chadron State (Neb.) (II) 10 43-49 15-23 88 8.8 1991 Nathan Salyer, Carson-Newman (Tenn.) (I) 11 51-54 7-12 72 6.5 Darrell Roulst, Central Washington (II) 10 44-47 10-13 74 7.4 1992 Andre Kwasnik, Gardner-Webb (N.C.) (I) 14 70-73 9-13 97 6.9 Jason Arenz, Mary (N.D.) (II) 9 24-29 14-18 66 7.3 1993 Bryan Hillborn, Carroll (Mont.) (I) 10 41-42 15-18 86 8.6 Brian Darden, Bethany (Kan.) (II) 11 36-36 16-20 84 7.6 1994 Eric Meyers, West Virginia Wesleyan (I) 10 41-41 12-17 77 7.7 Jeremy Macejewski, Union (Ky.) (II) 10 38-40 8-16 62 6.2 1995 Eric Nuber, Southeastern Oklahoma (I) 11 24-30 14-26 66 6.0 Dan Ruch, Benedictine (Kan.) (II) 10 37-45 11-13 70 7.0 Wade Gebers, Western Washington (II) 10 37-43 11-19 70 7.0 1996 Mark McKenna, Rocky Mountain (Mont.) (I) 10 45-49 3-5 54 5.4 Mike Gill, Geneva (Pa.) (II) 9 28-32 13-20 67 7.4 1997 Dustin Sersland, Montana Tech 12 52-54 13-13 91 7.6 1998 Ronnie Cherkin, Huron (S.D.) 13 52-54 15-19 97 7.5 1999 Nate Carpenter, Rocky Mountain (Mont.) 12 60-64 11-15 93 7.8 2000 Jason Buono, Mary (N.D.) 10 34-39 13-19 73 7.3 2001 David Peppelman, Evangel (Mo.) 12 49-54 13-20 88 7.3 2002 T.C. Fraser, Sioux Falls (S.D.) 13 56-61 13-17 95 7.3 2003 Hall Ford, MidAmerica Nazarene (Kan.) 12 57-57 13-24 96 8.0 2004 T.C. Fraser, Sioux Falls (S.D.) 12 57-58 17-19 108 9.0 2005 Marcus Miller, Carroll (Mont.) 14 67-69 14-18 109 7.8 2006 Rick Lebeda, Dana College (Neb.) 11 23-26 16-23 71 6.5 2007 Shane Longest, Saint Xavier (Ill.) 13 47-48 27-37 128 9.8 2008 C.J. Gradoville, Morningside (Iowa) 12 76-77 12-12 112 9.3
ANNUAL TEAM STATISTICAL CHAMPIONS TOTAL OFFENSE Game Year Institution G Plays Yards Avg. 1952 McPherson (Kan.) 9 668 4,317 479.7 1953 McPherson (Kan.) 9 650 4,195 466.1 1954 College of Emporia (Kan.) 9 523 4,227 469.7 1955 Centre (Ky.) 8 498 3,448 431.0 1956 Mississippi Vocational 10 573 4,867 486.7
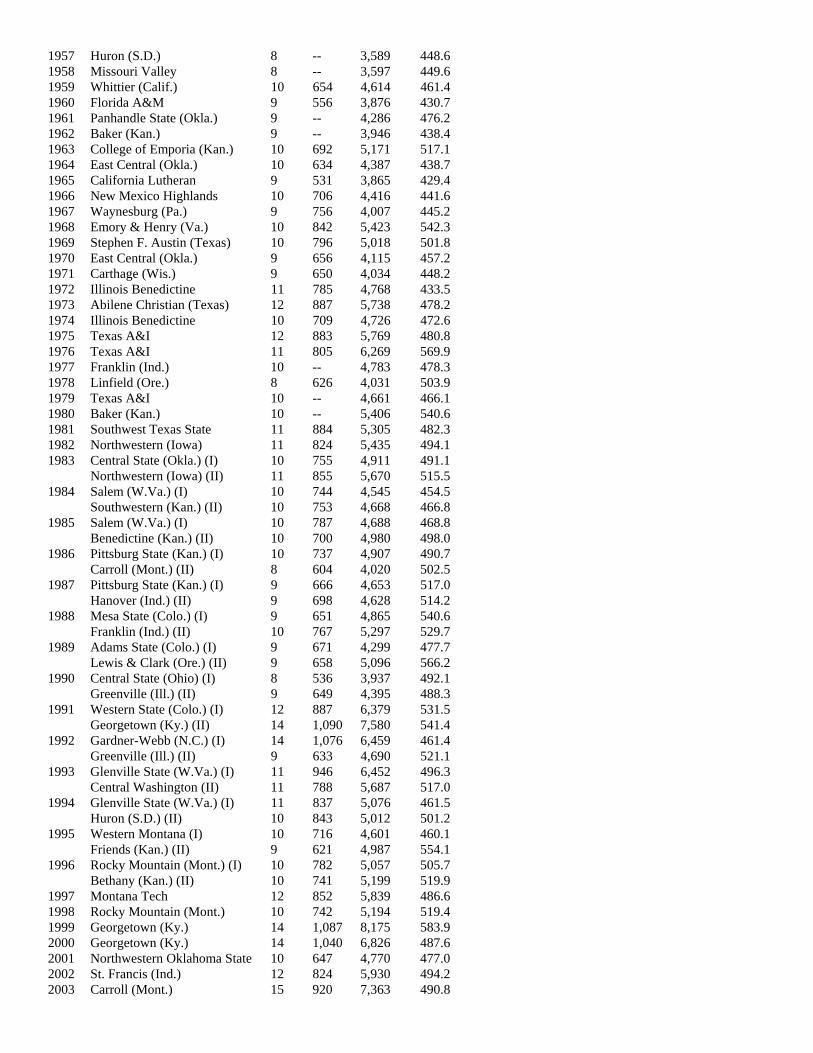
1957 Huron (S.D.) 8 -- 3,589 448.6 1958 Missouri Valley 8 -- 3,597 449.6 1959 Whittier (Calif.) 10 654 4,614 461.4 1960 Florida A&M 9 556 3,876 430.7 1961 Panhandle State (Okla.) 9 -- 4,286 476.2 1962 Baker (Kan.) 9 -- 3,946 438.4 1963 College of Emporia (Kan.) 10 692 5,171 517.1 1964 East Central (Okla.) 10 634 4,387 438.7 1965 California Lutheran 9 531 3,865 429.4 1966 New Mexico Highlands 10 706 4,416 441.6 1967 Waynesburg (Pa.) 9 756 4,007 445.2 1968 Emory & Henry (Va.) 10 842 5,423 542.3 1969 Stephen F. Austin (Texas) 10 796 5,018 501.8 1970 East Central (Okla.) 9 656 4,115 457.2 1971 Carthage (Wis.) 9 650 4,034 448.2 1972 Illinois Benedictine 11 785 4,768 433.5 1973 Abilene Christian (Texas) 12 887 5,738 478.2 1974 Illinois Benedictine 10 709 4,726 472.6 1975 Texas A&I 12 883 5,769 480.8 1976 Texas A&I 11 805 6,269 569.9 1977 Franklin (Ind.) 10 -- 4,783 478.3 1978 Linfield (Ore.) 8 626 4,031 503.9 1979 Texas A&I 10 -- 4,661 466.1 1980 Baker (Kan.) 10 -- 5,406 540.6 1981 Southwest Texas State 11 884 5,305 482.3 1982 Northwestern (Iowa) 11 824 5,435 494.1 1983 Central State (Okla.) (I) 10 755 4,911 491.1 Northwestern (Iowa) (II) 11 855 5,670 515.5 1984 Salem (W.Va.) (I) 10 744 4,545 454.5 Southwestern (Kan.) (II) 10 753 4,668 466.8 1985 Salem (W.Va.) (I) 10 787 4,688 468.8 Benedictine (Kan.) (II) 10 700 4,980 498.0 1986 Pittsburg State (Kan.) (I) 10 737 4,907 490.7 Carroll (Mont.) (II) 8 604 4,020 502.5 1987 Pittsburg State (Kan.) (I) 9 666 4,653 517.0 Hanover (Ind.) (II) 9 698 4,628 514.2 1988 Mesa State (Colo.) (I) 9 651 4,865 540.6 Franklin (Ind.) (II) 10 767 5,297 529.7 1989 Adams State (Colo.) (I) 9 671 4,299 477.7 Lewis & Clark (Ore.) (II) 9 658 5,096 566.2 1990 Central State (Ohio) (I) 8 536 3,937 492.1 Greenville (Ill.) (II) 9 649 4,395 488.3 1991 Western State (Colo.) (I) 12 887 6,379 531.5 Georgetown (Ky.) (II) 14 1,090 7,580 541.4 1992 Gardner-Webb (N.C.) (I) 14 1,076 6,459 461.4 Greenville (Ill.) (II) 9 633 4,690 521.1 1993 Glenville State (W.Va.) (I) 11 946 6,452 496.3 Central Washington (II) 11 788 5,687 517.0 1994 Glenville State (W.Va.) (I) 11 837 5,076 461.5 Huron (S.D.) (II) 10 843 5,012 501.2 1995 Western Montana (I) 10 716 4,601 460.1 Friends (Kan.) (II) 9 621 4,987 554.1 1996 Rocky Mountain (Mont.) (I) 10 782 5,057 505.7 Bethany (Kan.) (II) 10 741 5,199 519.9 1997 Montana Tech 12 852 5,839 486.6 1998 Rocky Mountain (Mont.) 10 742 5,194 519.4 1999 Georgetown (Ky.) 14 1,087 8,175 583.9 2000 Georgetown (Ky.) 14 1,040 6,826 487.6 2001 Northwestern Oklahoma State 10 647 4,770 477.0 2002 St. Francis (Ind.) 12 824 5,930 494.2 2003 Carroll (Mont.) 15 920 7,363 490.8
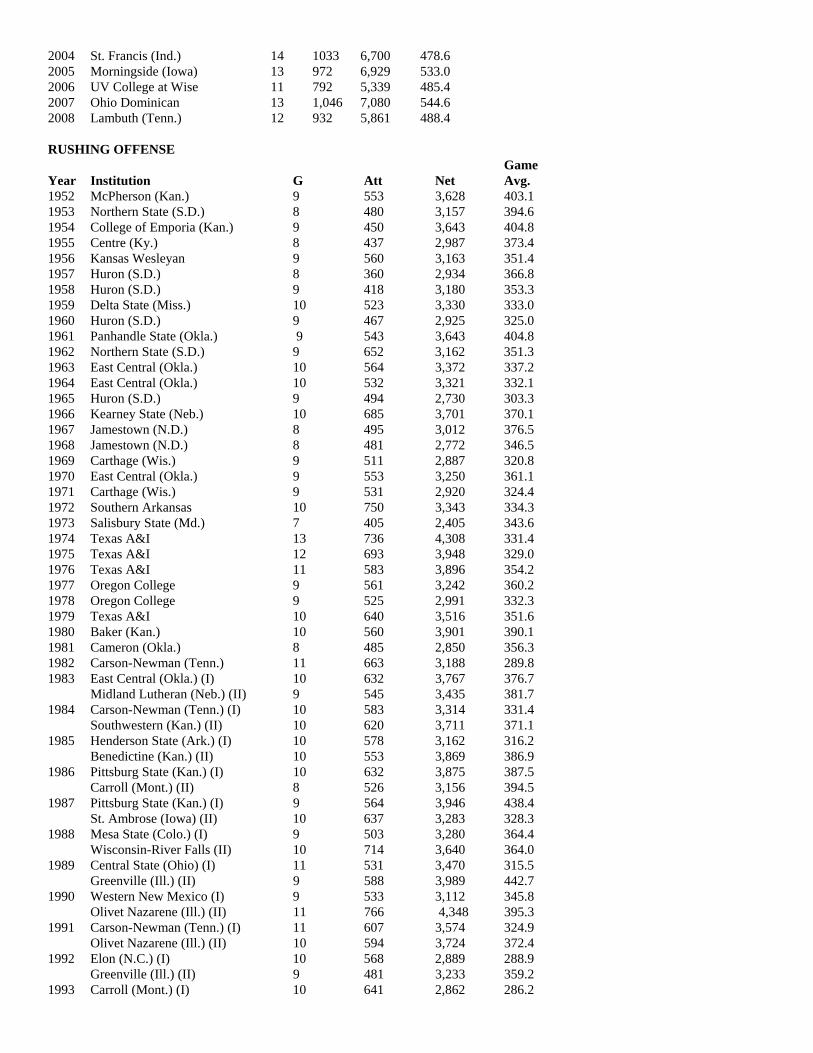
2004 St. Francis (Ind.) 14 1033 6,700 478.6 2005 Morningside (Iowa) 13 972 6,929 533.0 2006 UV College at Wise 11 792 5,339 485.4 2007 Ohio Dominican 13 1,046 7,080 544.6 2008 Lambuth (Tenn.) 12 932 5,861 488.4 RUSHING OFFENSE Game Year Institution G Att Net Avg. 1952 McPherson (Kan.) 9 553 3,628 403.1 1953 Northern State (S.D.) 8 480 3,157 394.6 1954 College of Emporia (Kan.) 9 450 3,643 404.8 1955 Centre (Ky.) 8 437 2,987 373.4 1956 Kansas Wesleyan 9 560 3,163 351.4 1957 Huron (S.D.) 8 360 2,934 366.8 1958 Huron (S.D.) 9 418 3,180 353.3 1959 Delta State (Miss.) 10 523 3,330 333.0 1960 Huron (S.D.) 9 467 2,925 325.0 1961 Panhandle State (Okla.) 9 543 3,643 404.8 1962 Northern State (S.D.) 9 652 3,162 351.3 1963 East Central (Okla.) 10 564 3,372 337.2 1964 East Central (Okla.) 10 532 3,321 332.1 1965 Huron (S.D.) 9 494 2,730 303.3 1966 Kearney State (Neb.) 10 685 3,701 370.1 1967 Jamestown (N.D.) 8 495 3,012 376.5 1968 Jamestown (N.D.) 8 481 2,772 346.5 1969 Carthage (Wis.) 9 511 2,887 320.8 1970 East Central (Okla.) 9 553 3,250 361.1 1971 Carthage (Wis.) 9 531 2,920 324.4 1972 Southern Arkansas 10 750 3,343 334.3 1973 Salisbury State (Md.) 7 405 2,405 343.6 1974 Texas A&I 13 736 4,308 331.4 1975 Texas A&I 12 693 3,948 329.0 1976 Texas A&I 11 583 3,896 354.2 1977 Oregon College 9 561 3,242 360.2 1978 Oregon College 9 525 2,991 332.3 1979 Texas A&I 10 640 3,516 351.6 1980 Baker (Kan.) 10 560 3,901 390.1 1981 Cameron (Okla.) 8 485 2,850 356.3 1982 Carson-Newman (Tenn.) 11 663 3,188 289.8 1983 East Central (Okla.) (I) 10 632 3,767 376.7 Midland Lutheran (Neb.) (II) 9 545 3,435 381.7 1984 Carson-Newman (Tenn.) (I) 10 583 3,314 331.4 Southwestern (Kan.) (II) 10 620 3,711 371.1 1985 Henderson State (Ark.) (I) 10 578 3,162 316.2 Benedictine (Kan.) (II) 10 553 3,869 386.9 1986 Pittsburg State (Kan.) (I) 10 632 3,875 387.5 Carroll (Mont.) (II) 8 526 3,156 394.5 1987 Pittsburg State (Kan.) (I) 9 564 3,946 438.4 St. Ambrose (Iowa) (II) 10 637 3,283 328.3 1988 Mesa State (Colo.) (I) 9 503 3,280 364.4 Wisconsin-River Falls (II) 10 714 3,640 364.0 1989 Central State (Ohio) (I) 11 531 3,470 315.5 Greenville (Ill.) (II) 9 588 3,989 442.7 1990 Western New Mexico (I) 9 533 3,112 345.8 Olivet Nazarene (Ill.) (II) 11 766 4,348 395.3 1991 Carson-Newman (Tenn.) (I) 11 607 3,574 324.9 Olivet Nazarene (Ill.) (II) 10 594 3,724 372.4 1992 Elon (N.C.) (I) 10 568 2,889 288.9 Greenville (Ill.) (II) 9 481 3,233 359.2 1993 Carroll (Mont.) (I) 10 641 2,862 286.2
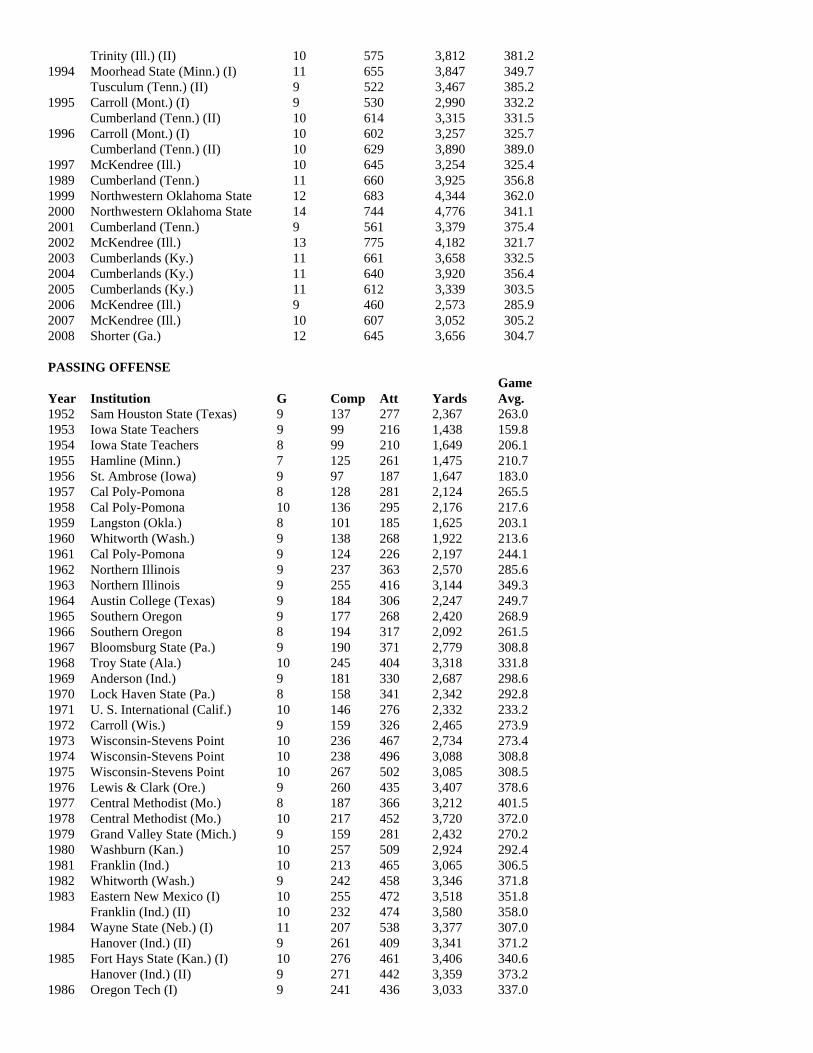
Trinity (Ill.) (II) 10 575 3,812 381.2 1994 Moorhead State (Minn.) (I) 11 655 3,847 349.7 Tusculum (Tenn.) (II) 9 522 3,467 385.2 1995 Carroll (Mont.) (I) 9 530 2,990 332.2 Cumberland (Tenn.) (II) 10 614 3,315 331.5 1996 Carroll (Mont.) (I) 10 602 3,257 325.7 Cumberland (Tenn.) (II) 10 629 3,890 389.0 1997 McKendree (Ill.) 10 645 3,254 325.4 1989 Cumberland (Tenn.) 11 660 3,925 356.8 1999 Northwestern Oklahoma State 12 683 4,344 362.0 2000 Northwestern Oklahoma State 14 744 4,776 341.1 2001 Cumberland (Tenn.) 9 561 3,379 375.4 2002 McKendree (Ill.) 13 775 4,182 321.7 2003 Cumberlands (Ky.) 11 661 3,658 332.5 2004 Cumberlands (Ky.) 11 640 3,920 356.4 2005 Cumberlands (Ky.) 11 612 3,339 303.5 2006 McKendree (Ill.) 9 460 2,573 285.9 2007 McKendree (Ill.) 10 607 3,052 305.2 2008 Shorter (Ga.) 12 645 3,656 304.7 PASSING OFFENSE Game Year Institution G Comp Att Yards Avg. 1952 Sam Houston State (Texas) 9 137 277 2,367 263.0 1953 Iowa State Teachers 9 99 216 1,438 159.8 1954 Iowa State Teachers 8 99 210 1,649 206.1 1955 Hamline (Minn.) 7 125 261 1,475 210.7 1956 St. Ambrose (Iowa) 9 97 187 1,647 183.0 1957 Cal Poly-Pomona 8 128 281 2,124 265.5 1958 Cal Poly-Pomona 10 136 295 2,176 217.6 1959 Langston (Okla.) 8 101 185 1,625 203.1 1960 Whitworth (Wash.) 9 138 268 1,922 213.6 1961 Cal Poly-Pomona 9 124 226 2,197 244.1 1962 Northern Illinois 9 237 363 2,570 285.6 1963 Northern Illinois 9 255 416 3,144 349.3 1964 Austin College (Texas) 9 184 306 2,247 249.7 1965 Southern Oregon 9 177 268 2,420 268.9 1966 Southern Oregon 8 194 317 2,092 261.5 1967 Bloomsburg State (Pa.) 9 190 371 2,779 308.8 1968 Troy State (Ala.) 10 245 404 3,318 331.8 1969 Anderson (Ind.) 9 181 330 2,687 298.6 1970 Lock Haven State (Pa.) 8 158 341 2,342 292.8 1971 U. S. International (Calif.) 10 146 276 2,332 233.2 1972 Carroll (Wis.) 9 159 326 2,465 273.9 1973 Wisconsin-Stevens Point 10 236 467 2,734 273.4 1974 Wisconsin-Stevens Point 10 238 496 3,088 308.8 1975 Wisconsin-Stevens Point 10 267 502 3,085 308.5 1976 Lewis & Clark (Ore.) 9 260 435 3,407 378.6 1977 Central Methodist (Mo.) 8 187 366 3,212 401.5 1978 Central Methodist (Mo.) 10 217 452 3,720 372.0 1979 Grand Valley State (Mich.) 9 159 281 2,432 270.2 1980 Washburn (Kan.) 10 257 509 2,924 292.4 1981 Franklin (Ind.) 10 213 465 3,065 306.5 1982 Whitworth (Wash.) 9 242 458 3,346 371.8 1983 Eastern New Mexico (I) 10 255 472 3,518 351.8 Franklin (Ind.) (II) 10 232 474 3,580 358.0 1984 Wayne State (Neb.) (I) 11 207 538 3,377 307.0 Hanover (Ind.) (II) 9 261 409 3,341 371.2 1985 Fort Hays State (Kan.) (I) 10 276 461 3,406 340.6 Hanover (Ind.) (II) 9 271 442 3,359 373.2 1986 Oregon Tech (I) 9 241 436 3,033 337.0
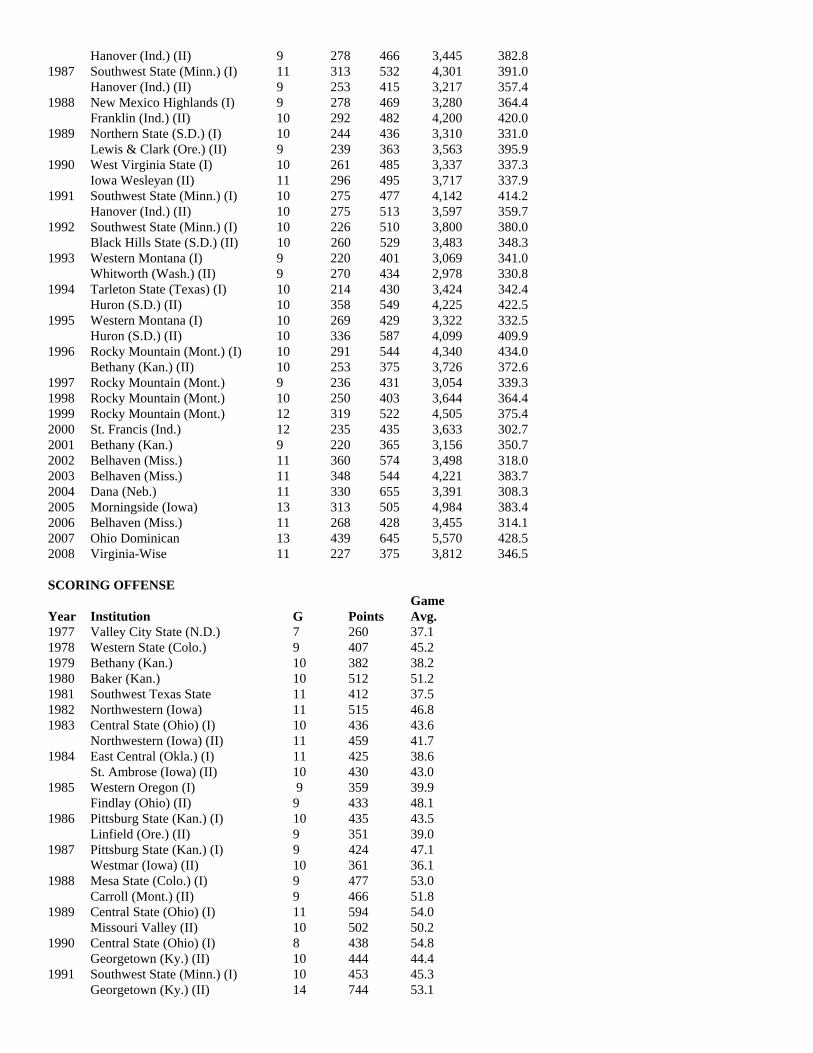
Hanover (Ind.) (II) 9 278 466 3,445 382.8 1987 Southwest State (Minn.) (I) 11 313 532 4,301 391.0 Hanover (Ind.) (II) 9 253 415 3,217 357.4 1988 New Mexico Highlands (I) 9 278 469 3,280 364.4 Franklin (Ind.) (II) 10 292 482 4,200 420.0 1989 Northern State (S.D.) (I) 10 244 436 3,310 331.0 Lewis & Clark (Ore.) (II) 9 239 363 3,563 395.9 1990 West Virginia State (I) 10 261 485 3,337 337.3 Iowa Wesleyan (II) 11 296 495 3,717 337.9 1991 Southwest State (Minn.) (I) 10 275 477 4,142 414.2 Hanover (Ind.) (II) 10 275 513 3,597 359.7 1992 Southwest State (Minn.) (I) 10 226 510 3,800 380.0 Black Hills State (S.D.) (II) 10 260 529 3,483 348.3 1993 Western Montana (I) 9 220 401 3,069 341.0 Whitworth (Wash.) (II) 9 270 434 2,978 330.8 1994 Tarleton State (Texas) (I) 10 214 430 3,424 342.4 Huron (S.D.) (II) 10 358 549 4,225 422.5 1995 Western Montana (I) 10 269 429 3,322 332.5 Huron (S.D.) (II) 10 336 587 4,099 409.9 1996 Rocky Mountain (Mont.) (I) 10 291 544 4,340 434.0 Bethany (Kan.) (II) 10 253 375 3,726 372.6 1997 Rocky Mountain (Mont.) 9 236 431 3,054 339.3 1998 Rocky Mountain (Mont.) 10 250 403 3,644 364.4 1999 Rocky Mountain (Mont.) 12 319 522 4,505 375.4 2000 St. Francis (Ind.) 12 235 435 3,633 302.7 2001 Bethany (Kan.) 9 220 365 3,156 350.7 2002 Belhaven (Miss.) 11 360 574 3,498 318.0 2003 Belhaven (Miss.) 11 348 544 4,221 383.7 2004 Dana (Neb.) 11 330 655 3,391 308.3 2005 Morningside (Iowa) 13 313 505 4,984 383.4 2006 Belhaven (Miss.) 11 268 428 3,455 314.1 2007 Ohio Dominican 13 439 645 5,570 428.5 2008 Virginia-Wise 11 227 375 3,812 346.5 SCORING OFFENSE Game Year Institution G Points Avg. 1977 Valley City State (N.D.) 7 260 37.1 1978 Western State (Colo.) 9 407 45.2 1979 Bethany (Kan.) 10 382 38.2 1980 Baker (Kan.) 10 512 51.2 1981 Southwest Texas State 11 412 37.5 1982 Northwestern (Iowa) 11 515 46.8 1983 Central State (Ohio) (I) 10 436 43.6 Northwestern (Iowa) (II) 11 459 41.7 1984 East Central (Okla.) (I) 11 425 38.6 St. Ambrose (Iowa) (II) 10 430 43.0 1985 Western Oregon (I) 9 359 39.9 Findlay (Ohio) (II) 9 433 48.1 1986 Pittsburg State (Kan.) (I) 10 435 43.5 Linfield (Ore.) (II) 9 351 39.0 1987 Pittsburg State (Kan.) (I) 9 424 47.1 Westmar (Iowa) (II) 10 361 36.1 1988 Mesa State (Colo.) (I) 9 477 53.0 Carroll (Mont.) (II) 9 466 51.8 1989 Central State (Ohio) (I) 11 594 54.0 Missouri Valley (II) 10 502 50.2 1990 Central State (Ohio) (I) 8 438 54.8 Georgetown (Ky.) (II) 10 444 44.4 1991 Southwest State (Minn.) (I) 10 453 45.3 Georgetown (Ky.) (II) 14 744 53.1
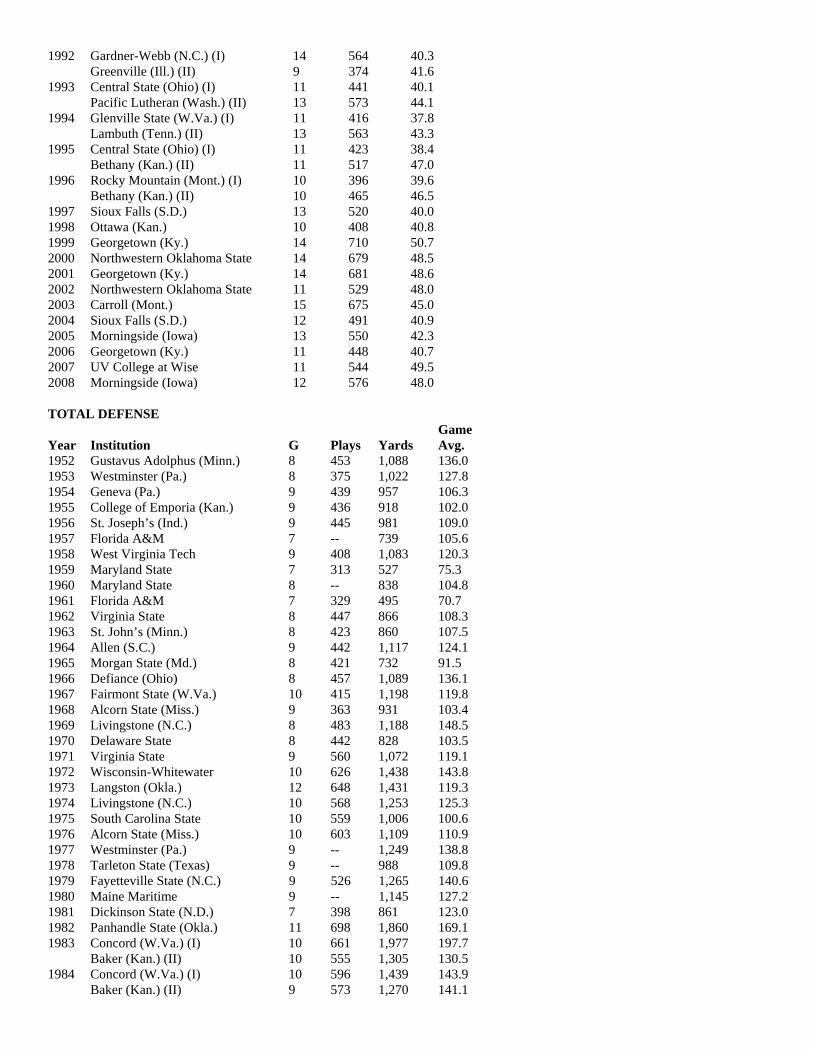
1992 Gardner-Webb (N.C.) (I) 14 564 40.3 Greenville (Ill.) (II) 9 374 41.6 1993 Central State (Ohio) (I) 11 441 40.1 Pacific Lutheran (Wash.) (II) 13 573 44.1 1994 Glenville State (W.Va.) (I) 11 416 37.8 Lambuth (Tenn.) (II) 13 563 43.3 1995 Central State (Ohio) (I) 11 423 38.4 Bethany (Kan.) (II) 11 517 47.0 1996 Rocky Mountain (Mont.) (I) 10 396 39.6 Bethany (Kan.) (II) 10 465 46.5 1997 Sioux Falls (S.D.) 13 520 40.0 1998 Ottawa (Kan.) 10 408 40.8 1999 Georgetown (Ky.) 14 710 50.7 2000 Northwestern Oklahoma State 14 679 48.5 2001 Georgetown (Ky.) 14 681 48.6 2002 Northwestern Oklahoma State 11 529 48.0 2003 Carroll (Mont.) 15 675 45.0 2004 Sioux Falls (S.D.) 12 491 40.9 2005 Morningside (Iowa) 13 550 42.3 2006 Georgetown (Ky.) 11 448 40.7 2007 UV College at Wise 11 544 49.5 2008 Morningside (Iowa) 12 576 48.0 TOTAL DEFENSE Game Year Institution G Plays Yards Avg. 1952 Gustavus Adolphus (Minn.) 8 453 1,088 136.0 1953 Westminster (Pa.) 8 375 1,022 127.8 1954 Geneva (Pa.) 9 439 957 106.3 1955 College of Emporia (Kan.) 9 436 918 102.0 1956 St. Joseph’s (Ind.) 9 445 981 109.0 1957 Florida A&M 7 -- 739 105.6 1958 West Virginia Tech 9 408 1,083 120.3 1959 Maryland State 7 313 527 75.3 1960 Maryland State 8 -- 838 104.8 1961 Florida A&M 7 329 495 70.7 1962 Virginia State 8 447 866 108.3 1963 St. John’s (Minn.) 8 423 860 107.5 1964 Allen (S.C.) 9 442 1,117 124.1 1965 Morgan State (Md.) 8 421 732 91.5 1966 Defiance (Ohio) 8 457 1,089 136.1 1967 Fairmont State (W.Va.) 10 415 1,198 119.8 1968 Alcorn State (Miss.) 9 363 931 103.4 1969 Livingstone (N.C.) 8 483 1,188 148.5 1970 Delaware State 8 442 828 103.5 1971 Virginia State 9 560 1,072 119.1 1972 Wisconsin-Whitewater 10 626 1,438 143.8 1973 Langston (Okla.) 12 648 1,431 119.3 1974 Livingstone (N.C.) 10 568 1,253 125.3 1975 South Carolina State 10 559 1,006 100.6 1976 Alcorn State (Miss.) 10 603 1,109 110.9 1977 Westminster (Pa.) 9 -- 1,249 138.8 1978 Tarleton State (Texas) 9 -- 988 109.8 1979 Fayetteville State (N.C.) 9 526 1,265 140.6 1980 Maine Maritime 9 -- 1,145 127.2 1981 Dickinson State (N.D.) 7 398 861 123.0 1982 Panhandle State (Okla.) 11 698 1,860 169.1 1983 Concord (W.Va.) (I) 10 661 1,977 197.7 Baker (Kan.) (II) 10 555 1,305 130.5 1984 Concord (W.Va.) (I) 10 596 1,439 143.9 Baker (Kan.) (II) 9 573 1,270 141.1
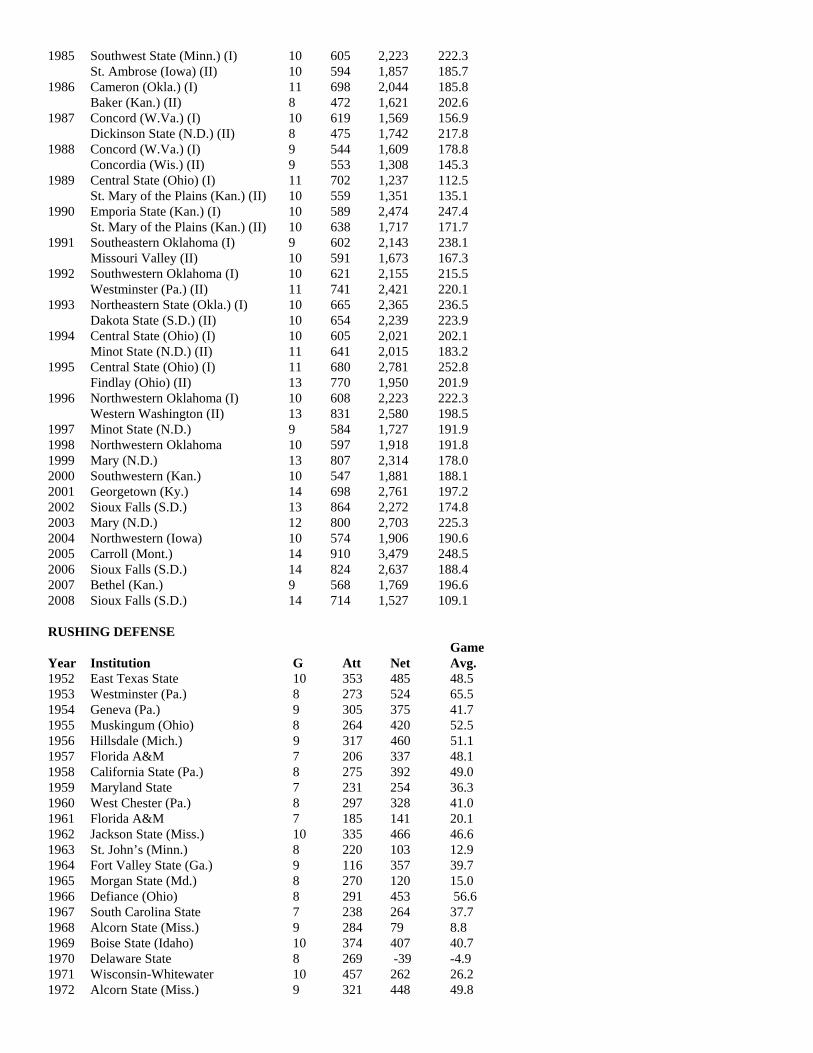
1985 Southwest State (Minn.) (I) 10 605 2,223 222.3 St. Ambrose (Iowa) (II) 10 594 1,857 185.7 1986 Cameron (Okla.) (I) 11 698 2,044 185.8 Baker (Kan.) (II) 8 472 1,621 202.6 1987 Concord (W.Va.) (I) 10 619 1,569 156.9 Dickinson State (N.D.) (II) 8 475 1,742 217.8 1988 Concord (W.Va.) (I) 9 544 1,609 178.8 Concordia (Wis.) (II) 9 553 1,308 145.3 1989 Central State (Ohio) (I) 11 702 1,237 112.5 St. Mary of the Plains (Kan.) (II) 10 559 1,351 135.1 1990 Emporia State (Kan.) (I) 10 589 2,474 247.4 St. Mary of the Plains (Kan.) (II) 10 638 1,717 171.7 1991 Southeastern Oklahoma (I) 9 602 2,143 238.1 Missouri Valley (II) 10 591 1,673 167.3 1992 Southwestern Oklahoma (I) 10 621 2,155 215.5 Westminster (Pa.) (II) 11 741 2,421 220.1 1993 Northeastern State (Okla.) (I) 10 665 2,365 236.5 Dakota State (S.D.) (II) 10 654 2,239 223.9 1994 Central State (Ohio) (I) 10 605 2,021 202.1 Minot State (N.D.) (II) 11 641 2,015 183.2 1995 Central State (Ohio) (I) 11 680 2,781 252.8 Findlay (Ohio) (II) 13 770 1,950 201.9 1996 Northwestern Oklahoma (I) 10 608 2,223 222.3 Western Washington (II) 13 831 2,580 198.5 1997 Minot State (N.D.) 9 584 1,727 191.9 1998 Northwestern Oklahoma 10 597 1,918 191.8 1999 Mary (N.D.) 13 807 2,314 178.0 2000 Southwestern (Kan.) 10 547 1,881 188.1 2001 Georgetown (Ky.) 14 698 2,761 197.2 2002 Sioux Falls (S.D.) 13 864 2,272 174.8 2003 Mary (N.D.) 12 800 2,703 225.3 2004 Northwestern (Iowa) 10 574 1,906 190.6 2005 Carroll (Mont.) 14 910 3,479 248.5 2006 Sioux Falls (S.D.) 14 824 2,637 188.4 2007 Bethel (Kan.) 9 568 1,769 196.6 2008 Sioux Falls (S.D.) 14 714 1,527 109.1 RUSHING DEFENSE Game Year Institution G Att Net Avg. 1952 East Texas State 10 353 485 48.5 1953 Westminster (Pa.) 8 273 524 65.5 1954 Geneva (Pa.) 9 305 375 41.7 1955 Muskingum (Ohio) 8 264 420 52.5 1956 Hillsdale (Mich.) 9 317 460 51.1 1957 Florida A&M 7 206 337 48.1 1958 California State (Pa.) 8 275 392 49.0 1959 Maryland State 7 231 254 36.3 1960 West Chester (Pa.) 8 297 328 41.0 1961 Florida A&M 7 185 141 20.1 1962 Jackson State (Miss.) 10 335 466 46.6 1963 St. John’s (Minn.) 8 220 103 12.9 1964 Fort Valley State (Ga.) 9 116 357 39.7 1965 Morgan State (Md.) 8 270 120 15.0 1966 Defiance (Ohio) 8 291 453 56.6 1967 South Carolina State 7 238 264 37.7 1968 Alcorn State (Miss.) 9 284 79 8.8 1969 Boise State (Idaho) 10 374 407 40.7 1970 Delaware State 8 269 -39 -4.9 1971 Wisconsin-Whitewater 10 457 262 26.2 1972 Alcorn State (Miss.) 9 321 448 49.8
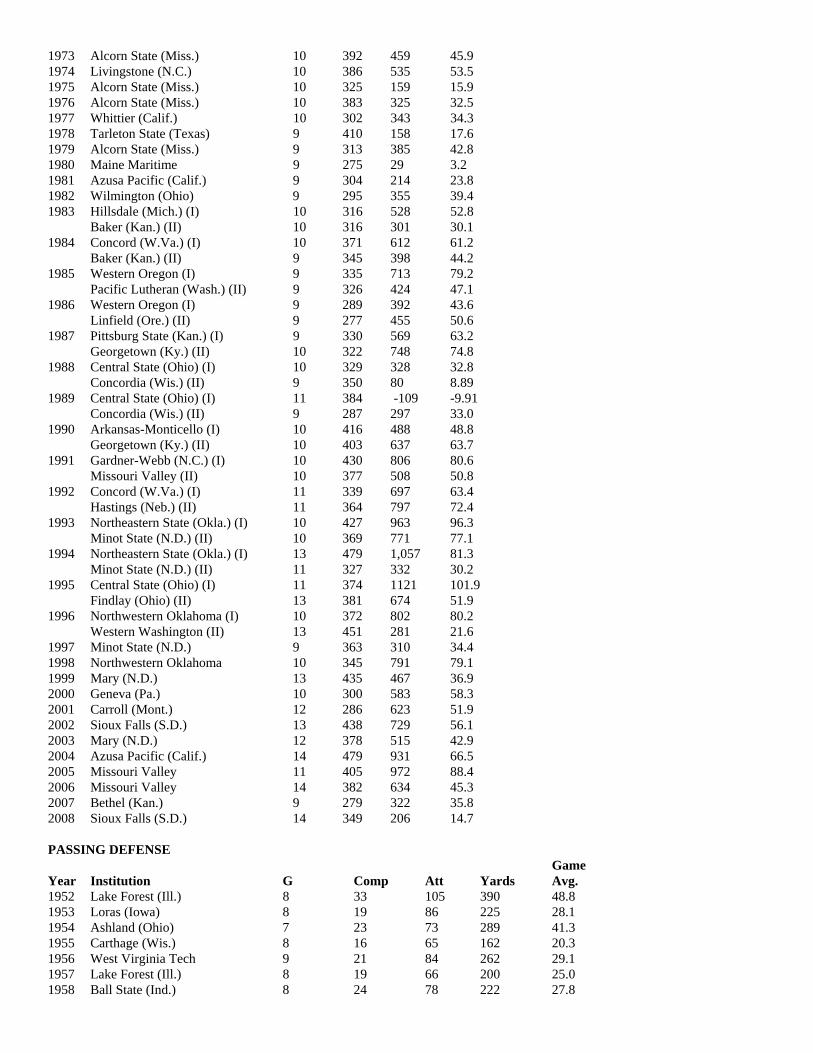
1973 Alcorn State (Miss.) 10 392 459 45.9 1974 Livingstone (N.C.) 10 386 535 53.5 1975 Alcorn State (Miss.) 10 325 159 15.9 1976 Alcorn State (Miss.) 10 383 325 32.5 1977 Whittier (Calif.) 10 302 343 34.3 1978 Tarleton State (Texas) 9 410 158 17.6 1979 Alcorn State (Miss.) 9 313 385 42.8 1980 Maine Maritime 9 275 29 3.2 1981 Azusa Pacific (Calif.) 9 304 214 23.8 1982 Wilmington (Ohio) 9 295 355 39.4 1983 Hillsdale (Mich.) (I) 10 316 528 52.8 Baker (Kan.) (II) 10 316 301 30.1 1984 Concord (W.Va.) (I) 10 371 612 61.2 Baker (Kan.) (II) 9 345 398 44.2 1985 Western Oregon (I) 9 335 713 79.2 Pacific Lutheran (Wash.) (II) 9 326 424 47.1 1986 Western Oregon (I) 9 289 392 43.6 Linfield (Ore.) (II) 9 277 455 50.6 1987 Pittsburg State (Kan.) (I) 9 330 569 63.2 Georgetown (Ky.) (II) 10 322 748 74.8 1988 Central State (Ohio) (I) 10 329 328 32.8 Concordia (Wis.) (II) 9 350 80 8.89 1989 Central State (Ohio) (I) 11 384 -109 -9.91 Concordia (Wis.) (II) 9 287 297 33.0 1990 Arkansas-Monticello (I) 10 416 488 48.8 Georgetown (Ky.) (II) 10 403 637 63.7 1991 Gardner-Webb (N.C.) (I) 10 430 806 80.6 Missouri Valley (II) 10 377 508 50.8 1992 Concord (W.Va.) (I) 11 339 697 63.4 Hastings (Neb.) (II) 11 364 797 72.4 1993 Northeastern State (Okla.) (I) 10 427 963 96.3 Minot State (N.D.) (II) 10 369 771 77.1 1994 Northeastern State (Okla.) (I) 13 479 1,057 81.3 Minot State (N.D.) (II) 11 327 332 30.2 1995 Central State (Ohio) (I) 11 374 1121 101.9 Findlay (Ohio) (II) 13 381 674 51.9 1996 Northwestern Oklahoma (I) 10 372 802 80.2 Western Washington (II) 13 451 281 21.6 1997 Minot State (N.D.) 9 363 310 34.4 1998 Northwestern Oklahoma 10 345 791 79.1 1999 Mary (N.D.) 13 435 467 36.9 2000 Geneva (Pa.) 10 300 583 58.3 2001 Carroll (Mont.) 12 286 623 51.9 2002 Sioux Falls (S.D.) 13 438 729 56.1 2003 Mary (N.D.) 12 378 515 42.9 2004 Azusa Pacific (Calif.) 14 479 931 66.5 2005 Missouri Valley 11 405 972 88.4 2006 Missouri Valley 14 382 634 45.3 2007 Bethel (Kan.) 9 279 322 35.8 2008 Sioux Falls (S.D.) 14 349 206 14.7 PASSING DEFENSE Game Year Institution G Comp Att Yards Avg. 1952 Lake Forest (Ill.) 8 33 105 390 48.8 1953 Loras (Iowa) 8 19 86 225 28.1 1954 Ashland (Ohio) 7 23 73 289 41.3 1955 Carthage (Wis.) 8 16 65 162 20.3 1956 West Virginia Tech 9 21 84 262 29.1 1957 Lake Forest (Ill.) 8 19 66 200 25.0 1958 Ball State (Ind.) 8 24 78 222 27.8
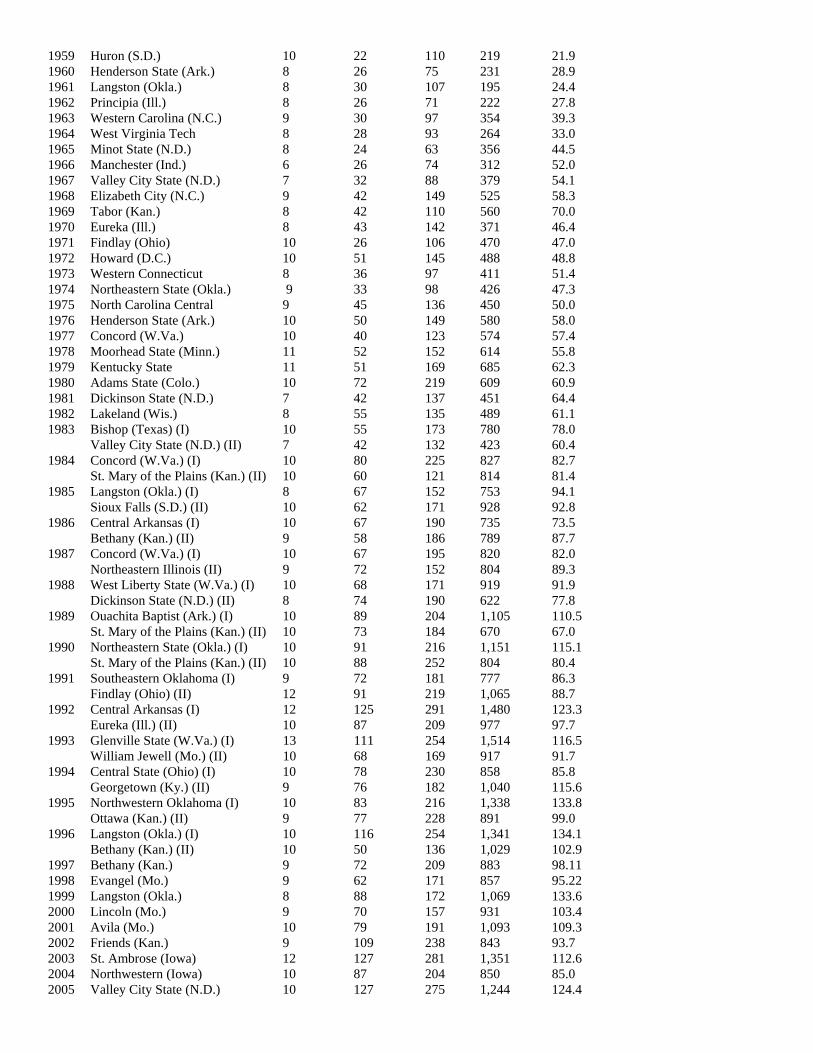
1959 Huron (S.D.) 10 22 110 219 21.9 1960 Henderson State (Ark.) 8 26 75 231 28.9 1961 Langston (Okla.) 8 30 107 195 24.4 1962 Principia (Ill.) 8 26 71 222 27.8 1963 Western Carolina (N.C.) 9 30 97 354 39.3 1964 West Virginia Tech 8 28 93 264 33.0 1965 Minot State (N.D.) 8 24 63 356 44.5 1966 Manchester (Ind.) 6 26 74 312 52.0 1967 Valley City State (N.D.) 7 32 88 379 54.1 1968 Elizabeth City (N.C.) 9 42 149 525 58.3 1969 Tabor (Kan.) 8 42 110 560 70.0 1970 Eureka (Ill.) 8 43 142 371 46.4 1971 Findlay (Ohio) 10 26 106 470 47.0 1972 Howard (D.C.) 10 51 145 488 48.8 1973 Western Connecticut 8 36 97 411 51.4 1974 Northeastern State (Okla.) 9 33 98 426 47.3 1975 North Carolina Central 9 45 136 450 50.0 1976 Henderson State (Ark.) 10 50 149 580 58.0 1977 Concord (W.Va.) 10 40 123 574 57.4 1978 Moorhead State (Minn.) 11 52 152 614 55.8 1979 Kentucky State 11 51 169 685 62.3 1980 Adams State (Colo.) 10 72 219 609 60.9 1981 Dickinson State (N.D.) 7 42 137 451 64.4 1982 Lakeland (Wis.) 8 55 135 489 61.1 1983 Bishop (Texas) (I) 10 55 173 780 78.0 Valley City State (N.D.) (II) 7 42 132 423 60.4 1984 Concord (W.Va.) (I) 10 80 225 827 82.7 St. Mary of the Plains (Kan.) (II) 10 60 121 814 81.4 1985 Langston (Okla.) (I) 8 67 152 753 94.1 Sioux Falls (S.D.) (II) 10 62 171 928 92.8 1986 Central Arkansas (I) 10 67 190 735 73.5 Bethany (Kan.) (II) 9 58 186 789 87.7 1987 Concord (W.Va.) (I) 10 67 195 820 82.0 Northeastern Illinois (II) 9 72 152 804 89.3 1988 West Liberty State (W.Va.) (I) 10 68 171 919 91.9 Dickinson State (N.D.) (II) 8 74 190 622 77.8 1989 Ouachita Baptist (Ark.) (I) 10 89 204 1,105 110.5 St. Mary of the Plains (Kan.) (II) 10 73 184 670 67.0 1990 Northeastern State (Okla.) (I) 10 91 216 1,151 115.1 St. Mary of the Plains (Kan.) (II) 10 88 252 804 80.4 1991 Southeastern Oklahoma (I) 9 72 181 777 86.3 Findlay (Ohio) (II) 12 91 219 1,065 88.7 1992 Central Arkansas (I) 12 125 291 1,480 123.3 Eureka (Ill.) (II) 10 87 209 977 97.7 1993 Glenville State (W.Va.) (I) 13 111 254 1,514 116.5 William Jewell (Mo.) (II) 10 68 169 917 91.7 1994 Central State (Ohio) (I) 10 78 230 858 85.8 Georgetown (Ky.) (II) 9 76 182 1,040 115.6 1995 Northwestern Oklahoma (I) 10 83 216 1,338 133.8 Ottawa (Kan.) (II) 9 77 228 891 99.0 1996 Langston (Okla.) (I) 10 116 254 1,341 134.1 Bethany (Kan.) (II) 10 50 136 1,029 102.9 1997 Bethany (Kan.) 9 72 209 883 98.11 1998 Evangel (Mo.) 9 62 171 857 95.22 1999 Langston (Okla.) 8 88 172 1,069 133.6 2000 Lincoln (Mo.) 9 70 157 931 103.4 2001 Avila (Mo.) 10 79 191 1,093 109.3 2002 Friends (Kan.) 9 109 238 843 93.7 2003 St. Ambrose (Iowa) 12 127 281 1,351 112.6 2004 Northwestern (Iowa) 10 87 204 850 85.0 2005 Valley City State (N.D.) 10 127 275 1,244 124.4
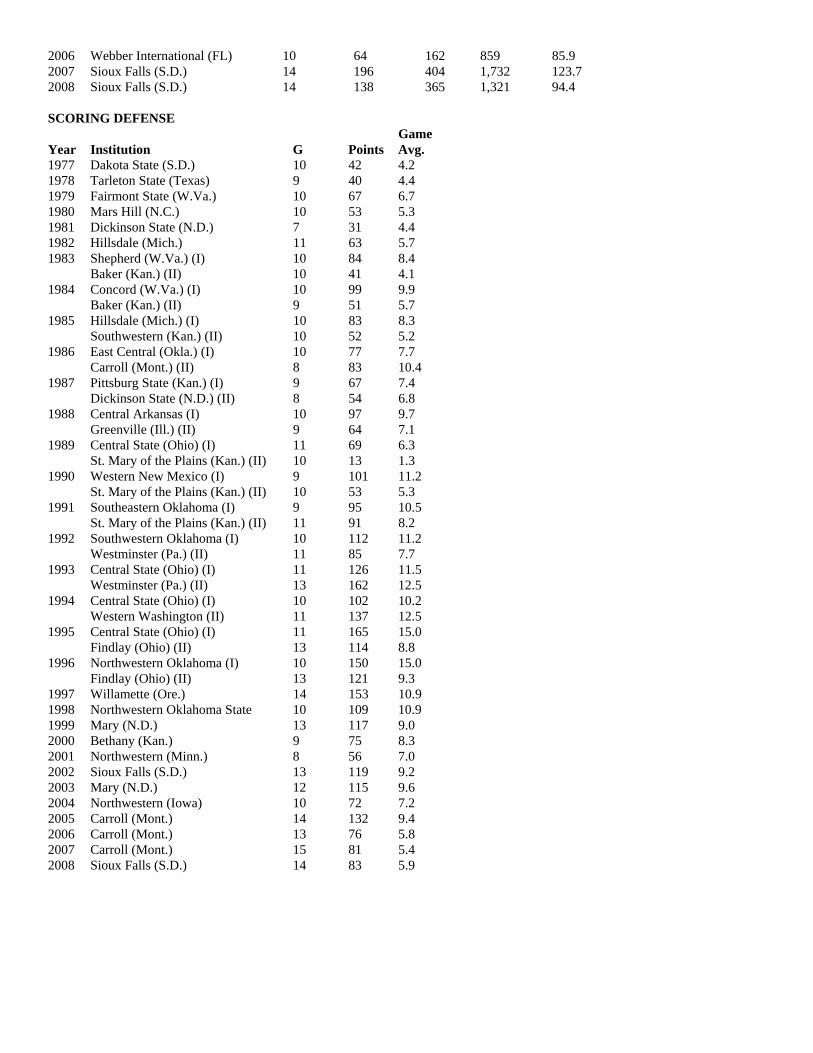
2006 Webber International (FL) 10 64 162 859 85.9 2007 Sioux Falls (S.D.) 14 196 404 1,732 123.7 2008 Sioux Falls (S.D.) 14 138 365 1,321 94.4 SCORING DEFENSE Game Year Institution G Points Avg. 1977 Dakota State (S.D.) 10 42 4.2 1978 Tarleton State (Texas) 9 40 4.4 1979 Fairmont State (W.Va.) 10 67 6.7 1980 Mars Hill (N.C.) 10 53 5.3 1981 Dickinson State (N.D.) 7 31 4.4 1982 Hillsdale (Mich.) 11 63 5.7 1983 Shepherd (W.Va.) (I) 10 84 8.4 Baker (Kan.) (II) 10 41 4.1 1984 Concord (W.Va.) (I) 10 99 9.9 Baker (Kan.) (II) 9 51 5.7 1985 Hillsdale (Mich.) (I) 10 83 8.3 Southwestern (Kan.) (II) 10 52 5.2 1986 East Central (Okla.) (I) 10 77 7.7 Carroll (Mont.) (II) 8 83 10.4 1987 Pittsburg State (Kan.) (I) 9 67 7.4 Dickinson State (N.D.) (II) 8 54 6.8 1988 Central Arkansas (I) 10 97 9.7 Greenville (Ill.) (II) 9 64 7.1 1989 Central State (Ohio) (I) 11 69 6.3 St. Mary of the Plains (Kan.) (II) 10 13 1.3 1990 Western New Mexico (I) 9 101 11.2 St. Mary of the Plains (Kan.) (II) 10 53 5.3 1991 Southeastern Oklahoma (I) 9 95 10.5 St. Mary of the Plains (Kan.) (II) 11 91 8.2 1992 Southwestern Oklahoma (I) 10 112 11.2 Westminster (Pa.) (II) 11 85 7.7 1993 Central State (Ohio) (I) 11 126 11.5 Westminster (Pa.) (II) 13 162 12.5 1994 Central State (Ohio) (I) 10 102 10.2 Western Washington (II) 11 137 12.5 1995 Central State (Ohio) (I) 11 165 15.0 Findlay (Ohio) (II) 13 114 8.8 1996 Northwestern Oklahoma (I) 10 150 15.0 Findlay (Ohio) (II) 13 121 9.3 1997 Willamette (Ore.) 14 153 10.9 1998 Northwestern Oklahoma State 10 109 10.9 1999 Mary (N.D.) 13 117 9.0 2000 Bethany (Kan.) 9 75 8.3 2001 Northwestern (Minn.) 8 56 7.0 2002 Sioux Falls (S.D.) 13 119 9.2 2003 Mary (N.D.) 12 115 9.6 2004 Northwestern (Iowa) 10 72 7.2 2005 Carroll (Mont.) 14 132 9.4 2006 Carroll (Mont.) 13 76 5.8 2007 Carroll (Mont.) 15 81 5.4 2008 Sioux Falls (S.D.) 14 83 5.9