Embed Size (px)
Citation preview

EUROPEANCOMMISSION
FoodSecurityandNutri0onAnalysisUnit‐Somalia
Post Deyr’ 09/10 Assessment Analysis
Juba Region
27th January 2010

Field Access and Field Data Locations
Deyr ‘09 /2010 Seasonal
Assessment Coverage

Main Livelihood Groups Sources of Food and Income
• 2 Agro-pastoral Livelihoods (Southern and Lower Juba Agro-pastoralists) Southern Agro-pastoral are more pastoral in the west than those in the east who are
agriculturalists – main sources of income: sale of livestock & livestock products, self-employment, employment, crop sales; main source of food is own production and purchases
Lower Juba Agro-pastoral are more pastoralists than agriculturists – main source of income: sales of livestock products and wild food sales; main source of food: own production and purchases.
• Riverine (M. and L. Juba) • Main source of income of poor : Crop sales, wage labour, self-employment (collection of
bush products) • Main sources of food of poor: Own production and market purchase
Livelihood Groups & Main Sources of Food and Income
• 2 Pastoral Livelihoods (Southeast and Southern Inland Pastoralists) Primary sources of income of poor: sale of
livestock & livestock products Primary sources of food of poor: purchase Primary livelihood asset of poor: camel,
cattle, sheep/goat

Deyr Seasonal Rains Start of Season: started on time –early October
• Temporal and Spatial Distribution: good in terms of coverage and intensity; long dry spell from 2nd dekad of November up to the end of 1st Dekad of December; shower and localized rains until the end of December.
• Normal rains: All parts of the regions except the coastal areas of Jamame and Kismayo
• Poor rains: coastal areas of Jamame, Jilib, and Kismayo
Climate Performance of the Deyr ’09/ 010 Season

Climate Vegetation Conditions
TrendsinNDVI&RFEbydistrict&landcover
-3
-2
-1
0
1
2
3
gu
deyr
gu
de
yr
gu
deyr
gu
de
yr
gu
deyr
gu
de
yr
gu
deyr
gu
de
yr
gu
deyr
gu
de
yr
gu
deyr
gu
de
yr
gu
deyr
gu
de
yr
gu
deyr
gu
de
yr
gu
deyr
gu
de
yr
gu
deyr
gu
de
yr
gu
deyr
gu
de
yr
gu
deyr
gu
de
yr
gu
deyr
gu
de
yr
gu
deyr
gu
de
yr
1982 1983 1984 1985 1986 1987 1988 1989 1990 1991 1992 1993 1994 1995 1996 1997 1998 1999 2000 2001 2002 2003 2004 2005 2006 2007 2008 2009
Z-sc
ores
Year
Standardized difference from LTA RFE Afmadow NDVI Afmadow 70% range 70% Range
-2.5 -2.0 -1.5 -1.0 -0.5 0.0 0.5 1.0 1.5 2.0 2.5
gu
deyr
gu
de
yr
gu
deyr
gu
de
yr
gu
deyr
gu
de
yr
gu
deyr
gu
de
yr
gu
deyr
gu
de
yr
gu
deyr
1999 2000 2001 2002 2003 2004 2005 2006 2007 2008 2009
Z-sc
ores
Years
Standardized difference from LTA Sakow rainfed RFE CNDVI Series3 Series4
-2.5 -2.0 -1.5 -1.0 -0.5 0.0 0.5 1.0 1.5 2.0 2.5
gu
deyr
gu
de
yr
gu
deyr
gu
de
yr
gu
deyr
gu
de
yr
gu
deyr
gu
de
yr
gu
deyr
gu
de
yr
gu
deyr
1999 2000 2001 2002 2003 2004 2005 2006 2007 2008 2009
Z-sc
ores
Years
Standardized difference from LTA Jamame riverine RFE CNDVI Series3 Series4

Climate Deyr 2009 overall rainfall Performance
Cumulative rainfall (mm) Oct 1-Dec 30, 2009 Percent of normal rainfall October –Dec, 2009
Above normal rainfall in most of the south led to improved crop and rangeland condition.

Civil Security Situation: • Religious conflict increased civil
insecurity. • High tension of regrouping militia
of guerrilla war • Increased displacements from
main towns to rural areas
Direct and Indirect Impacts on Food Security & Nutrition :
• Medium Impact • Short-term restrictions on
movement and trade with possible long term effects.
• Increased displacements.
Civil Insecurity
Source:FSNAU&Protec0onCluster

Agriculture Deyr 09/10 Cereal Production Cereal Estimates
Lower Juba Cereal Production Estimates
Districts Deyr 09/10 Production in MT
Total Cereal Deyr 09/10 as
% of Deyr 08/09
Deyr 09/10 as % of Deyr
PWA (1999-2008)
Deyr 09/10 as % of 5 year
average (2004-2008) Maize Sorghum
Afmadow 120 5 125 208% 60% 244%
Hagar 113 225 338 750% 190% 383%
Badhaadhe 105 0 105 131% 38% 106%
Jamaame 1,120 0 1,120 - 351% 1745%
Kismaayo 144 0 144 160% 64% 66%
Juba Hoose (Lower) Deyr 09/10 Total
1,602 230 1832 590% 104% 331%
Middle Juba Cereal Production Estimates
Districts Deyr 09/10 Production in MT
Total Cereal Deyr 2009 as
% of Deyr 08/09
Deyr 09/10 as % of Deyr
PWA (1999-2008)
Deyr 09/10 as % of 5 year
average (2004-2008) Maize Sorghum
Bu'aale 1,500 363 1,863 1242% 202% 210%
Jilib 2,502 0 2,502 5560% 297% 801%
Saakow 1,100 3,375 4,475 416% 196% 172%
Juba Dhexe (Middle) Deyr 09/10 Total
5,102 3,738 8,840 696% 219% 232%

Agriculture Cereal Production Estimates Plus Off-season Maize
Juba Hoose (Lower) Cereal Production Estimates plus Off-Season
Districts
Deyr 2009 Production in MT
Total Cereal Deyr 2009 as
% of Deyr 2008
Deyr 2009 as % of Deyr
PWA (1999-2008)
Deyr 2009 as % of 5 year
average (2004-2008)
Maize Sorghum
Afmadow 120 5 125 104% 58% 198%
Hagar 113 225 338 750% 190% 383%
Badhaadhe 105 0 105 131% 38% 106%
Jamaame 2,420 0 2,420 121% 442% 464%
Kismaayo 144 0 144 160% 61% 60% Juba Hoose (Lower) Deyr 2009 Total 2,902 230 3,132 134% 216% 309%
Juba Dhexe (Middle) Off-Season Cereal Production Estimates plus Off-Season
Districts
Deyr 2009 Production in MT
Total Cereal Deyr 2009 as
% of Deyr 2008
Deyr 2009 as % of Deyr
PWA (1999-2008)
Deyr 2009 as % of 5 year
average (2004-2008)
Maize Sorghum
Bu'aale 1,600 363 1,963 187% 191% 179%
Jilib 2,682 0 2,682 131% 251% 351%
Saakow 1,176 3,375 4,551 298% 195% 168% Juba Dhexe (Middle) Deyr 2009 Total 5,458 3,738 9,196 199% 208% 201%

Agriculture Off-Season Cereal Estimates
Regions
Off Season : March 2010
Maize (MT) Total Cereal
Middle Juba 360 360
Lower Juba 1300 1300
Total 1660 1660

Agriculture Juba Cash Crops
Deyr-09/10 Cash Crop Production Estimates in Juba Regions
Regions
Deyr 09/10 Production in MT
Deyr ‘09/10 Cowpea
Deyr 09/10 Sesame
Deyr ‘09/10 Off-Season
Cowpea
Deyr ‘09/10 Off-Season
Sesame Total
Juba Dhexe (Middle)
0 7,129 138 1,350 8,617
Juba Hoose (Lower)
0 1,842 480 1,800 4,122
Deyr 09/10 Total 8,971 618 3,150 12,739

Agriculture Trends in Lower Juba Cereal Production
Deyr 09/10 Cereal
Production Trends
(1995 – 2009)
Annual Cereal
Production Trends
(1995 – 2009)
0
1,000
2,000
3,000
4,000
5,000
1995 1996 1997 1998 1999 2000 2001 2002 2003 2004 2005 2006 2007 2008 2009
MT
Year
Maize Sorghum PWA 5yearAvrg
0
2,000
4,000
6,000
8,000
10,000
12,000
14,000
16,000
18,000
1995 1996 1997 1998 1999 2000 2001 2002 2003 2004 2005 2006 2007 2008 2009
MT
Year
Deyr Gu OverallPWA 5yearAvrg

Agriculture Trends in Middle Juba Cereal Production
Deyr 09/10 Cereal
Production Trends
(1995 – 2009)
Annual Cereal
Production Trends
(1995 – 2009)
01,0002,0003,0004,0005,0006,0007,0008,0009,00010,000
1995 1996 1997 1998 1999 2000 2001 2002 2003 2004 2005 2006 2007 2008 2009
MT
Year
M.JubaDeyrCerealProducNon(1995‐2009)
Maize Sorghum PWA 5yearAvrg
0
5,000
10,000
15,000
20,000
25,000
30,000
35,000
1995 1996 1997 1998 1999 2000 2001 2002 2003 2004 2005 2006 2007 2008 2009
MT
Year
M. Juba Annual Cereal Production by Season
Deyr Gu Avrg (Gu+Deyr) PWA Gu PWA Deyr PWA

Agriculture Deyr ’09/10 Good Crop Conditions in M. Juba
1
2
3
1. Good Sesame Crop. Lama Daadka, Jilib, Middle Juba, Dec. ‘09.
2. Good Sorghum Crop. Qaydajuse, Sakow, M. Juba, Dec. 2009
3. Good Maize Crop. Duqiya, Buale, M. Juba, Dec. ’09

Agriculture Deyr ’09/10 Crops – Crop Condition in L.Juba
2.Poor Maize Crop, Yaqle, Buale, M. Juba, Dec. ’09.
1. Sorghum Crop Attacked by Borer, Harbole, Afmadow, L. Juba, Dec. ’09.

Der 09/10 Cereal Flow Map
Agriculture

Agriculture Regional Trends in Cereal Prices & Terms of Trade
in Juba Regions
Regional Trend in Cereal Prices
(maize)
Regional Trend in Terms of Trade: Cereal
to Labor
(Maize kg /daily wage)
02468
101214161820
FiveYearMonthlyaverage
2008
2009
02,0004,0006,0008,00010,00012,00014,00016,00018,00020,000
SoSh
FiveYearMonthlyaverage
2008
2009

Livestock Rangeland Conditions and
Livestock Migration, Dec ’09
• Good performance of Deyr 09/10
• Good pasture condition in most parts of the region, with localized below average conditions in Afmadow and parts of coastal areas.
• Water availability is good in most of the region
• Good livestock body condition

Livestock Trends in Livestock Holdings and Milk Production
Region Conception (Deyr ’09/10)
Calving/kidding (Deyr ’09/10)
Milk production (Deyr ’09/10)
Expected calving/ kidding Jan–Jun 2010
Trends in Herd Size (Jun ‘10)
Livelihoods Livestock species
Middle & Lower Juba
All Pastoral LZs:
Camel: Medium to High Cattle: Medium Sheep/Goat: Medium to High
All Pastoral LZs:
Camel: Medium Cattle: Low Sheep/Goats: Medium to High
All Pastoral LZs:
Camel: Above Average Cattle: Poor Sheep/Goat: Average
All Pastoral LZs:
Camel: Medium Cattle: Medium Sh/goats: Medium to High
Southeast Pastoral
Cattle: increased to 81% of Baseline in Deyr ’09/10 and projected by 97% in June ‘10 Sheep/goats: Increased to 99% of Baseline in Deyr 09/10 and 106% projected in Jun ‘10
Southern Inland Pastoral
Camel: increased to 91% of Baseline in Deyr 09/10 and projected 103% in Jun ‘10 Cattle : increased to 63% in Deyr 09/10 and 76% of baseline projected in Jun ‘10 Sheep/Goat: increased 78% in Deyr 09/10 and 80% of Baseline projected in Jun ‘10
Juba Agro-pastoral
Cattle: increased to 77% in Deyr ’09 and projected by 93% of baseline in June ‘10 Sheep/goats: Increased to 98% in Deyr 09/10 and 164% of Baseline projected in Jun ‘10

Livestock Deyr ’09/10 Livestock – Overall Statement
Good Cattle Body Condition, Sariiro, Buale, Middle Juba, Dec. ‘09
Medium Camel Calving, Faandoofaar, Hagar, Lwer Juba, Dec.’09
South-East Pastoral LZ in Lower Juba and SIP have improved due to normal or above normal rainfall, which led to significant improvement in pasture and water.
Good Goats Body Condition, Korefhireh, Hagar, L. Juba, Dec.’09

Livestock Deyr ’09/10 Water and Pasture
Improved Water Condition, Nebsooy, Sakow, Middle
Juba, Dec.’09
Improved Pasture Condition, Wahereri_Salagle, Sakow, Middle Juba,
Dec.’09
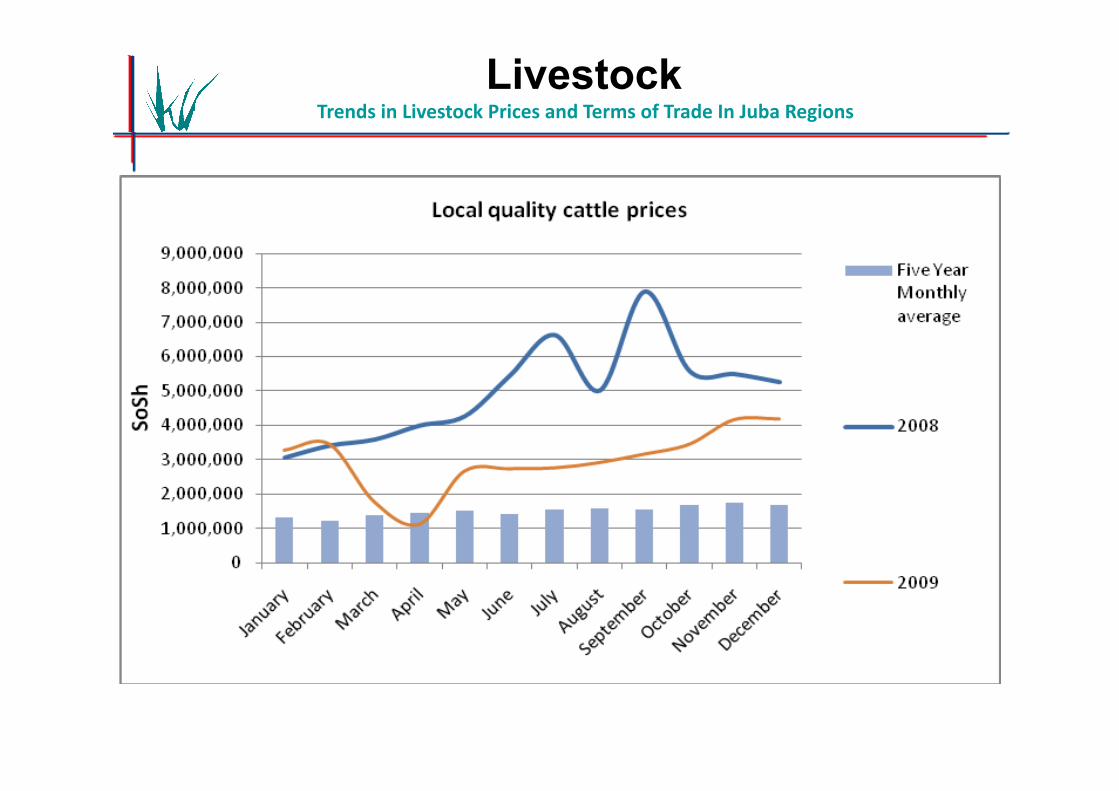
TrendsinLivestockPricesandTermsofTradeInJubaRegionsLivestock

0 20 40 60 80
100 120 140 160 180 200
TOT Cereal(Maize) to L. Goat
Five Year Monthly average
2008
2009
Livestock

Imported Commodity Prices, Labour Rates/Availability
Factors Affecting Commercial Import
Price Declines (last six months)
• Declining global prices
• Increased commercial imports
• Appreciated/ Stable SoSh
Factors Affecting Wage Labour Availability
• High tension and insecurity impedes labour migration and results in a reduction of labour prices.
• Low trade activities due to insecurity .
Markets
0100002000030000400005000060000700008000090000
Pricepe
rUnit(SoSh)
Month
JubaValley:TrendinImportedCommodityPricescomparedtoExchangeRate
PETROL1LitreSUGAR1KgVEGETABLEOIL1LitreREDRICE1KgSOMALISHILLINGSPERDOLLAR

Summary of Nutrition Findings
Region Nutrition Surveys (Nov – Dec. 09)
Health Information System Info
TFC/OTP/ SFC
Other relevant information – Key
driving factors
Summary of analysis and
change from Gu 09
Juba Juba Pastoral GAM of 23.9% (17.9-30.2) SAM of 7.5% (5.3-10.7)
CMR of 2.20 and U5MR of 3.03/10,000/day (FSNAU & partners, Dec 09) – main cause of death Diarrhoea and ARI, with Malaria, Anaemia and Accident as further contributing factors
Juba Agro-pastoral GAM of 15.9% (Pr.=0.90) SAM of 3.9% (Pr. = 0.90)
(FSNAU & partners, Dec 09)
Juba Riverine GAM of 12.2% (Pr.=0.90) and SAM of 4.6% (Pr.=0.90)
(FSNAU & partners, Dec 09)
High (>25) and stable number of acutely malnourished children reported in the pastoral areas with low (<15) and stable numbers of acutely malnourished reported in the agropastoral and riverine centers
(Source: FSNAU, WVI, MA, SRCS, AFREC HIS Data , July-Dec. 09)
High and stable number of acutely malnourished children are admitted in the OTP/TFC in all livelihoods in Juba regions in the Marere TFC.
(Source: MSF-Holland)
High morbidity with 57.1% of riverine, 57.7% in the pastoral and 56.7% in agropastoral sample reportedly ill.
Outbreak of AWD in Sept. ’09, with 435 cases (82% under 5); Oct-Nov.’09 reported 450 cases of AWD (78% under 5) and Dec. reported 425 cases in L/M Juba in all the livelihoods
Limited access to health and feeding facility in rural villages
Low access to safe water (29.9% in Riverine; 5.1% in the pastoral; 16.2% in agropastoral) and sanitation facilities (36.1% in Riverine; 2.8% in the pastoral; 40.0% in agropastoral)
Child care remains suboptimal
Juba Pastoral – Sustained Very Critical due to high disease burden and the lack of cattle milk in the South-East Pastoral. Likely to improve with positive food security indicators.
Juba Agro-pastoral Improved to Critical levels due to the improvement in food security indicators. Disease burden continues to be high though.
Juba Riverine: Sustained Serious situation due to continued high disease burden

Nutrition Situation Estimates - Juba Regional Maps
Juba Regions Nutrition Situation Estimates, January 2010
Juba Regions Nutrition Situation Estimates, July 2009

IPC Analysis Templates Overall Statements
Food Access
Income sources: Increased income Crop sales improved due to overall good cereal production in this Deyr ’09/10 following > normal rains. Milk production is improved due to medium to high calving and kidding respectively Self-employment is improved due to available crop fodder in Juba riverine and agro-pastoral. Income from crop fodder and cash crop, livestock and milk sales is significantly improved, due to good pasture and water condition. Labour opportunities increased in the region due to high agricultural activities (Planting, Weeding, Harvesting, Threshing and Transporting) .
Food sources: Overall good and accessible Purchasing power: Purchasing power has improved in Juba main markets since mid-2009. The Terms of Trade (sorghum to labour) in Dec’09 is higher by 185% and 175% compared to Jul’09 and Dec’08 due to high labour wage rates and decreased cereal prices. Also, TOT is 71% higher than 5-year average; Terms of Trade for cereal to local goat has improved due to high demand during Hajj Pilgrimage TOT is higher by 355% and 244% than Jul’09 and Dec ’08 respectively. Similarly, TOT is 35% higher than 5-year average. Own production: Good crop production; average to good livestock production due to good pasture/browse and good livestock body condition.
Coping Coping strategies: Normal coping strategies Coping strategies by poor households are: charcoal production and collection of firewood/building materials, seeking social support (zakat from crop and livestock, food in-kind or cash).

IPC Analysis Templates Overall Statements
Water access/ availability
Water Access/Availability: Increased Availability and access to water increased for all livelihoods
Destitution/ Displacement
Destitution/Displacement: Diffuse Displaced people integrated into Juba rural community. Displaced people, mainly from Mogadishu, who are heading to Kenya refugee camps, use Juba livelihoods as a transit. A number of IDPs is concentrated in Dhobley town – border town.
Livelihood Assets
Assets: Livestock holding is on increasing trend for all species and nearly or at the baseline level (cattle: 99%, camel: 103% and shoats: 93%).

IPC Summary: Retrogression of Rural IPC Situation
Key IPC Reference Outcomes: (BFI) • Acute malnutrition: Mixed Serious to very Critical
• SEP: Very Critical in affected areas during Gu ’09 improving • Juba Agro-pastoral Critical Improving • Juba Riverine Serious Improving
• Food Access: Access of food and availability are average • Water Access: Average • Destitution/Displacement: diffuse • Coping: Normal coping strategies • Livelihood Assets: Good production of Deyr’09/10, and livestock recovery in terms of body
condition and livestock production from recurrent droughts Main Causes:
• 2 Consecutive seasons of average rainfall in Juba leading to: consecutive seasons of Normal to above normal crop productions Average livestock production and increasing livestock herd size – near baseline
• Significant improvement in household income
MAP2:IPCGu2009 MAP1:IPCDeyr 2009/10 MAP3:LIVELIOODZONES

IPC Estimated Rural Population in AFLC & HE
MAP2:IPCGu2009 MAP1:IPCDeyr 2009/10 MAP3:LIVELIOODZONES
AffectedRegionsandDistrict UNDP2005RuralPopula0on
AssessedandHighRiskPopula0oninAFLCandHE GU09 Deyr2009‐10
AcuteFoodandLivelihoodCrisis
(AFLC)
HumanitarianEmergency
(HE)
AcuteFoodandLivelihoodCrisis
(AFLC)
HumanitarianEmergency
(HE) MiddleJuba Bu'aale 45,901 1,000 0 0 0
Jilib 83,464 2,000 0 0 0 Saakow/Salagle 54,773 0 0 0 0
SUB‐TOTAL 184,138 3,000 0 0 0 LowerJuba Afmadow/Xagar 44,212 3,000 0 0 0
Badhaadhe 32,828 4,000 0 0 0 Jamaame 106,734 0 0 0 0 Kismaayo 77,334 2,000 0 0 0
SUB‐TOTAL 261,108 9,000 0 0 0 GRANDTOTAL 445,246 12,000 0 0 0
TOTALAFFECTEDPOPULATIONINAFLC&HE 12,000 0

IPC Estimated Rural Population in AFLC & HE
AffectedRegionsandLivelihoodZone
Es0matedPopula0onof
AffectedLivelihoodZones
AssessedandHighRiskPopula0oninAFLCandHE GU09 Deyr2009‐10
AcuteFoodand
LivelihoodCrisis(AFLC)
HumanitarianEmergency
(HE)
AcuteFoodand
LivelihoodCrisis(AFLC)
Humanitarian
Emergency(HE)
MiddleJuba Coastalpastoral:goats&ca`le 10,984 0 0 0 0 JubaPumpIrrigatedRiv 17,297 0 0 0 0 LowerJubaAgro‐Past 8,780 0 0 0 0 South‐EastPastoral 18,232 3,000 0 0 0 SouthernAgro‐Past 46,816 0 0 0 0 SouthernInlandPast 22,725 0 0 0 0 SouthernJubaRiv 59,304 0 0 0 0
SUB‐TOTAL 184,138 3,000 0 0 0 LowerJuba Coastalpastoral:goats&
ca`le 33,354 0 0 0 0 LowerJubaAgro‐Past 70,183 3,000 0 0 0 South‐EastPastoral 38,810 6,000 0 0 0 SouthernAgro‐Past 11,637 0 0 0 0 SouthernInlandPast 50,119 0 0 0 0 SouthernJubaRiv 57,005 0 0 0 0
SUB‐TOTAL 261,108 9,000 0 0 0 GRANDTOTAL 445,246 12,000 0 0 0
TOTALAFFECTEDPOPULATIONINAFLC&HE 12,000 0

The End


![INDEX [reliefweb.int]reliefweb.int/sites/reliefweb.int/files/resources/maps_index.pdf · INDEX Index Health facility name Functional Status Health facility type Structure Type 0 1000](https://img.dokumen.tips/doc/110x75/5e89a2a5e988f11bf13a6b08/index-index-index-health-facility-name-functional-status-health-facility-type.jpg)