Embed Size (px)
Citation preview
INTERDISCIPLINARY RESEARCH PROJECT TO EXPLORE THE FUTURE OF GLOBAL FOOD AND NUTRITION SECURITY
Food and Nutrition Security Indicators: A Review .
Evita Hanie Pangaribowo Nicolas Gerber Maximo Torero
FOODSECURE working paper 05 February 2013
1
Food and Nutrition Security Indicators: A Review
Evita Hanie Pangaribowo1 (ZEF-UBO), Nicolas Gerber (ZEF-UBO) and Maximo Torero (IFPRI).
FOODSECURE working paper 04
Reviewed by:
Nathalie Francken, Andrea Guariso and Hannah Pieters (KUL)
The research leading to these results has received funding from the European Union's Seventh Framework Programme FP7/2007-2011 under Grant Agreement n° 290693 FOODSECURE.
This paper is work in progress; comments are welcome. The authors only are responsible for any omissions or deficiencies. Neither the FOODSECURE project and any of its partner organizations, nor any organization of the European Union or European Commission are accountable for the content of papers in this series.
Acknowledgement
The authors are very thankful to Doris Wiesmann for a thorough review of the paper. Her expertise in the field of food and nutrition security and its measurement greatly contributed to tighten the arguments presented in this paper. Any remaining mistakes and inconsistencies are entirely the responsibility of the authors.
1 Corresponding author: [email protected]
2
Table of Contents 1. Introduction ..................................................................................................................................... 3
2. The Development of Food and Nutrition Security Concepts and Definitions ................................. 5
2.1 Food security ............................................................................................................................. 5
2.2 Nutrition security....................................................................................................................... 6
2.3 Food Security and Nutrition ...................................................................................................... 6
2.4 Food and Nutrition Security ...................................................................................................... 6
3. Conceptual and Theoretical Frameworks for Food and Nutrition Security .................................... 7
3.1 The UNICEF Conceptual Framework of Undernutrition ............................................................ 7
3.2 A theoretical framework for FNS ............................................................................................... 9
3.3 FNS Scale: individual, household, and macro level ................................................................. 12
3.4 Data Needs for the Assessment of FNS ................................................................................... 14
4. Existing Food and Nutrition Security Indicators ............................................................................ 15
4.1 The FAO Indicator of Undernourishment (FAOIU) .................................................................. 16
4.2 The Global Hunger Index (GHI) ................................................................................................ 17
4.3 The Global Food Security Index (GFSI) .................................................................................... 17
4.4 The Poverty and Hunger Index (PHI) ....................................................................................... 19
4.5 The Hunger Reduction Commitment Index (HRCI) ................................................................. 19
4.6 Anthropometric indicators (AI) ............................................................................................... 20
4.7 The Diet Diversity Scores (DDS) ............................................................................................... 21
4.8 Medical and biomarker indicators (MBI)................................................................................. 21
5. Classification of Indicators for Assessing Food and Nutrition Security ......................................... 22
5.1 Availability ............................................................................................................................... 25
5.2 Accessibility ............................................................................................................................. 25
5.3 Utilization ................................................................................................................................ 26
5.4 Stability .................................................................................................................................... 27
5.5 Relationships and overlaps between FNS indicators .............................................................. 28
6. Recommendations for FoodSecure and conclusion ...................................................................... 31
Appendix................................................................................................................................................ 35
Abbreviations and Acronyms ................................................................................................................ 42
References ............................................................................................................................................. 43
3
Food and Nutrition Security Indicators: A Review … “the choice of indicators, their measurements, analyses, and the need for other data can be very different for inferences from research, for making public policy, or for planning or evaluating programs. There is no best indicator, best measure of an indicator, or best analysis of an indicator in a generic sense. The definition of “best” depends ultimately on what is most appropriate for the decision that must be made.” (Habicht and Pelletier 1990: 1519).
1. Introduction The EU Food Facility Program which operated between 2009 and 2011 aimed at responding rapidly to the soaring food prices in the developing countries. The program prioritized support in terms of encouraging local producers to increase food supply, mitigating the effects of volatile food prices on the local markets, and increasing the production capacity of the local agricultural sector and improving its long term management. These objectives were operationalized through several concrete measures (improved access to inputs and services, microcredits, training programs, safety nets, …), all aimed at increasing or stabilizing agricultural production, also in times of crisis and volatile markets. In this general context, where the agricultural sector faces new challenges and market conditions, the aim of this paper is to present indicators of food and nutrition security (FNS) which consider FNS outcomes, their long term or structural determinants, as well as their more immediate, short term determinants. The latter have evolved in recent times, as the crisis of 2008 and the subsequent ones have illustrated, and new indicators of the short term risks to FNS are required. Short term risks can be transitory, recurrent, or even cyclical in nature. What unifies them in our classification is the speed with which they impact on the FNS status (i.e. the notion of “immediate” determinants of FNS). The indicators presented in this paper will factor in the analysis performed under the project FoodSecure, which focuses on the FNS impacts of EU and national policies, of changes in the natural resource base and of science and technological change.
Enhancing food security and reducing undernutrition2 have been pledged since 1948 through the Universal Declaration of Human Rights. Notable progresses have been made, with improvements in the supply and production of (nutritious) food, spurred notably by a better understanding of the human impacts of undernutrition in health sciences and of the role of institutions in supporting food and nutrition security (FNS) from the socio-economists. Following the 1974 World Food Conference, the 1990 World Summit for Children and the 1996 World Food Summit (WFS), there has been extensive research and progress in identifying relevant food and nutrition indicators, sometimes also leading to uncoordinated and overlapping information systems (Dreze 1989, Wiesmann et al. 2002). Further, Wiesmann et al. (2002) pointed out that there has been a long lasting debate about
2 Of the triple burden of malnutrition, namely insufficient intake of dietary energy (hunger), micronutrient deficiencies (hidden hunger), and excess intake of dietary energy (overweight and obesity) (Pinstrup-Andersen and Watson II 2011), the focus has historically been on the first two in the case of developing economies. However the FNS reality is fast changing in several of these countries and overnutrition is and will increasingly become a more relevant concept. In this paper, we refer to undernutrition when referring to material and concepts addressing the first two burdens. Whenever possible, we use the more comprehensive term malnutrition, when the material/concepts refer to inappropriate intake of dietary energy (i.e. insufficient and/or excessive) or micronutrient deficiencies. In the context of FoodSecure, malnutrition and its three burdens should be targeted as much as possible, and we seek to reflect this with our set of indicators.
4
indicators, their measurement error and limited reliability (Svedberg 1998, Bardhan and Klasen 1999). Nonetheless, indicators were (and still are) needed to monitor progress in achieving the set goals of food and nutrition security. As endorsed by the WFS, governments should establish mechanisms to collect information on the nutritional status of all members of the communities, especially the poor, women, children and members of vulnerable and disadvantaged groups, to monitor and improve their household-level food security (FAO 1996). Countries should also be capable of selecting indicators appropriate to each situation and specific purpose.
Implementing food and nutrition policies or interventions requires information on the following aspects: on the current absolute and relative status and evolution of FNS, on the causes of change in FNS, on the possible actions and possible impacts of those actions, and finally on monitoring and evaluating the actions and their effective impacts to assure cost effectiveness and therefore set priorities for future actions. To develop this information base, the relevant instruments need to be available (de Haen et al. 2011). These instruments / indicators provide a detailed description, numerical or not, of observable variables or interactions of variables relevant to the FNS status, risks, and their drivers. The list of indicators evolved in parallel with the food and nutrition security concepts detailed in the next section. An extensive number of FNS indicators is available, but they are distributed across various disciplines. The selection of food and nutrition security indicators to screen, diagnose and evaluate interventions at individual and household level hence needs to be coordinated across these disciplines.
The selection of FNS indicators (status and drivers) should also make reference to the time scale and geographical pattern of FNS outcomes. For instance, one can distinguish between structural / mid and long term and short term risks to the FNS status, at household, regional or national level. As an example, the recent food price changes have become the focus of attention from the policy makers both at the national and global level. The steep rise of food prices in 2007-08 has led to several difficulties particularly for the poor as some studies have shown an important reduction in calorie intake and an increase in poverty rates in general (Webb 2010). Although high food prices can have positive as well as negative welfare effects, depending on the target groups or the time horizon of the analysis (e.g. net food buyers versus sellers, short term versus long term impacts) (Swinnen, 2011), the episode of high and volatile food prices of 2007-08 has definitely slowed down progress in terms of decreased malnutrition (von Braun and Tadesse 2012) and hampered achievements in the fight against food insecurity. Specifically, price volatility also has significant effects on food producers and consumers. Greater price volatility can lead to greater potential losses for producers because it implies price changes that are larger and faster than what producers can adjust to. Uncertainty about prices makes it more difficult for farmers to make sound decisions about how and what to produce. For example, which crops should they produce? Should they invest in expensive fertilizers and pesticides? Should they pay for high-quality seeds? Without a good idea of how much they will earn from their products, farmers may become more pessimistic in their long-term planning and dampen their investments in areas that could improve their productivity. The positive relationship between price volatility and producers‘ expected losses can be modeled in a simple profit maximization model assuming producers are price takers. Still, it is important to mention that there is no uniform empirical evidence of the behavioral response of producers to volatility. By reducing supply, such a response could lead to higher prices, which in turn would hurt consumers (Torero, 2012). In view of volatile food prices, indicators of transitory and cyclical FNS should be taken into account. In such situations of food insecurity caused by a sudden drop of purchasing power and access to food,
5
indicators should provide information about the immediate needs for essential nutrients derived from specific food commodities.
As the problems of food and nutrition insecurity are currently more complex, identifying and choosing relevant indicators is crucial. The objectives of this paper are threefold. First, this paper will include a critical review of existing concepts and indicators which could be used for the development of food and nutrition indicators. The main need is to go beyond the state-of-the-art because current FNS indicators (whether single or composite indicators) do not account for the short term economic shocks which have been identified as key factors for food and nutrition security. Second, this paper aims to make the food and nutrition security concepts operational. As the nature of food and nutrition security status is different between short term and long term causes, there is a need to differentiate between long term and short term indicators to design policy responses. Third, this paper also assesses the existing indicators and their methodological and data related problems and then extends FNS indicators by taking into account dimensions that have been ignored or undervalued. In particular, this paper will emphasize the gender issues in FNS and the gender related FNS status and risk indicators.
2. The Development of Food and Nutrition Security Concepts and Definitions
Over the last three decades, several conceptual frameworks have been developed to define food security and nutrition and their nexus. Even though the linkage of food security and nutrition is clear from the technical perspective, the definition of food security and nutrition has evolved due to challenges in reaching an agreement on the political acceptability of and commitment to the definition. The evolution of the terminology can be summarized as follows:
2.1 Food security The concept and definition of food security have changed since the first introduction of the concept in the early 1940s3. In the 1970s, the definition of food security was developed from the perspective of food-supply to ensure that all people everywhere have enough food to eat. The importance of consumption and access has been put forward through the concept of entitlement (Sen 1981). In his renowned work, Sen highlighted that food related problems are influenced not only by food production and agricultural activities, but also by the structure and processes governing entire economies and societies. Following his view, food insecurity has been caused not only by scarcity but also by institutional failures that led to suboptimal food distribution. Therefore, multisectoral planning was introduced to tackle food insecurity. Within this global strategy, one can distinguish between strategies of growth-mediated security and strategies of support-led security (Dreze and Sen 1989, von Braun et al. 1992). The current terminology in use, as adopted from the 1996 World Food Summit, emphasizes the multidimensionality of food security: food security exists when all people at all times have physical and economic access to sufficient, safe and nutritious food to meet 3 The basic concepts underlying the terms “food security” and “nutrition security” as we know them today were articulated in the early 1940s during World War II. In 1943, forty-four forward looking governments met in Hot Springs, Virginia, USA, to consider the goal of freedom from want in relation to food and agriculture. They concluded that “freedom from want” meant a secure, adequate and suitable supply of food for every man, woman and child, where “secure” referred to the accessibility of the food, “adequate” referred to the quantitative sufficiency of the food supply and “suitable” referred to the nutrient content of the food supply (CFS, 2012) http://www.fao.org/docrep/meeting/026/MD776E.pdf.
6
their dietary needs and food preferences for an active and healthy life (FAO 2000). This definition has widely established the four pillars of food security: availability, accessibility, utilization and stability.
2.2 Nutrition security The term of nutrition security emerged with the recognition of the necessity to include nutritional aspects into food security. Unlike food that is mostly defined as any substance that people eat and drink to maintain life and growth, nutrition adds the aspects of health services, healthy environment and caring practices. More precisely, …“a person is considered nutrition secure when she or he has a nutritionally adequate diet and the food consumed is biologically utilized such that adequate performance is maintained in growth, resisting or recovering from disease, pregnancy, lactation and physical work”… (Frankenberger et al. 1997, p.1).. Articles published in a special series of The Lancet4 pointed out that nutrition was regarded as one of the most important parts in development priorities but underemphasized by both donor and developing countries. This notion is now widely shared and triggered a broad framework for collective action among key stakeholders. Based on the initiative of these stakeholders through the Road Map for Scaling-Up Nutrition (2010)5, nutrition security is deemed to be achieved when secure access to an appropriately nutritious diet is coupled with a sanitary environment, adequate health services and care, to ensure a healthy and active life for all household members. Recently, FAO has defined nutrition security as a condition when all people at all times consume food of sufficient quantity and quality in terms of variety, diversity, nutrient content and safety to meet their dietary needs and food preferences for an active and healthy life, coupled with a sanitary environment, adequate health and care (CFS 2012).
2.3 Food Security and Nutrition In light of combining the two concepts above, the term “food security and nutrition” is used in the Committee on World Food Security (CFS) Reform Document6. The term of food security and nutrition has been commonly used by many UN institutions, typically to represent actions. The notion behind the terminology of food security and nutrition is the emphasis on the importance of the complementarity and overlaps between food security and nutrition. Yet the notion of nutrition security, i.e. that nutrition can be at risk, is absent for these relationships.
2.4 Food and Nutrition Security The term of food and nutrition security is used to combine the aspects of food security and of nutrition security, as well as to point to the idea that they are related. The use of the term “food and nutrition security” has become common practice in a number of international agencies such as IFPRI, UNICEF and FAO. In particular, IFPRI has used this term since the mid-1990s (CFS 2012). The UN
4 January-February 2008, Volume 371, No. 9608-9612, The Lancet, special five paper series on “Maternal and Child Undernutrition”. 5 The Scaling-Up Nutrition (SUN) is a collaborative process that began in 2009 with the development of Scale Up Nutrition Framework. The framework was developed by a group of stakeholders from governments, donor agencies, the civil society, the research community, the private sector, intergovernmental organizations, and development banks. The goal of the Road Map for SUN is to reduce hunger and under-nutrition and contribute to the achievement of all the Millennium Development Goals particularly on MDG 1 – halving poverty and hunger by the year 2015. 6 The CFS was set up in 1974 as an intergovernmental body with the purpose of reviewing and following up food security policies. Part of the CFS, The High Level Panel of Experts on Food Security and Nutrition (HLPE) was established in October 2009.
7
System of High Level Task Force on Global Food Security (HLTF) also used this term in their Comprehensive Framework for Action (CFA). The framework defined food and nutrition security as a condition when all people, at all times, have physical, social and economic access to sufficient, safe, and nutritious food which meets their dietary needs and food preferences for an active and healthy life. Weingärtner (2010) further developed a definition of food and nutrition security as a condition under which adequate food (quantity, quality, safety, socio-cultural acceptability) is available and accessible for and satisfactorily utilized by all individuals at all times to live a healthy and happy life. As the term of food and nutrition security has combined both security concepts in a more integrated way as a single goal of policy, this term is more widely used.
3. Conceptual and Theoretical Frameworks for Food and Nutrition Security
To discuss the indicators of FNS, this study uses a framework developed by UNICEF. In addition, this section discusses a number of simple economic models of food and nutrition security (FNS) status that provide a starting point to decide on the appropriate indicators.
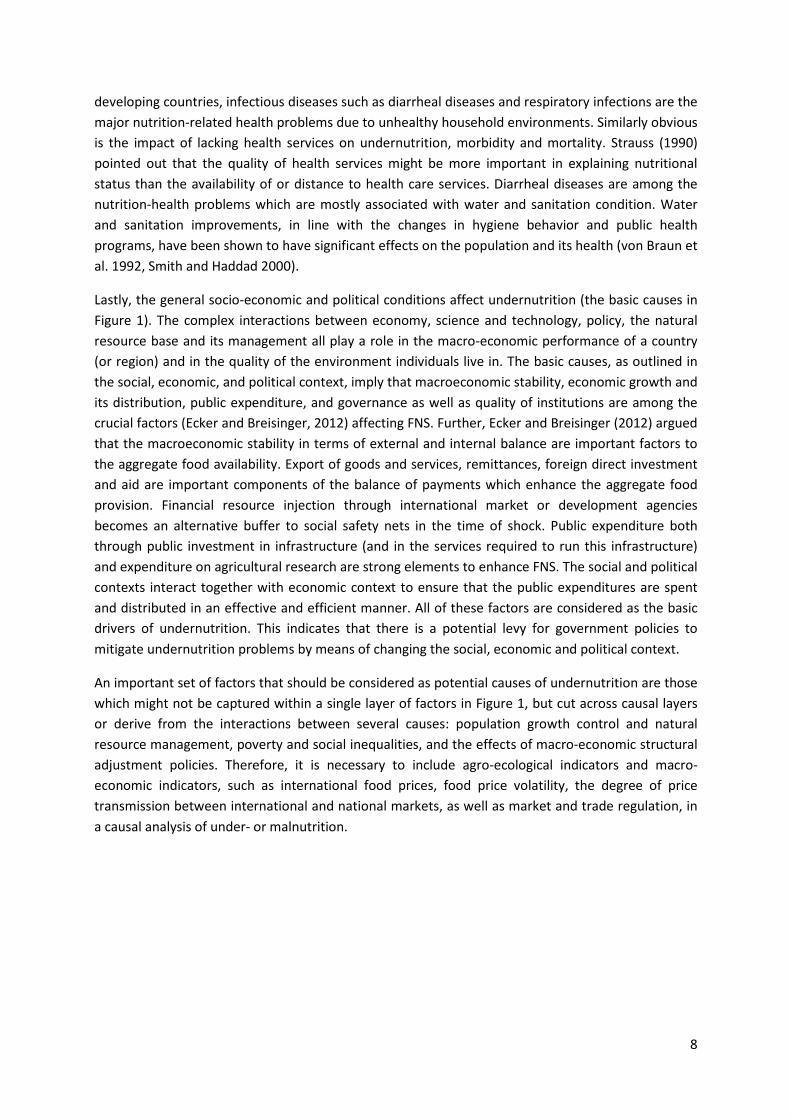
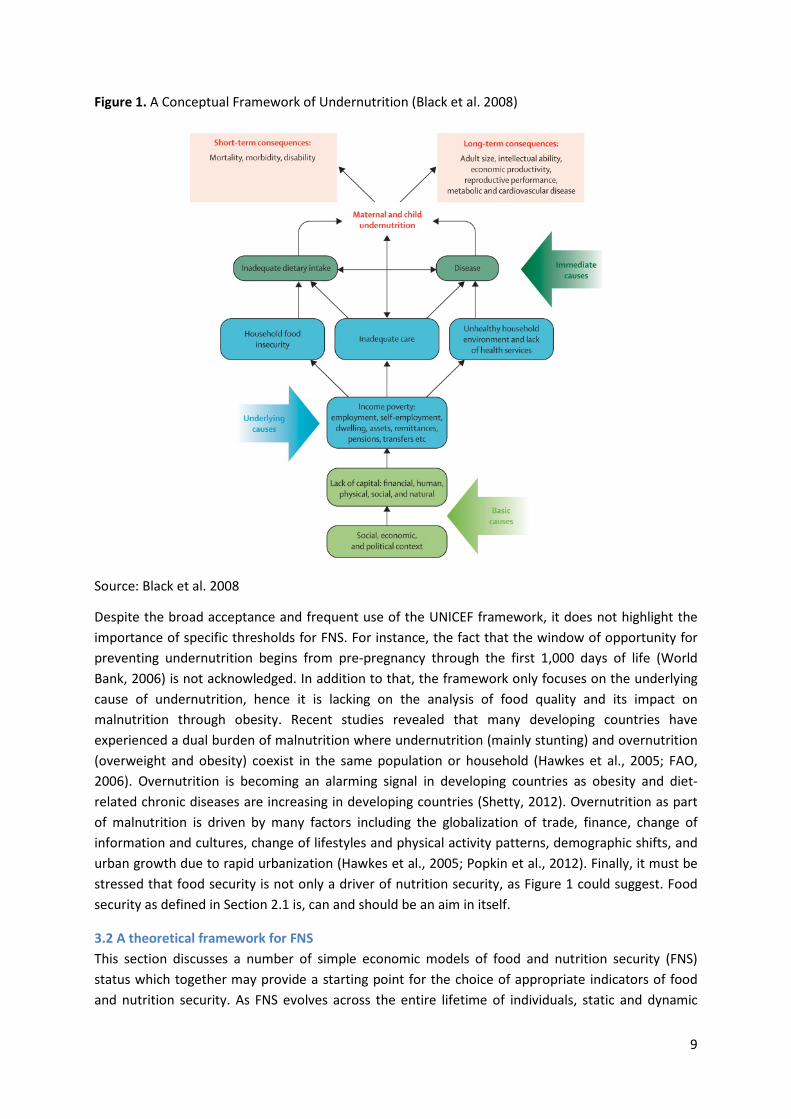
3.1 The UNICEF Conceptual Framework of Undernutrition The FNS framework developed by UNICEF recognizes three levels of determinants of undernutrition: the basic, underlying and immediate causes of undernutrition (See Figure 1 below). The immediate causes of the nutritional status at the level of the individual human being are dietary intake and health status. The two factors are interlinked: dietary intake should meet a certain threshold in terms of quantity and quality, nutrient intake should be balanced in terms carbohydrates, protein and fat (macronutrients) and vitamins and minerals (micronutrients) and appropriately absorbed in the human body. As an example of the interdependence, loss of appetite is a common consequence of infection and sickness which might further reduce dietary intake. At the household level, the dietary intake of specific individuals involves two major issues: what food is being served on the table (household food demand) and who is to eat it (intra-household food distribution) (Weingärtner 2010). Other aspects such as habits and knowledge about food processing and feeding practices (all of which are shared at the household level) influence the diet composition of the individuals as well as their biological utilization of the food.
In addition to the immediate causes of the individual nutritional status, three other factors are at play. These are household food insecurity (in terms of availability and access), inadequate care, lack of (quality) health services, and an unhealthy environment. These three factors result from the set of underlying causes of undernutrition, broadly labeled as income poverty in Figure 1. Household food security is a direct prerequisite for adequate dietary intake at the individual’s level. The condition of sufficient intake which is adequate for physiological development supports the food utilization7. These aforementioned factors emphasize the importance of caring practices such as child feeding and health seeking behaviours, support for mothers during pregnancy and lactation, and mothers’ autonomy in household decision making, particularly in health and nutrition related issues (Quisumbing et al. 1995, Smith and Haddad 2000). Women’s capacity and autonomy in the households are frequently hampered by cultural and institutional aspects. The impacts of unhealthy environments as underlying factors of the immediate causes of undernutrition are obvious. In
7 See Campbell (1991) for the debate whether food insecurity is a nutritional outcome or a predictor variable.
8
developing countries, infectious diseases such as diarrheal diseases and respiratory infections are the major nutrition-related health problems due to unhealthy household environments. Similarly obvious is the impact of lacking health services on undernutrition, morbidity and mortality. Strauss (1990) pointed out that the quality of health services might be more important in explaining nutritional status than the availability of or distance to health care services. Diarrheal diseases are among the nutrition-health problems which are mostly associated with water and sanitation condition. Water and sanitation improvements, in line with the changes in hygiene behavior and public health programs, have been shown to have significant effects on the population and its health (von Braun et al. 1992, Smith and Haddad 2000).
Lastly, the general socio-economic and political conditions affect undernutrition (the basic causes in Figure 1). The complex interactions between economy, science and technology, policy, the natural resource base and its management all play a role in the macro-economic performance of a country (or region) and in the quality of the environment individuals live in. The basic causes, as outlined in the social, economic, and political context, imply that macroeconomic stability, economic growth and its distribution, public expenditure, and governance as well as quality of institutions are among the crucial factors (Ecker and Breisinger, 2012) affecting FNS. Further, Ecker and Breisinger (2012) argued that the macroeconomic stability in terms of external and internal balance are important factors to the aggregate food availability. Export of goods and services, remittances, foreign direct investment and aid are important components of the balance of payments which enhance the aggregate food provision. Financial resource injection through international market or development agencies becomes an alternative buffer to social safety nets in the time of shock. Public expenditure both through public investment in infrastructure (and in the services required to run this infrastructure) and expenditure on agricultural research are strong elements to enhance FNS. The social and political contexts interact together with economic context to ensure that the public expenditures are spent and distributed in an effective and efficient manner. All of these factors are considered as the basic drivers of undernutrition. This indicates that there is a potential levy for government policies to mitigate undernutrition problems by means of changing the social, economic and political context.
An important set of factors that should be considered as potential causes of undernutrition are those which might not be captured within a single layer of factors in Figure 1, but cut across causal layers or derive from the interactions between several causes: population growth control and natural resource management, poverty and social inequalities, and the effects of macro-economic structural adjustment policies. Therefore, it is necessary to include agro-ecological indicators and macro-economic indicators, such as international food prices, food price volatility, the degree of price transmission between international and national markets, as well as market and trade regulation, in a causal analysis of under- or malnutrition.
9
Figure 1. A Conceptual Framework of Undernutrition (Black et al. 2008)
Source: Black et al. 2008
Despite the broad acceptance and frequent use of the UNICEF framework, it does not highlight the importance of specific thresholds for FNS. For instance, the fact that the window of opportunity for preventing undernutrition begins from pre-pregnancy through the first 1,000 days of life (World Bank, 2006) is not acknowledged. In addition to that, the framework only focuses on the underlying cause of undernutrition, hence it is lacking on the analysis of food quality and its impact on malnutrition through obesity. Recent studies revealed that many developing countries have experienced a dual burden of malnutrition where undernutrition (mainly stunting) and overnutrition (overweight and obesity) coexist in the same population or household (Hawkes et al., 2005; FAO, 2006). Overnutrition is becoming an alarming signal in developing countries as obesity and diet-related chronic diseases are increasing in developing countries (Shetty, 2012). Overnutrition as part of malnutrition is driven by many factors including the globalization of trade, finance, change of information and cultures, change of lifestyles and physical activity patterns, demographic shifts, and urban growth due to rapid urbanization (Hawkes et al., 2005; Popkin et al., 2012). Finally, it must be stressed that food security is not only a driver of nutrition security, as Figure 1 could suggest. Food security as defined in Section 2.1 is, can and should be an aim in itself.
3.2 A theoretical framework for FNS This section discusses a number of simple economic models of food and nutrition security (FNS) status which together may provide a starting point for the choice of appropriate indicators of food and nutrition security. As FNS evolves across the entire lifetime of individuals, static and dynamic
10
models of food and nutrition status are discussed in this section. This section ends with a discussion of the model’s implications for appropriate data to assess FNS.
Unlike in the case of health issues, models of the production of FNS are still limited. The broad and multidimensional concept of FNS might be one of the underlying reasons for the lack of a theoretical model framework of FNS. However, as the FNS concept is closely associated with health, FNS models presented in this section are derived from the existing framework of health production functions (Schultz 1984, Strauss 1986, Strauss and Thomas 1995, 1998, 2007). The variables involved in the FNS models are mostly based on the UNICEF framework (Figure 1).
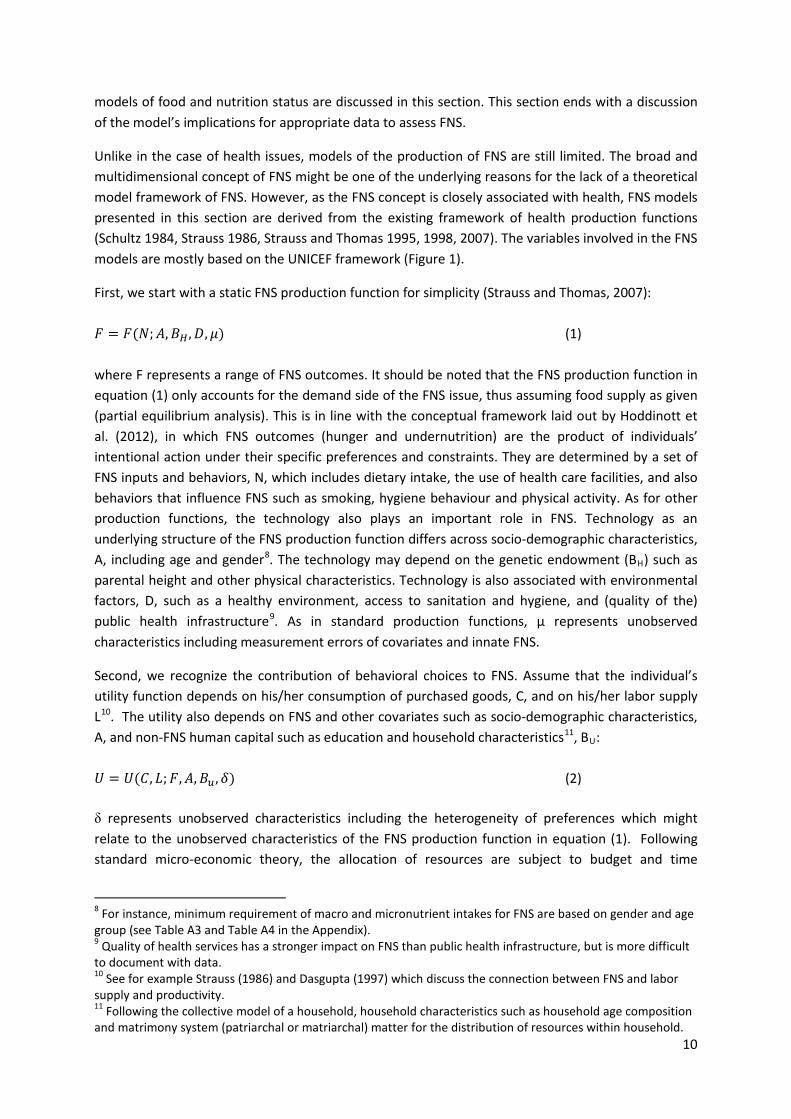
First, we start with a static FNS production function for simplicity (Strauss and Thomas, 2007): 𝐹 = 𝐹(𝑁;𝐴,𝐵𝐻 ,𝐷, 𝜇) (1) where F represents a range of FNS outcomes. It should be noted that the FNS production function in equation (1) only accounts for the demand side of the FNS issue, thus assuming food supply as given (partial equilibrium analysis). This is in line with the conceptual framework laid out by Hoddinott et al. (2012), in which FNS outcomes (hunger and undernutrition) are the product of individuals’ intentional action under their specific preferences and constraints. They are determined by a set of FNS inputs and behaviors, N, which includes dietary intake, the use of health care facilities, and also behaviors that influence FNS such as smoking, hygiene behaviour and physical activity. As for other production functions, the technology also plays an important role in FNS. Technology as an underlying structure of the FNS production function differs across socio-demographic characteristics, A, including age and gender8. The technology may depend on the genetic endowment (BH) such as parental height and other physical characteristics. Technology is also associated with environmental factors, D, such as a healthy environment, access to sanitation and hygiene, and (quality of the) public health infrastructure9. As in standard production functions, µ represents unobserved characteristics including measurement errors of covariates and innate FNS.
Second, we recognize the contribution of behavioral choices to FNS. Assume that the individual’s utility function depends on his/her consumption of purchased goods, C, and on his/her labor supply L10. The utility also depends on FNS and other covariates such as socio-demographic characteristics, A, and non-FNS human capital such as education and household characteristics11, BU: 𝑈 = 𝑈(𝐶, 𝐿;𝐹,𝐴,𝐵𝑢,𝛿) (2) δ represents unobserved characteristics including the heterogeneity of preferences which might relate to the unobserved characteristics of the FNS production function in equation (1). Following standard micro-economic theory, the allocation of resources are subject to budget and time
8 For instance, minimum requirement of macro and micronutrient intakes for FNS are based on gender and age group (see Table A3 and Table A4 in the Appendix). 9 Quality of health services has a stronger impact on FNS than public health infrastructure, but is more difficult to document with data. 10 See for example Strauss (1986) and Dasgupta (1997) which discuss the connection between FNS and labor supply and productivity. 11 Following the collective model of a household, household characteristics such as household age composition and matrimony system (patriarchal or matriarchal) matter for the distribution of resources within household.
11
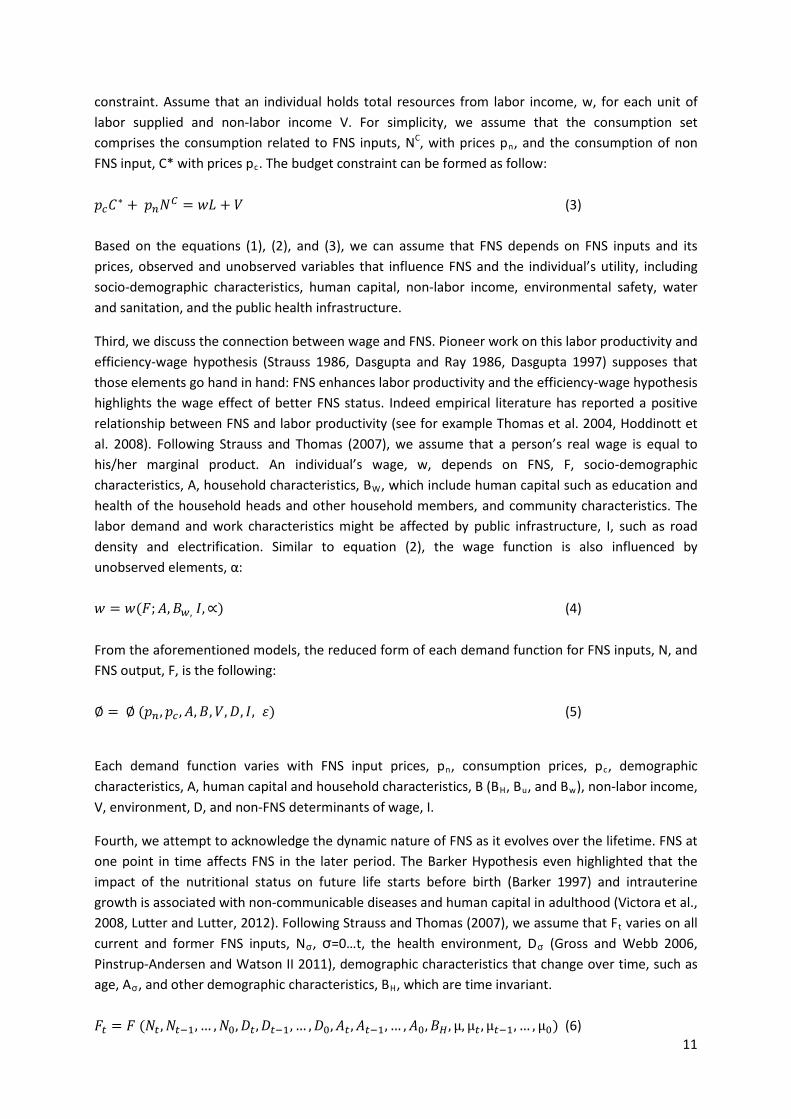
constraint. Assume that an individual holds total resources from labor income, w, for each unit of labor supplied and non-labor income V. For simplicity, we assume that the consumption set comprises the consumption related to FNS inputs, NC, with prices pn, and the consumption of non FNS input, C* with prices pc. The budget constraint can be formed as follow: 𝑝𝑐𝐶∗ + 𝑝𝑛𝑁𝐶 = 𝑤𝐿 + 𝑉 (3) Based on the equations (1), (2), and (3), we can assume that FNS depends on FNS inputs and its prices, observed and unobserved variables that influence FNS and the individual’s utility, including socio-demographic characteristics, human capital, non-labor income, environmental safety, water and sanitation, and the public health infrastructure.
Third, we discuss the connection between wage and FNS. Pioneer work on this labor productivity and efficiency-wage hypothesis (Strauss 1986, Dasgupta and Ray 1986, Dasgupta 1997) supposes that those elements go hand in hand: FNS enhances labor productivity and the efficiency-wage hypothesis highlights the wage effect of better FNS status. Indeed empirical literature has reported a positive relationship between FNS and labor productivity (see for example Thomas et al. 2004, Hoddinott et al. 2008). Following Strauss and Thomas (2007), we assume that a person’s real wage is equal to his/her marginal product. An individual’s wage, w, depends on FNS, F, socio-demographic characteristics, A, household characteristics, BW, which include human capital such as education and health of the household heads and other household members, and community characteristics. The labor demand and work characteristics might be affected by public infrastructure, I, such as road density and electrification. Similar to equation (2), the wage function is also influenced by unobserved elements, α: 𝑤 = 𝑤(𝐹;𝐴,𝐵𝑤, 𝐼,∝) (4) From the aforementioned models, the reduced form of each demand function for FNS inputs, N, and FNS output, F, is the following: ∅ = ∅ (𝑝𝑛,𝑝𝑐 ,𝐴,𝐵,𝑉,𝐷, 𝐼, 𝜀) (5)
Each demand function varies with FNS input prices, pn, consumption prices, pc, demographic characteristics, A, human capital and household characteristics, B (BH, Bu, and Bw), non-labor income, V, environment, D, and non-FNS determinants of wage, I.
Fourth, we attempt to acknowledge the dynamic nature of FNS as it evolves over the lifetime. FNS at one point in time affects FNS in the later period. The Barker Hypothesis even highlighted that the impact of the nutritional status on future life starts before birth (Barker 1997) and intrauterine growth is associated with non-communicable diseases and human capital in adulthood (Victora et al., 2008, Lutter and Lutter, 2012). Following Strauss and Thomas (2007), we assume that Ft varies on all current and former FNS inputs, Nσ, σ=0…t, the health environment, Dσ (Gross and Webb 2006, Pinstrup-Andersen and Watson II 2011), demographic characteristics that change over time, such as age, Aσ, and other demographic characteristics, BH, which are time invariant. 𝐹𝑡 = 𝐹 (𝑁𝑡 ,𝑁𝑡−1, … ,𝑁0,𝐷𝑡,𝐷𝑡−1, … ,𝐷0,𝐴𝑡 ,𝐴𝑡−1, … ,𝐴0,𝐵𝐻 , µ, µ𝑡 ,µ𝑡−1, … , µ0) (6)
12
The dynamic model of FNS over the lifetime reflects the notion that FNS progresses with economic variables. This model also shows the basic mechanics of the nutrition-based poverty trap. For instance, existing literature mentioned above revealed that undernutrition in the womb affects children’s future development and nutritional status, perpetuating poor nutrition and development prospects over time. Further, undernourished children tend to become short adults, to have lower educational achievement, to give birth to smaller infants, showing a vicious circle of FNS problems over the life time and into the next generation. The analysis of FNS over time is also important to understand the long term and short term nature of FNS problems. For instance, long term (structural) FNS problems are partly a result of stagnant economic progress over time or lasting social, political and cultural factors such as gender discrimination or the governments’ failure to provide public services (education, health, etc.). All these aspects should be taken into consideration to set the guidelines in choosing the appropriate indicators of FNS.
In the dynamic model of FNS, a number of risk factors are at play, with small-holder farmers representing the most vulnerable group. This group also represents a sizeable share of the total population under FNS risks and of total domestic food supply in many developing countries. These are some of the reasons why the agricultural sector in most of the developing countries holds many of the keys to national FNS. This is generally true, despite the fact that the sector is highly differentiated and that heightened risks, uncertainties and new barriers to FNS keep appearing (Conway 2012). The risks can be classified into two components (Karlan and Appel 2011). First, there are environmental risks that all farmers encounter such as drought, floods, insect attacks, and others. Second, there are risks stemming from limited information, lack of access to profitable markets, and volatility in commodity prices. In this regard, risks and uncertainties should also be considered as FNS indicators. The characteristics of risks are clearly explained by Stirling (1998, 2007) in terms of probability or likelihood of events and outcomes. The state of risks should inherently be captured by technical early warning systems, mitigation strategies and evaluation. Risky events can be captured better in a given specified level of probability or confidence interval (Scaramozzino, 2006) rather than being presented in a fixed metric. For a better understanding of FNS and for improved FNS status, the risk indicators (with associated probabilities and likelihood) should be included in the FNS analysis.
3.3 FNS Scale: individual, household, and macro level The aforementioned theoretical framework mostly focused on the individual’s FNS. However, FNS outcomes are ultimately a product of decisions at the household level. Following the collective model of household behavior, household members have different preferences (Alderman et al. 1995). At the household level, research has revealed the effects of intra-household bias on food distribution (Haddad et al. 1996) and pro-male and pro-adult biases have been found to affect food intake (Senauer et al. 1988, Quisumbing and Maluccio 2003)12. Combined with the physiological requirements of the different groups (women of reproductive age and children require more
12 Quisumbing and Maluccio (2003) further mentioned that in many households women and children do not receive enough food despite the fact that household calorie intake is well above normal. Disaggregated statistics illustrated that the impact of FNS shocks were largely concentrated on children and women (Quisumbing and McClafferty 2005). The impact of the South-east Asian financial crisis (1997-1999) reported that mothers buffered children’s calorie intake, amplifying maternal wasting. Changes in consumption of micronutrient-rich foods further resulted in increased prevalence of anemia for mothers and children (Block et al. 2004).
13
micronutrients per calories consumed), such bias can lead to a higher prevalence of micronutrient deficiency among women and children. Other work has suggested that parents tend to protect their children from shortfalls in food intake, and that men are actually more affected by seasonal undernutrition than women (Ferro-Luzzi et al. 2001).
In the macro context, the basic goals of developing countries are related to productivity growth and to achieving a more equal distribution of consumption. Better FNS status of individuals might be one of the key routes to achieving the goal. Similarly to health research, there is voluminous evidence that the FNS status is positively linked with economic prosperity (e.g. Hoddinott et al. 2008). The nutritional status as represented by height and body mass index (BMI) is found to be a significant covariate of economic success (Thomas and Frankenberg, 2002)13. Further, Thomas and Frankenberg (2002) pointed out that in most observational studies, energy intake and diet quality is also a significant predictor of economic prosperity.
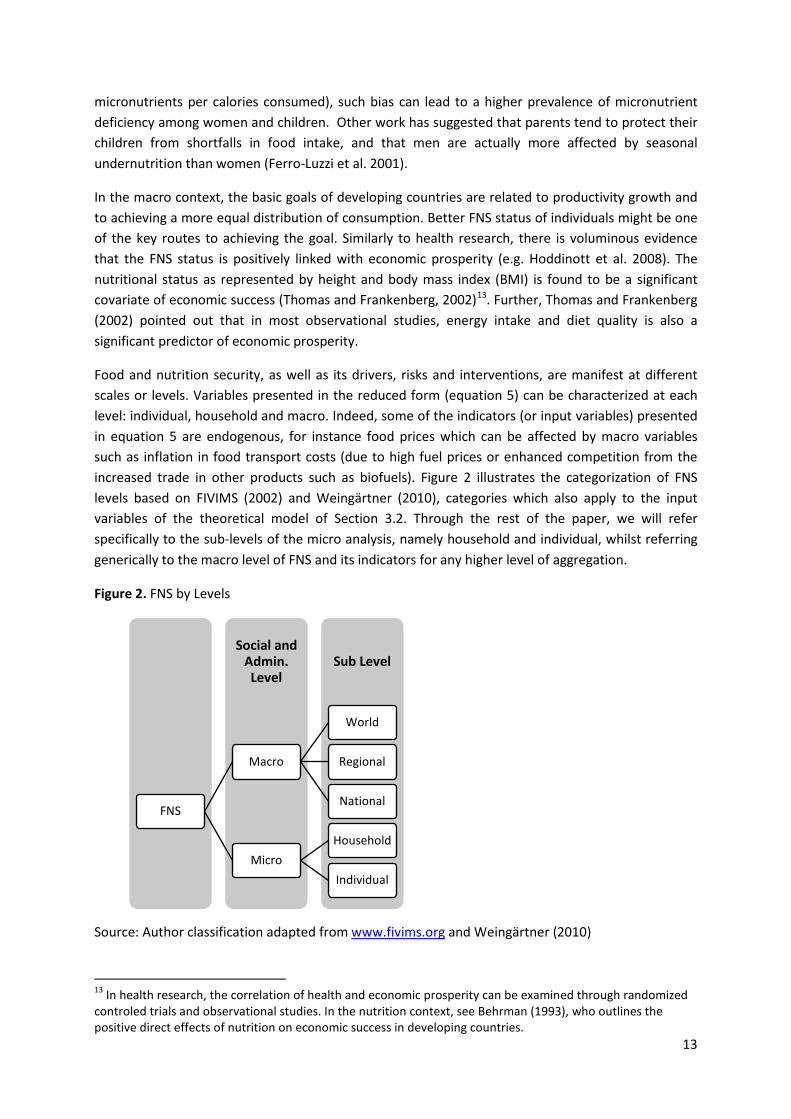
Food and nutrition security, as well as its drivers, risks and interventions, are manifest at different scales or levels. Variables presented in the reduced form (equation 5) can be characterized at each level: individual, household and macro. Indeed, some of the indicators (or input variables) presented in equation 5 are endogenous, for instance food prices which can be affected by macro variables such as inflation in food transport costs (due to high fuel prices or enhanced competition from the increased trade in other products such as biofuels). Figure 2 illustrates the categorization of FNS levels based on FIVIMS (2002) and Weingärtner (2010), categories which also apply to the input variables of the theoretical model of Section 3.2. Through the rest of the paper, we will refer specifically to the sub-levels of the micro analysis, namely household and individual, whilst referring generically to the macro level of FNS and its indicators for any higher level of aggregation.
Figure 2. FNS by Levels
Source: Author classification adapted from www.fivims.org and Weingärtner (2010)
13 In health research, the correlation of health and economic prosperity can be examined through randomized controled trials and observational studies. In the nutrition context, see Behrman (1993), who outlines the positive direct effects of nutrition on economic success in developing countries.
Sub Level Social and
Admin. Level
FNS
Macro
World
Regional
National
Micro Household
Individual
14
At the macro level, FNS generally refers to the capacity of a country (region) to provide food and nutrition for its population. At this scale, FNS is a combined interaction between demographic, socioeconomic, biophysical, and political factors and the international environment (Pinstrup-Andersen and Watson II 2011). Food provision can be achieved through self-sufficient production, imports, and food aid. Naturally, these three elements are interdependent and their determinants are multiple. For instance, the international economic environment influences domestic production: the IFPRI IMPACT model showed that the global economic recession, through reduced economic growth, negatively impacts agricultural investment, although agricultural research and development is one of the most effective types of investment in reducing food and nutrition insecurity as well as poverty (von Braun, 2008). The IMPACT model also examines the alternative scenarios of global food supply and demand, trade, prices, and food security along with the changing climate, trends in bioenergy production, population predictions, and the evolution of food preferences14 (Rosegrant et al., 2001). In terms of global food trade, the interaction between energy and agricultural markets remains highly relevant. Agricultural production in developing countries is significantly affected by the emergence of biofuels in the US, Brazil, and the EU. Price changes due to the global biofuels expansion will also change the world agricultural production and trade (Huang et al. 2012), as food and biofuels compete for a constrained input base. Finally, food aid both for emergency relief or addressing food deficits is one of the major components of food security strategies in developing countries (del Ninno et al., 2007). Nevertheless, it is argued that food aid as alternative strategy of food supply has some drawbacks and minimal impact on development: food aid is generally subject to high cost of procurement (including high storage, transport and distribution costs) and poor targeting (Jayne et al., 2001; Francken et al., 2012). More importantly, food aid might become a source of food insecurity as it may create disincentives for domestic production through the low price competitiveness of domestic food commodities, leading to unfavorable public and private investment (del Ninno et al., 2007). For all the reasons mentioned in this paragraph, macro indicators of trade openness, price transmission mechanisms, demographic change, political stability, climate variability are also pertinent as indicators of macro-level FNS risks.
3.4 Data Needs for the Assessment of FNS As FNS covers a complex set of concepts and dynamics, it is unavoidable that the data required for an FNS assessment captures the multidimensional aspects of FNS. The data should be accurate and timely particularly for the purpose of evidence-based policy. Data collection for FNS needs to cover macro and micronutrient intake, anthropometric/biomarker indicators at the population, household, and individual level (Fan 2012). Individual and household surveys offer depth measures of FNS (i.e. how severe food and nutrition insecurity is), with trade-offs in terms of higher costs of collection. At the household and individual level, the need for longitudinal data is inevitable in assessing FNS and its dynamics over the lifetime of individuals. There has been an extensive effort of household surveys in this area (O’Donnell et al. 2008), for instance Demographic and Health Surveys (DHS), The Living Standard Measurement Study, UNICEF multiple indicator cluster surveys (MICS), RAND Surveys (Indonesian Family Life Survey, Malaysian Family Life Surveys, Matlab Health and Socioeconomic Survey), and University of North Carolina Surveys (Cebu Longitudinal Health and Nutrition Surveys and China Health and Nutrition Survey). At the macro level, DHS and MICS provide the basis for aggregate data at the national level. However, the different survey years across countries limit cross-
14 In developing Asia for instance, the composition of cereal demand is altered through the rising incomes and rapid urbanization (Rosegrant et al. 2012).
15
country analysis. Adequate time or multiple series of data at macro level should be available across countries. Frankenberg (1995) stated that at the macro level (national or regional level), data related to food supply such as food production as well as anthropometric measures are mostly used. Finally, the quality of data is also paramount which requires regular and inclusive data collection. For instance, collecting data on food expenditures is subject to measurement error of recall of food consumption data.
The conceptual framework, the models and type of data presented above are the foundation to construct FNS indicators. The indicators should encompass the basic, underlying and immediate cause of FNS as presented in the UNICEF conceptual framework. Indicators and data are two inseparable elements. There are now quality data available for developing countries to support better FNS assessment (O’Donnell et al. 2008, Banerjee and Duflo 2011), even though some limitations remain. Demographic and health surveys (DHS) might be the major source of nationally representative data that can be used for FNS outcomes, but the harmonization of data collection across countries remains an issue, as well as time series availability15.
4. Existing Food and Nutrition Security Indicators An indicator should reflect a given situation or an underlying reality which is difficult to quantify directly, and usually gives an order of magnitude on a given scale. There is no best indicator, best measure of an indicator, or best analysis of an indicator in a generic sense (Habicht and Pelletier 1990). In general, the more complex the phenomenon to be reflected, the greater the need for a range of indicators; for example, a group’s health status cannot be assessed by a single indicator. This notion also applies to FNS indicators and Barrett (2010) mentioned that the FNS concept is elusive. This means that a single indicator cannot summarize the complexity of FNS and therefore a set of indicators (whether compiled into an index or not) must be built in order to capture all the dimensions of FNS. When analyzing the impact of different factors on FNS, the impact assessment can then be performed on each single indicator in the set, or on the composite index of FNS. The problem with bundling single indicators into composite indexes of FNS is that it requires weighing the single indicators in one way or another. Simple weights allow for an easy understanding (i.e. each single indicator weighted equally), whilst more complex weighing methods might be justified theoretically or empirically but increase the difficulty in terms of interpretation of the indices and their changes. Ultimately, the choice of weights and weighting method is a value judgment 16.
Indicator should be chosen in such a way that they meet a range of desirable properties. Some of the properties are based on the policy relevance of the indicators (the indicator should be credible – i.e. rooted in a solid conceptual and theoretical framework, rapidly available, communicable to the end users and consistently aimed at answering a given set of policy questions), while others are based on scientific criteria (Eele 1994, Nübler 1995, Wiesmann 2004). The latter include robustness to changes in parameters and to measurement errors, and a right balance of stability and sensitivity, in order to report change without signaling to excess (Wiesmann et al. 2004). In the technical aspects of 15 DHS have been implemented in more than 80 countries since 1984 and covered large sample sizes (usually between 5,000 and 30,000 in each survey). To date, more than 210 surveys have been completed. DHS are normally conducted every 5 to 10 years but the implementation years vary across countries. To achieve comparable data across countries, standard model questionnaires have been developed and a country should apply the questionnaire in its entirety with the possibility of additional questions of particular interest. 16 This discussion is developed in Wiesmann (2006).
16
collecting relevant data for an indicator, particularly concerning the cost of collection, Chambers (1990) proposes principles of ‘optimal ignorance’ – not collecting data more than absolutely needed, and ‘appropriate imprecision’ – not measuring more precisely than what is necessary. Further, the concept of costs of collection versus costs of non-collection is discussed in Haddad et al. (1994). This criterion links the direct costs of data collection and of the policy action that the information generates, to the benefits that the indicator has in terms of the improvements brought about by the policy action (e.g. the costs of collecting household data to identify food insecure households, the costs of addressing this food insecurity, and the social benefits of having addressed it, respectively).
As mentioned earlier, there is a growing concern for improving FNS measurement as a response to the urgent need to achieve sustainable global FNS. While FNS concepts are elusive and difficult to follow up with targeted actions, there is a possibility to identify populations or individuals who are in an insecure food and nutritional state. There are numerous indicators of food and nutrition security at global, national, household and individual level17. Each indicator reflects a specific aspect of FNS and thus is only relevant for certain situations. This section documents the list of indicators which have been mostly used in the literature of various disciplines. Several indicators listed below are well-known measures approved by the CFS and used for monitoring the achievements of MDGs, forming the so-called “state-of-the-art”. The indicators are recommended by experts in the relevant disciplines and by international agencies. Nevertheless, it is important to note that the indicators might be revised after a certain period in order to accommodate validation18. The food security indicators discussed in this section are: The FAO Indicator of Undernourishment (FAOIU); The Global Hunger Index (GHI); The Global Food Security Index (GFSI); The Poverty and Hunger Index (PHI); The Hunger Reduction Commitment Index (HRCI); Anthropometric indicators (AI); The Diet Diversity Score (DDS); Medical and biomarker indicators (MBI)19.
4.1 The FAO Indicator of Undernourishment (FAOIU) FAO provides an indicator of undernourishment for most of the countries and considers mean dietary energy supply as a proxy for food energy consumption. The FAO indicator comprises three parameters namely the mean quantity of calories available for human consumption, the inequality in access to those calories among the population, and the mean minimum amount of calories required by the population (de Haen et al. 2011). The FAOIU seeks to estimate the proportion of the population which is at risk of insufficient consumption of calories. This measure is found to be unsatisfactory in several ways (Svedberg 2000). First, the calorie availability is a poor predictor of nutritional development, mortality and productivity. In light of the food price spikes in 2008 and 2011, the need to go beyond calories and analyze the degree of dietary diversity is rising (Qaim et al.
17 A comprehensive collection of FNS indicators is documented by the Food Insecurity and Vulnerability Information and Mapping Systems (http://www.fivims.org). 18 See for example State of Food Insecurity in the World 2012 where FAO improves the estimation methods such as the functional form for the distribution of dietary energy consumption in the population and the way the coefficient of variation (CV) and the skewness of the food consumption distribution are estimated (FAO 2012). 19 There are other composite food security and nutrition indicators, such as the Nutrition Barometer (which builds on the GHI and the HRCI), the Global Nutrition Index (based on DALYs lost per 100’000 population compiled by the Global Burden of Disease Project, WHO women’s body mass index and the FAO statistic on the percentage of population undernourished), the HungerFREE Scorecard (which largely inspired the HRI), and others. The indexes we present in this paper nonetheless provide a comprehensive picture of the different elements indicators and measures which are used for the different composite indexes.
17
2007, Babatunde and Qaim 2010)20. Second, the cut-off point by aggregating sex and age specific minimum dietary requirements is critically debated as it might result in a large underestimation of undernutrition (Dasgupta 1993, Svedberg 2002). Third, the data on food availability are not fully reliable (Svedberg 2000)21 and the robustness of the indicator is questionable as it is very sensitive to the three parameters mentioned earlier (Naiken 2003, de Haen et al. 2011).
4.2 The Global Hunger Index (GHI) The Global Hunger Index (GHI) is designed to inform the state of hunger globally in a comprehensive way and to interpret trends with causal models (Weismann 2006). Calculated annually (122 countries in 2011 and 120 in 2012), the GHI highlights the successes and failures in the progress of hunger reduction and provides information on the drivers of hunger. To capture the multidimensionality of FNS, the GHI combines three indicators: undernourishment, child underweight, and child mortality. The GHI is calculated as follows: 𝐺𝐻𝐼 = (𝑃𝑈𝑁 + 𝐶𝑈𝑊 + 𝐶𝑀)/3 (7) The proportion of undernourished (PUN) estimates the share of population with insufficient calorie intake, and is actually the FAO undernourishment indicator presented above. The proportion of children who are underweight (CUW) is one indicator of child undernutrition, measured by the proportion of children younger than the age of five who are underweight. Lastly, child mortality (CM) is involved as it reflects the interaction of inadequate dietary intake and unhealthy environment. The data are taken from publications and tables released by the United Nations agencies22. The GHI is used to rank 120 developing countries, which are assigned to five categories based on arbitrarily selected cut-off points: low (≤4.9), moderate (5.0-9.9), serious (10.0-19.9), alarming (20.0-29.9), and extremely alarming (≥30) (von Grebmer et al. 2012, Masset 2011). So far, the GHI provides a unique insight by combining three aspects of hunger. Yet as these three elements of hunger are correlated, the issue of double counting has been raised among its critics (Masset 2011).
4.3 The Global Food Security Index (GFSI) The GFSI is published by the Economist Intelligence Unit and attempts to measure the risks of food insecurity, particularly following the food riots in 2008 and 2011. GFSI provides ranking of food security for 105 countries including high and low income countries. The index is based on a consistent framework and assesses food security across three dimensions: affordability (which is similar to the notion of accessibility under the FAO definition of FNS), availability and utilization. The source data of the GFSI are based on existing research on food security, including FAO’s Annual State of Food Insecurity in the World report, the GHI published by IFPRI, and other documents. Each
20 The calorie intake can, even in the time of crisis, remain unchanged or even increases. The problem is that the households shift their consumption to cheaper calorie sources (Block et al. 2004). The direct consequence was a severe decrease in micronutrient intake, leading to children and maternal nutrient deficiency. Both can have long term consequences, such as risks of noncommunicable diseases in later life, which were found to be more prevalent in individuals who were previously undernourished (Lutter and Lutter 2012, Shetty 2012). To the contrary, Iannotti and Robles (2011) find a negative impact on calorie intake associated with the 2006-08 food price crisis in seven Latin American countries. 21 For instance national food balance sheets are sometimes derived from outdates data and often have poor quality. 22 Data sources of the percentage of undernourished in the population, percentage of underweight in children under five and under-five mortality are FAO, WHO, and UNICEF, respectively. The data on percentage of undernourished and underweight are also complemented by IFPRI estimates, DHS and UNICEF data.
18
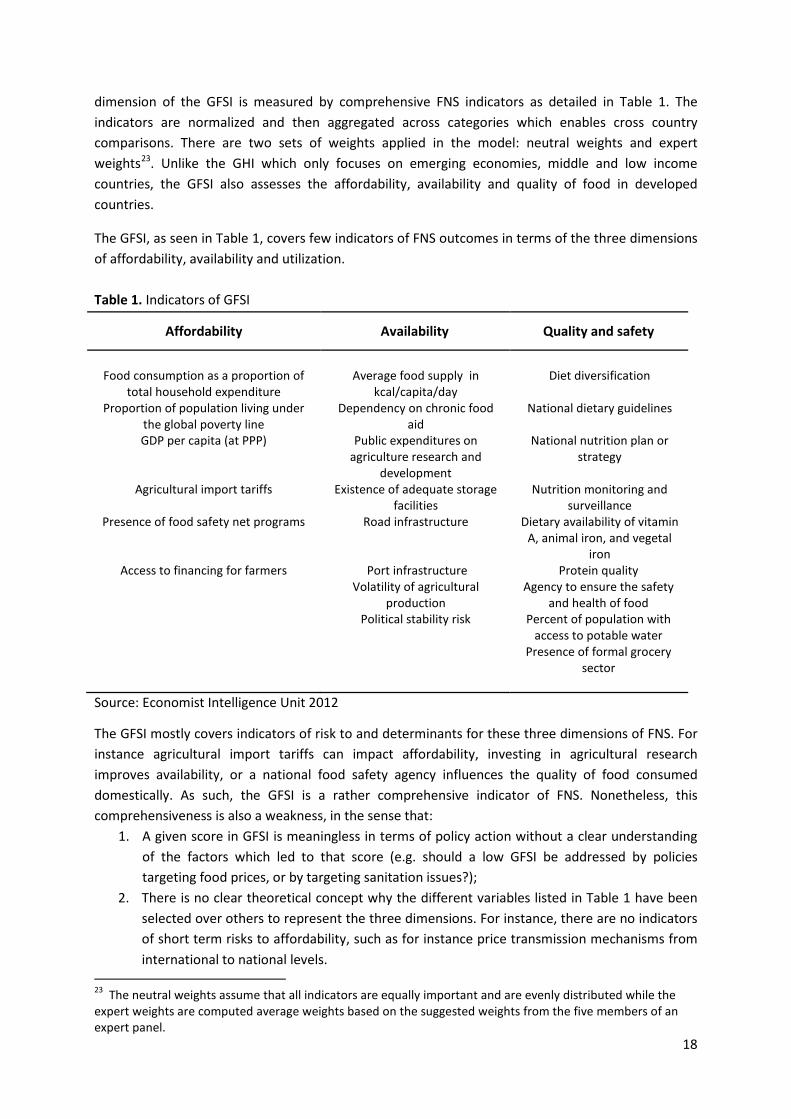
dimension of the GFSI is measured by comprehensive FNS indicators as detailed in Table 1. The indicators are normalized and then aggregated across categories which enables cross country comparisons. There are two sets of weights applied in the model: neutral weights and expert weights23. Unlike the GHI which only focuses on emerging economies, middle and low income countries, the GFSI also assesses the affordability, availability and quality of food in developed countries.
The GFSI, as seen in Table 1, covers few indicators of FNS outcomes in terms of the three dimensions of affordability, availability and utilization. Table 1. Indicators of GFSI
Affordability Availability Quality and safety
Food consumption as a proportion of
total household expenditure Average food supply in
kcal/capita/day Diet diversification
Proportion of population living under the global poverty line
Dependency on chronic food aid
National dietary guidelines
GDP per capita (at PPP) Public expenditures on agriculture research and
development
National nutrition plan or strategy
Agricultural import tariffs Existence of adequate storage facilities
Nutrition monitoring and surveillance
Presence of food safety net programs Road infrastructure Dietary availability of vitamin A, animal iron, and vegetal
iron Access to financing for farmers Port infrastructure Protein quality
Volatility of agricultural production
Agency to ensure the safety and health of food
Political stability risk Percent of population with access to potable water
Presence of formal grocery sector
Source: Economist Intelligence Unit 2012
The GFSI mostly covers indicators of risk to and determinants for these three dimensions of FNS. For instance agricultural import tariffs can impact affordability, investing in agricultural research improves availability, or a national food safety agency influences the quality of food consumed domestically. As such, the GFSI is a rather comprehensive indicator of FNS. Nonetheless, this comprehensiveness is also a weakness, in the sense that:
1. A given score in GFSI is meaningless in terms of policy action without a clear understanding of the factors which led to that score (e.g. should a low GFSI be addressed by policies targeting food prices, or by targeting sanitation issues?);
2. There is no clear theoretical concept why the different variables listed in Table 1 have been selected over others to represent the three dimensions. For instance, there are no indicators of short term risks to affordability, such as for instance price transmission mechanisms from international to national levels.
23 The neutral weights assume that all indicators are equally important and are evenly distributed while the expert weights are computed average weights based on the suggested weights from the five members of an expert panel.
19
Finally, the dimension of quality and safety only partly covers the different concepts encompassed in the more global dimension of utilization. For instance, health issues as risks to and determinants of food security are ignored (e.g. health environments – beyond access to potable water, health care, knowledge and caring capacity).
4.4 The Poverty and Hunger Index (PHI) This is a multidimensional indicator of poverty and hunger linked with the MDGs indicators. The PHI is developed as one of the instruments in monitoring the achievement of MDGs. The proportion of the population living on less than a dollar per day, the poverty gap, the share of the poorest quintile in national income or consumption, the prevalence of children underweight, and the proportion of undernourished population calculated by the FAO are among the indicators used by Gentilini and Webb (2008). The statistical methodology of the PHI follows the UNDP’s Human Development Index (HDI) (Gentilini and Webb 2008). The authors report that the correlation between poverty and hunger is not always high, decreasing the redundancy between the elements. On the other hand, the correlation between the poverty rate and poverty gap indicators is very high (close to one), suggesting that these indicators are redundant. Also, the MDG Project does not provide a coherent conceptual framework which explains how the MDG indicators are linked, nor does it establish a hierarchy of its target indicators. This presents some difficulty for the construction of the PHI and a convincing definition of its dimensions. Finally, the PHI suffers from similar issues as the FAO indicators, as mostly the data are derived from national data and quality and current-date are major concerns (Masset 2011).
4.5 The Hunger Reduction Commitment Index (HRCI) While previous indicators emphasize the status and magnitude of food and nutrition security problems, a major attempt to assess the governance and political commitment to reduce undernutrition has been administered through the HRCI (Lintelo 2012). The notion behind this index is that the existing food and nutrition security indicators are more outcome oriented and are limited when accounting for political will. To fill this gap, the HRCI assesses governmental commitment leading to better nutrition outcomes. Such an index might help governments and donors to track and to prioritize their effort in reducing hunger. The political commitments are evaluated through the dimensions of food and nutrition security: availability, access, and utilization. In addition, there are three themes identified in governmental action against undernutrition: policies and programs, legal frameworks, and public expenditures. These three themes cover four sectors: food and agriculture, women’s empowerment, social protection and health environment. The indicators of governmental commitment on the dimension of availability are assessed from the public expenditure on agriculture and women’s access to agricultural land. Including the gender context in the dimension of food availability is based on the notion that if women have the same access to land and other agricultural inputs, agricultural production can be increased and at the same time food insecurity reduced (FAO 2011). The indicators of governmental commitment on the access to food cover more comprehensive aspects including the implementation of FAO national programs for food security, public expenditure on education, constitutional right to social security, and civil registration at birth. These multisectoral dimensions of food accessibility embrace the critical aspects for an effective realization of legal and civil rights and enhancing access to government services including health and social protection that can accelerate food and nutrition security (Lintelo 2012). On the utilization dimension, public expenditure on health is used as proxy of governmental commitment to improve public health systems for the prevention of hunger and undernutrition. There are serious drawbacks
20
in using this proxy, as it might not reflect effective government commitment. For example, health sector national expenditure figures typically include sector budget support (SBS), i.e. international or bilateral donors’ support to the health sector of a specific recipient country. In many cases, it has been observed that as health SBS increases, effective domestic public health expenditure decreases. Finally, the HCRI is available for 21 countries, which in itself is a strong limitation compared to the other indexes reviewed here..
4.6 Anthropometric indicators (AI) While the previous indicators focus on the macro level, anthropometric indicators such as stunting (low height-for-age), underweight (low weight-for-age), and wasting (low weight-for-height) measure nutritional outcomes at the individual level. The nutritional outcome is influenced by aspects beyond the availability of and accessibility to food (i.e. those are prerequisites for nutrition security, as illustrated in Figure 1), such as the interactions between food losses, intra-household food distribution, individual health and activity levels, and also environmental quality, few of which are captured in the indicators described in the previous sections. Unlike generic indices, anthropometric indicators measure directly the point of policy interest as they reflect undernutrition and how it might affect health and well-being (de Haen et al. 2011). Svedberg (2011) pointed out the advantage of anthropometric indicators that they directly reflect the imbalances between energy intakes and expenditures. Poor anthropometric outcomes are also associated with higher morbidity and mortality (Deaton and Dreze 2009). Even though anthropometric indicators measure nutritional outcomes, they do not cover specific nutrients that might be deficient. Nevertheless, it is argued that stunting might reflect long-term consequences of underconsumption of essential micronutrients such as vitamins and minerals (Walker et al. 2007, Svedberg 2011).
As anthropometric data are derived from household surveys, they also have the advantage to be disaggregated by groups and regions, thus enabling group and spatial analysis. Another advantage of anthropometric norms, particularly for children under five, is that they are universal as the genetic potential growth for children is uniform (Svedberg 2011). Nonetheless, anthropometric measures are subject to measurement error including technical error of measurement and the exact age of children is sometimes not known in developing countries. To provide a figure of nutritional outcomes at the macro level, the anthropometric indicators are generally expressed as percentage or prevalence, i.e. frequencies (e.g. the prevalence of underweight in children used for the PHI and GHI). The reference cut-off points can be based on statistical, risk of dysfunction and prescriptive criteria (Pelletier 2008). Among these criteria, the statistical cut-off points are the most commonly used reference, some of which are presented in Table A1 and Table A2 (Appendix). Anthropometric indicators are available for all countries though the series are not uniform in some countries since the data are not collected annually. They are published yearly by UNICEF in the State of the World’s Children report series24 (Olusanya 2005, Bryce et al. 2005). At country level, household surveys and nutrition surveillance surveys have been widely conducted25.
24 The data reliability is high with no major measurement error (Masset 2011). Though this may be true for the anthropometric data published in this series and in the WHO database, because of the measurement problems (capturing child length/height precisely, determining age correctly, using scales properly), anthropometric data can be unreliable, if the data collection is not done carefully. 25 See for example Demographic and Health Surveys (DHS), e.g. the India National Family Health Survey (available from http://www.measuredhs.com/), and Multiple Indicator Cluster Survey by UNICEF (http://www.childinfo.org/mics4_surveys.html).
21
4.7 The Diet Diversity Scores (DDS) Dietary diversity represents the number of different foods or food groups consumed over a given reference period (Hoddinott and Yohannes 2002). There many diet diversity scores in the literature, with different purpose (measuring individual diet quality versus household food access, for example), with different number and definition of food groups, unit of analysis (individual or household), reference periods, etc. Hoddinott and Yohannes (2002) embraced that diet diversity scores are meaningful indicators of FNS for four reasons. First, dietary diversity scores correlate with measures of food consumption and are a good measure of household food access and caloric availability. Second, a varied diet is a worthy outcome in itself. Third, more diet variety is associated with a number of improved outcomes, particularly in birthweight (Rao et al. 2001), child anthropometric status (Hatloy et al. 2000), improved hemoglobin concentration (Bhargava et al. 2001), reduced risk of mortality from cardiovascular disease (Kant et al. 1995) and incidence of hypertension (Miller et al. 1992). Fourth, diet diversity scores can be collected through household surveys and can be used to examine FNS at individual and intrahousehold levels. Fourth, field experience indicates that data collection through household expenditure modules as part of a household survey is straightforward.
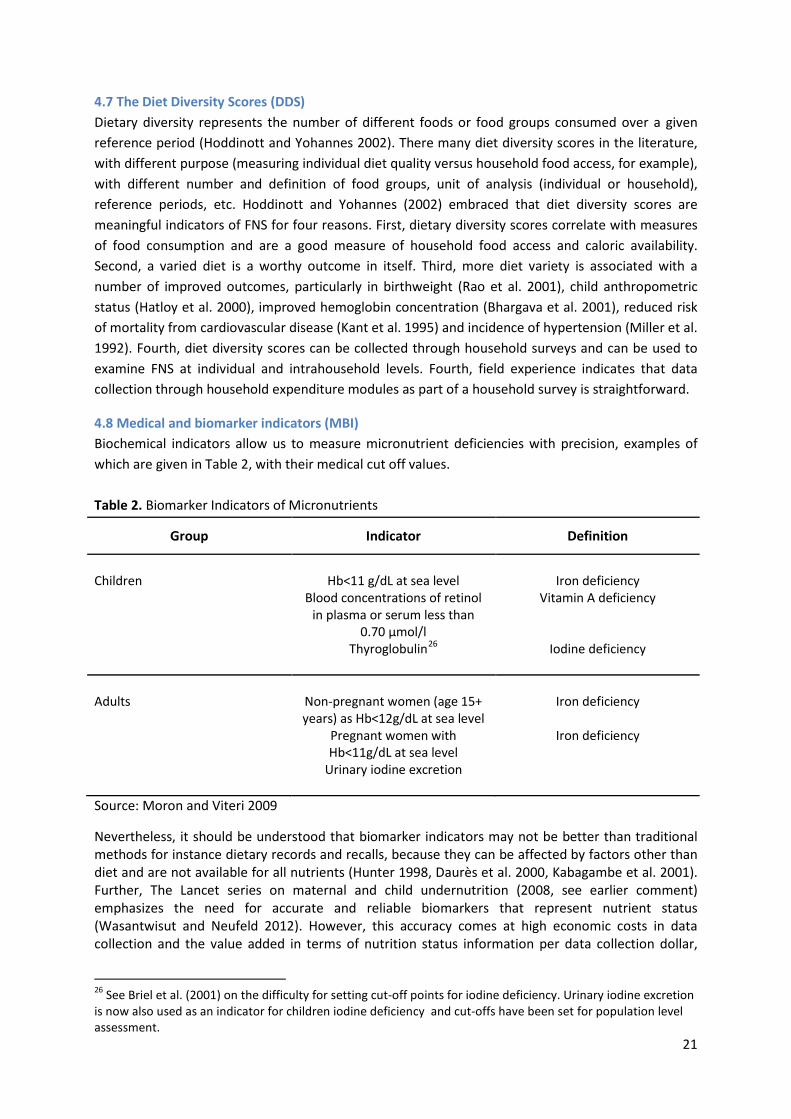
4.8 Medical and biomarker indicators (MBI) Biochemical indicators allow us to measure micronutrient deficiencies with precision, examples of which are given in Table 2, with their medical cut off values. Table 2. Biomarker Indicators of Micronutrients
Group Indicator Definition
Children Hb<11 g/dL at sea level Iron deficiency Blood concentrations of retinol
in plasma or serum less than 0.70 µmol/l
Vitamin A deficiency
Thyroglobulin26 Iodine deficiency Adults Non-pregnant women (age 15+
years) as Hb<12g/dL at sea level Iron deficiency
Pregnant women with Hb<11g/dL at sea level
Iron deficiency
Urinary iodine excretion Source: Moron and Viteri 2009
Nevertheless, it should be understood that biomarker indicators may not be better than traditional methods for instance dietary records and recalls, because they can be affected by factors other than diet and are not available for all nutrients (Hunter 1998, Daurès et al. 2000, Kabagambe et al. 2001). Further, The Lancet series on maternal and child undernutrition (2008, see earlier comment) emphasizes the need for accurate and reliable biomarkers that represent nutrient status (Wasantwisut and Neufeld 2012). However, this accuracy comes at high economic costs in data collection and the value added in terms of nutrition status information per data collection dollar,
26 See Briel et al. (2001) on the difficulty for setting cut-off points for iodine deficiency. Urinary iodine excretion is now also used as an indicator for children iodine deficiency and cut-offs have been set for population level assessment.
22
especially when compared with dietary records and recalls, has to date been too low to encourage large scale data collection efforts27,.
5. Classification of Indicators for Assessing Food and Nutrition Security Choosing an indicator of FNS is dependent on the definition of FNS (Hoddinott and Yohannes 2002). This paper follows the FAO definition: food and nutrition security exists when all people at all times have physical, social and economic access to sufficient, safe and nutritious food to meet their dietary needs and food preferences for an active and healthy life (CFS 2009). To support policy purposes, this paper attempts to differentiate FNS indicators based on the four dimensions of the FNS definition: availability, access, utilization and stability (which also includes the notion of vulnerability). The purpose of indicator differentiation is to ensure that each indicator is ‘fit for purpose’ and useful for decision making. The indicators of FNS might be analyzed at various levels (Table A5, Appendix) because FNS at one level does not guarantee security at other levels. Therefore, there exists a wide range and heterogeneity of indicators. It should be noted that this paper will not propose new indicators of FNS, it rather highlights the existing FNS indicators and puts more emphasis on the gender dimension of nutrition indicators. It is also important to note that this paper emphasizes the indicators from economic dimensions to reflect the effect of recent food and non-food price changes and variability, as well as income changes and variability, as key determinants of and risk factors to food and nutrition security.
A collection of indicators is therefore not sufficient to facilitate action, but should be at least coupled with a typology of countries (or entities of a smaller geographical scale, depending on the nature of the problem and of action), compounding several FNS dimensions28. Ideally, a theoretical framework linking various indicators of FNS outcomes with readily available socio-economic and environmental indicators should guide FNS policies and action. This would also ensure that the selection of indicators is justified rather than ad hoc, according to each situation and purpose, leading to an almost endless list of potential indicators. Such a framework does not currently exist and the mapping of typologies on indicators is the second best option to support policy action.
The type of FNS indicators can be classified into three major categories, each fulfilling a specific purpose (adapted from FIVIMS 2002, Maire and Delpeuch 2005):
1. Indicators to measure FNS outcomes The status indicators report the nature of FNS problems, characterize the extent of the problems, and identify the “location” of the problems (e.g. stunting, caloric inadequacy, etc.).
2. Indicators to measure FNS drivers and risks
27 Only few household surveys (for example see Mexican Family Life Survey and Indonesian Family Life Survey) collected both a household expenditure model to derive dietary records and biomarker indicators. DHS collects biomarker indicators only in selected countries (for further information http://www.measuredhs.com/data/available-datasets.cfm). The derivation of a Dietary Score is also costly, as it must be based on a standard expenditure module in the household survey (See Deaton 1997, and Deaton and Grosh 2000). The Feed the Future efforts in collecting the biomarker indicator for anemia tests as well as anthropometric indicators can be a promising data source (Feed the Future 2012). Note however that the prevalence of anemia has its limitations as an indicator of iron deficiency: a quick internet search on anemia readily suggests that iron deficiency is one of its many possible causes, and that not all iron deficiency is sufficiently severe to cause anemia. 28 See Yu et al. (2010) for an example of such a typology, and Maire and Delpeuch (2005) for Nutrition Indicators for Development.
23
These indicators generally present the condition or status of factors which affect the food and nutritional outcome, at a certain point in time. Specific benchmarks in these indicators, or in their evolution, can provide information on impending FNS risks. The indicators of drivers, determinants and risks are in general broken down from the chain of causes as presented in Figure 1 (e.g. percentage of population living on less than 1$ per day, agricultural yields per hectare, household hygiene practices, etc.)
3. Indicators to measure FNS interventions The process indicators that we list in this category essentially portray the existence, extent and reach (in terms of % of the population) of FNS-linked infrastructures. These can be institutional, such as nutritional policies (e.g. food fortification programs) or physical infrastructures linked to agriculture and health (roads, access to health centers, main source of water, …).
In the work of Maxwell and Smith (1991), FNS indicators are classified into process indicators and outcome indicators. Process indicators encompass indicators that describe food supply and food access, while outcome indicators serve as proxies of food consumption. Nevertheless, Chung et al. (1997) argued that there is little correlation between process indicators and outcome indicators which leads to the conclusion of development agencies, that process indicators should not only focus on the food supply side rather should expand to more integrated intervention which directly influence FNS outcome (WHO 2010a, Amouzou et al. 2012). In this regard, the ‘process’ should also consider factors that affect FNS outcome via the health situation as an underlying cause of FNS. Such discussions clearly illustrate the difficulty to classify some of these indicators. Processes and interventions are aiming at reducing risks to FNS and improving the FNS status. Hence process indicators could sometimes figure in either of the two other categories, and vice versa. More importantly, the indicator must be suited to the policy question that needs to be answered.
FNS indicators can also be classified according to the temporal dimension at which they operate, for instance indicating the duration of the food and nutrition insecurity impacts on the individuals’ life. Structural food and nutrition insecurity is categorized as long-term and persistent. It occurs when people are unable to meet their minimum energy and micronutrient requirements over a sustained period of time, or when issues affecting people’s utilization of food and nutritional outcomes (e.g. knowledge and caring capacity, access to safe water, sanitation, health care, etc.) are persistent. Structural food insecurity is often the result of extended periods of poverty, lack of assets and inadequate access to productive or financial resources, structural nutrition insecurity can stem from issues ranging from gender discrimination to poor infrastructure. Structural food and nutrition insecurity can be overcome with typical long term development measures also used to address poverty, such as improved access to productive resources, expanding the provision of public services (including education) or more generally promoting more equal opportunities across genders. Conversely, chronically food and nutrition insecure people need more direct access to food to enable them to raise their productive capacity. Cyclical , or transitory, food insecurity is short-term and often temporary. It refers to a sudden drop in the ability to produce or access enough food to maintain a good nutritional status. As short term food insecurity is relatively unpredictable and can emerge suddenly, it makes planning and programming more difficult and requires specific capacities and types of intervention, including early warning capacity and safety net programs. The duration of food and nutrition security impacts is reflected in Table A5 (Appendix), where the different groups of indicators are classed as long term (structural) or short term (immediate). Mapping the indicators based on the duration aspect needs careful attention as intensity or severity of food and nutrition
24
insecurity might be at play. As food and nutrition security cover the lifetime of individuals and even intergenerational outcomes, there are potential long term and persistent impacts of short term insecurity: for instance, inappropriate complementary feeding or breastfeeding practices, if applied over a long period, might affect long-term human capital outcomes (education and productivity)29.
Finally, specific FNS indicators can target and indeed are defined and measured at different micro and macro levels. These levels were illustrated in Figure 2.
Table A5 (Appendix) summarizes the main food and nutrition security indicators and attempts to organize them along the different criteria mentioned above, namely:
• the four FNS dimensions, availability, accessibility, utilization, and stability/vulnerability; • the three types of indicators identified above, i.e. reporting on FNS status/outcome,
processes/interventions, and determinants/risks.; • the temporal scale of the FNS impacts and risks (long term versus short term); • the level at which the indicator can be measured (as per Figure 2).
The list of indicators included in Table A5 (Appendix) is also discussed in the text below. It should be noted that the indicators should be used with caution since the list is intended to support indicator selection based on a specific conceptual framework and a specific need and situation. The selection should reflect the objectives and the particular context, for instance whether it is used to identify past or current risk, to protect against future risk, or for targeting a specific FNS action (Young 2010). Naturally, the list of indicators, in the absence of a theoretical framework for FNS, is somewhat subjective. The case could be made to include or withdraw specific indicators, or focus on disaggregated indicators rather than compounding indices (e.g. several indicators covering the supply of fat, proteins, micronutrients, and average dietary energy versus a general index of food production). In addition, the choice of FNS indicators should consider the most relevant areas of prioritization for FNS interventions, such as vitamin A status or the general caloric adequacy. In that sense, there is no overall indicator to provide a picture of FNS. Further, the scale at which the intervention is to take place equally matters: to assess the FNS status at the individual or household level, an indicator based on individual/household consumption such as dietary diversity or other quantitative measures of food consumption will be more reasonable than macro indicators such as the food production index (Haddad et al. 1994, Maire and Delpeuch 2005). Trends in the latter are however potential indicators of risks to the individual or hjousehold level FNS status.
The FAOSTAT, WHO, UNICEF, and the World Bank database remain the main sources of information, although national household surveys play a vital role to provide information at the national and micro level. The different data sources are mentioned in the footnotes to the table. Following FAO (2012) and Maire and Delpeuch (2005), the indicators we show here are allocated to the four dimensions of FNS and shortly defined in the sub-sections below. It must be noted however that the classification of single indicators across the four FNS dimensions is somewhat subjective and many indicators could fit in several of the dimensions. There are in particular several FNS risk indicators of macro variables (for instance exchange rate, or commodity price variability) which impact the access to food for consumers (through the income effect), the availability of food (farmers decrease production in response to price signals), or the stability of both food availability and accessibility. This
29 See Hoddinott et al. (2008), Victora et al. (2008), and Field et al. (2009).
25
cross-cutting issue of FNS indicators is particularly difficult to resolve for the availability and accessibility dimensions.
5.1 Availability In its narrow definition, availability is a measure of the amount of food that is and will be physically available in a population during a certain period of time. It is most likely related with production and market availability. In the drivers’ indicators of Table A5 (Appendix), we list here: the average dietary supply adequacy, average protein supply, and indicators related to agricultural sectors (at the scale of analysis, i.e. national, regional, etc). To enhance food supply, we list several process indicators at individual, household and macro level. At the macro level, achieving FNS can be accelerated through agricultural research and development. This paper also recognizes the importance of the share of government budget on agricultural research and development as an important proxy for technology promotion and innovation, thus targeting future food availability30. Through biofortification and biofertilisation, research also has the potential to lead to micronutrient–rich varieties with favorable agronomic treats that are appealing to farmers. Examples of biofortification include orange-fleshed sweet potatoes, as well as rice enriched with iron and zinc. Supplementing fertilizers with zinc (biofertilisation) is another efficient strategy to improve micronutrient content of soils, plants, and people. At the individual and household levels, the process’ indicators emphasize the role of government intervention in providing micronutrients to individuals/households. As population growth can be a major stressor for food availability in the long-term, family planning is considered as an important social development (Headey 2012). In the status indicators of availability, cereal yields and the food production index have been frequently used, though in our mind they rather reflect determinants than the status of availability. We suggest using the share of energy supply derived from cereals, roots and tubers and the average supply of protein derived from animal sources in an attempt to go beyond cheap sources of calories. The livestock production index could also be used in this context and further encompasses the complex interactions of agricultural production systems, as the increasing price of certain agricultural products might affect the livestock production (Rosegrant et al. 2012).
5.2 Accessibility The accessibility dimension embraces Sen’s core thesis that food availability does not guarantee that everyone is free from hunger (Sen 1981). As a result, food availability is an insufficient predictor for food and nutrition security. The fact that the undernourished population has increased by 9 percent despite the 12 percent increase of global food production since 1990 (Barrett 2010) implies that food insecurity occurred at a time of abundance (Webb 2010). Although the figures reported by Barrett (2010) are based on the hunger figures of the FAO’s SOFI report 2009, which have been criticized and revised by FAO in its newest SOFI report (2012). Nonetheless, it remains true that food insecurity was little affected by the increase in global food production. Indicators of food accessibility are presented in Table A5 (Appendix). The presence of sound institutions is one of the potential routes to secure people’s access to food. As mentioned above, the driver indicators present the current conditions
30 The budget share for agricultural research is of course not an ideal proxy for the promotion of technological improvements or for the state of innovations. For public spending in agriculture to result in innovations, or to reflect the effective promotion of innovations, would require controlling for the allocative and technical efficiency of public spending and the readiness of the agricultural sector to innovate (i.e. display an “enabling environment”). These conditions are most often not met in developing countries. The impact of science systems (including funding) on FNS is a complex topic, treated in more depth in other deliverables of FoodSecure.
26
that hinder or facilitate the access to food. At the macro level, indicators of macro-economic profiles such as agricultural import tariffs, inflation rate, exchange rate, and food price index are considered as important FNS access indicators. The economic indicators of accessibility aim to capture the effects of food prices, especially their evolution / variability and other economic shocks, as well as the mechanisms behind food price formation. Among the process indicators, the presence of price regulation in a country is important to prevent the adverse consequence of food price changes. The importance of food price regulation in a country differs from case to case. Countries where food consumption is dominated by a certain staple, for instance rice in Southeast Asia, wheat in Pakistan, and maize in several parts of Africa, often coincide with countries where the staple-dependent poor faces a double shock: world food price shocks and shocks from domestic production variability (Byerlee et al. 2006). The price controls to manage price instability include marketing services through a sound market information system as well as crop forecasting and trade policies. The combination of food, fuel, and financial crisis has reminded us all about the need to build resilience over the longer term, setting up the price regulation and effective social protection systems that ensure people’s food and nutrition security (Timmer 2010; 2012). Table A5 also presents other indicators related to infrastructure represented by road density as a measure of the logistical support for food access31. At the household and individual level, access to health care centers, social protection, safety nets and transfer programs are all important interventions in the context of FNS and particularly access to food issues in times of crisis. Better access to health care is positively associated with better health status (Frankenberg 1995, Utomo et al. 2011), although health care quality is often found to be a more critical factor. 32 Frankenberg (1995) pointed out that adding health care services in a village decrease the odds of infant mortality by almost 15 percent. Those indicators reinforce the importance of strategies based on poverty reduction, food price regulation and safety net policies. Process indicators of structural FNS are dealing with the institutional change which ensures broader access to land and financial institution.
5.3 Utilization Utilization is a measure of a population’s ability to obtain sufficient nutritional intake and nutrition absorption during a given period33. How the population derives a sufficient intake and absorption of micronutrients can be assessed from their diet variety and from the anthropometric outcomes. Poor diet diversification is often associated with micronutrient deficiency and is a strong predictor for child stunting and maternal nutritional status (Ruel 2003, Savy et al. 2005, Ruel et al. 2010). For instance, iron deficiency anemia is more prevalent among populations with a diet low in animal protein and high in rice or in whole wheat (Banerjee et al. 2011). The status indicators presented in Table A5 (Appendix) focus on anthropometric indicators34. Anthropometric indicators are also used 31 In India, almost one third of the rice distributed for poor households got lost on the way (Banerjee and Duflo 2011). 32 Quality and access can overlap, for instance the number of medical staff or hospital beds per capita in a given location could be interpreted as indicators of quality (e.g. Acharya and Cleland, 2000) or access (e.g. Frankenberg, 1995). The latter is often proxied by, but needs not be limited to, distance to health services. 33 Micronutrient intake does not necessarily result in micronutrient absorption. Sufficient absorption can be prevented by illnesses such as diarrhea, or by low bioavailability of micronutrients. For example, iron and zinc from plant sources have much lower bioavailability than iron and zinc from animal sources. 34 The nutrition security indicators discussed in this paper are partly based on the triple burden of malnutrition: insufficient intake of dietary energy (hunger), micronutrient deficiencies (hidden hunger), and excess intake of dietary energy (overweight and obesity) (Pinstrup-Andersen and Watson II 2011). The latter will not be discussed in this paper, and the terminology of undernutrition, in reference to the first two, has been preferred.
27
as present time FNS indicators. It is evident that the anthropometric indicators provide a good sense of transitory / short term and long term / structural undernutrition and are generally used by the relief organizations to monitor the success of such interventions and aid in emergency situations (de Haen et al. 2011). Several studies have found that women play a key role in FNS. Therefore, it is vital to really target women in order to generate multiplier effects. In terms of micro-nutrient interventions, it is evident that maternal iron deficiency is associated with anemia which can lead to higher mortality risks. Iron deficiency during pregnancy is associated with increased risks for maternal mortality, premature birth and low birth weight. These aspects in fact have an important consequence for nutritional outcomes in later life (Bhutta et al. 2008). Apart from that, the greatest potential to improve the nutrition status of the newborn is through the promotion of breastfeeding and adequate complementary feeding in the first two years of life (World Bank 2006, Lutter and Lutter 2012). It should be noted that to eliminate nutrition insecurity in the longer term, the interventions should be implemented in the underlying determinants of undernutrition such as poverty, poor education, disease burden, and lack of women’s empowerment.
5.4 Stability Stability refers to the stability of the three dimensions above: availability, access, and utilization at all times without risks. The main risks which might have adverse effects on availability, access and utilization are extreme weather events, energy scarcity, economic and social disruption and malfunctioning global markets. The stability dimension recognizes that the food and nutrition security status may change. This dimension emphasizes the importance of having mechanisms in place to assure the availability, access, and utilization which might change with risks. Promoting and supporting sustainable and resilient production systems, investing in rural development, and improving market governance are the key route to address such risks. The common indicators capturing the stability dimension are mostly focusing on the availability and access dimensions. At the individual and household level, poor hygiene behavior, inequitable intrahousehold food allocation and household members’ morbidity reduce micronutrient benefits and impair the stability of the availability, accessibility, and utilization dimensions of food and nutrition security for individuals and households. In terms of household food distribution, the well-established facts indicate that nutrient requirements are greater for pregnant and lactating women and for children because of their need for physiological and mental development (Quisumbing and McClafferty 2005), unfortunately, the real state is alarming. The prevalence of maternal undernutrition as indicated by low body mass index, and fetal undernutrition is common, particularly in South-central Asia where patriarchal culture is dominant and gender disparity is wide (Bhutta et al. 2008, Gill and Stewart 2001). The selected indicators listed in Table A5 (Appendix) represent stability with respects to availability and access from three points: the composition of food available as indicated by an index of variability of food production, the variability of access as represented by volatile food prices and the resilience capacity as reflected by the storage systems both physical and virtual (von Braun and Torero 2012). In addition, it is important to note that as the stability dimension has cross-cutting drivers, safety net programs for the most vulnerable group are still considered as the main buffer for stability. Safety nets and social protection belong in principal both to stability (as a buffer against shocks) and to access indicators, because for some groups, like the disabled and the elderly without informal social security networks, access to food will always depend on the existence of some kind of transfer/welfare program (not only in case of shocks).
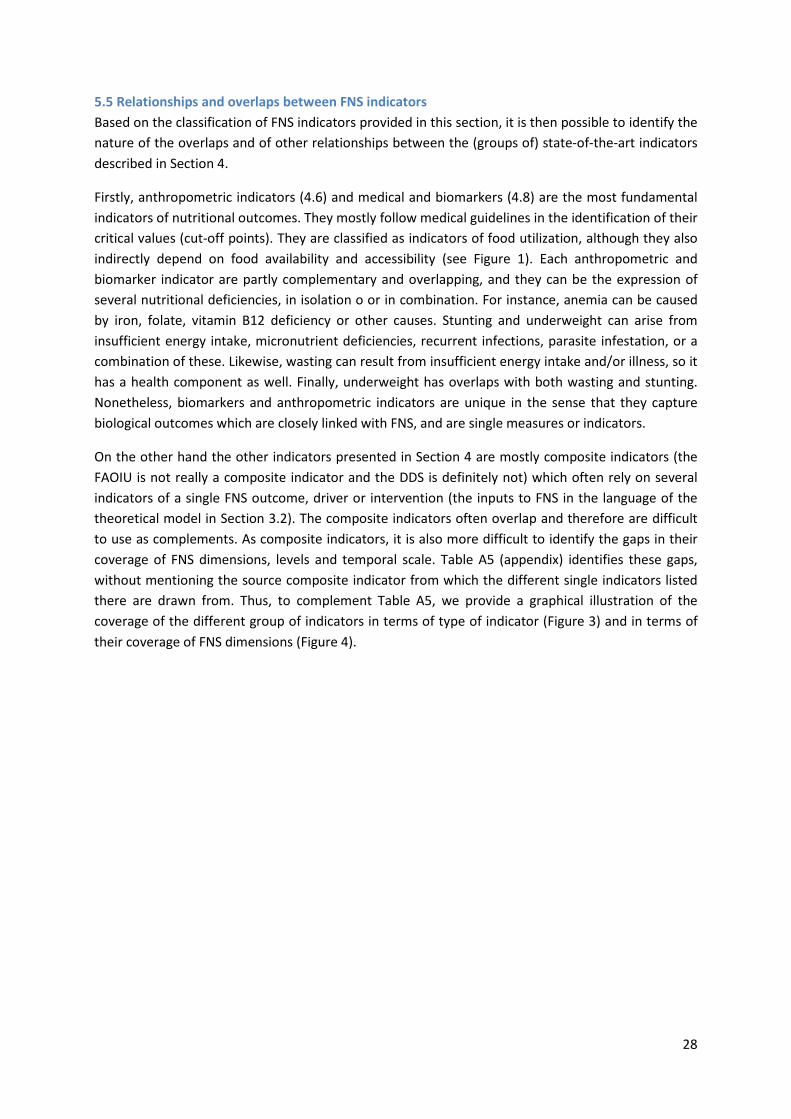
28
5.5 Relationships and overlaps between FNS indicators Based on the classification of FNS indicators provided in this section, it is then possible to identify the nature of the overlaps and of other relationships between the (groups of) state-of-the-art indicators described in Section 4.
Firstly, anthropometric indicators (4.6) and medical and biomarkers (4.8) are the most fundamental indicators of nutritional outcomes. They mostly follow medical guidelines in the identification of their critical values (cut-off points). They are classified as indicators of food utilization, although they also indirectly depend on food availability and accessibility (see Figure 1). Each anthropometric and biomarker indicator are partly complementary and overlapping, and they can be the expression of several nutritional deficiencies, in isolation o or in combination. For instance, anemia can be caused by iron, folate, vitamin B12 deficiency or other causes. Stunting and underweight can arise from insufficient energy intake, micronutrient deficiencies, recurrent infections, parasite infestation, or a combination of these. Likewise, wasting can result from insufficient energy intake and/or illness, so it has a health component as well. Finally, underweight has overlaps with both wasting and stunting. Nonetheless, biomarkers and anthropometric indicators are unique in the sense that they capture biological outcomes which are closely linked with FNS, and are single measures or indicators.
On the other hand the other indicators presented in Section 4 are mostly composite indicators (the FAOIU is not really a composite indicator and the DDS is definitely not) which often rely on several indicators of a single FNS outcome, driver or intervention (the inputs to FNS in the language of the theoretical model in Section 3.2). The composite indicators often overlap and therefore are difficult to use as complements. As composite indicators, it is also more difficult to identify the gaps in their coverage of FNS dimensions, levels and temporal scale. Table A5 (appendix) identifies these gaps, without mentioning the source composite indicator from which the different single indicators listed there are drawn from. Thus, to complement Table A5, we provide a graphical illustration of the coverage of the different group of indicators in terms of type of indicator (Figure 3) and in terms of their coverage of FNS dimensions (Figure 4).
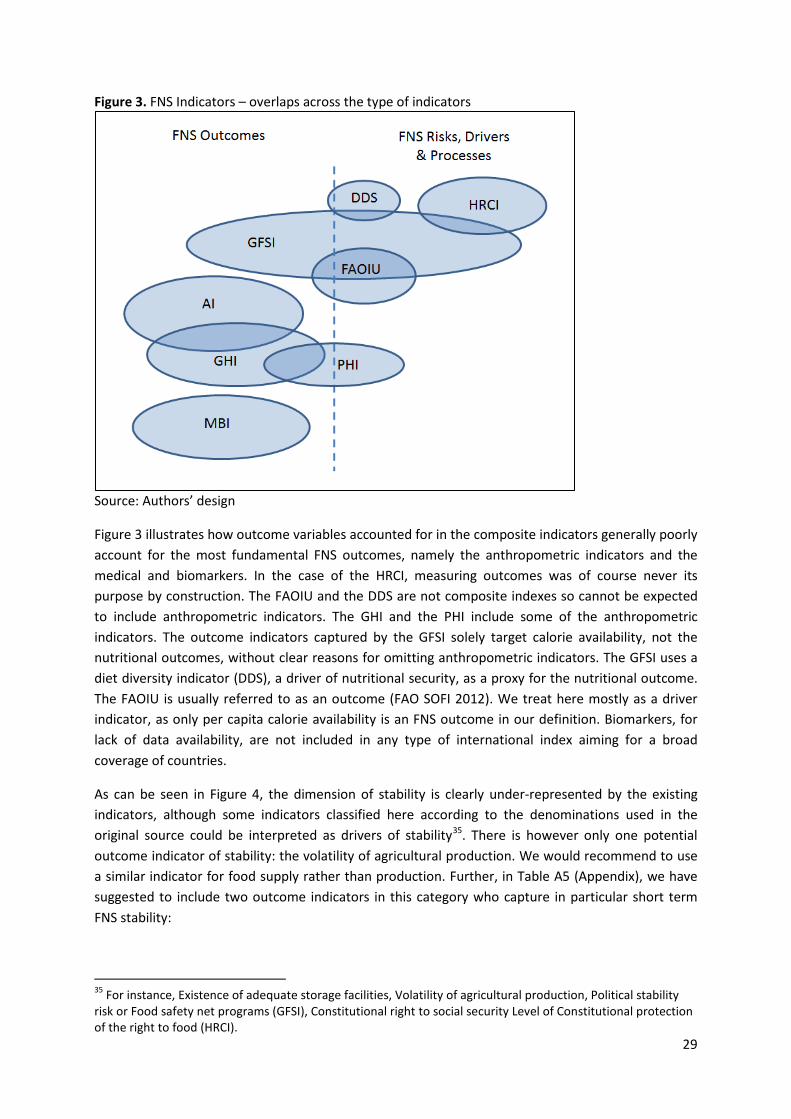
29
Figure 3. FNS Indicators – overlaps across the type of indicators
Source: Authors’ design
Figure 3 illustrates how outcome variables accounted for in the composite indicators generally poorly account for the most fundamental FNS outcomes, namely the anthropometric indicators and the medical and biomarkers. In the case of the HRCI, measuring outcomes was of course never its purpose by construction. The FAOIU and the DDS are not composite indexes so cannot be expected to include anthropometric indicators. The GHI and the PHI include some of the anthropometric indicators. The outcome indicators captured by the GFSI solely target calorie availability, not the nutritional outcomes, without clear reasons for omitting anthropometric indicators. The GFSI uses a diet diversity indicator (DDS), a driver of nutritional security, as a proxy for the nutritional outcome. The FAOIU is usually referred to as an outcome (FAO SOFI 2012). We treat here mostly as a driver indicator, as only per capita calorie availability is an FNS outcome in our definition. Biomarkers, for lack of data availability, are not included in any type of international index aiming for a broad coverage of countries.
As can be seen in Figure 4, the dimension of stability is clearly under-represented by the existing indicators, although some indicators classified here according to the denominations used in the original source could be interpreted as drivers of stability35. There is however only one potential outcome indicator of stability: the volatility of agricultural production. We would recommend to use a similar indicator for food supply rather than production. Further, in Table A5 (Appendix), we have suggested to include two outcome indicators in this category who capture in particular short term FNS stability:
35 For instance, Existence of adequate storage facilities, Volatility of agricultural production, Political stability risk or Food safety net programs (GFSI), Constitutional right to social security Level of Constitutional protection of the right to food (HRCI).
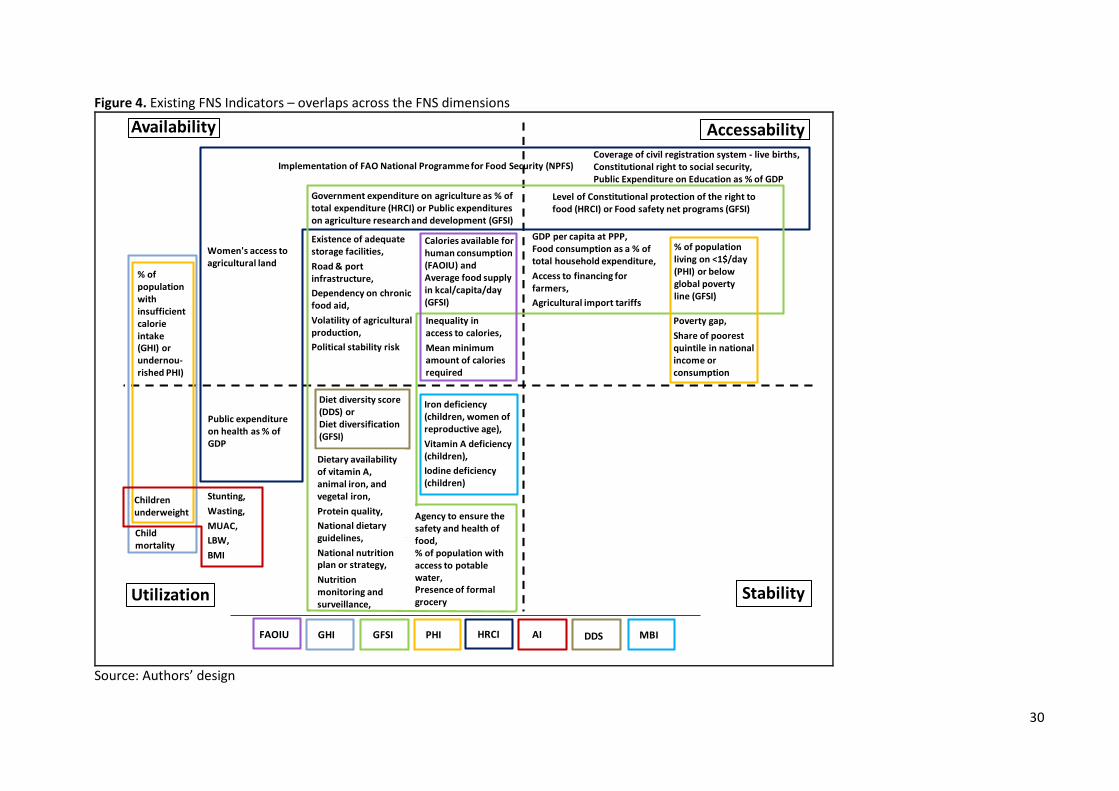
30
Figure 4. Existing FNS Indicators – overlaps across the FNS dimensions
Accessability
Utilization
Availability
Stability
Stunting,Wasting,MUAC,LBW,BMI
Children underweight
% of population with insufficient calorie intake (GHI) or undernou-rished PHI)
Child mortality
Iron deficiency (children, women of reproductive age),Vitamin A deficiency (children),Iodine deficiency (children)
Calories available for human consumption (FAOIU) and Average food supply in kcal/capita/day (GFSI)
Inequality in access to calories,Mean minimum amount of calories required
% of population living on <1$/day (PHI) or below global poverty line (GFSI)
Poverty gap,Share of poorest quintile in national income or consumption
Dietary availability of vitamin A, animal iron, and vegetal iron,Protein quality,National dietary guidelines,National nutrition plan or strategy,Nutrition monitoring and surveillance,
Public expenditure on health as % of GDP
Coverage of civil registration system - live births,Constitutional right to social security,Public Expenditure on Education as % of GDP
GDP per capita at PPP, Food consumption as a % of total household expenditure,Access to financing for farmers,Agricultural import tariffs
Women's access to agricultural land
Existence of adequate storage facilities,Road & port infrastructure, Dependency on chronic food aid,Volatility of agriculturalproduction,Political stability risk
Government expenditure on agriculture as % of total expenditure (HRCI) or Public expenditures on agriculture research and development (GFSI)
HRCIGFSIGHIFAOIU DDSAI MBIPHI
Level of Constitutional protection of the right to food (HRCI) or Food safety net programs (GFSI)
Implementation of FAO National Programme for Food Security (NPFS)
Agency to ensure the safety and health of food,% of population with access to potable water,Presence of formal grocery
Diet diversity score (DDS) or Diet diversification (GFSI)
Source: Authors’ design
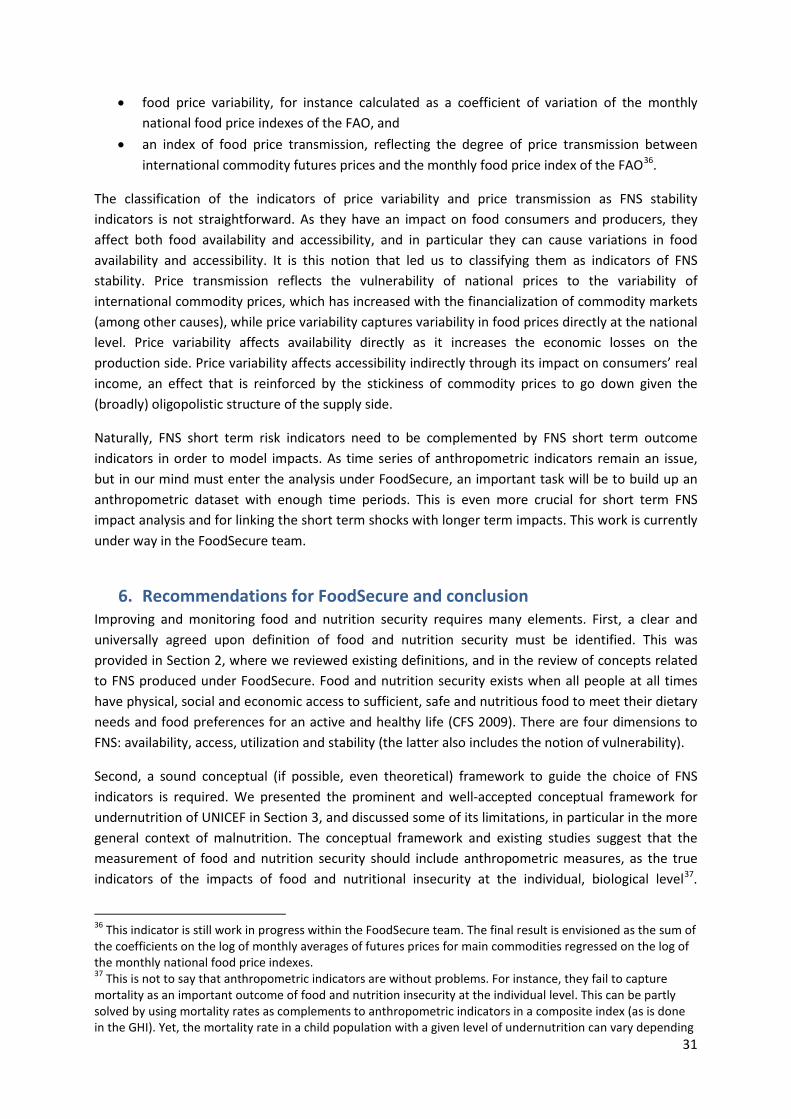
31
• food price variability, for instance calculated as a coefficient of variation of the monthly national food price indexes of the FAO, and
• an index of food price transmission, reflecting the degree of price transmission between international commodity futures prices and the monthly food price index of the FAO36.
The classification of the indicators of price variability and price transmission as FNS stability indicators is not straightforward. As they have an impact on food consumers and producers, they affect both food availability and accessibility, and in particular they can cause variations in food availability and accessibility. It is this notion that led us to classifying them as indicators of FNS stability. Price transmission reflects the vulnerability of national prices to the variability of international commodity prices, which has increased with the financialization of commodity markets (among other causes), while price variability captures variability in food prices directly at the national level. Price variability affects availability directly as it increases the economic losses on the production side. Price variability affects accessibility indirectly through its impact on consumers’ real income, an effect that is reinforced by the stickiness of commodity prices to go down given the (broadly) oligopolistic structure of the supply side.
Naturally, FNS short term risk indicators need to be complemented by FNS short term outcome indicators in order to model impacts. As time series of anthropometric indicators remain an issue, but in our mind must enter the analysis under FoodSecure, an important task will be to build up an anthropometric dataset with enough time periods. This is even more crucial for short term FNS impact analysis and for linking the short term shocks with longer term impacts. This work is currently under way in the FoodSecure team.
6. Recommendations for FoodSecure and conclusion Improving and monitoring food and nutrition security requires many elements. First, a clear and universally agreed upon definition of food and nutrition security must be identified. This was provided in Section 2, where we reviewed existing definitions, and in the review of concepts related to FNS produced under FoodSecure. Food and nutrition security exists when all people at all times have physical, social and economic access to sufficient, safe and nutritious food to meet their dietary needs and food preferences for an active and healthy life (CFS 2009). There are four dimensions to FNS: availability, access, utilization and stability (the latter also includes the notion of vulnerability).
Second, a sound conceptual (if possible, even theoretical) framework to guide the choice of FNS indicators is required. We presented the prominent and well-accepted conceptual framework for undernutrition of UNICEF in Section 3, and discussed some of its limitations, in particular in the more general context of malnutrition. The conceptual framework and existing studies suggest that the measurement of food and nutrition security should include anthropometric measures, as the true indicators of the impacts of food and nutritional insecurity at the individual, biological level37.
36 This indicator is still work in progress within the FoodSecure team. The final result is envisioned as the sum of the coefficients on the log of monthly averages of futures prices for main commodities regressed on the log of the monthly national food price indexes. 37 This is not to say that anthropometric indicators are without problems. For instance, they fail to capture mortality as an important outcome of food and nutrition insecurity at the individual level. This can be partly solved by using mortality rates as complements to anthropometric indicators in a composite index (as is done in the GHI). Yet, the mortality rate in a child population with a given level of undernutrition can vary depending
32
Further, existing sets of anthropometric data allow for a gender and spatial analysis of FNS, as they are collected through field surveys (e.g. in DHS, or UNICEF MICS). This paper emphasizes the importance of the gender dimension of food and nutrition security, particularly in combating long-term food and nutrition insecurity (intergenerational impacts, impacts of early life nutritional deficiencies on growth and productivity, etc.). Combining the anthropometric measures and other biomarker indicators, such as the prevalence of anemia, can provide more accurate information as anemia reflects poor micro-nutrient intake (iron), infection and chronic illness driven from poor health environment. Indicators of food and nutrition security are crucial to provide an accurate and workable description of the actual FNS status of target groups (called “outcomes” in this paper) and of its drivers, as well as to devise appropriate policy responses. Existing indicators of FNS are presented and briefly discussed in Sections 4 and classified in Section 5. The main elements resulting from this discussion and classification are as follows:
1. The composite indexes can mix FNS outcomes and drivers, which makes them hard to interpret for policy responses. This is true for the PHI and the GFSI. The GHI focuses on FNS outcomes, arguably the FAOIU, the DDS and the HRCI focus on FNS drivers. We suggest that a composite indicator should indeed focus on one or the other, for uptake in modeling and policy targeting in particular. The GHI is covering the dimensions of availability and utilization, respectively targeting the supply and demand side of FNS. Outcome indicators should indeed cover both sides of the analysis to be comprehensive and policy relevant. The GHI indirectly covers stability (lack of stability in availability and access will impact child underweight and child mortality, which are lagged indicators) and accessibility (the FAOIU, one of the components of the GHI, aims to capture availability and access). The FAOIU, DDS and HRCI are not exhaustive enough for a full coverage of FNS drivers (either because of the number of drivers reviewed or because of data availability/coverage).
2. The composite indicators have several overlaps, indicated in Figures 3 and 4. Thus it is difficult to use them as complements to each other.
3. The dimension of stability is poorly or not covered by the (groups of) indicators presented here.
4. In the dimension of utilization, nutritional outcomes (such as those measured by anthropometrics) are prominent but anthropometric data and biomarkers need to be integrated more systematically in FNS outcome indicators in order to direct and monitor policy interventions. This issue is also tied with that of data availability, as time series on anthropometrics and biomarker data are scarcely available.
5. The last food crises occurred at a time of high productivity, highlighting the importance of indicators that consider sustainable access to food. The presence of effective and efficient safety nets, micronutrient interventions, food reserves and institutional regulation are all important drivers of FNS to keep track of. Further, the nature of the recent food crisis calls for an enhanced focus on the role of markets for FNS, especially in the short term. This is lacking in the existing indicators presented here.
Based on the discussion above, we formulate the following recommendations in terms of the scope and focus of FNS indicators in FoodSecure.
on the environment substantially – anthropometric indicators are not at all perfect covariates of mortality rates.
33
The selection of FNS drivers and interventions and their indicators will most efficiently be addressed in the course of the FoodSecure project by the various teams of researchers focusing on the FNS impacts of political, environmental, economic and social factors. The large number of such indicators provided in Table A5 should serve as a guide. The list of FNS determinants can potentially be extended, but restrain should be exercised in order to keep to determinants which fit clearly in the theoretical framework depicted in this paper. The choice of indicator should follow the guidelines set in this paper and a direct connection between the indicator and the determinants should exist. Criteria such as traceability of the indicator (i.e. link to data) and clear indicator definitions are also part of these guidelines.
In the case of the assessment of FNS impacts, we feel it is important that the set of indicators of FNS outcomes is widely agreed and drawn upon by FoodSecure researchers. Based on the review provided by this paper, we have identified and listed in this last section the prime candidates for food security and nutrition security outcome indicators. They are summarized in Table 3.
It is clear that FNS indicators should cover the oldest indicators of food security (Headey and Ecker, 2012) such as calorie availability. As calorie availability (per capita) is limited in the sense that it does not cover the intake of micronutrients, diet diversity scores (DDS) can be used as complements (Hoddinott and Yohannes, 2002; Ruel, 2003). The diet diversity scores are proxy indicators of micronutrient intakes through a more diverse diet. Nevertheless, this combination would not be achieved without a cost, as the conversion of diet diversity score to micronutrients would require improvements in the methods of data collection on individuals’ diet. Further, calorie availability ignores the issue of access. Other indicators of availability reflecting the quality of the food consumed include indicators of the percentage of protein supplied from animal sources and the percentage of energy (calories) consumed coming from starchy staples.
Direct outcomes in terms of accessibility are difficult to identify. The households’ budget shares devoted to purchasing food products and commodities is the most direct indicator we came across. Potentially, this indicator could even be disaggregated according to the composition of the food basket. However, when used as a national average, this indicator can conceal inequality in access; the proportion of the population spending more than 75% of their income on food (for example) could be a useful cut-off based measure derived from it. The prevalence of undernourishment could be an indicator of availability or accessibility, or both. It appears increasingly driven by accessibility rather than availability issues, but this would need to be verified on a case by case basis. The same reasoning applies to the depth of the food deficit.
The need to have nutrition indicators (dimension of food utilization) was emphasized earlier. This paper suggests including anthropometric indicators such as stunting in the FNS outcome indicators. Stunting provides distinct benefits as it reflects broader interactions between food deficit, food intake reductions due to food price shocks, intra-household food distribution, health and environmental quality. Stunting has been selected by the Lancet series as the indicator to represent child undernutrition and it serves as the best predictor of long term consequences on human capital (Victora et al., 2008; Matorell, 2008). The prevalence of children underweight is influenced more strongly by short term variations in FNS, but has a weaker link to long term consequences of food and nutrition insecurity. Also, childhood obesity can mask nutritional deficiencies when the underweight indicators is used (Martorell 2008). If one must choose between stunting and underweight indicators, the former thus seems preferable. Diet Diversity Scores are only proxy
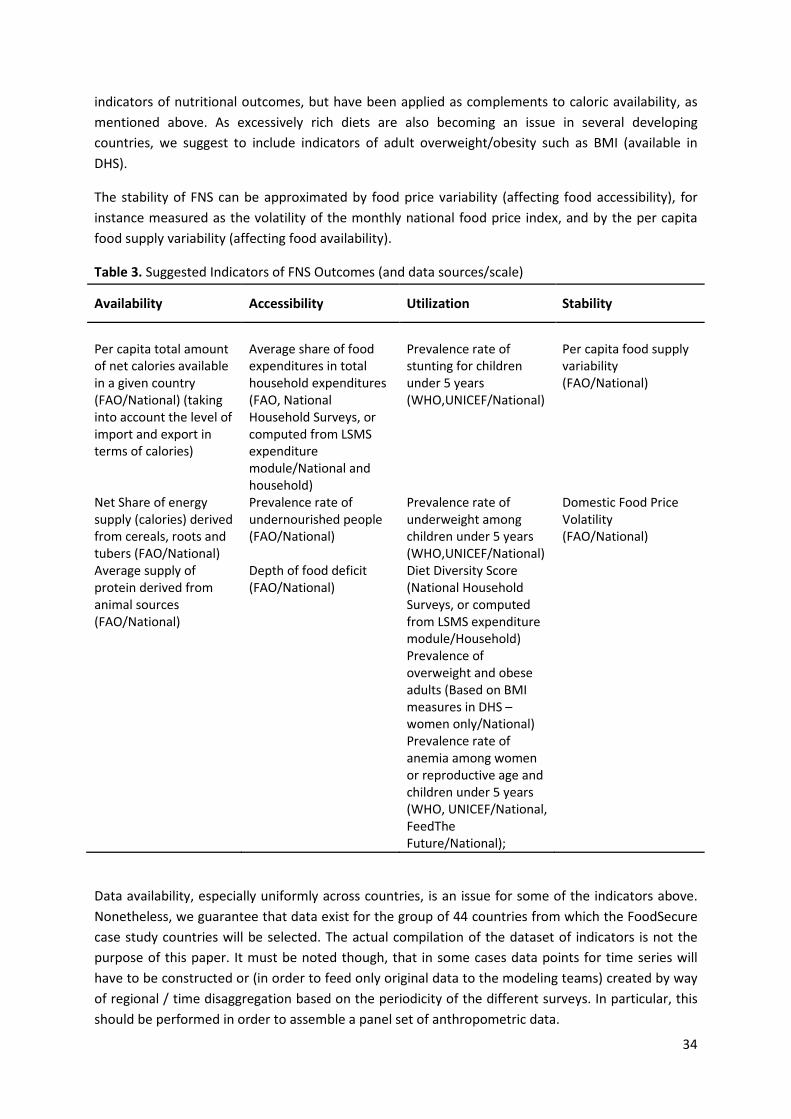
34
indicators of nutritional outcomes, but have been applied as complements to caloric availability, as mentioned above. As excessively rich diets are also becoming an issue in several developing countries, we suggest to include indicators of adult overweight/obesity such as BMI (available in DHS).
The stability of FNS can be approximated by food price variability (affecting food accessibility), for instance measured as the volatility of the monthly national food price index, and by the per capita food supply variability (affecting food availability).
Table 3. Suggested Indicators of FNS Outcomes (and data sources/scale)
Availability Accessibility Utilization Stability
Per capita total amount of net calories available in a given country (FAO/National) (taking into account the level of import and export in terms of calories)
Average share of food expenditures in total household expenditures (FAO, National Household Surveys, or computed from LSMS expenditure module/National and household)
Prevalence rate of stunting for children under 5 years (WHO,UNICEF/National)
Per capita food supply variability (FAO/National)
Net Share of energy supply (calories) derived from cereals, roots and tubers (FAO/National)
Prevalence rate of undernourished people (FAO/National)
Prevalence rate of underweight among children under 5 years (WHO,UNICEF/National)
Domestic Food Price Volatility (FAO/National)
Average supply of protein derived from animal sources (FAO/National)
Depth of food deficit (FAO/National)
Diet Diversity Score (National Household Surveys, or computed from LSMS expenditure module/Household)
Prevalence of overweight and obese adults (Based on BMI measures in DHS – women only/National)
Prevalence rate of anemia among women or reproductive age and children under 5 years (WHO, UNICEF/National, FeedThe Future/National);
Data availability, especially uniformly across countries, is an issue for some of the indicators above. Nonetheless, we guarantee that data exist for the group of 44 countries from which the FoodSecure case study countries will be selected. The actual compilation of the dataset of indicators is not the purpose of this paper. It must be noted though, that in some cases data points for time series will have to be constructed or (in order to feed only original data to the modeling teams) created by way of regional / time disaggregation based on the periodicity of the different surveys. In particular, this should be performed in order to assemble a panel set of anthropometric data.
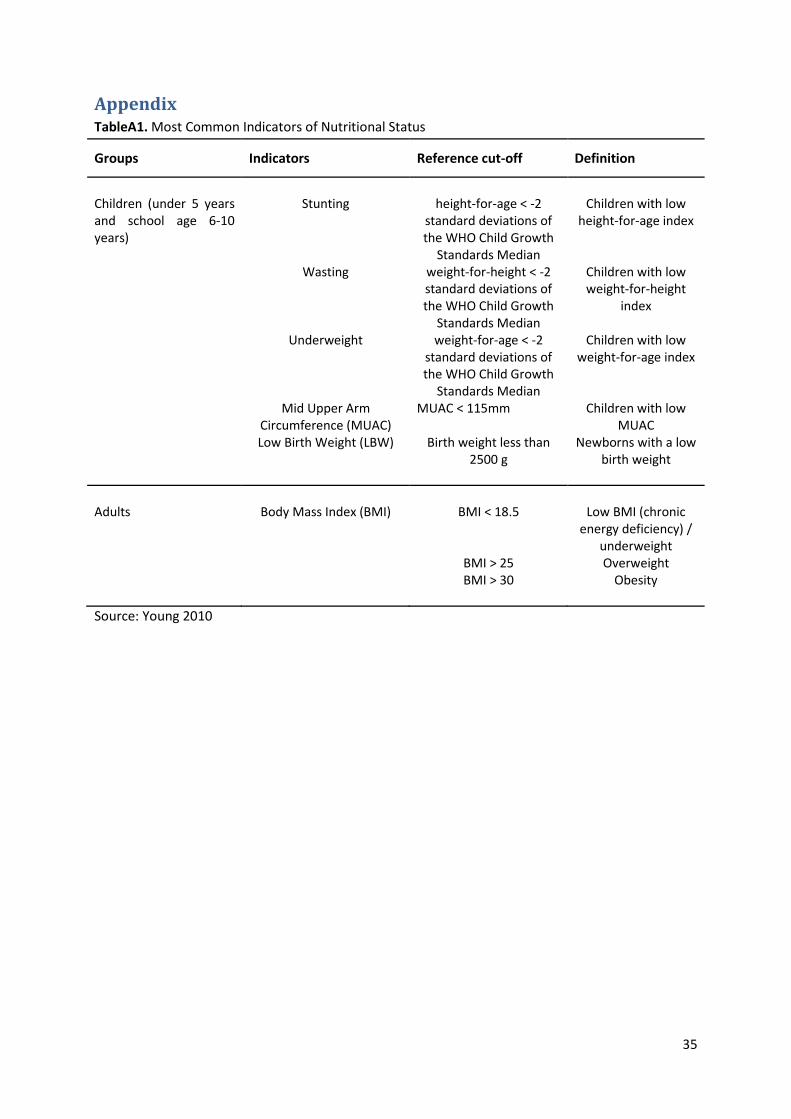
35
Appendix TableA1. Most Common Indicators of Nutritional Status
Groups Indicators Reference cut-off Definition
Children (under 5 years and school age 6-10 years)
Stunting height-for-age < -2 standard deviations of the WHO Child Growth
Standards Median
Children with low height-for-age index
Wasting weight-for-height < -2 standard deviations of the WHO Child Growth
Standards Median
Children with low weight-for-height
index
Underweight weight-for-age < -2 standard deviations of the WHO Child Growth
Standards Median
Children with low weight-for-age index
Mid Upper Arm Circumference (MUAC)
MUAC < 115mm Children with low MUAC
Low Birth Weight (LBW) Birth weight less than 2500 g
Newborns with a low birth weight
Adults Body Mass Index (BMI) BMI < 18.5 Low BMI (chronic
energy deficiency) / underweight
BMI > 25 Overweight BMI > 30 Obesity Source: Young 2010
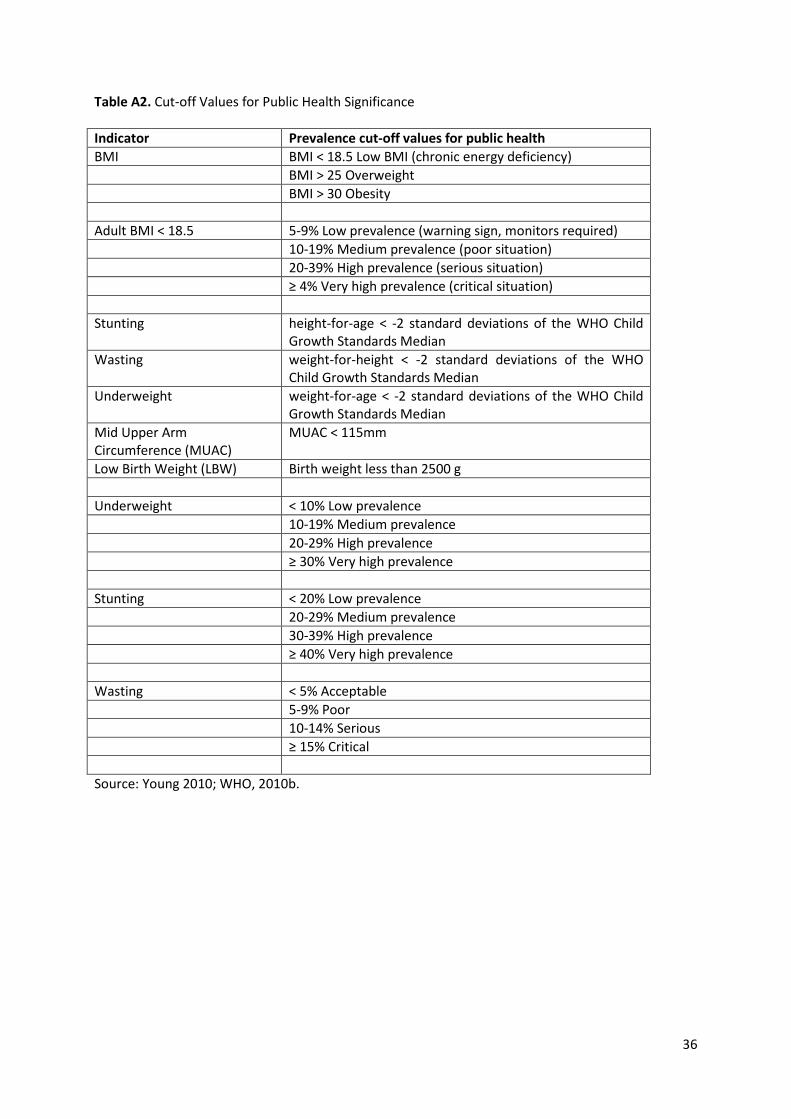
36
Table A2. Cut-off Values for Public Health Significance Indicator Prevalence cut-off values for public health BMI BMI < 18.5 Low BMI (chronic energy deficiency) BMI > 25 Overweight BMI > 30 Obesity Adult BMI < 18.5 5-9% Low prevalence (warning sign, monitors required) 10-19% Medium prevalence (poor situation) 20-39% High prevalence (serious situation) ≥ 4% Very high prevalence (critical situation) Stunting height-for-age < -2 standard deviations of the WHO Child
Growth Standards Median Wasting weight-for-height < -2 standard deviations of the WHO
Child Growth Standards Median Underweight weight-for-age < -2 standard deviations of the WHO Child
Growth Standards Median Mid Upper Arm Circumference (MUAC)
MUAC < 115mm
Low Birth Weight (LBW) Birth weight less than 2500 g Underweight < 10% Low prevalence 10-19% Medium prevalence 20-29% High prevalence ≥ 30% Very high prevalence Stunting < 20% Low prevalence 20-29% Medium prevalence 30-39% High prevalence ≥ 40% Very high prevalence Wasting < 5% Acceptable
5-9% Poor 10-14% Serious ≥ 15% Critical
Source: Young 2010; WHO, 2010b.
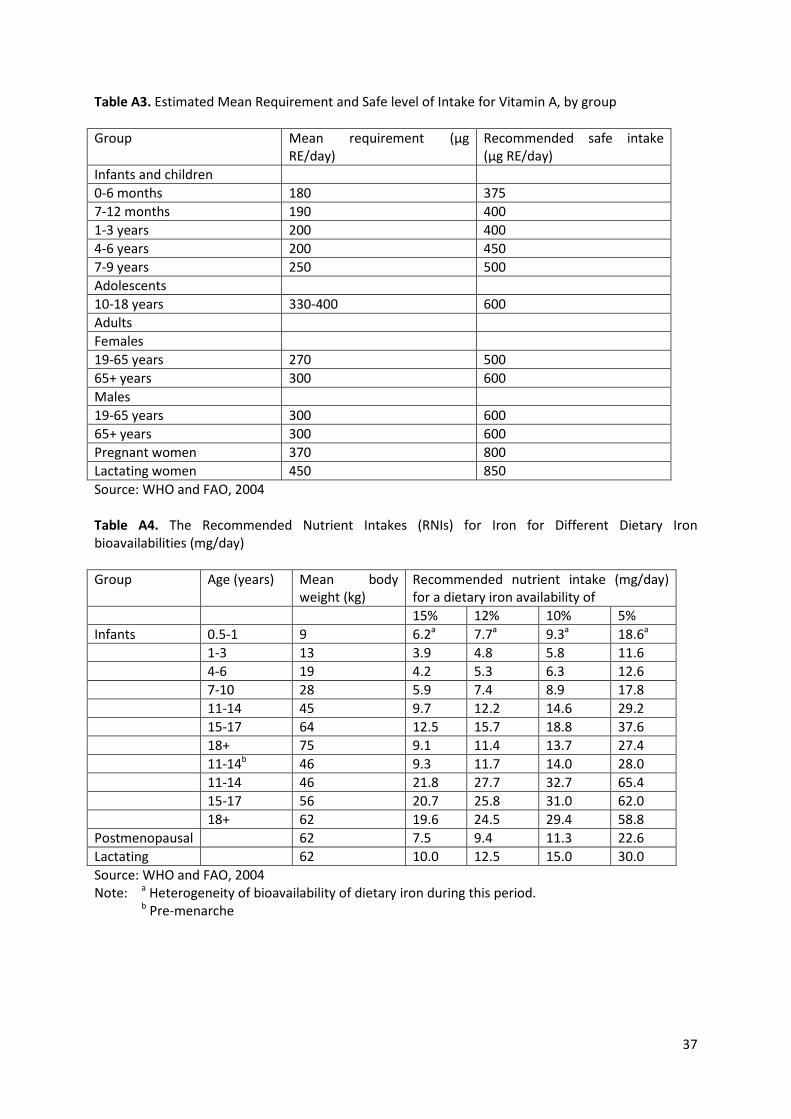
37
Table A3. Estimated Mean Requirement and Safe level of Intake for Vitamin A, by group Group Mean requirement (µg
RE/day) Recommended safe intake (µg RE/day)
Infants and children 0-6 months 180 375 7-12 months 190 400 1-3 years 200 400 4-6 years 200 450 7-9 years 250 500 Adolescents 10-18 years 330-400 600 Adults Females 19-65 years 270 500 65+ years 300 600 Males 19-65 years 300 600 65+ years 300 600 Pregnant women 370 800 Lactating women 450 850 Source: WHO and FAO, 2004 Table A4. The Recommended Nutrient Intakes (RNIs) for Iron for Different Dietary Iron bioavailabilities (mg/day) Group Age (years) Mean body
weight (kg) Recommended nutrient intake (mg/day) for a dietary iron availability of
15% 12% 10% 5% Infants 0.5-1 9 6.2a 7.7a 9.3a 18.6a
1-3 13 3.9 4.8 5.8 11.6 4-6 19 4.2 5.3 6.3 12.6 7-10 28 5.9 7.4 8.9 17.8 11-14 45 9.7 12.2 14.6 29.2 15-17 64 12.5 15.7 18.8 37.6 18+ 75 9.1 11.4 13.7 27.4 11-14b 46 9.3 11.7 14.0 28.0 11-14 46 21.8 27.7 32.7 65.4 15-17 56 20.7 25.8 31.0 62.0 18+ 62 19.6 24.5 29.4 58.8 Postmenopausal 62 7.5 9.4 11.3 22.6 Lactating 62 10.0 12.5 15.0 30.0 Source: WHO and FAO, 2004 Note: a Heterogeneity of bioavailability of dietary iron during this period. b Pre-menarche
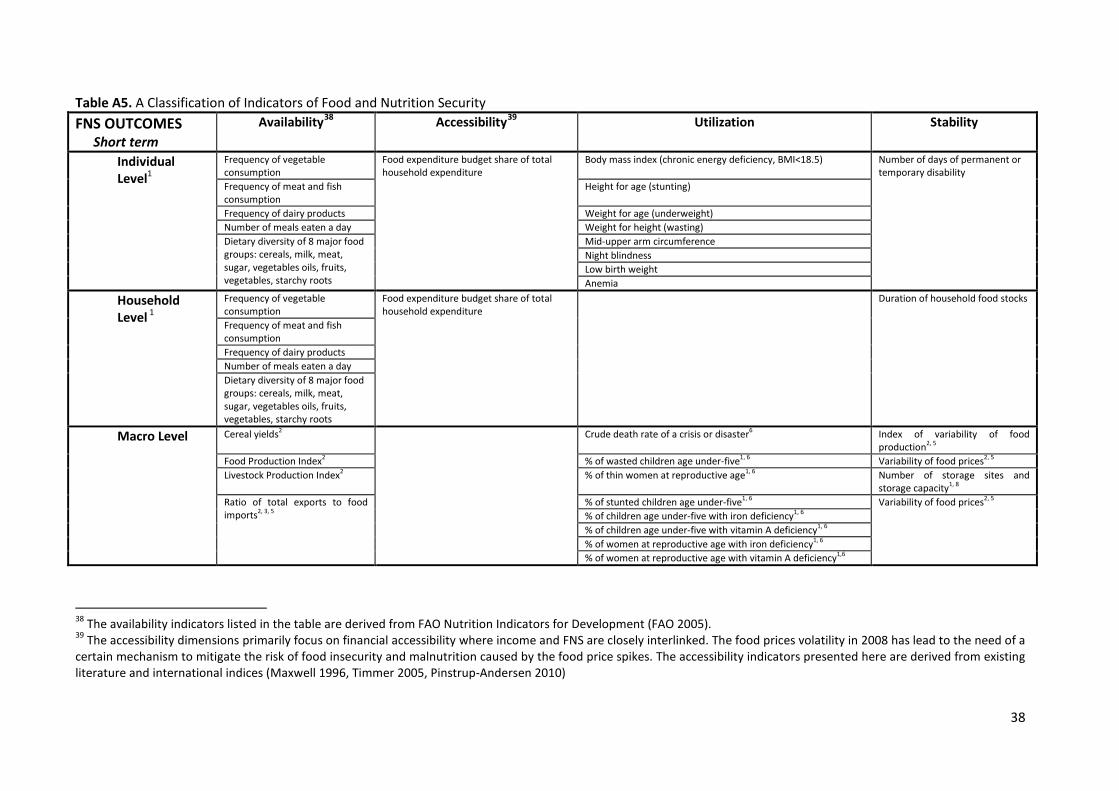
38
Table A5. A Classification of Indicators of Food and Nutrition Security FNS OUTCOMES
Short term Availability38 Accessibility39 Utilization Stability
Individual Level1
Frequency of vegetable consumption
Food expenditure budget share of total household expenditure
Body mass index (chronic energy deficiency, BMI<18.5) Number of days of permanent or temporary disability
Frequency of meat and fish consumption
Height for age (stunting)
Frequency of dairy products Weight for age (underweight) Number of meals eaten a day Weight for height (wasting) Dietary diversity of 8 major food groups: cereals, milk, meat, sugar, vegetables oils, fruits, vegetables, starchy roots
Mid-upper arm circumference Night blindness Low birth weight Anemia
Household Level 1
Frequency of vegetable consumption
Food expenditure budget share of total household expenditure
Duration of household food stocks
Frequency of meat and fish consumption Frequency of dairy products Number of meals eaten a day Dietary diversity of 8 major food groups: cereals, milk, meat, sugar, vegetables oils, fruits, vegetables, starchy roots
Macro Level Cereal yields2 Crude death rate of a crisis or disaster6 Index of variability of food production2, 5
Food Production Index2 % of wasted children age under-five1, 6 Variability of food prices2, 5 Livestock Production Index2 % of thin women at reproductive age1, 6 Number of storage sites and
storage capacity1, 8 Ratio of total exports to food imports2, 3, 5
% of stunted children age under-five1, 6 Variability of food prices2, 5 % of children age under-five with iron deficiency1, 6 % of children age under-five with vitamin A deficiency1, 6 % of women at reproductive age with iron deficiency1, 6 % of women at reproductive age with vitamin A deficiency1,6
38 The availability indicators listed in the table are derived from FAO Nutrition Indicators for Development (FAO 2005). 39 The accessibility dimensions primarily focus on financial accessibility where income and FNS are closely interlinked. The food prices volatility in 2008 has lead to the need of a certain mechanism to mitigate the risk of food insecurity and malnutrition caused by the food price spikes. The accessibility indicators presented here are derived from existing literature and international indices (Maxwell 1996, Timmer 2005, Pinstrup-Andersen 2010)
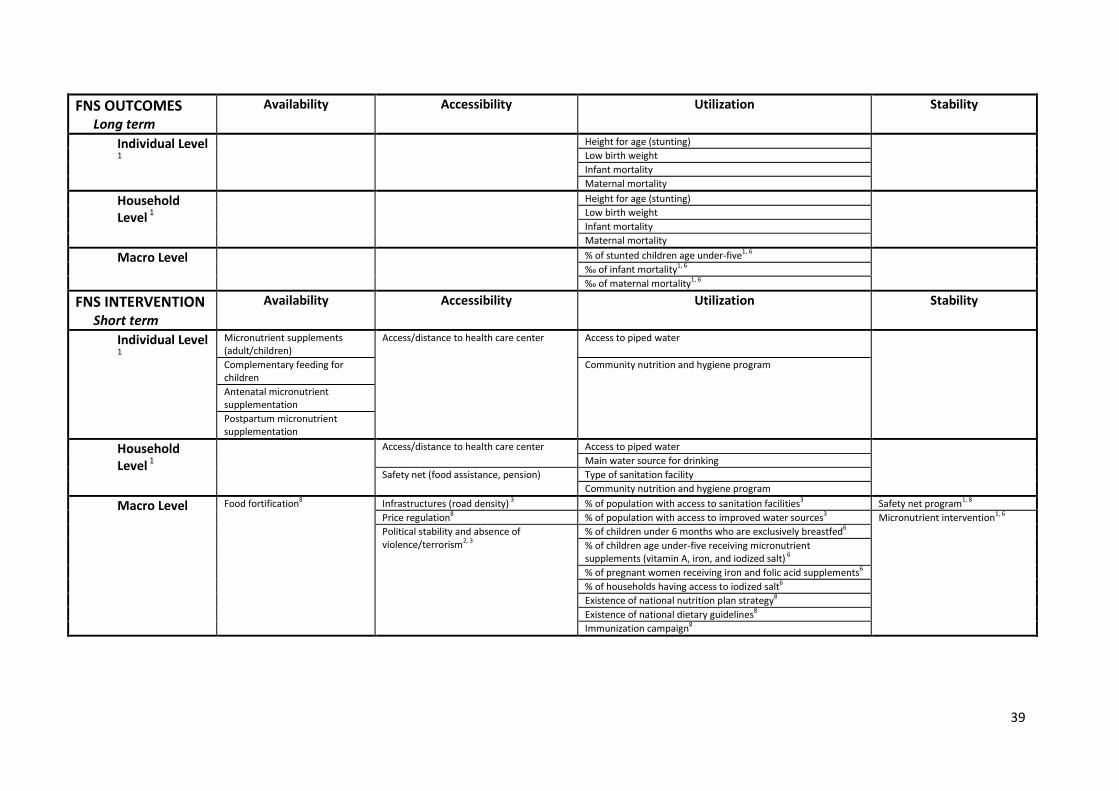
39
FNS OUTCOMES Long term
Availability Accessibility Utilization Stability
Individual Level 1
Height for age (stunting) Low birth weight Infant mortality Maternal mortality
Household Level 1
Height for age (stunting) Low birth weight Infant mortality Maternal mortality
Macro Level % of stunted children age under-five1, 6 ‰ of infant mortality1, 6 ‰ of maternal mortality1, 6
FNS INTERVENTION Short term
Availability Accessibility Utilization Stability
Individual Level 1
Micronutrient supplements (adult/children)
Access/distance to health care center Access to piped water
Complementary feeding for children
Community nutrition and hygiene program
Antenatal micronutrient supplementation Postpartum micronutrient supplementation
Household Level 1
Access/distance to health care center Access to piped water Main water source for drinking
Safety net (food assistance, pension) Type of sanitation facility Community nutrition and hygiene program
Macro Level Food fortification8 Infrastructures (road density) 3 % of population with access to sanitation facilities3 Safety net program1, 8 Price regulation8 % of population with access to improved water sources3 Micronutrient intervention1, 6 Political stability and absence of violence/terrorism2, 3
% of children under 6 months who are exclusively breastfed6 % of children age under-five receiving micronutrient supplements (vitamin A, iron, and iodized salt) 6 % of pregnant women receiving iron and folic acid supplements6 % of households having access to iodized salt6 Existence of national nutrition plan strategy8
Existence of national dietary guidelines8
Immunization campaign8
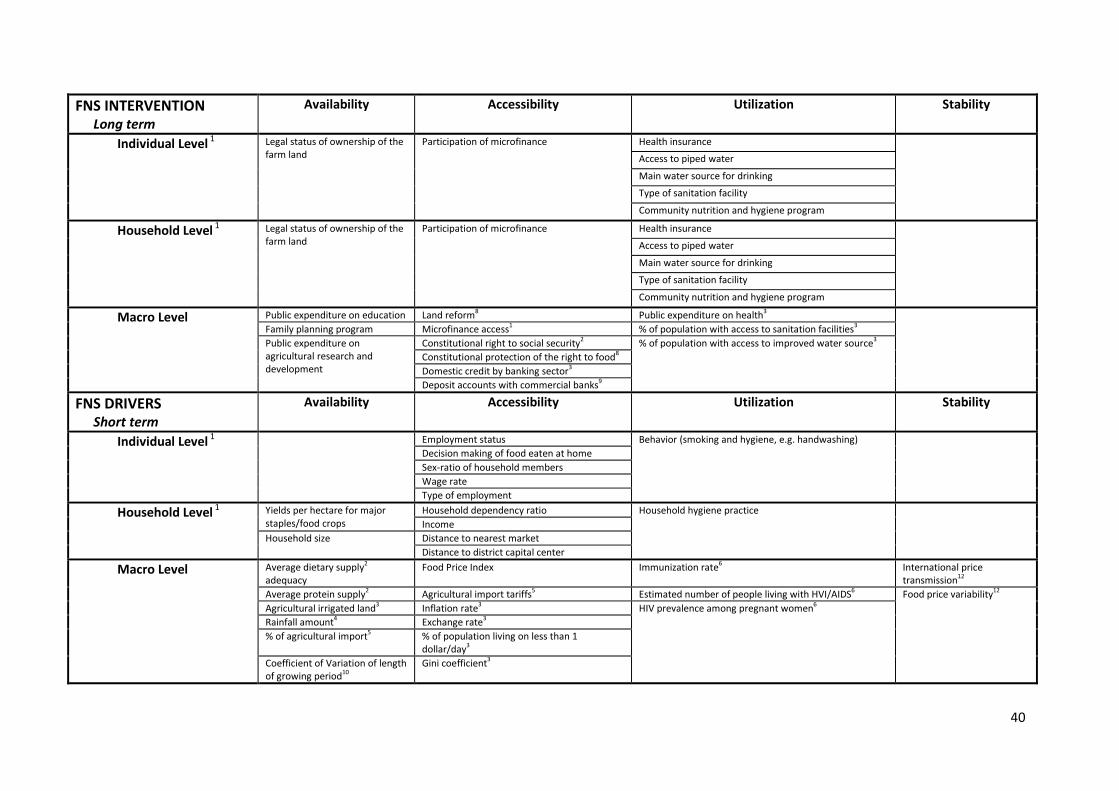
40
FNS INTERVENTION Long term
Availability Accessibility Utilization Stability
Individual Level 1 Legal status of ownership of the farm land
Participation of microfinance Health insurance Access to piped water
Main water source for drinking
Type of sanitation facility
Community nutrition and hygiene program
Household Level 1 Legal status of ownership of the farm land
Participation of microfinance Health insurance Access to piped water
Main water source for drinking
Type of sanitation facility
Community nutrition and hygiene program
Macro Level Public expenditure on education Land reform8 Public expenditure on health3 Family planning program Microfinance access1 % of population with access to sanitation facilities3 Public expenditure on agricultural research and development
Constitutional right to social security2 % of population with access to improved water source3 Constitutional protection of the right to food8
Domestic credit by banking sector3
Deposit accounts with commercial banks9
FNS DRIVERS Short term
Availability Accessibility Utilization Stability
Individual Level 1 Employment status Behavior (smoking and hygiene, e.g. handwashing) Decision making of food eaten at home Sex-ratio of household members Wage rate Type of employment
Household Level 1 Yields per hectare for major staples/food crops
Household dependency ratio Household hygiene practice Income
Household size Distance to nearest market Distance to district capital center
Macro Level Average dietary supply2 adequacy
Food Price Index Immunization rate6 International price transmission12
Average protein supply2 Agricultural import tariffs5 Estimated number of people living with HVI/AIDS6 Food price variability12
Agricultural irrigated land3 Inflation rate3 HIV prevalence among pregnant women6 Rainfall amount4 Exchange rate3 % of agricultural import5 % of population living on less than 1
dollar/day3 Coefficient of Variation of length of growing period10
Gini coefficient3
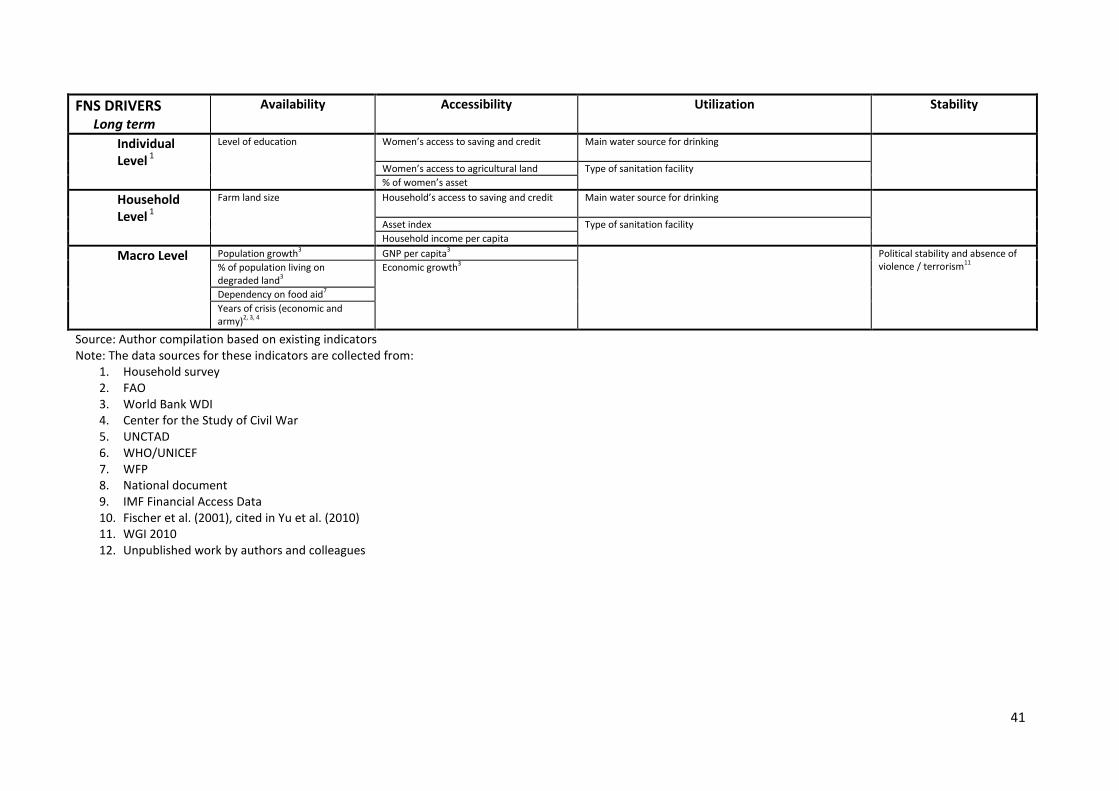
41
FNS DRIVERS Long term
Availability Accessibility Utilization Stability
Individual Level 1
Level of education Women’s access to saving and credit Main water source for drinking
Women’s access to agricultural land Type of sanitation facility % of women’s asset
Household Level 1
Farm land size Household’s access to saving and credit Main water source for drinking
Asset index Type of sanitation facility Household income per capita
Macro Level Population growth3 GNP per capita3 Political stability and absence of violence / terrorism11 % of population living on
degraded land3 Economic growth3
Dependency on food aid7 Years of crisis (economic and army)2, 3, 4
Source: Author compilation based on existing indicators Note: The data sources for these indicators are collected from:
1. Household survey 2. FAO 3. World Bank WDI 4. Center for the Study of Civil War 5. UNCTAD 6. WHO/UNICEF 7. WFP 8. National document 9. IMF Financial Access Data 10. Fischer et al. (2001), cited in Yu et al. (2010) 11. WGI 2010 12. Unpublished work by authors and colleagues
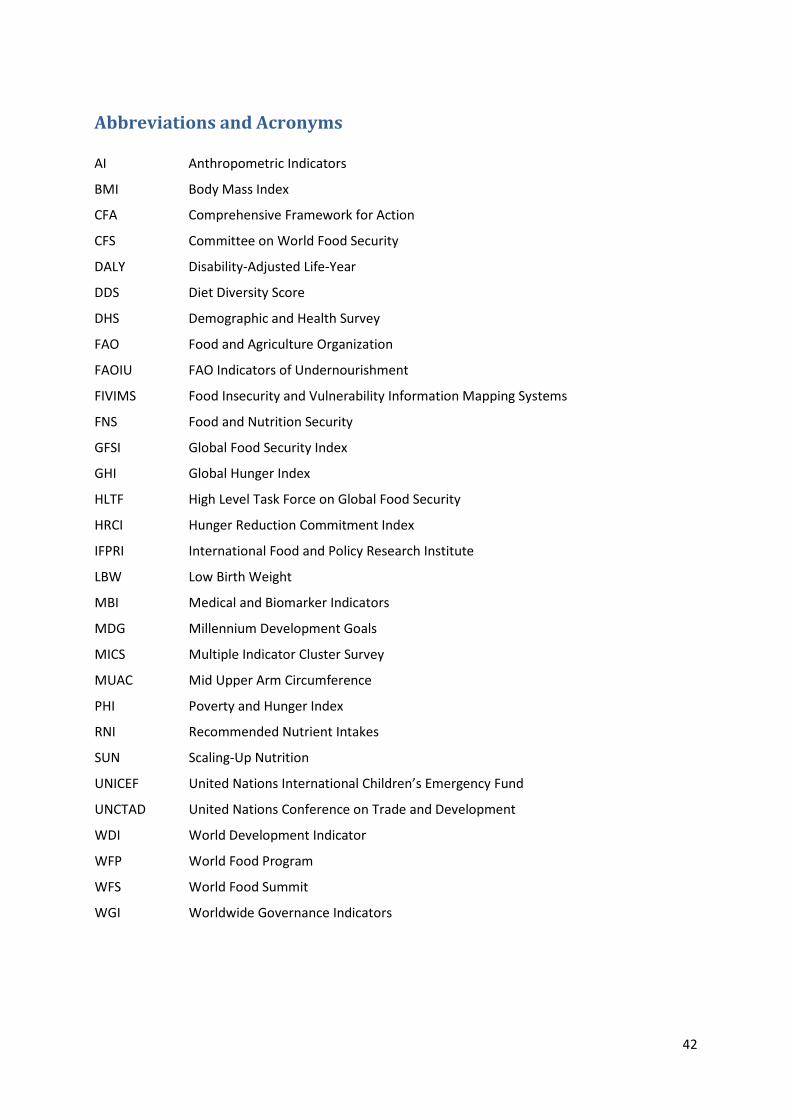
42
Abbreviations and Acronyms AI Anthropometric Indicators
BMI Body Mass Index
CFA Comprehensive Framework for Action
CFS Committee on World Food Security
DALY Disability-Adjusted Life-Year
DDS Diet Diversity Score
DHS Demographic and Health Survey
FAO Food and Agriculture Organization
FAOIU FAO Indicators of Undernourishment
FIVIMS Food Insecurity and Vulnerability Information Mapping Systems
FNS Food and Nutrition Security
GFSI Global Food Security Index
GHI Global Hunger Index
HLTF High Level Task Force on Global Food Security
HRCI Hunger Reduction Commitment Index
IFPRI International Food and Policy Research Institute
LBW Low Birth Weight
MBI Medical and Biomarker Indicators
MDG Millennium Development Goals
MICS Multiple Indicator Cluster Survey
MUAC Mid Upper Arm Circumference
PHI Poverty and Hunger Index
RNI Recommended Nutrient Intakes
SUN Scaling-Up Nutrition
UNICEF United Nations International Children’s Emergency Fund
UNCTAD United Nations Conference on Trade and Development
WDI World Development Indicator
WFP World Food Program
WFS World Food Summit
WGI Worldwide Governance Indicators
43
References Acharya, L.B., and Cleland, J., 2000. Maternal and child health services in rural Nepal: does access or
quality matter more?, Health Policy and Planning, 15(2): 223-229. Amouzou, A., Habi, O., and Bensaid, K., 2012. Reduction in Child Mortality in Niger- a countdown to
2015 country case study, The Lancet, 380(9848): 1169-1178 Babatunde, R. O., and Qaim, M., 20120. Impact of Off-farm Income on Food Security and Nutrition in
Nigeria, Food Policy, 35(4): 303-311. Banerjee, A. V., and Duflo, E., 2011. Poor Economics: A Radical Thinking of the Way to Fight Global
Poverty, Public Affairs, New York. Bardhan, K., and Klasen, S., 1999. UNDP’S Gender Related Indices: a critical review, World
Development, 27(6): 985-1010. Barrett, C. B., 2010. Measuring Food Insecurity, Science, 327: 825-828. Bhargava, A., Bouis, H., and Scrimshaw, N., 2001. Dietary Intakes and Socioeconomic Factors are
Associated with the Hemoglobin Concentration of Bangladeshi Women, Journal of Nutrition, 131(3): 758-764.
Behrman, J. R., 1993. The Economic Rationale for Investing in Nutrition in Developing Countries, World Development, 21(11): 1749-1771.
Bhutta, Z. A., Ahmed, T., Black, R., Cousens, S., Dewey, K., Giugliani, E., Haider, B. A., Kirkwood, B., Morris, S. S., Sachdev, H. P., Shekar, M., 2008. What Works? Interventions for Maternal and Child Undernutrition and Survival, The Lancet, 371(9610): 471-440.
Black, R. E., Allen, L. H., Bhutta, Z. A., Caulfields, L., de Onis, M., Ezzati, M., Mathers, C., and Rivera, J., 2008. Maternal and Child Undernutrition: global and regional exposures and health consequences, The Lancet, 371(9608): 243-260.
Block, S. A., Kiess, L., Webb, P., Kosen, S., Moench-Pfanner, R., Bloem, M. W., and Timmer, P. C., 2004. Macro Shocks and Micro Outcomes: child nutrition during Indonesia’s crisis, Economics and Human Biology, 2(1): 21-44.
Briel, T., West, C. E., Hautvast, J. G., Vulsma, T., Vijlder, J., and Ategbo, E. A., 2011. Serum Thyroglobulin and Urinary Iodine Concentration Are the Most Appropriate Indicators of Iodine Status and Thyroid Function under Conditions of Increasing Iodine Supply in Schoolchildren in Benin, International Journal of Nutrition, 131(10): 2701-2706.
Bryce, J., Boschi-Pinto, C., Shibuya, K., and Black, R. E., 2005. WHO Estimates of the Causes of Death in Children, The Lancet, 365(9465): 1147-1152.
Byerlee, D., Jayne, T. S., Myers, R. J., 2006. Managing Food Price Risks and Instability in a Liberalizing Market Environment: overview and policy options, Food Policy, 31(4): 275-287.
Campbell, C. C., 1991. Food Insecurity: a nutritional outcome or a predictor variable, Journal of Nutrition, 121: 408-415.
CFS, 2009. Reform of the Committee on World of Food Security: Final Version, Available at: ftp://ftp.fao.org/docrep/fao/meeting/018/k7197e.pdf [Accessed September 19, 2012]
CFS, 2012. Coming to Terms with Food Security, Nutrition Security, Food Security and Nutrition, Food and Nutrition Security, Available at: http://www.fao.org/docrep/meeting/026/MD776E.pdf [Accessed September 19, 2012]
Chambers, R., 1990. Rapid but Relaxed and Participatory Rural Appraisal: Towards Applications in Health and Nutrition, Paper presented at the International Conference on Rapid Assessment, Pan American Health Organization Headquarters, Washington, D. C.
Chung, K. L., Haddad, L., Ramakrishna, J., and Riely, F., 1997. Identifying the food insecure: the application of mixed-method approaches in India. International Food Policy Research Institute, Washington, D. C.
Conway, G., 2012. One Billion Hungry: can we feed the world?, Cornell University Press, Ithaca. Dasgupta, P., 1993. An Inquiry into Well-being and Destitution, Clarendon Press, Oxford. Dasgupta, P., 1997. Nutritional Status, the Capacity for Work, and Poverty Traps, Journal of
Econometrics, 77(1): 5-37.
44
Dasgupta, P., and Ray, D., 1986. Inequality as a Determinant of Malnutrition and Unemployment: theory, The Economic Journal, 96(384): 1011-1034.
Daurès, J. P., Gerber, M., Scali. J., Astre, C., Bonifacj, C. and Kaaks, R., 2000. Validation of a Food Frequency Questionnaire using Multiple-day Records and Biochemical Markers: application of the triads method, Journal of Epidemiology and Biostatistics, 5: 109-15.
Deaton, A., 1997. The Analysis of Household Surveys: a microeconometric approach to development policy, World Bank, Washington, D. C.
Deaton, A., and Grosh, M., 2000. Chapter 5: Consumption, in P. Glewwe and M. Grosh (eds)., Designing Household Survey Questionnaires for Developing Countries: lessons from 15 years of the Living Standards Measurement Study, World Bank, Washington, D. C.
Deaton, A., and Dreze, J., 2009. Food and Nutrition in India: facts and interpretations, Economics and Political Weekly, 44(7): 42-65.
de Haen, H., Klasen, S., and Qaim, M., 2011. What Do we Really Know? Metrics for Food Insecurity and Undernutrition, Food Policy, 36: 760-769.
del Ninno, C., Dorosh, P.A., and Subbarao, K., 2007. Food aid, domestic policy and food security: Contrasting experiences from South Asia and sub-Saharan Africa, Food Policy, 32, 413–435.
Dreze, J., and Sen, A., 1989. Hunger and Public Action, Oxford University Press, Oxford. Economist Intelligence Unit, 2011. Global Food Security Index 2012: an assessment of food
affordability, availability, and quality, Economist, London. Ecker, O., Breisinger, C., 2012. The food security system: A new conceptual framework (IFPRI
discussion paper No. 1166). International Food Policy Research Institute (IFPRI). Eele, G., 1994. Indicators for Food Security and Nutrition Monitoring: a review of experience from
Southern Africa, Food Policy, 19(3): 314-328. Fan, S., 2012. Improving Food and Nutrition Security Information for Better Measurement and
Effective Decision Making, 2012 International Scientific Symposium on Food and Nutrition Security, Available at: http://www.foodsec.org/fileadmin/user_upload/eufao-fsi4dm/docs/FAN_Improving_Food_and_Nutrition_Security_Information_Paper.pdf, , [Accessed November 14, 2012]
FAO, 1996. The Sixth World Survey, FAO, Rome. FAO, 2000. The State of Food Insecurity in the World 2000, FAO, Rome. FAO, 2006. The Double Burden of Malnutrition: case studies from six developing countries, FAO,
Rome. FAO, 2011. The State of Food and Agriculture – Women in Agriculture – Closing the Gender Gap for
Development, FAO, Rome. FAO, 2012. The State of Food Insecurity in the World 2012: economic growth is necessary but nor
sufficient to accelerate reduction of hunger and malnutrition, FAO, Rome. Feed the Future, 2012. M&E Guidance Series: Volume 8 Population-Based Survey Instrument for
Feed the Future Zone of Influence Indicators with Revised WEAI Module, Available at: http://www.feedthefuture.gov/sites/default/files/resource/files/ftf_vol8_populationbasedsurveyinstrument_oct2012.pdf [Accessed January 19, 2013]
Ferro-Luzzi, A., Morris, S. S., Taffesse, S., Demissie, T., and D’Amato, M., 2001. Seasonal undernutrition in rural Ethiopia : magnitude, correlates, and functional significance , Research report 118, International Food Policy Research, Washington D.C.
Field, E., Robles, O., and Torero, M., 2009. Iodine Deficiency and Schooling Attainment in Tanzania, American Economic Journal: Applied Economics, 1(4): 140-169.
Fischer, G., Shah, M., Velthuizen, H. and Nachtergaele, F., 2001. Global agro-ecological assessment for agriculture in the 21st century. Laxenburg, Austria: International Institute for Applied Systems Analysis.
FIVIMS, 2002. Making FIVIMS Work for You: Tools and Tips, FAO ESD, Rome. http://www.fivims.org/index.php?option=com_sobi2&sobi2Task=sobi2Details&sobi2Id=140&Itemid=71 [Accessed November 30th 2012].
45
Francken, N., Minten, B. and Swinnen, J., 2012. The Political Economy of Relief Allocation: Evidence from Madagascar. World Development, 40(3): 486-500.
Frankenberg, E., 1995. The Effects of Access to Health Care on Infant Mortality in Indonesia, Health Transition Review, 5(2): 143-163.
Frankenberger, T. R., 1991. Indicators and Data Collection Methods for Assessing Household Food Security, in S. Maxwell and T. Frankenberger, Household Food Security: Concepts, Indicators, and Measurements. A Technical Review, UNICEF/IFAD.
Frankenberger, T. R., Oshaug, A., and Smith, L. C., 1997. A definition of nutrition security. CARE Mimeo.
Gentilini, U., and Webb, P., 2008. How are We Doing on Poverty and Hunger Reduction?, Food Policy, 33: 521-532.
Gross, R., and Webb, P., 2006. Wasting Time for Wasted Children: severe child undernutrition must be resolved in non-emergency settings, The Lancet, 367: 1209-1211.
Habicht, J., and Pelletier, D., 1990. The Importance of Context in Choosing Nutritional Indicators, Journal of Nutrition, 120S(11): 1519-1524.
Haddad, L., Kennedy, E., and Sullivan, J., 1994. Choice of Indicators for Food Security and Nutrition Monitoring, Food Policy, 19(3): 329-343.
Hatloy, A., Torheim, L., and Oshaug, A., 1998. Food Variety - a good indicator of nutritional adequacy of the diet? A case study from an urban area in Mali, West Africa, European Journal of Clinical Nutrition, 52(12): 891-898.
Hawkes, C., Eckhardt, C., Ruel, M., and Minot, N., 2005. Diet Quality, Poverty, and Food Policy: a new research agenda for obesity prevention in developing countries, SCN News, 29: 20-22.
Headey, D., 2012. Turning Economic Growth into Nutrition-Sensitive Growth, in S. Fan and R. Pandya-Lorch (eds). Reshaping Agriculture for Nutrition and Health, International Food Policy Research Institute, Washington, D. C.
Headey, D., and Ecker, O., 2012. Improving the Measurement of Food Security, IFPRI Discussion Paper 01225, International Food Policy Research Institute, Washington, D. C.
Hoddinott, J., and Yohannes, Y., 2002. Dietary Diversity as a Food Security Indicator, FCND Discussion Paper No. 136, IFPRI. International Food Policy Research Institute, Washington, D. C.
Hoddinott, J., Maluccio, J. A., Behrman, J. R., and Martorell, R., 2008. Effect of a Nutrition Intervention during Early Childhood on Economic Productivity in Guatemalan Adults, The Lancet, 371(9610): 411-416.
Hoddinot, J., Rosegrant, M., and Torero, M., 2012. Investments to Reduce Hunger and Undernutrition, Copenhagen Consensus 2012 Challenge Paper Hunger and Malnutrition, Available at: http://www.copenhagenconsensus.com/Default.aspx?ID=1633 [Accessed December 21, 2012]
Huang, J., Yang, J., Msangi, S., Rozellec, S., and Weersink, A., 2012. Biofuels and the Poor: global impact pathways of biofuels on agricultural markets, Food Policy, 37(4): 439-451.
Hunter, D., 1998. Biochemical Indicators of Dietary Intake, in W. Willet (ed). Nutritional Epidemiology, Oxford University Press, New York.
Iannotti, L., and Robles, M., 2011. Negative impact on calorie intake associated with the 2006-08 food price crisis in Latin America, Food and Nutrition Bulletin, 32(2): 112-123.
Jayne, T.S., Strauss, J., Yamano, T., and Molla, D., 2001. Giving to the Poor? Targeting of Food Aid in Rural Ethiopia, World Development, 29, 887–910.
Kabagambe, K., Baylin, A., Allan, D. A., Siles, X., Spiegelman, D., Campos, H., 2001. Application of the Method of Triads to Evaluate the Performance of Food Frequency Questionnaires and Biomarkers as Indicators of Long-term Dietary Intake, American Journal of Epidemiology, 154(12): 1126-1135.
Kant, A., Schtzkin, A., and Ziegler, R., 1995. Dietary Diversity and Subsequent Cause-Specific Mortality in the NHANES I Epidemiology Follow-up Study, Journal of the American College of Nutritionists, 14: 233-238.
46
Karlan, D., and Appel, J., 2011. More Than Good Intentions: how a new economics is helping to solve global poverty, Dutton, New York.
Lintelo, D. J. H., 2012. Measuring Political Commitment to Reducing Hunger and Under-nutrition: can it be done and will it help?, IDS Bulletin, 43(S1): 65-73.
Lutter, C. K., and Lutter, R., 2012. Fetal and Early Childhood Undernutrition, Mortality, and Lifelong Health, Science, 337: 1495-1499.
Maire, B., and Delpeuch, F., 2005. Nutrition Indicators for Development, FAO, Rome, Available at http://www.fao.org/docrep/008/y5773e/y5773e00.htm, [Accessed November 29, 2012]
Masset, E., 2011. A Review of Hunger Indices and Methods to Monitor Country Commitment to Fighting Hunger, Food Policy, 36: S102-S108.
Martorell, R., 2008. Malnutrition and Hunger, Copenhagen Consensus 2008 Perspective Paper, Available at: http://www.copenhagenconsensus.com/Default.aspx?ID=1322, [Accessed December 18, 2012]
Maxwell, S., 1996. Food Security: a post-modern perspective, Food Policy, 21(1): 155-170. Maxwell, S., and Smith, M., 1991. Household Food Security: a conceptual review, in S. Maxwell and T.
Frankenberger, Household Food Security: Concepts, Indicators, and Measurements. A Technical Review, UNICEF/IFAD.
Miller, W., Crabtree, B., and Evans, D., 1992. Exploratory Study of the Relationship between Hypertension and Diet Diversity among Saba Islanders, Public Health Reports, 107(4): 426-432.
Moron, C., and Viteri, F. E., 2009. Update on Common Indicators of Nutritional Status: food access, food consumption, and biochemical measures of iron and anemia, Nutrition Reviews, 67(S1): 531-535.
Naiken, L., 2003. FAO Methodology for Estimating the Prevalence of Undernourishment, Proceeding Measurement and Assessment of Food Deprivation and Undernutrition, FAO, Rome.
Nübler, I., 1995. The Human Development Index Revisited, Intereconomics, 173-176. O’Donnell, O., van Doorslaer, E., Wagstaff, A., and Lindelow, M., 2008.Analyzing Health Equity Using
Household Survey data: a guide to techniques and their implementation, The World bank, Washington, D. C.
Olusanya, B. O., 2005. State of the World’s Children: life beyond survival, Archives of Disease in Childhood, 90(3): 317-318.
Pelletier, D., 2008. Beyond Partial Analysis, Nutrition and Health, 887-914, DOI: 10.1007/978-1-59745-464-3_34.
Pinstrup-Andersen, P., 2010. The African Food System and Human Health and Nutrition: a conceptual and empirical overview, in P. Pinstrup-Andersen (ed.), The African Food System and Its Interaction with Human Health and Nutrition, Cornell University Press, Ithaca.
Pinstrup-Andersen, P., and Watson II, D., 2011. Food Policy for Developing Countries, Cornell University Press, Ithaca and London.
Popkin, B. M., Adair, L. S., and Ng, S. W., 2012. Global Nutrition Transition and the Pandemic of Obesity in Developing Countries, Nutrition Reviews, 70(1): 3-21.
Qaim, M., Stein, A. J., and Meenakshi, J. V., 2007. Economics of Biofortification, Agricultural Economics, 37(S1): 119-133.
Quisumbing, A. R., Brown, L. R., Feldstein, H. S., Haddad, L., Pena, C., 1995. Women: the key to food security, IFPRI, Washington, D. C.
Quisumbing, A. R., and Maluccio, J. A., 2003. Resources at Marriage and Intrahousehold Allocation: evidence from Bangladesh, Ethiopia, Indonesia, and South Africa, Oxford Bulletin of Economics and Statistics, 65(3): 0305-9049.
Quisumbing, A. R., and McClafferty, B., 2006. Food Security in Practice: using gender research in development. International Food Policy Research Institute, Washington, D. C.
Rao, S., Yajnik, C. S., Kanade, A., Fall, C. H. D., Margetts, B. M., Jackson, A. A., Shier, R., Joshi, S., Rege, S., Lubree, H., and Desai, B., 2001. Intake of Micronutrient-rich Foods in Rural Indian Mothers
47
is Associated with the Size of their Babies at Birth: Pune Maternal Nutrition Study, Journal of Nutrition, 131(4): 1217-1224.
Rosegrant, M.W., Paisner, M.S., Meijer, S., Witcover, J., 2001. Global food projections to 2020: emerging trends and alternative futures. International Food Policy Research Institute, Washington, D. C.
Rosegrant, M. W, Tokgoz, S., and Bhandary, P., 2012. A New Normal? A Tighter Global Agricultural Supply and Demand Relation and Its Implications for Food Security, American Journal of Agricultural Economics, doi: 10.1093/ajae/aas041.
Ruel, M. T., 2003. Operationalizing Dietary Diversity: A Review of Measurement Issues and Research Priorities, Journal of Nutrition, 133: 3911S-3926S.
Ruel, M. T., Deitchler, M., and Arimond, M., 2010. Developing Simple Measures of Women’s Diet Quality in Developing Countries: overview, Journal of Nutrition, 140(11): 2048S-2050S.
Savy, M., Martin-Prevel, Y., Sawadogo, P., Kameli, Y., and Delpeuch, F., 2005. Use of Variety/Diversity Scores for Diet Quality Measurement: relation with nutritional status of women in a rural area in Burkina Faso, European Journal of Clinical Nutrition, 59: 703-716.
Scaramozzino, P., 2006. Measuring Vulnerability to Food Insecurity, ESA Working Paper No. 06-12, FAO, Rome.
Schultz, T. P., 1984. Studying the Impact of Household Economic and Community Variables on Child Mortality, in W. H. Moseley and L. Chen (eds.), Child Survival: Strategies for Research, Population and Development Review, 10(Supplement): 215-236.
Sen, A., 1981. Poverty and Famine: an Essay on Entitlement and Deprivation, Oxford University Press, New York.
Senauer, B., Garcia. M., and Jacinto, E., 1988. Determinants of the Intrahousehold Allocation of Food in the Rural Philippines, American Journal of Agricultural Economics, 70: 170-180.
Shetty, P., 2012. India’s Diabetes Time Bomb, Nature, 485: S14-S16. Smith, L. C., and Haddad, L., 2000. Explaining Child Malnutrition in Developing Countries: a cross
country analysis, IFPRI Research Monograph No. 111, International Food Policy Research Institute, Washington, D. C.
Stirling, A., 1998. Risk at Turning Point?, Journal of Risk Research, 1(2): 97-109. Stirling, A., 2007. Risk, Precaution and Science, EMBO Reports, 8: 309-315. Strauss, J., 1986. Does Better Nutrition Raise Farm Productivity?, Journal of Political Economy, 94(2):
297-320. Strauss, J., 1990. Households, Communities, and Preschool Children’s Nutrition Outcomes: evidence
from Rural Cote d’Ivoire, Economic Development and Cultural Changes, 38: 231-262. Strauss, J., and Thomas, D., 1995. Human Resources: empirical modeling of household and family
decisions, in J. R. Behrman and T. N. Srinivasan (eds)., Handbook of Development Economics, Volume 3A, North Holland Press, Amsterdam.
Strauss, J. and Thomas, D., 1998. Health, Nutrition and Economic Development, Journal of Economic Literature, 36(2): 766-817.
Strauss, J., and Thomas, D., 2007. Health over the Life Course, in T. P. Schultz and J. A. Strauss (eds.), Handbook of Development Economics, Volume 4, North Holland Press, Amsterdam.
SUN, 2010. A Road Map for Scaling-Up Nutrition, Available at http://unscn.org/files/Activities/SUN/SUN_Road_Map_english.pdf, [Accessed February 27, 2011]
Svedberg, P., 1998. 841 Million Undernourished?, World Development, 27: 2081-2098 Svedberg, P., 2000. Poverty and Undernutrition, Oxford University Press, New York. Svedberg, P., 2002. Undernutrition Overestimated, Economic Development and Cultural Change,
51(1): 5-36. Svedberg, P., 2011. How Many People are Malnourished?, Annual Review of Nutrition, 31: 263-283. Swinnen, J., 2011. The Right Price of Food, Development Policy Review, 29:6 667-688. Thomas, D., and Frankenberg, E., 2002. Health, Nutrition and Prosperity: a microeconomic
perspective, Bulletin of the World Health Organization, 80(2): 106-113.
48
Torero, M., 2012. Food Prices: Riding the Rollercoaster, in 2011 Global Food Policy Report, International Food Policy Research Institute, Washington, D. C.
Timmer, P., 2005. Food Economic and Economic Growth: an Asian perspective, Asian-Pacific Economic Literature, 19(1): 1-17.
Timmer, P., 2010. Preventing Food Crisis using a Food Policy Approach, Journal of Nutrition, 140: 2245-2285.
Timmer, P., 2012. Behavioral Dimensions of Food Security, Proceeding National Academic of Sciences, 109(31): 12315-12320.
Utomo, B., Sucahya, P. K., and Utami, F. R., 2011. Priorities and Realities: addressing the rich-poor gaps in health status and service access in Indonesia, International Journal of Equity in health, 10(47): 1-14.
Victora, C. G., Adair, L., Fall, C., Hallal, P. C., and Martorell, R., 2008. Maternal and Child Undernutrition: consequences for adult health and human capital, The Lancet, 371(9609): 340-357.
von Braun, J., Bouis, H., Kumar, S., and Pandya-Lorch, R., 1992. Improving Food Security of The Poor: Concept, Policy, and Programs, International Food Policy Research Institute, Washington, D. C.
von Braun, J., 2008. The food crisis isn’t over, Nature, 456, 701–701. von Braun, J., and Tadesse, G., 2012. Global Food Price Volatility and Spikes: An Overview of Costs,
Causes, and Solutions, ZEF Discussion Papers on Development Policy No. 161, Bonn. von Braun, J., and Torero, M., 2012. Implementing Physical, and Virtual Food Reserves to Protect the
Poor and Prevent Market Failure, in B. Lilliston and A. Ronallo (eds.), Grain Reserves and the Food Price Crisis: selected writings from 2008-2012, IATP.
Walker, S. P., Wachs, T. D., Gardner, J. M., Lozoff, B., Wasserman, G. A., Politt, E., and Carter, J. A., 2007. Child Development: risk factors for adverse outcomes in developing countries, The Lancet, 369(9556): 145-157.
von Grebmer, K., Torero, M., Olofinbiyi, T., Fritschel, H., Wiesmann, D., Yohannes, Y., Schofield, L., and von Oppeln, C., 2011. 2011 Global Hunger Index: the challenge of hunger: taming price spikes and excessive food price volatility, Welthungerhilfe, IFPRI, and Concern, Bonn, Washington, D.C., and Dublin.
Wasantwisut, E., and Neufled, L., 2012. Use of Nutritional Biomarkers in Program Evaluation in the Context of Developing Countries, American Society for Nutrition, 142(1): 1865-1905.
Webb, P., 2010. Medium to Long-Run Implications of High Food Prices for Global nutrition, Journal of Nutrition, 143S-147S.
Weingärtner, L., 2010. The Concept of Food and Nutrition Security, in K. Klennert (ed.), Achieving Food and Nutrition Security: actions to meet the global challenge – A training course reader (3rd Edition), Inwent, Bonn.
WGI 2010, http://www.govindicators.org. WHO and FAO, 2004. Vitamin and Mineral Requirement in Human Nutrition, FAO, Rome. WHO, 2010a. Indicators to Monitor the Implementation of the Comprehensive Implementation
Plan, http://www.who.int/nutrition/EB128_18_backgroundpaper4_nutrition_indicators.pdf WHO, 2010b. Nutrition Landscape Information System (NLIS) Country Profile Indicators:
Interpretation Guide, WHO; Geneva. Wiesmann, D., von Braun, J., and Feldbruegge, T., 2002. An International Nutrition Index: A big
picture of successes and failures in addressing hunger and malnutrition, Quarterly Journal of International Agriculture, 41(4): 277-296.
Wiesmann, D., 2004. An international Nutrition Index: concept and analyses of food insecurity and undernutrition at country levels. Dissertation. Peter Lang, Frankfurt a. M.
Wiesmann, D., 2006. A Global Hunger Index: Measurement Concept, Ranking of Countries, and Trends. FCND Discussion Paper 212, IFPRI.
World Bank, 2006. Repositioning Nutrition as Central to Development: a strategy for large-scale action, The World Bank, Washington, D. C.
49
Young, H., 2010. Nutrition in Emergencies: indicators and Reference Levels, in R. Parker and M. Sommer (eds.), Handbook of Global Public Health, Routledge, New York.
Yu, B., You, L., and Fan, S., 2010. Toward a Typology of Food Security in Developing Countries. DSGD Discussion Paper 00945, IFPRI.
This project is funded by the European Union under the 7th Research Framework Programme (theme SSH) Grant agreement no. 290693
The FOODSECURE project in a nutshell Title FOODSECURE – Exploring the future of global food and nutrition security
Funding scheme 7th framework program, theme Socioeconomic sciences and the humanities
Type of project Large-scale collaborative research project
Project Coordinator Hans van Meijl (LEI Wageningen UR)
Scientific Coordinator Joachim von Braun (ZEF, Center for Development Research, University of Bonn)
Duration 2012 - 2017 (60 months)
Short description
In the future, excessively high food prices may frequently reoccur, with severe
impact on the poor and vulnerable. Given the long lead time of the social
and technological solutions for a more stable food system, a long-term policy
framework on global food and nutrition security is urgently needed.
The general objective of the FOODSECURE project is to design effective and
sustainable strategies for assessing and addressing the challenges of food and
nutrition security.
FOODSECURE provides a set of analytical instruments to experiment, analyse,
and coordinate the effects of short and long term policies related to achieving
food security.
FOODSECURE impact lies in the knowledge base to support EU policy makers
and other stakeholders in the design of consistent, coherent, long-term policy
strategies for improving food and nutrition security.
EU Contribution
€ 8 million
Research team 19 partners from 13 countries
FOODSECURE project office LEI Wageningen UR (University & Research centre) Alexanderveld 5 The Hague, Netherlands
T +31 (0) 70 3358370 F +31 (0) 70 3358196 E [email protected] I www.foodscecure.eu