Embed Size (px)
Citation preview

Food and Beverage Manufacturing in the
Empire State Chart Book
2015
Regional Profiles of Labor Force Supply and Demand for the Food and Beverage Manufacturing Industries

2
Table of Contents Introduction 3
Economic Regions 4
Jobs in Food & Beverage Manufacturing 5
Trends and Outlook for Jobs in Food & Beverage Manufacturing 5
Trends in Food & Beverage Manufacturing Compared with Other Manufacturing and All Sectors 9
Establishments in Food & Beverage Manufacturing 13
Employee characteristics 16
Stable Employment, New Hires and Turnover 16
Workers by sex 18
Workers by age 23
Workers by race 28
Workers by educational attainment 33
Total Population Counts 38
Population by Selected Age Groups 38
Population by Selected Cohort Groups 43
Population characteristics 46
Educational Attainment by Age and Region 46
Median earnings by Age and Region 48
Language Proficiency by Age/Education/Region 49
Veterans 51
U.S. Citizenship and Place of Birth 54
Characteristics by Labor force Status 57
Local Workforce Investment Areas 58
Appendix A: Industry Classifications 60
Appendix B: Sources of Data 61

3
Introduction
In New York State the Food and Beverage Manufacturing industry accounts for more than 1-out-of-8 jobs in Manufacturing. The industry has been a bright spot in the post-Recession economy as the number of jobs have not only recovered but now exceed the pre-Recession peaks. The industry is on pace to exceed in 2022 the up-beat forecasts prepared in 2012 by the New York State Department of Labor. For continued growth in Food and Beverage Manufacturing a supply of appropriately skilled workers is required. The focus of this chart book is to profile for New York State and its Economic Development Regions characteristics of the current workforce, identify who the new hires are, and provide basic demographics on the supply of future workers.
On a statewide basis the Food and Beverage Manufacturing workforce is younger than the general workforce in manufacturing, with a higher proportion of whom are African Americans and Latinos. The turnover rate for the workforce in Food and Beverage Manufacturing is much higher than manufacturing in general. New hires in comparison with workers with stable jobs in the Food and Beverage Manufacturing industry are far more likely to be females, and under the age of 35 years. With respect to years of education, the new hires and stable workers are similarly diverse with many workers having less than a high school diploma, on up to those with a Bachelor's or advanced degree.
The general workforce in New York State will be smaller and older by 2020 due to aging in the general population and lower rates of labor force participation by older persons, putting a premium on workforce development to meet the growing demand for workers.
This chart book provides insights regarding the supply and demand for labor in New York State’s Food and Beverage manufacturing industries. The project was completed in collaboration with the New York Association of Training and Employment Professionals (NYATEP) and the Cornell Cooperative Extension – Harvest New York program. Special thanks to the New York State Department of Labor for their assistance and the Workforce Development Institute for funding this project. The state and regional profiles present information on the total resident population and on employees in the food and beverage manufacturing industries. The total population represents the pool of potential employees while the employee data profile those currently at work in the food and beverage manufacturing industries. The population data are reported for the locations where people reside, while the employee data are reported for their work locations. Technical details for all sections of the Chart Book are presented in Appendix C.

4
Economic Regions Throughout this chart book comparisons are made between economic development regions. These regions are used by several NY agencies, for example Regional Economic Development Councils, Department of Labor, and Economic State Development.
This map shows the economic regions and the percentage of manufacturing jobs that are in Food and Beverage manufacturing. Statewide 13% of all manufacturing jobs are in Food and Beverage manufacturing.

5
Jobs in Food & Beverage Manufacturing
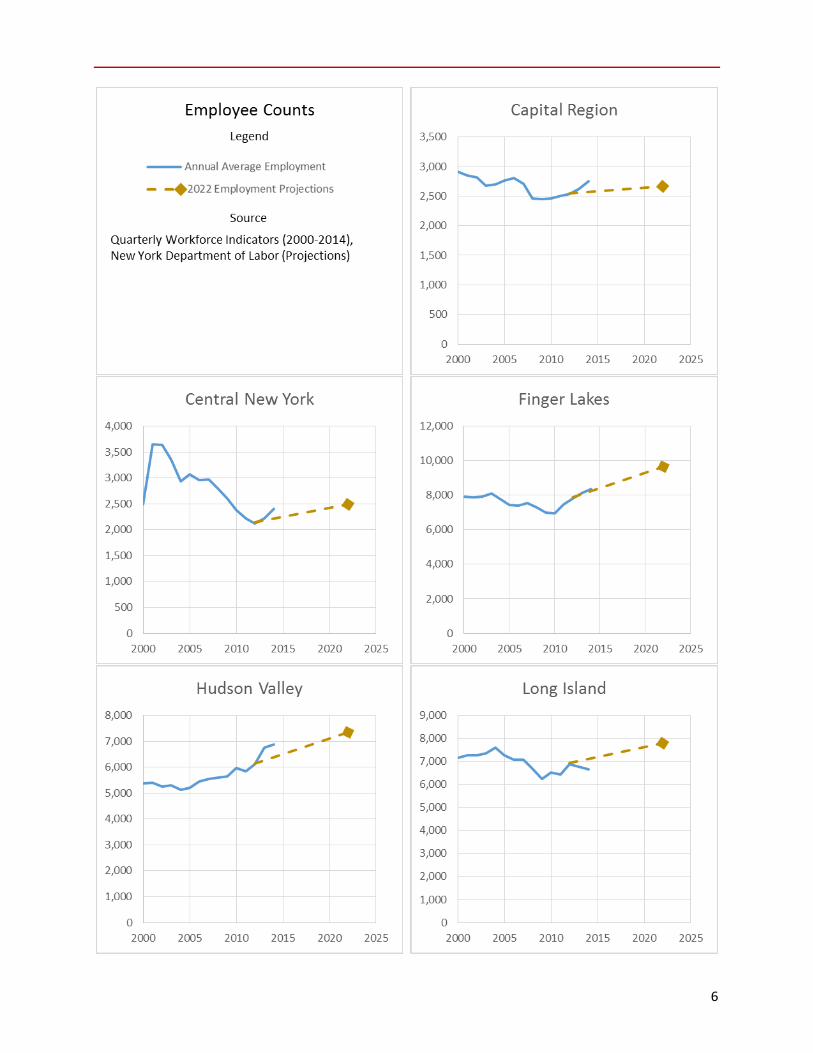
Trends and Outlook for Jobs in Food & Beverage Manufacturing • In New York State the number of jobs in Food and Beverage Manufacturing (FBM) has been
increasing since 2009, bouncing back from the earlier downward trend that bottomed out in the Great Recession.
• The Hudson Valley, Southern Tier, and Mohawk Valley Regions have had job growth leading to levels 20% to 28% above where they were in 2000.
• The Central and Western New York Regions have steadily declined roughly 30% since 2000 with no post-Recession rebound.
2000 2005 2010 2011 2012 2013 2014 2022 New York State 62,005 57,094 55,484 56,028 58,361 59,648 60,888 65,160 Capital Region 2,917 2,761 2,463 2,507 2,533 2,620 2,750 2,660 Central New York 2,496 3,067 2,378 2,215 2,126 2,224 2,404 2,490 Finger Lakes 7,899 7,435 6,972 7,481 7,813 8,126 8,357 9,670 Hudson Valley 5,379 5,196 5,968 5,855 6,118 6,757 6,884 7,350 Long Island 7,168 7,268 6,516 6,440 6,869 6,780 6,660 7,810 Mohawk Valley 2,227 2,153 2,556 2,579 2,555 2,571 2,685 2,730 New York City 16,739 14,743 15,292 15,233 16,259 16,345 17,268 18,610 North Country 1,292 1,421 1,284 1,233 1,174 1,212 1,245 950 Southern Tier 3,083 2,816 2,895 3,333 3,645 3,934 3,848 4,190 Western New York 11,404 10,130 9,074 9,004 9,061 8,679 8,483 8,710
6

7

8
Notes:
• These charts are based on Quarterly Census of Employment and Wages (QCEW) data available through the New York State Department of Labor and their projections.
• The projections are based in 2012 whereas the QCEW data is available through 2014. Some discrepancies between the projections and observed counts is to be expected.
• Number of workers in Beverage manufacturing in Onondaga County was suppressed for the year 2000, a total number of workers of 1,100 is assumed in these analyses.
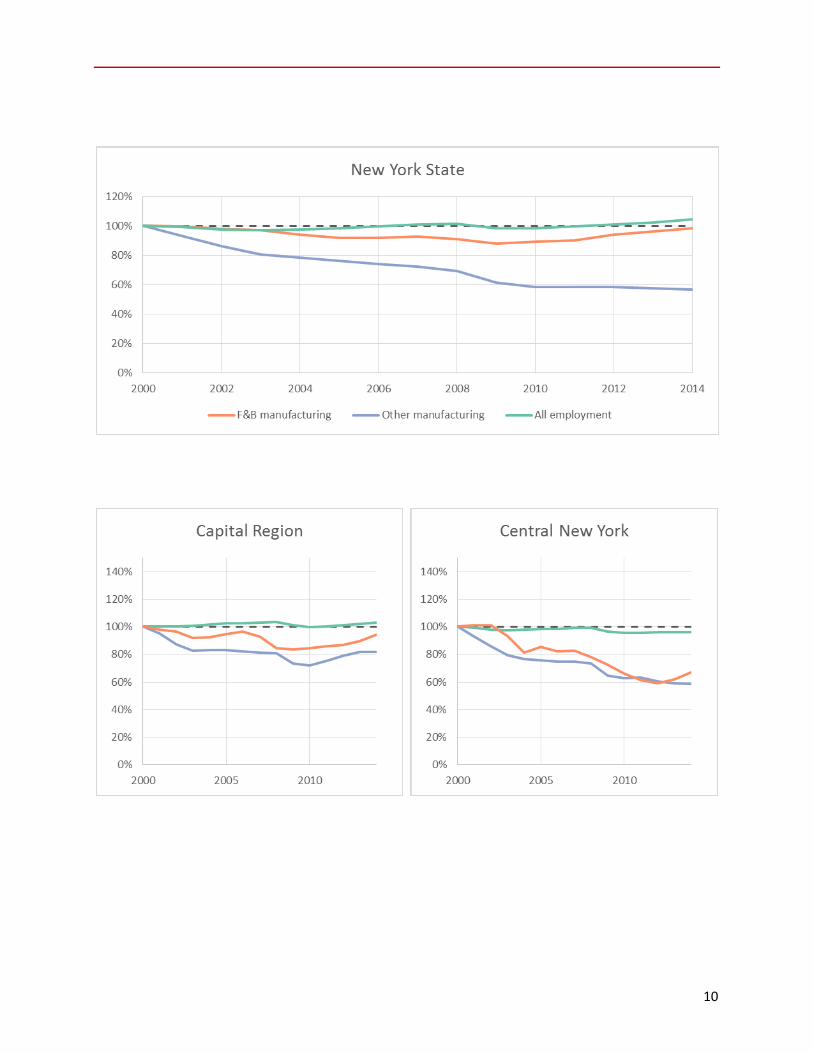
• The last chart in this chapter compares the time series between regions by setting the 2000 number of workers at a 100%.

9
Trends in Food & Beverage Manufacturing Compared with Other Manufacturing and All Sectors
• In New York State the number of jobs in Food and Beverage Manufacturing has been increasing since 2009 reversing the downward trend between 2000 and 2009.
• As a whole jobs in the remainder of manufacturing have been steadily declining to less than 60% of the level of 2000. There are selected manufacturing industries that have fared better as well as worse.
• Total number of jobs across all sectors in New York State has not varied substantially since 2000. • The Food and Beverage manufacturing industry fared much better than the other
manufacturing industries as a whole in most regions. Most notable is the performance of Food and Beverage manufacturing in the Finger Lakes, Mid-Hudson, Mohawk Valley, and New York City, and Southern Tier Regions, but the number of jobs in other manufacturing is less than 60% of the level of 2000.
10

11

12

13
Establishments in Food & Beverage Manufacturing
• After a slight decline in the beginning of last decade, the number of establishments in the Food and Beverage manufacturing has slowly increased statewide and in many of the regions.
• The average number of workers per establishment has slowly been declining statewide and in most of the regions. This can be because of arrival of new small businesses or through lay-offs of existing establishments.
• New York City has the lowest average number of workers per establishment, indicating many small firms and Western New York has the highest average number, although declining.

14

15

16
Employee characteristics Stable Employment, New Hires and Turnover
• 13% of the jobs in manufacturing in New York State are in Food and Beverage manufacturing. • New York City has the greatest proportion of manufacturing jobs in Food and Beverage
manufacturing at 22%. While at 7% the North Country has the least concentration of manufacturing jobs in Food and Beverage.
• A dynamic labor market is indicated by the ratio of New Hires to Stable Workers. The ratio combines the effect of growth and turnover in employment. The ratio for all jobs in New York State is 0.61, meaning that for every 100 Stable jobs in the state there are an additional 61 New Hires for the year. In Food and Beverage Manufacturing the statewide ratio is 0.58, which is almost twice the ratio of 0.30 for all other manufacturing industries.
• In the table that follows, the last column reports the ratio of New Hires to Stable Workers. In addition to the numeric value, is a graphic bar aiding the visual comparison of the ratios for jobs in Food and Beverage Manufacturing, All Other Manufacturing, and Jobs across All industries.
• For Food and Beverage Manufacturing the New York City (0.84), Long Island (0.73), and Mid-Hudson (0.68) have the highest ratios.
• The Southern Tier (0.32) and Central New York (0.39) regions have the lowest ratios of New Hires to Stable Workers.

17
All workersStable workers
New hires
New hires / Stable workers
NY State All 8,702,043 7,734,168 4,708,450 0.61Other man. 396,772 372,190 113,384 0.30F&B man. 60,287 53,485 31,088 0.58
Capital Region All 507,550 450,511 255,460 0.57Other man. 29,797 27,972 7,891 0.28F&B man. 2,595 2,309 1,312 0.57
Central New York All 339,797 301,469 169,098 0.56Other man. 28,333 26,602 6,681 0.25F&B man. 2,550 2,320 914 0.39
Finger Lakes All 566,421 504,200 284,389 0.56Other man. 59,862 56,406 14,283 0.25F&B man. 8,329 7,365 3,349 0.45
Long Island All 1,234,577 1,097,299 661,247 0.60Other man. 66,416 62,297 19,868 0.32F&B man. 6,694 5,934 4,346 0.73
Mid-Hudson All 852,343 758,599 454,295 0.60Other man. 39,426 37,289 10,081 0.27F&B man. 6,556 5,769 3,930 0.68
Mohawk Valley All 185,809 166,732 85,134 0.51Other man. 15,021 14,046 3,843 0.27F&B man. 2,720 2,417 1,132 0.47
New York City All 3,984,046 3,535,786 2,275,009 0.64Other man. 59,577 54,424 24,618 0.45F&B man. 16,962 14,547 12,156 0.84
North Country All 136,622 121,090 69,293 0.57Other man. 10,402 9,781 3,128 0.32F&B man. 777 700 378 0.54
Southern Tier All 255,846 227,725 124,200 0.55Other man. 29,689 27,974 6,584 0.24F&B man. 3,802 3,489 1,110 0.32
Western New York All 639,031 570,757 330,320 0.58Other man. 59,137 56,225 16,738 0.30F&B man. 8,415 7,814 -
18
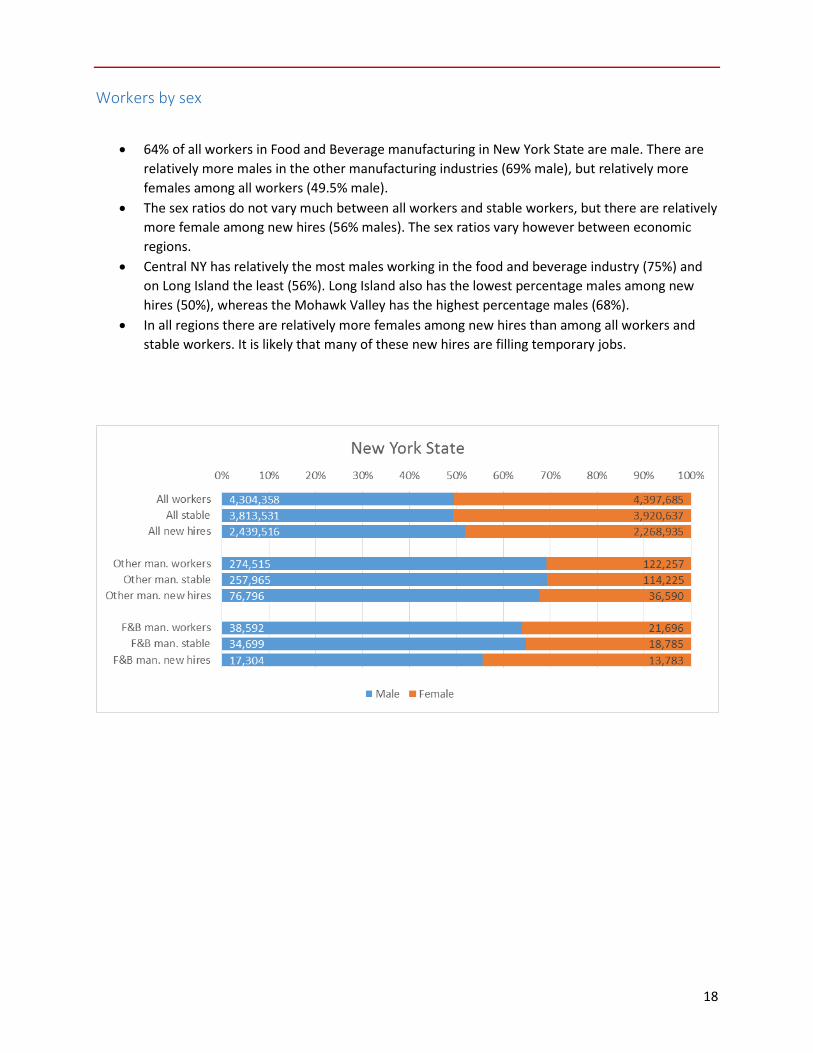
Workers by sex
• 64% of all workers in Food and Beverage manufacturing in New York State are male. There are relatively more males in the other manufacturing industries (69% male), but relatively more females among all workers (49.5% male).
• The sex ratios do not vary much between all workers and stable workers, but there are relatively more female among new hires (56% males). The sex ratios vary however between economic regions.
• Central NY has relatively the most males working in the food and beverage industry (75%) and on Long Island the least (56%). Long Island also has the lowest percentage males among new hires (50%), whereas the Mohawk Valley has the highest percentage males (68%).
• In all regions there are relatively more females among new hires than among all workers and stable workers. It is likely that many of these new hires are filling temporary jobs.

19

20

21

22

23
Workers by age
• New hires are relatively younger than all workers. • Stable workers are relatively older than all workers. • Workers in the Food and Beverage manufacturing in Central and Western New York are
relatively older, and those in the North Country relatively younger. • New hires in Food and Beverage manufacturing in the North Country are relatively younger than
those in other regions and those on Long Island relatively older.

24

25

26

27

28
Workers by race
• 63% of workers in New York State are Non-Hispanic White, the percentages of workers who are Non-Hispanic Black and those that are Hispanic are almost the same at roughly 14%.
• There are relatively more Non-Hispanic White workers in Food and Beverage manufacturing and relatively more Hispanic workers compared to all workers.
• There are more Non-Hispanic white workers in the other manufacturing industries and less workers from the minority race categories.
• The racial composition of workers in the Food and Beverage manufacturing varies throughout the state; In New York City 42% of workers are Non-Hispanic White, while in the Southern Tier it is 90%.
• Long Island has the greatest percentage of workers in Food and Beverage manufacturing who are Hispanic.
• 46% of new hires in Food and Beverage manufacturing in New York City are Non-Hispanic White, and that is 96% in the North Country.

29

30

31

32

33
Workers by educational attainment
• Just over 30% of all workers in New York have no college education. This percentage is much higher in Food and Beverage manufacturing (44% without college).
• New hires in Food and Beverage manufacturing have relatively less people without a high school degree than other workers in that industry. In other manufacturing or among all workers new hires are more likely to be without a high school degree.
• New hires are more likely to be under 25. • Workers in Food and Beverage manufacturing on Long Island and New York City are less likely to
have finished High School. Those in Central New York are most likely to have at least some college.

34

35

36

37

38
Total Population Counts Population by Selected Age Groups
• Entry level workers aged 20-34 years old were the largest age group for New York State and all regions from the 1970s into the 1990s due to the Baby Boom cohorts.
• With the aging of the Baby Boomers mid-career workers aged 35-49 years old were the largest age group from the mid-1990s until 2010.
• Going forward from 2010 no age group will dominate and older workers aged 50-64 years old will comprise a roughly equal share of the working age population

39

40

41
Estimates Projections
2000 2005 2010 2015 2020 2025
New York State
Total 19,001,780
19,132,610
19,398,228
19,546,904
19,697,021
19,786,848
5-19 3,969,798 3,872,373 3,729,436 3,562,402 3,608,648 3,675,258 20-34 4,001,926 3,901,047 4,085,903 4,201,776 4,101,906 3,963,418 35-49 4,419,969 4,366,849 4,055,734 3,824,673 3,822,202 3,952,930 50-64 2,919,547 3,317,468 3,743,065 3,865,894 3,798,504 3,550,622 65plus 2,453,462 2,494,128 2,626,059 2,847,162 3,115,588 3,411,270
Capital Region
Total 1,031,167 1,062,603 1,079,383 1,091,027 1,101,738 1,108,224 5-19 215,710 216,936 204,791 194,003 191,976 192,824
20-34 196,207 196,039 204,676 218,977 217,154 210,284 35-49 245,000 243,843 224,702 204,988 202,247 211,477 50-64 166,685 200,150 229,618 237,403 230,441 211,061 65plus 146,842 147,944 158,304 178,502 201,491 224,634
Central New York
Total 780,525 785,455 792,057 792,313 793,099 791,476 5-19 177,326 173,419 163,353 150,763 149,949 151,866
20-34 150,791 147,216 154,451 167,142 164,537 157,731 35-49 182,725 177,573 158,682 141,490 138,671 145,768 50-64 116,829 138,110 160,323 165,314 157,337 139,917 65plus 103,679 103,600 110,034 119,968 133,585 147,781
Finger Lakes
Total 1,203,763 1,208,443 1,217,474 1,215,644 1,213,451 1,206,714 5-19 268,104 261,412 243,721 227,373 224,887 226,318
20-34 229,210 219,985 231,751 247,339 241,897 229,569 35-49 287,610 277,574 247,214 221,182 216,619 226,977 50-64 186,670 219,715 251,760 256,584 244,557 218,392 65plus 157,208 160,865 174,161 192,354 213,356 234,624
Long Island
Total 2,760,794 2,810,005 2,835,582 2,842,632 2,853,936 2,859,971 5-19 574,861 594,671 581,133 551,708 538,667 541,291
20-34 498,259 466,166 481,327 510,144 514,198 497,486 35-49 680,285 687,163 625,954 568,935 551,044 570,205 50-64 450,954 509,124 579,510 608,267 604,845 558,327 65plus 369,836 380,159 408,074 439,461 476,086 522,710
Mid-Hudson
Total 2,185,030 2,249,815 2,293,746 2,326,394 2,364,114 2,397,974 5-19 470,242 489,077 484,024 466,830 463,548 468,190
20-34 398,301 382,498 396,710 428,356 429,749 422,167 35-49 536,917 539,098 496,266 463,856 465,152 489,976 50-64 353,429 405,232 461,081 483,831 482,413 452,406 65plus 275,928 288,563 314,529 343,198 376,873 416,690
Mohawk Valley
Total 497,552 498,983 499,915 497,465 494,156 488,697 5-19 107,055 103,643 97,450 90,340 88,361 87,087
20-34 88,716 87,442 89,389 95,495 92,079 87,235 35-49 111,999 108,755 98,515 88,470 87,079 89,701 50-64 80,273 93,402 105,553 107,806 102,779 93,382 65plus 81,884 79,222 81,742 88,916 97,376 105,753

42
Estimates Projections 2000 2005 2010 2015 2020 2025
New York City
Total 8,017,608 8,013,368 8,190,055 8,327,423 8,460,917 8,564,888 5-19 1,611,154 1,511,884 1,470,805 1,432,243 1,512,649 1,574,921
20-34 1,959,212 1,930,667 2,039,997 2,031,553 1,960,554 1,906,602 35-49 1,796,447 1,783,751 1,721,447 1,701,374 1,735,982 1,780,401 50-64 1,171,954 1,299,113 1,439,354 1,484,072 1,485,936 1,445,001 65plus 939,496 961,756 997,120 1,077,985 1,174,385 1,277,761
North Country
Total 425,866 429,769 433,195 433,652 432,977 430,482 5-19 93,291 88,863 83,720 79,051 77,892 76,790
20-34 91,559 91,425 93,128 95,557 90,701 85,911 35-49 98,978 95,422 86,397 81,074 82,784 86,672 50-64 63,023 73,947 84,469 88,734 85,682 78,156 65plus 54,284 55,744 58,607 63,982 70,936 78,649
Southern Tier
Total 657,076 657,660 657,492 651,288 643,719 633,522 5-19 144,577 138,666 128,652 120,651 119,299 118,168
20-34 125,860 125,296 130,754 135,527 130,740 124,916 35-49 147,537 140,215 123,600 111,216 108,873 111,492 50-64 104,707 120,622 137,465 137,590 127,851 112,545 65plus 97,468 98,065 102,352 111,548 122,395 133,060
Western New York
Total 1,442,399 1,416,509 1,399,329 1,369,066 1,338,914 1,304,900 5-19 307,478 293,802 271,787 249,440 241,420 237,803
20-34 263,811 254,313 263,720 271,686 260,297 241,517 35-49 332,471 313,455 272,957 242,088 233,751 240,261 50-64 225,023 258,053 293,932 296,293 276,663 241,435 65plus 226,837 218,210 221,136 231,248 249,105 269,608

43
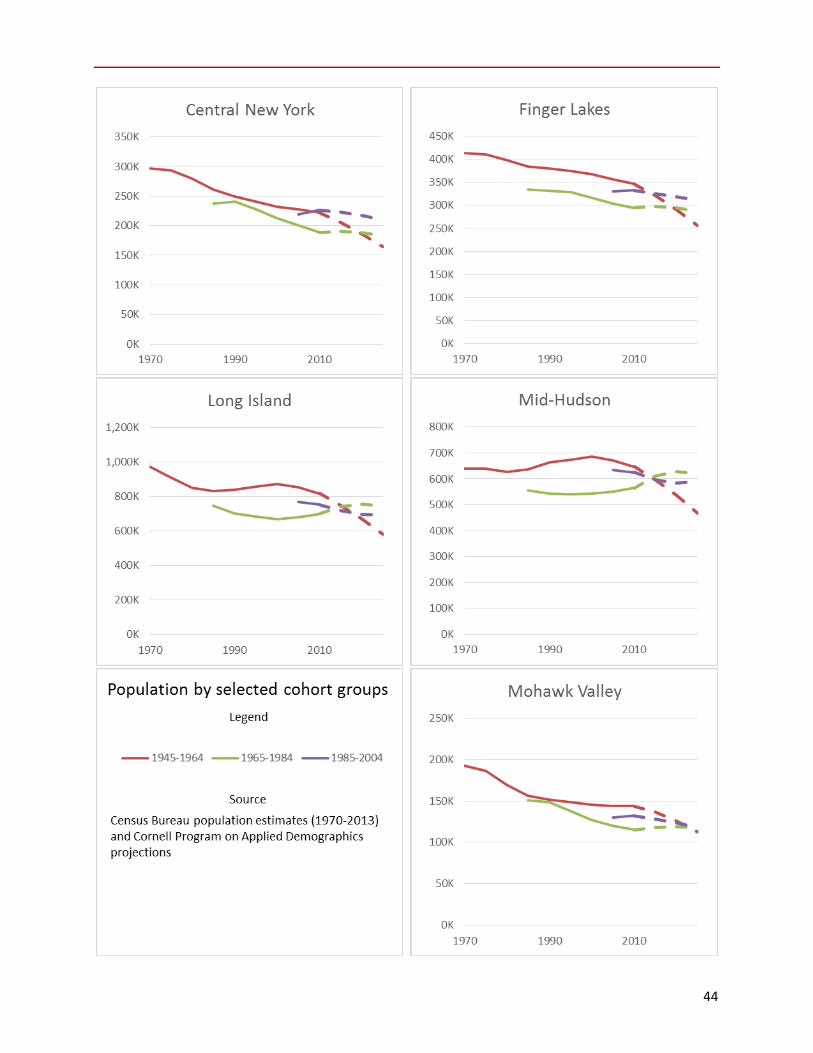
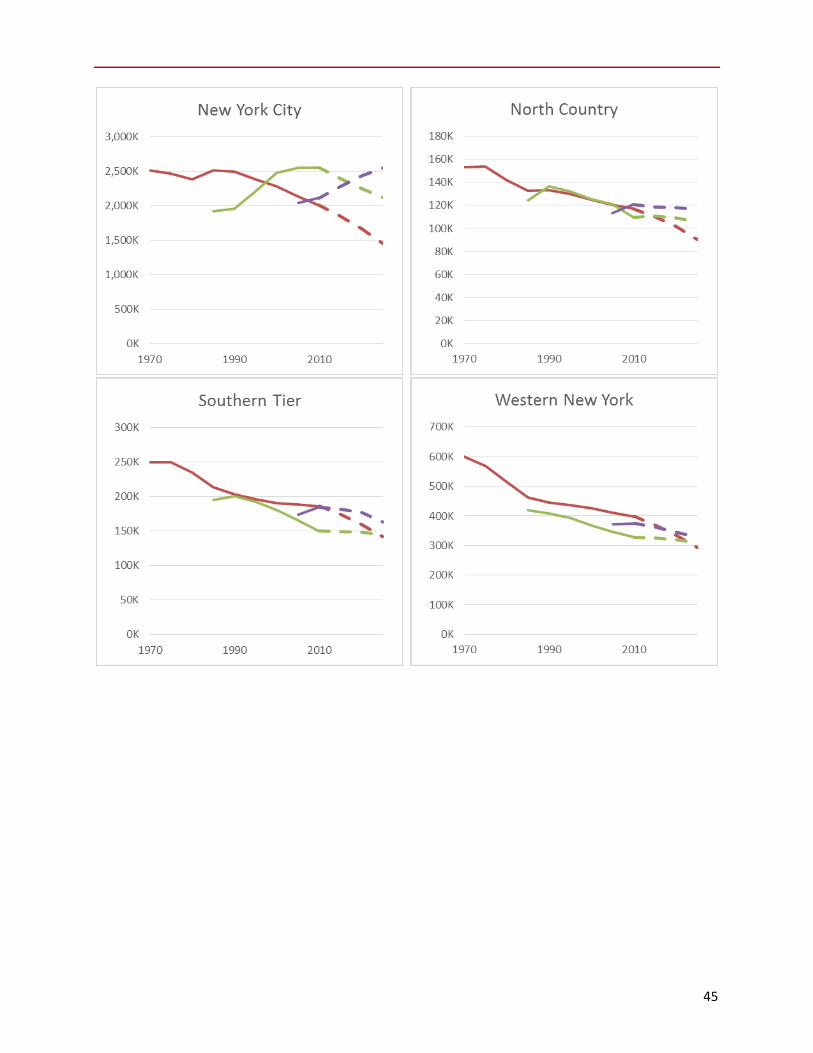
Population by Selected Cohort Groups • As the leading edge of the Baby Boom generation (1945-1954) ages out of the workforce and
many retire to destinations outside of New York State they are overtaken as a proportion of the population by Generation X (1965-1984) and the Millennials (1985-2004) PAD projects that the Millennials (1985-2004) will be the largest cohort group in the coming years.
• In several regions (Central, Finger Lakes, North Country, and Southern Tier) the Millennials have already become the largest population segment. This is not due to their growth in numbers but rather the decline in other age groups.
• Growth in the number of Millennials is projected for the Capital Region, and New York City. • Generation X is projected to grow in numbers in the Capital Region, Long Island, Mid-Hudson,
and Mohawk Valley.
44
45

46
Population characteristics Educational Attainment by Age and Region
• The youngest age group (25-34) tends to have the highest levels of educational attainment in the state and across most regions.
• New York City tends toward the extremes having greatest proportion of persons with less than a high school diploma across all ages on the one hand while on the other hand it leads all regions in the proportion of young persons (25-34) with a college degree or higher and is among the leaders for the remaining age groups.
• Persons with a high school diploma and no higher attainment are dominant in the Central, Mohawk Valley, North Country, and Southern Tier Regions.
• The proportion of persons with a college degree or higher across all ages is greatest in the Long Island and Mid-Hudson Regions.

47
Chart: Educational attainment by age and region

48
Median earnings by Age and Region
• For New York State as a whole median earnings for entry level workers aged 20-34 years old were substantially lower than for mid-career (aged 35-49) and older (aged 50-64) workers. There was little difference in median earnings between mid-career (aged 35-49) and older (aged 50-64) workers.
• Median earnings for all three groups were highest in the Long Island and Mid-Hudson Regions, and least in the North Country and Southern Tier Regions.
• For entry level workers (aged 20-34) the Mohawk Valley, North Country and Southern Tier Regions had the lowest median earnings, while Long Island and New York City Regions had the highest.
Table: Median earnings by age group and region
20-64 20-34 35-49 50-64 New York State $ 38,859 $ 30,226 $ 43,239 $ 43,061 Capital Region $ 40,162 $ 30,143 $ 44,293 $ 44,332 Central New York $ 35,566 $ 25,310 $ 40,995 $ 40,301 Finger Lakes $ 35,871 $ 25,732 $ 41,247 $ 40,908 Long Island $ 48,444 $ 32,296 $ 54,903 $ 54,273 Mid-Hudson $ 44,332 $ 27,451 $ 52,535 $ 53,187 Mohawk Valley $ 32,296 $ 24,181 $ 36,602 $ 35,871 New York City $ 37,678 $ 32,564 $ 40,995 $ 40,053 North Country $ 31,757 $ 24,222 $ 37,678 $ 35,153 Southern Tier $ 32,564 $ 23,201 $ 36,911 $ 38,286 Western New York $ 35,264 $ 25,622 $ 40,596 $ 39,253

49
Language Proficiency by Age/Education/Region
• A small but substantial proportion of New York State residents of working age do not speak English well.
• The regions with the greatest proportion of working age persons who do not speak English well are New York City, Long Island, and Mid-Hudson.
• In New York City older working age persons are most likely to not speak English well, while for Long Island and Mid-Hudson it is the younger working age persons who are most likely to not speak English well.
• The color of the bars represents the educational attainment; the shading represents the language spoken at home and the capability to speak English. The darkest bars represent those that do not speak English well.
• If the percentage of the subgroup is less than 2.5%, the bar in the chart is not labeled. Bars that represent between 2.5% and 5% are labeled with a ~.

50

51
Veterans
• There are an estimated 450,000 veterans of working age in New York State and approximately 160,000 of them are living in New York City and Long Island.
• The North Country and Mohawk Valley have the highest percentages of the working age population that are veterans.
• Most veterans are male (94% in New York State). The highest percentage of female veterans can be found in the North Country where the largest military base in New York is located (Fort Drum).

52

53

54
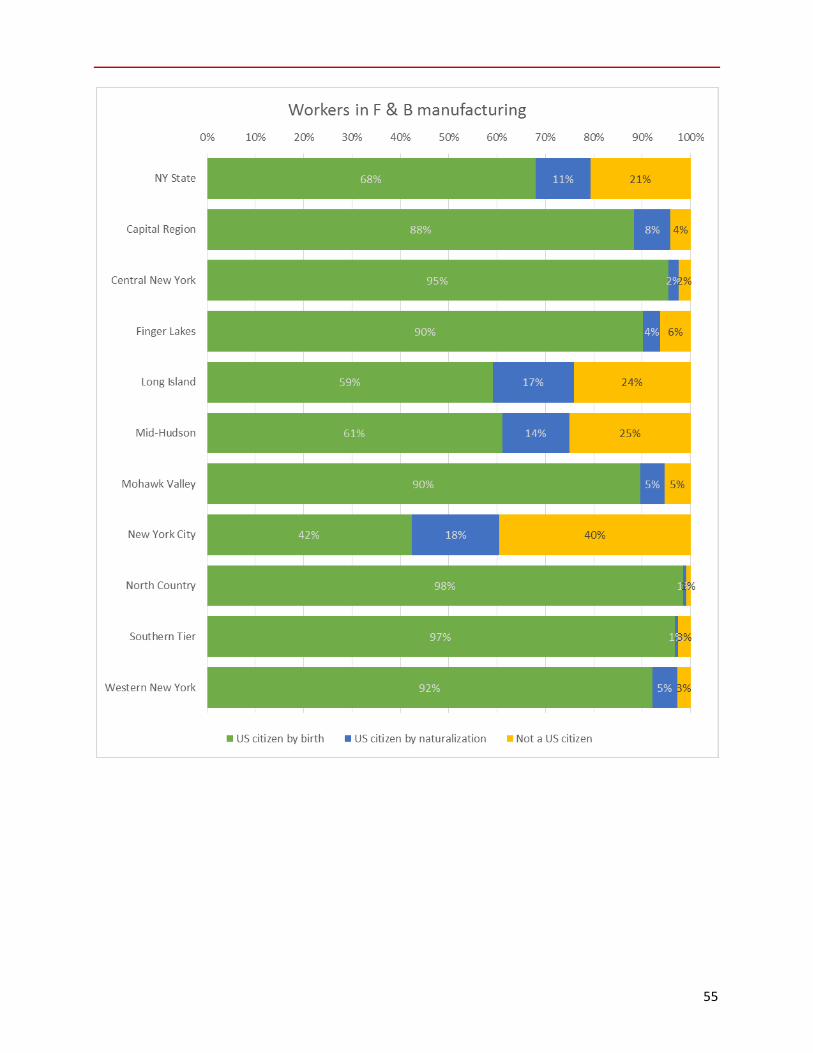
U.S. Citizenship and Place of Birth
• The majority of all workers are US citizens by birth (72%), another 15% were born outside the US, but are naturalized and are now US citizens. 13% of workers are not US citizens.
• There are relatively fewer workers with US citizenship in the Food and Beverage manufacturing. • New York City, Mid-Hudson and Long Island are the regions with relatively the most non US
citizens in the Food and Beverage manufacturing. • Mexico is the most common country of birth outside the US for F & B manufacturing workers,
followed by the Dominican Republic and China. • On Long Island there are many workers in the F & B manufacturing born in El Salvador. • The ACS does not provide information on legal status. Those workers that are not US citizen can
be working and living here legally through a visa or can be here without proper documentation.
55

56
Highest ranked
Ranked 1 Ranked 2 Ranked 3
NY State Mexico (5.8%) Dominican Republic (3.7%) China (2.3%) Capital Region Mexico (3.0%) Bulgaria (2.4%) Germany (2.4%) Central New York Colombia (1.3%) Germany (1.2%) Puerto Rico (0.6%) Finger Lakes Mexico (4.4%) Puerto Rico (2.2%) Italy (1.2%)
Long Island El Salvador (13.9%) Dominican Republic (4.2%) Guatemala (2.0%)
Mid-Hudson Mexico (7.4%) Guatemala (4.4%) Honduras (3.0%) Mohawk Valley Puerto Rico (2.2%) France (1.9%) Cambodia (1.8%) New York City Mexico (11.5%) Dominican Republic (8.5%) China (6.0%) North Country Germany (1.6%) El Salvador (0.5%) Dominican Republic (0.5%) Southern Tier Puerto Rico (0.5%) Mexico (0.5%) United Kingdom, Not Specified (0.4%) Western New York Puerto Rico (3.7%) Myanmar (1.7%) Mexico (1.2%)

57
Characteristics by Labor force Status
• For each age group, the males have greater labor force participation rates. While for both males and females the labor force participation rate is lowest for those aged 50-64 years.
• For both males and females, younger working age persons 20-34 years have the highest unemployment rates.
• For both males and females, the more education the higher the labor force participation rate and the lower the unemployment rate.
• If the percentage of the subgroup is less than 5%, the bar in the chart is not labeled. Bars that represent between 5% and 10% are labeled with a ~.

58
Local Workforce Investment Areas Another important geographic sub division of New York State is Local Workforce Investment Areas. Data is not available for areas that include parts of counties and for these analyses the two Workforce Areas in Nassau County are combined and Yonkers City Workforce Area is combined with Putnam/Remainder of Westchester County. New York City is one Workforce Area, but details by borough are also included.
2014 Average employment and wages, from Quarterly Census of Employment and Wages (QCEW)
Total All manufacturings F&B manufacturing AREA Empl. Wages Empl. Wages Establ. Empl. Wages Albany/Rensselaer/Schenectady 338,204 51,826 16,762 74,458 67 2,081 49,357 Allegany/Cattaraugus 43,298 37,386 6,251 56,806 14 766 40,574 Broome/Tioga 100,055 40,411 11,603 68,087 18 836 46,287 Cayuga/Cortland 44,162 38,698 5,974 56,802 18 245 32,886 Chautauqua County 49,705 35,626 9,326 50,111 38 1,998 49,144 Chemung/Schuyler/Steuben 78,940 46,808 10,890 58,694 40 1,215 44,841 Chenango/Delaware/Otsego 56,219 39,624 9,170 55,258 28 1,793 47,717 Clinton/Essex/Franklin/Hamilton 67,160 39,218 4,684 50,377 15 329 37,581 Columbia/Greene 35,834 38,493 2,328 48,758 22 299 38,395 Dutchess County 108,879 50,139 9,197 98,899 30 357 39,336 Erie County 456,771 44,680 42,957 62,194 102 5,392 50,821 Fulton/Montgomery/Schoharie 43,453 36,721 5,222 40,943 14 868 53,278 Genesee/Livingston/Orleans/Wyoming 69,617 37,490 8,970 48,666 40 2,265 51,404 Herkimer/Madison/Oneida 140,761 38,743 13,820 49,847 53 1,827 41,056 Jefferson/Lewis 47,771 37,598 3,439 48,828 18 691 46,097 Monroe County 375,437 47,505 40,867 66,212 74 3,472 46,083 Nassau County 604,644 56,402 17,786 69,124 164 2,920 38,292 New York City 3,965,564 84,752 75,627 54,032 1,124 17,268 41,175
Bronx County 251,466 47,053 6,591 44,169 109 1,827 34,878 Kings County 567,643 41,083 20,689 38,967 420 6,000 35,171 New York County 2,494,990 108,397 25,399 74,621 285 4,382 57,380 Queens County 552,848 47,505 21,744 47,677 272 4,489 36,236 Richmond County 98,618 42,849 1,204 47,331 31 306 19,774
Niagara County 72,768 38,814 8,975 56,699 25 325 28,041 Onondaga County 240,845 46,442 18,341 65,268 59 1,852 56,704 Ontario/Seneca/Wayne/Yates 99,119 41,361 15,627 55,292 86 2,621 38,674 Orange County 136,128 42,267 7,939 51,120 46 1,141 54,274 Oswego County 33,131 40,874 3,156 61,252 8 39 13,357 Putnam/Westchester 437,444 67,045 14,565 93,005 122 2,469 76,197 Rockland County 116,201 52,885 8,430 84,248 37 1,106 40,766 Saratoga/Warren/Washington 34,785 40,172 2,514 68,018 19 226 36,749 St. Lawrence County 134,048 43,071 12,959 70,793 31 370 30,218 Suffolk County 634,844 54,609 53,352 62,317 174 3,740 41,057 Sullivan County 24,717 38,145 1,500 29,884 14 1,192 26,881 Tompkins County 48,684 47,669 3,418 63,027 18 262 28,433 Ulster County 58,577 39,246 3,371 46,090 40 596 29,911

59
Economic and demographic indicators from 2009-2013 American Community Survey
Total pop Labor Force
In Armed Forces
Unempl. Rate
Per Capita earnings
% at least High School
% 65 and older
% veteran
Albany/Rensselaer/Schenectady 416,681 333,298 651 7.9% 23,164 91.2% 14.4% 8.3% Allegany/Cattaraugus 84,172 61,650 61 9.3% 15,627 87.8% 15.7% 11.6% Broome/Tioga 168,110 124,566 94 8.7% 18,560 89.9% 16.6% 9.6% Cayuga/Cortland 86,101 65,336 77 8.0% 18,122 87.6% 15.0% 9.9% Chautauqua County 90,209 64,283 28 8.8% 15,743 87.4% 17.0% 11.2% Chemung/Schuyler/Steuben 142,412 98,640 98 8.2% 18,815 88.5% 16.1% 11.7% Chenango/Delaware/Otsego 108,895 78,028 39 8.9% 16,279 87.8% 18.1% 10.5% Clinton/Essex/Franklin/Hamilton 124,207 82,683 116 8.5% 17,339 85.1% 15.3% 11.0% Columbia/Greene 80,411 54,880 39 9.5% 21,322 86.9% 18.6% 10.9% Dutchess County 200,358 157,387 283 9.4% 26,113 89.6% 14.1% 8.1% Erie County 627,301 475,945 453 8.6% 21,254 89.8% 15.9% 9.0% Fulton/Montgomery/Schoharie 95,441 67,984 95 10.6% 17,528 85.1% 16.6% 10.3% Genesee/Livingston/Orleans/Wyoming 143,449 104,104 142 7.9% 17,576 88.2% 14.9% 9.6% Herkimer/Madison/Oneida 252,029 179,768 467 7.7% 18,239 87.7% 16.3% 10.7% Jefferson/Lewis 91,558 73,037 9,505 9.5% 17,382 88.0% 12.1% 13.3% Monroe County 496,679 386,377 275 8.4% 21,929 89.6% 14.3% 7.5% Nassau County 920,469 703,983 429 7.4% 33,801 90.2% 15.6% 6.0% New York City 5,640,899 4,244,118 3,309 10.6% 25,858 79.8% 12.4% 3.1%
Bronx County 866,898 639,118 556 15.1% 13,734 69.9% 10.8% 3.4% Kings County 1,680,599 1,251,425 1,184 10.9% 20,885 78.5% 11.7% 2.6% New York County 1,198,681 938,200 460 8.8% 50,580 86.0% 13.7% 3.1% Queens County 1,576,805 1,191,018 637 9.9% 21,433 80.1% 13.0% 3.2% Richmond County 317,916 224,357 472 7.9% 25,590 88.0% 13.2% 5.5%
Niagara County 149,792 108,417 244 8.6% 19,113 89.9% 16.2% 10.3% Onondaga County 310,079 239,432 548 7.8% 22,208 89.9% 14.4% 8.5% Ontario/Seneca/Wayne/Yates 179,973 133,945 198 7.4% 19,899 89.2% 15.7% 10.2% Orange County 235,732 191,163 4,757 8.1% 24,128 87.7% 11.4% 8.5% Oswego County 79,391 59,578 156 10.6% 17,283 86.4% 13.0% 9.7% Putnam/Westchester 718,992 553,581 224 8.3% 38,289 88.1% 14.8% 5.5% Rockland County 198,598 156,389 133 8.3% 27,645 87.5% 13.9% 5.2% Saratoga/Warren/Washington 246,171 187,800 1,431 7.3% 25,077 91.8% 15.3% 10.3% St. Lawrence County 71,537 50,958 98 11.2% 15,419 87.1% 14.2% 9.1% Suffolk County 1,011,777 786,380 596 7.4% 29,409 89.9% 14.0% 7.3% Sullivan County 53,473 37,317 30 12.8% 17,777 84.5% 15.3% 9.7% Tompkins County 58,238 52,542 46 5.9% 21,020 93.1% 11.2% 5.6% Ulster County 127,926 95,618 201 9.7% 22,518 88.7% 15.5% 8.2%

60
Appendix A: Industry Classifications The North American Industry Classification System (NAICS) numbering system employs a six-digit code at the most detailed industry level. The first two digits designate the largest business sector, the third digit designates the subsector, the fourth digit designates the industry group, the fifth digit designates the NAICS industries, and the sixth digit designates the national industries. The table underneath lists the 3 digit NAICS codes for the manufacturing sector and the 4 digit codes within the Food and Beverage manufacturing industries. Throughout this chart book the Food and Beverage manufacturing refers to NAICS codes 311 and 312, other manufacturing to NIACS codes 313 through 339.
311 Food Manufacturing 3111 Animal Food Manufacturing 3112 Grain and Oilseed Milling 3113 Sugar and Confectionery Product Manufacturing 3114 Fruit and Vegetable Preserving and Specialty Food Manufacturing 3115 Dairy Product Manufacturing 3116 Animal Slaughtering and Processing 3117 Seafood Product Preparation and Packaging 3118 Bakeries and Tortilla Manufacturing 3119 Other Food Manufacturing
312 Beverage and Tobacco Product Manufacturing 3121 Beverage Manufacturing 3122 Tobacco Manufacturing
313 Textile Mills 314 Textile Product Mills 315 Apparel Manufacturing 316 Leather and Allied Product Manufacturing 321 Wood Product Manufacturing 322 Paper Manufacturing 323 Printing and Related Support Activities 324 Petroleum and Coal Products Manufacturing 325 Chemical Manufacturing 326 Plastics and Rubber Products Manufacturing 327 Nonmetallic Mineral Product Manufacturing 331 Primary Metal Manufacturing 332 Fabricated Metal Product Manufacturing 333 Machinery Manufacturing 334 Computer and Electronic Product Manufacturing 335 Electrical Equipment, Appliance, and Component Manufacturing 336 Transportation Equipment Manufacturing 337 Furniture and Related Product Manufacturing 339 Miscellaneous Manufacturing
More information on NAICS and its codes can be found at http://www.census.gov/cgi-bin/sssd/naics/naicsrch?chart=2012

61
Appendix B: Sources of Data Census Bureau estimates
URL: http://www.census.gov/popest/
Projections from Cornell Program on Applied Demographics
URL: https://pad.human.cornell.edu/counties/projections.cfm
American Community Survey
Analyses presented in the chartbook are based on Public Use Micro data from the 2009-2013 5 year ACS.
URL: http://www.census.gov/programs-surveys/acs/technical-documentation/pums.html
Quarterly Census of Employment and Wages (QCEW)
Data from New York State Department of Labor is used for trends on the number of workers and number of establishments over time.
URL: https://labor.ny.gov/stats/lsqcew.shtm
Long-Term Industry Employment Projections
Long-term industry employment projections (for 2022) represent a valuable data source for those interested in future employment trends. Data are currently available for approximately 90 detailed industries (at the 3-digit NAICS industry level).
URL: https://www.labor.ny.gov/stats/lsproj.shtm
Quarterly Workforce Indicators (QWI)
Data from the Quarterly Workforce Indicators Data published by the Longitudinal-Employer Household Dynamics Program at the U.S. Census Bureau is used to analyze the characteristics of all workers, stable workers and new hires. Due to some anomalies in the data on new hires in Erie County in one of the manufacturing sectors some of the data for Western New York is incomplete.
URL: http://lehd.ces.census.gov/data/#qwi

62