Embed Size (px)
Citation preview
Q2 2019www.fitchsolutions.com
EEgyptgyptFFood & Drink Rood & Drink ReporteportIncludes 5-year forecasts to 2023

ContentsKey View............................................................................................................................................................................................ 4
SWOT .................................................................................................................................................................................................. 5
Food & Drink SWOT...................................................................................................................................................................................................................... 5
Industry Forecast........................................................................................................................................................................... 6
Food ................................................................................................................................................................................................................................................... 6
Drink................................................................................................................................................................................................................................................... 9
Industry Risk/Reward Index ....................................................................................................................................................14
MENA Food & Non-Alcoholic Drinks Risk/Reward Index: Saudi Arabia Gradually Scales Up Rankings....................................................14
Market Overview..........................................................................................................................................................................23
Food .................................................................................................................................................................................................................................................23
Drink.................................................................................................................................................................................................................................................28
Mass Grocery Retail....................................................................................................................................................................................................................31
Competitive Landscape.............................................................................................................................................................34
Company Profile...........................................................................................................................................................................36
Al Ahram Beverages (Heineken) ...........................................................................................................................................................................................36
Mondelēz Egypt ..........................................................................................................................................................................................................................38
Cairo Poultry Company ............................................................................................................................................................................................................40
Coca-Cola Egypt..........................................................................................................................................................................................................................42
PepsiCo Egypt ..............................................................................................................................................................................................................................44
Faragalla..........................................................................................................................................................................................................................................46
Juhayna Food Industries ..........................................................................................................................................................................................................48
Majid Al Futtaim (Carrefour)....................................................................................................................................................................................................51
Metro (Mansour Group)............................................................................................................................................................................................................53
Spinneys Group ...........................................................................................................................................................................................................................55
Egypt Demographic Outlook....................................................................................................................................................57
Food & Drink Glossary ................................................................................................................................................................60
Food & Drink Methodology .......................................................................................................................................................61
© 20© 2019 Fit19 Fitch Solutions Grch Solutions Group Limitoup Limited.ed. All rights rAll rights reserveserved.ed.
All information, analysis, forecasts and data provided by Fitch Solutions Group Limited is for the exclusive use of subscribing persons or organisations (including thoseusing the service on a trial basis). All such content is copyrighted in the name of Fitch Solutions Group Limited and as such no part of this content may be reproduced,repackaged, copied or redistributed without the express consent of Fitch Solutions Group Limited.
All content, including forecasts, analysis and opinion, has been based on information and sources believed to be accurate and reliable at the time of publishing. FitchSolutions Group Limited makes no representation of warranty of any kind as to the accuracy or completeness of any information provided, and accepts no liabilitywhatsoever for any loss or damage resulting from opinion, errors, inaccuracies or omissions affecting any part of the content.
This report from Fitch Solutions Macro Research is a product of Fitch Solutions Group Ltd, UK Company registration number 08789939 ('FSG'). FSG is an affiliate of FitchRatings Inc. ('Fitch Ratings'). FSG is solely responsible for the content of this report, without any input from Fitch Ratings. Copyright © 2019 Fitch Solutions Group Limited.
Egypt Food & Drink Report | Q2 2019
fitchsolutions.com
THIS COMMENTARY IS PUBLISHED BY FITCH SOLUTIONS MACRO RESEARCH and is NOT a comment on Fitch Ratings' credit ratings. Any comments or data included in the report are solely derived from Fitch
Solutions Macro Research and independent sources. Fitch Ratings' analysts do not share data or information with Fitch Solutions Macro Research.
3
Key View
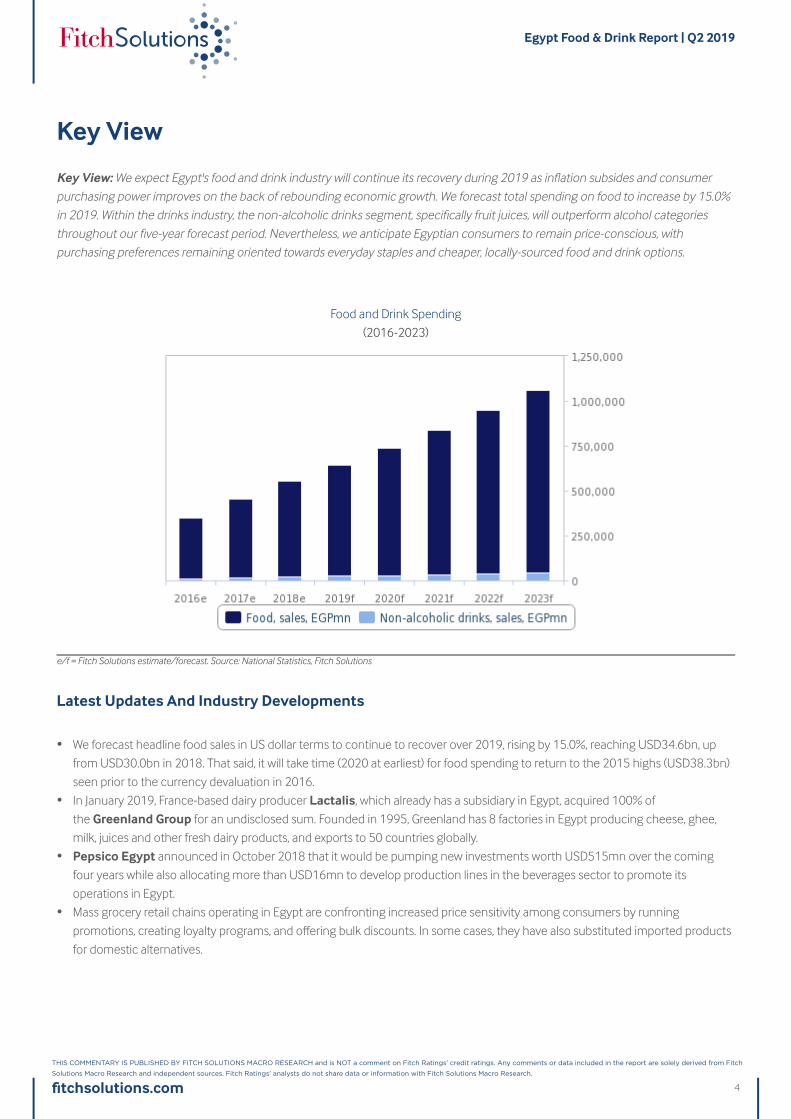
Key View: We expect Egypt's food and drink industry will continue its recovery during 2019 as inflation subsides and consumerpurchasing power improves on the back of rebounding economic growth. We forecast total spending on food to increase by 15.0%in 2019. Within the drinks industry, the non-alcoholic drinks segment, specifically fruit juices, will outperform alcohol categoriesthroughout our five-year forecast period. Nevertheless, we anticipate Egyptian consumers to remain price-conscious, withpurchasing preferences remaining oriented towards everyday staples and cheaper, locally-sourced food and drink options.
Food and Drink Spending
(2016-2023)
e/f = Fitch Solutions estimate/forecast. Source: National Statistics, Fitch Solutions
Latest Updates And Industry Developments
• We forecast headline food sales in US dollar terms to continue to recover over 2019, rising by 15.0%, reaching USD34.6bn, up
from USD30.0bn in 2018. That said, it will take time (2020 at earliest) for food spending to return to the 2015 highs (USD38.3bn)
seen prior to the currency devaluation in 2016.
• In January 2019, France-based dairy producer Lactalis, which already has a subsidiary in Egypt, acquired 100% of
the Greenland Group for an undisclosed sum. Founded in 1995, Greenland has 8 factories in Egypt producing cheese, ghee,
milk, juices and other fresh dairy products, and exports to 50 countries globally.
• Pepsico Egypt announced in October 2018 that it would be pumping new investments worth USD515mn over the coming
four years while also allocating more than USD16mn to develop production lines in the beverages sector to promote its
operations in Egypt.
• Mass grocery retail chains operating in Egypt are confronting increased price sensitivity among consumers by running
promotions, creating loyalty programs, and offering bulk discounts. In some cases, they have also substituted imported products
for domestic alternatives.
Egypt Food & Drink Report | Q2 2019
fitchsolutions.com
THIS COMMENTARY IS PUBLISHED BY FITCH SOLUTIONS MACRO RESEARCH and is NOT a comment on Fitch Ratings' credit ratings. Any comments or data included in the report are solely derived from Fitch
Solutions Macro Research and independent sources. Fitch Ratings' analysts do not share data or information with Fitch Solutions Macro Research.
4
SWOT
Food & Drink SWOTSWOT Analysis
Strengths • With a population approaching 100mn, Egypt offers one of the largest consumer bases in the region,
with huge long-term growth potential for food and drink companies.
• Egypt's organised food retail industry is expanding rapidly, and has the potential to be one of the region's
largest by value.
Weaknesses • A price-sensitive consumer base is exacerbated by wide income inequalities. There are low levels of per
capita food consumption on an absolute basis.
• Prevailing religious practices hinder alcoholic drinks sales. The sector is also particularly prone to tax
increases.
• The tariff on most processed food products ranges from 20% to 30%, in addition to a 10% sales tax.
Opportunities • Gradually returning economic and political stability, if sustained, will attract greater levels of investment in
Egypt's food and drink industry.
• Foreign companies looking to enter the market are likely to enjoy more success if they partner up with
local/regional players.
• Consumption patterns in food and drink will become more diversified as disposable incomes rise and health-
consciousness gains traction.
Threats • Elevated political risks remain and violence could quickly escalate. An unfavourable regulatory environment
also remains a significant deterrent to investment.
• Rising food prices, high inflation and recent cuts in food and energy subsidies will continue to weigh on
consumer spending over the near term.
• Competition is growing in the mass grocery retail sector, led by major Middle Eastern players MAF Retail
(holds franchise rights to Carrefour in the region) and Spinneys.
Egypt Food & Drink Report | Q2 2019
fitchsolutions.com
THIS COMMENTARY IS PUBLISHED BY FITCH SOLUTIONS MACRO RESEARCH and is NOT a comment on Fitch Ratings' credit ratings. Any comments or data included in the report are solely derived from Fitch
Solutions Macro Research and independent sources. Fitch Ratings' analysts do not share data or information with Fitch Solutions Macro Research.
5
Industry Forecast
Food
Key View: A gradually improving macroeconomic backdrop will support a steady recovery in Egypt's food sector from 2019onwards. However, consumers will remain cautious in their spending patterns over the near-term, amid austerity measures and highinflation, with staple food categories such as bread, rice and cereals set to remain dominant, and drive growth. Over the longerterm, economic reforms and favourable demographics make Egypt an attractive market for expansion by multinational foodcompanies.
Latest Updates
• Surging prices hurt the food sector in 2017 as Egyptians choose to downgrade to cheaper alternatives or go without
discretionary products. However, we believe that the worst is now over and the effects of the November 2016 currency
devaluation have largely passed through. We expect that the Egyptian consumer story will gradually strengthen over the coming
years.
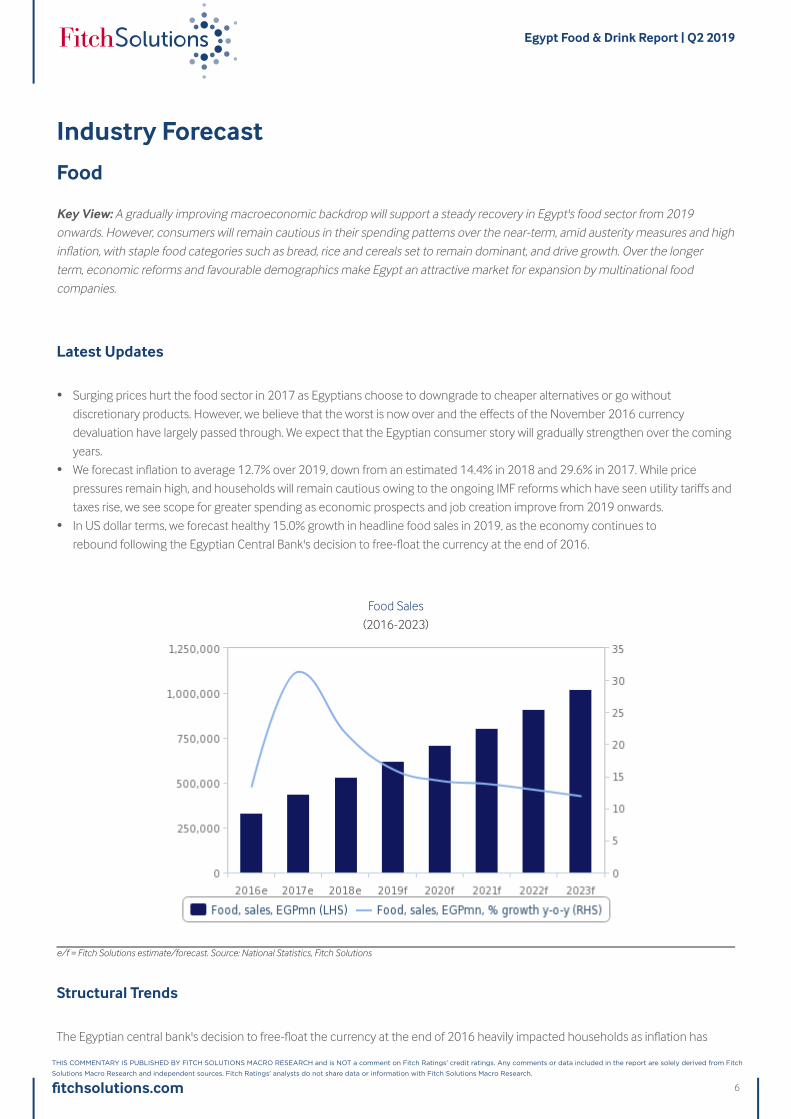
• We forecast inflation to average 12.7% over 2019, down from an estimated 14.4% in 2018 and 29.6% in 2017. While price
pressures remain high, and households will remain cautious owing to the ongoing IMF reforms which have seen utility tariffs and
taxes rise, we see scope for greater spending as economic prospects and job creation improve from 2019 onwards.
• In US dollar terms, we forecast healthy 15.0% growth in headline food sales in 2019, as the economy continues to
rebound following the Egyptian Central Bank's decision to free-float the currency at the end of 2016.
Food Sales
(2016-2023)
e/f = Fitch Solutions estimate/forecast. Source: National Statistics, Fitch Solutions
Structural Trends
The Egyptian central bank's decision to free-float the currency at the end of 2016 heavily impacted households as inflation has
Egypt Food & Drink Report | Q2 2019
fitchsolutions.com
THIS COMMENTARY IS PUBLISHED BY FITCH SOLUTIONS MACRO RESEARCH and is NOT a comment on Fitch Ratings' credit ratings. Any comments or data included in the report are solely derived from Fitch
Solutions Macro Research and independent sources. Fitch Ratings' analysts do not share data or information with Fitch Solutions Macro Research.
6
since risen to double digits, peaking at 33% in July 2017. Additional import tariffs of up to 60% on imported goods in June and July
2017 will continue to weigh on price pressures on foreign goods over the near term. Some of the consumer products
affected include food products such as chocolate and fruits. This is the government's attempt to reduce import reliance and attract
foreign capital back to the country with the free-floated currency.
2019 will provide some relief to Egyptian households as inflation ticks lower, consumer confidence picks up and the economic
growth accelerates as structural reforms implemented as part of an IMF deal reached in November 2016 bear fruit. We believe the
Egyptian pound's significant depreciation in November 2016 has now largely fed through. As a result inflation will continue to trend
lower, and we forecast an average inflation rate of 12.7% in 2019, down from 14.4% in 2018 and 29.6% in 2017. We forecast
headline food sales in US dollar terms to continue to recover over 2019, rising by 15.0%, reaching USD34.6bn, up from USD30.0bn
in 2018.
That said, it will take time (2020 at earliest) for food spending to return to the 2015 highs (USD38.3bn) seen prior to the currency
devaluation. We also expect the government to implement another round of IMF-stipulated subsidy cuts by mid-2019, which will
again weigh on Egyptian consumers’ purchasing power over the near-term. Consumers will therefore remain price-conscious, and
we expect high-cost foreign brands to remain out of favour as households switch to food staples and more affordable local produce.
This creates opportunities for local companies to outperform multinationals, as price will be the key consideration over quality for
the majority of households. Private labels, smaller packages and tie-ups with local producers are trends we expect to see play out
over the next five years.
Egypt holds a large and rapidly growing consumer base, with the largest population size across the Middle East and North Africa
(MENA) region. Its population of 101.2mn in 2019 is set to increase to 106mn by 2022. Food consumption in Egypt will grow
impressively in nominal terms over this period, although this will be driven primarily by inflation. Coming from a low base, food
expenditure will be fuelled by continued (albeit subdued) economic growth, combined with favourable demographics and rapid
expansion of the mass grocery retail (MGR) sector. In per capita terms, food consumption growth will trail total consumption growth,
indicating that the rapid expansion of the country's population will be a pertinent driver of growth.
On a more optimistic note, food and drink companies are currently presented with an opportunity to enter Egypt, or strengthen
their existing presence in the country, in order to take advantage of the strong long-term growth prospects. Following three years of
political turmoil and a deterioration of investor confidence, relative political stability and commitment to economic reform are
positive signals. Reflecting the improvements in the economy, foreign investors have shown growing interest in mergers and
acquisitions. We have already seen an uptick in investment over recent years, with food and drink majors such as Kellogg,Cargill, Pepsi and Coca-Cola announcing ambitious investment plans, while Nestlé acquired Caravan MarketingCompany, an Egyptian instant coffee maker, in 2017.
Food Staples Remain Dominant
Looking into our sub-categories, the bread, rice and cereals category will grow at a CAGR of 14.3% over the five years to 2023, with
growth being driven by the bread segment. Bread is part of the food subsidy programme in Egypt, meaning it is economically priced
(thus appealing to consumers). The other cereal products segment is widely consumed in Egypt and is a large component of
traditional diets; moreover, it consists of economically priced products that are filling, which will appeal to consumers whose food
budgets are constrained. Packet foods will also show good growth as they are cheap, convenient and versatile.
The meat and poultry category will also experience strong growth, expanding at a CAGR of 16.1% through to 2023. This growth will
be driven by the poultry segment, which will benefit from the expansion of the mass grocery retail sector, and poultry's suitability as
a beef substitute, which is expensive by comparison.
Dairy will grow by a CAGR of 13.7% over our 2018-2023 forecast period, supported by the milk segment, which will experience
strong growth as a result of consumers increasingly switching to processed milk from raw milk. This switching out is fuelled by
consumers' perceptions of processed milk as being safer than raw milk, and we expect this trend to play out throughout our
Egypt Food & Drink Report | Q2 2019
fitchsolutions.com
THIS COMMENTARY IS PUBLISHED BY FITCH SOLUTIONS MACRO RESEARCH and is NOT a comment on Fitch Ratings' credit ratings. Any comments or data included in the report are solely derived from Fitch
Solutions Macro Research and independent sources. Fitch Ratings' analysts do not share data or information with Fitch Solutions Macro Research.
7
forecast period. We believe that Egypt's strategic geographic location as an export hub and free-trade access to the Gulf region and
a number of Sub-Saharan African countries will be the key driver of growth in the domestic dairy industry.
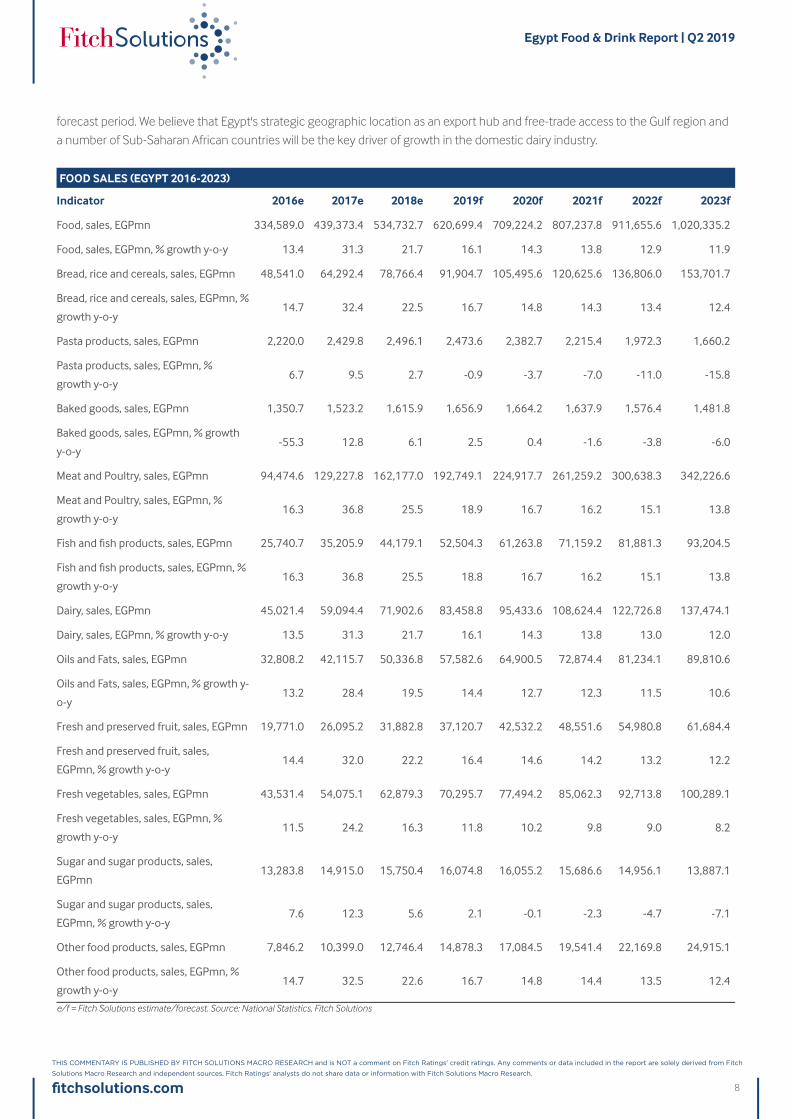
FOOD SALES (EGYPT 2016-2023)
Indicator 2016e 2017e 2018e 2019f 2020f 2021f 2022f 2023f
Food, sales, EGPmn 334,589.0 439,373.4 534,732.7 620,699.4 709,224.2 807,237.8 911,655.6 1,020,335.2
Food, sales, EGPmn, % growth y-o-y 13.4 31.3 21.7 16.1 14.3 13.8 12.9 11.9
Bread, rice and cereals, sales, EGPmn 48,541.0 64,292.4 78,766.4 91,904.7 105,495.6 120,625.6 136,806.0 153,701.7
Bread, rice and cereals, sales, EGPmn, %
growth y-o-y14.7 32.4 22.5 16.7 14.8 14.3 13.4 12.4
Pasta products, sales, EGPmn 2,220.0 2,429.8 2,496.1 2,473.6 2,382.7 2,215.4 1,972.3 1,660.2
Pasta products, sales, EGPmn, %
growth y-o-y6.7 9.5 2.7 -0.9 -3.7 -7.0 -11.0 -15.8
Baked goods, sales, EGPmn 1,350.7 1,523.2 1,615.9 1,656.9 1,664.2 1,637.9 1,576.4 1,481.8
Baked goods, sales, EGPmn, % growth
y-o-y-55.3 12.8 6.1 2.5 0.4 -1.6 -3.8 -6.0
Meat and Poultry, sales, EGPmn 94,474.6 129,227.8 162,177.0 192,749.1 224,917.7 261,259.2 300,638.3 342,226.6
Meat and Poultry, sales, EGPmn, %
growth y-o-y16.3 36.8 25.5 18.9 16.7 16.2 15.1 13.8
Fish and fish products, sales, EGPmn 25,740.7 35,205.9 44,179.1 52,504.3 61,263.8 71,159.2 81,881.3 93,204.5
Fish and fish products, sales, EGPmn, %
growth y-o-y16.3 36.8 25.5 18.8 16.7 16.2 15.1 13.8
Dairy, sales, EGPmn 45,021.4 59,094.4 71,902.6 83,458.8 95,433.6 108,624.4 122,726.8 137,474.1
Dairy, sales, EGPmn, % growth y-o-y 13.5 31.3 21.7 16.1 14.3 13.8 13.0 12.0
Oils and Fats, sales, EGPmn 32,808.2 42,115.7 50,336.8 57,582.6 64,900.5 72,874.4 81,234.1 89,810.6
Oils and Fats, sales, EGPmn, % growth y-
o-y13.2 28.4 19.5 14.4 12.7 12.3 11.5 10.6
Fresh and preserved fruit, sales, EGPmn 19,771.0 26,095.2 31,882.8 37,120.7 42,532.2 48,551.6 54,980.8 61,684.4
Fresh and preserved fruit, sales,
EGPmn, % growth y-o-y14.4 32.0 22.2 16.4 14.6 14.2 13.2 12.2
Fresh vegetables, sales, EGPmn 43,531.4 54,075.1 62,879.3 70,295.7 77,494.2 85,062.3 92,713.8 100,289.1
Fresh vegetables, sales, EGPmn, %
growth y-o-y11.5 24.2 16.3 11.8 10.2 9.8 9.0 8.2
Sugar and sugar products, sales,
EGPmn13,283.8 14,915.0 15,750.4 16,074.8 16,055.2 15,686.6 14,956.1 13,887.1
Sugar and sugar products, sales,
EGPmn, % growth y-o-y7.6 12.3 5.6 2.1 -0.1 -2.3 -4.7 -7.1
Other food products, sales, EGPmn 7,846.2 10,399.0 12,746.4 14,878.3 17,084.5 19,541.4 22,169.8 24,915.1
Other food products, sales, EGPmn, %
growth y-o-y14.7 32.5 22.6 16.7 14.8 14.4 13.5 12.4
e/f = Fitch Solutions estimate/forecast. Source: National Statistics, Fitch Solutions
Egypt Food & Drink Report | Q2 2019
fitchsolutions.com
THIS COMMENTARY IS PUBLISHED BY FITCH SOLUTIONS MACRO RESEARCH and is NOT a comment on Fitch Ratings' credit ratings. Any comments or data included in the report are solely derived from Fitch
Solutions Macro Research and independent sources. Fitch Ratings' analysts do not share data or information with Fitch Solutions Macro Research.
8
Drink
KKey View:ey View: Lower levels of inflation, combined with new product launches as the investment climate improves will drive growth inEgypt's beverage sector from 2019 onwards. The non-alcoholic drinks segment, particularly soft drinks, will continue to outperformalcohol categories throughout our forecast period due to Egypt’s majority Muslim population, which will limit alcohol consumptiongrowth. Spending on premium and imported beverage brands will gradually return as the economy continues to recover fromcurrency devaluation and ongoing IMF reforms.
Latest Updates
• While inflation will remain elevated in 2019, we believe that price growth has now peaked and will cool substantially over the
coming years. This will see the start of a recovery in spending on imported, premium beverage brands in the Egyptian market.
• An ongoing recovery in tourist arrivals in Egypt will provide some upside support to alcoholic drinks spending in Egypt from 2019
onwards, although inflation and conservative religious beliefs will continue to limit demand from the domestic population, with
any growth coming from a very low base.
• Total alcohol consumption growth will register 5.8% annual growth on average over 2018-2023.
Structural Trends
Alcoholic Drinks
Over our five-year forecast period, the Egyptian alcoholic drinks sector will experience positive growth, driven primarily by low base
effects. Low base growth will be a core driver of the country's growth rates over the medium term, with total alcohol consumption
growing by 5.8% on average through to 2023, reaching 236.7mn litres.
Alcohol consumption per capita in Egypt will remain low by regional and global standards, coming in at 2.7 litres in 2018, rising to
3.3 litres by 2023. Since about 90% of Egypt's population is Muslim (and therefore does not consume alcohol), the large majority of
alcohol consumption comes from ex-pats and foreign tourists.
Egypt Food & Drink Report | Q2 2019
fitchsolutions.com
THIS COMMENTARY IS PUBLISHED BY FITCH SOLUTIONS MACRO RESEARCH and is NOT a comment on Fitch Ratings' credit ratings. Any comments or data included in the report are solely derived from Fitch
Solutions Macro Research and independent sources. Fitch Ratings' analysts do not share data or information with Fitch Solutions Macro Research.
9
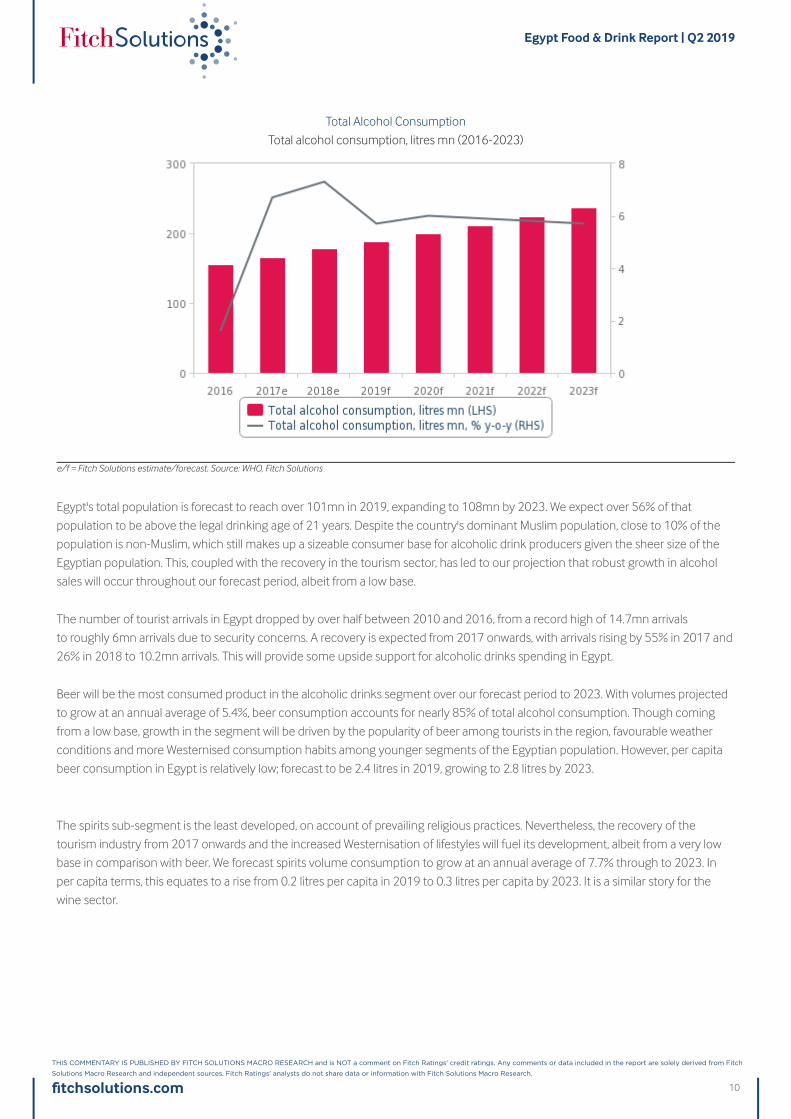
Total Alcohol Consumption
Total alcohol consumption, litres mn (2016-2023)
e/f = Fitch Solutions estimate/forecast. Source: WHO, Fitch Solutions
Egypt's total population is forecast to reach over 101mn in 2019, expanding to 108mn by 2023. We expect over 56% of that
population to be above the legal drinking age of 21 years. Despite the country's dominant Muslim population, close to 10% of the
population is non-Muslim, which still makes up a sizeable consumer base for alcoholic drink producers given the sheer size of the
Egyptian population. This, coupled with the recovery in the tourism sector, has led to our projection that robust growth in alcohol
sales will occur throughout our forecast period, albeit from a low base.
The number of tourist arrivals in Egypt dropped by over half between 2010 and 2016, from a record high of 14.7mn arrivals
to roughly 6mn arrivals due to security concerns. A recovery is expected from 2017 onwards, with arrivals rising by 55% in 2017 and
26% in 2018 to 10.2mn arrivals. This will provide some upside support for alcoholic drinks spending in Egypt.
Beer will be the most consumed product in the alcoholic drinks segment over our forecast period to 2023. With volumes projected
to grow at an annual average of 5.4%, beer consumption accounts for nearly 85% of total alcohol consumption. Though coming
from a low base, growth in the segment will be driven by the popularity of beer among tourists in the region, favourable weather
conditions and more Westernised consumption habits among younger segments of the Egyptian population. However, per capita
beer consumption in Egypt is relatively low; forecast to be 2.4 litres in 2019, growing to 2.8 litres by 2023.
The spirits sub-segment is the least developed, on account of prevailing religious practices. Nevertheless, the recovery of the
tourism industry from 2017 onwards and the increased Westernisation of lifestyles will fuel its development, albeit from a very low
base in comparison with beer. We forecast spirits volume consumption to grow at an annual average of 7.7% through to 2023. In
per capita terms, this equates to a rise from 0.2 litres per capita in 2019 to 0.3 litres per capita by 2023. It is a similar story for the
wine sector.
Egypt Food & Drink Report | Q2 2019
fitchsolutions.com
THIS COMMENTARY IS PUBLISHED BY FITCH SOLUTIONS MACRO RESEARCH and is NOT a comment on Fitch Ratings' credit ratings. Any comments or data included in the report are solely derived from Fitch
Solutions Macro Research and independent sources. Fitch Ratings' analysts do not share data or information with Fitch Solutions Macro Research.
10
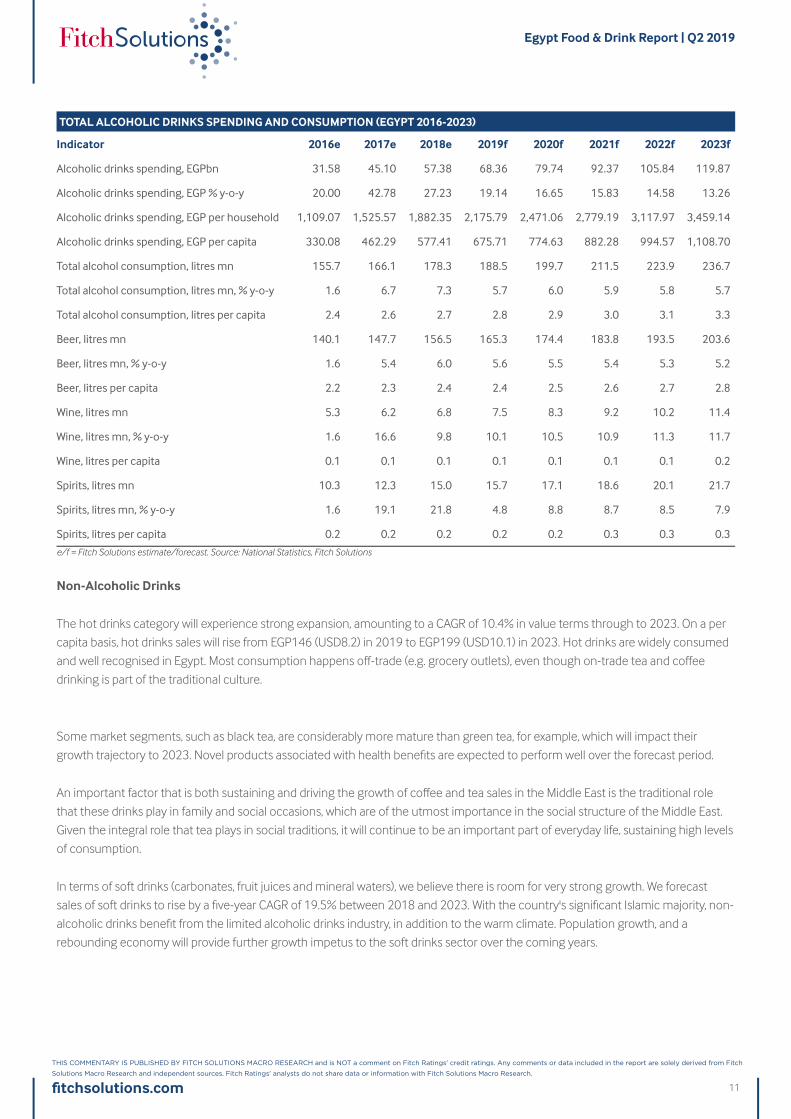
TOTAL ALCOHOLIC DRINKS SPENDING AND CONSUMPTION (EGYPT 2016-2023)
Indicator 2016e 2017e 2018e 2019f 2020f 2021f 2022f 2023f
Alcoholic drinks spending, EGPbn 31.58 45.10 57.38 68.36 79.74 92.37 105.84 119.87
Alcoholic drinks spending, EGP % y-o-y 20.00 42.78 27.23 19.14 16.65 15.83 14.58 13.26
Alcoholic drinks spending, EGP per household 1,109.07 1,525.57 1,882.35 2,175.79 2,471.06 2,779.19 3,117.97 3,459.14
Alcoholic drinks spending, EGP per capita 330.08 462.29 577.41 675.71 774.63 882.28 994.57 1,108.70
Total alcohol consumption, litres mn 155.7 166.1 178.3 188.5 199.7 211.5 223.9 236.7
Total alcohol consumption, litres mn, % y-o-y 1.6 6.7 7.3 5.7 6.0 5.9 5.8 5.7
Total alcohol consumption, litres per capita 2.4 2.6 2.7 2.8 2.9 3.0 3.1 3.3
Beer, litres mn 140.1 147.7 156.5 165.3 174.4 183.8 193.5 203.6
Beer, litres mn, % y-o-y 1.6 5.4 6.0 5.6 5.5 5.4 5.3 5.2
Beer, litres per capita 2.2 2.3 2.4 2.4 2.5 2.6 2.7 2.8
Wine, litres mn 5.3 6.2 6.8 7.5 8.3 9.2 10.2 11.4
Wine, litres mn, % y-o-y 1.6 16.6 9.8 10.1 10.5 10.9 11.3 11.7
Wine, litres per capita 0.1 0.1 0.1 0.1 0.1 0.1 0.1 0.2
Spirits, litres mn 10.3 12.3 15.0 15.7 17.1 18.6 20.1 21.7
Spirits, litres mn, % y-o-y 1.6 19.1 21.8 4.8 8.8 8.7 8.5 7.9
Spirits, litres per capita 0.2 0.2 0.2 0.2 0.2 0.3 0.3 0.3
e/f = Fitch Solutions estimate/forecast. Source: National Statistics, Fitch Solutions
Non-Alcoholic Drinks
The hot drinks category will experience strong expansion, amounting to a CAGR of 10.4% in value terms through to 2023. On a per
capita basis, hot drinks sales will rise from EGP146 (USD8.2) in 2019 to EGP199 (USD10.1) in 2023. Hot drinks are widely consumed
and well recognised in Egypt. Most consumption happens off-trade (e.g. grocery outlets), even though on-trade tea and coffee
drinking is part of the traditional culture.
Some market segments, such as black tea, are considerably more mature than green tea, for example, which will impact their
growth trajectory to 2023. Novel products associated with health benefits are expected to perform well over the forecast period.
An important factor that is both sustaining and driving the growth of coffee and tea sales in the Middle East is the traditional role
that these drinks play in family and social occasions, which are of the utmost importance in the social structure of the Middle East.
Given the integral role that tea plays in social traditions, it will continue to be an important part of everyday life, sustaining high levels
of consumption.
In terms of soft drinks (carbonates, fruit juices and mineral waters), we believe there is room for very strong growth. We forecast
sales of soft drinks to rise by a five-year CAGR of 19.5% between 2018 and 2023. With the country's significant Islamic majority, non-
alcoholic drinks benefit from the limited alcoholic drinks industry, in addition to the warm climate. Population growth, and a
rebounding economy will provide further growth impetus to the soft drinks sector over the coming years.
Egypt Food & Drink Report | Q2 2019
fitchsolutions.com
THIS COMMENTARY IS PUBLISHED BY FITCH SOLUTIONS MACRO RESEARCH and is NOT a comment on Fitch Ratings' credit ratings. Any comments or data included in the report are solely derived from Fitch
Solutions Macro Research and independent sources. Fitch Ratings' analysts do not share data or information with Fitch Solutions Macro Research.
11
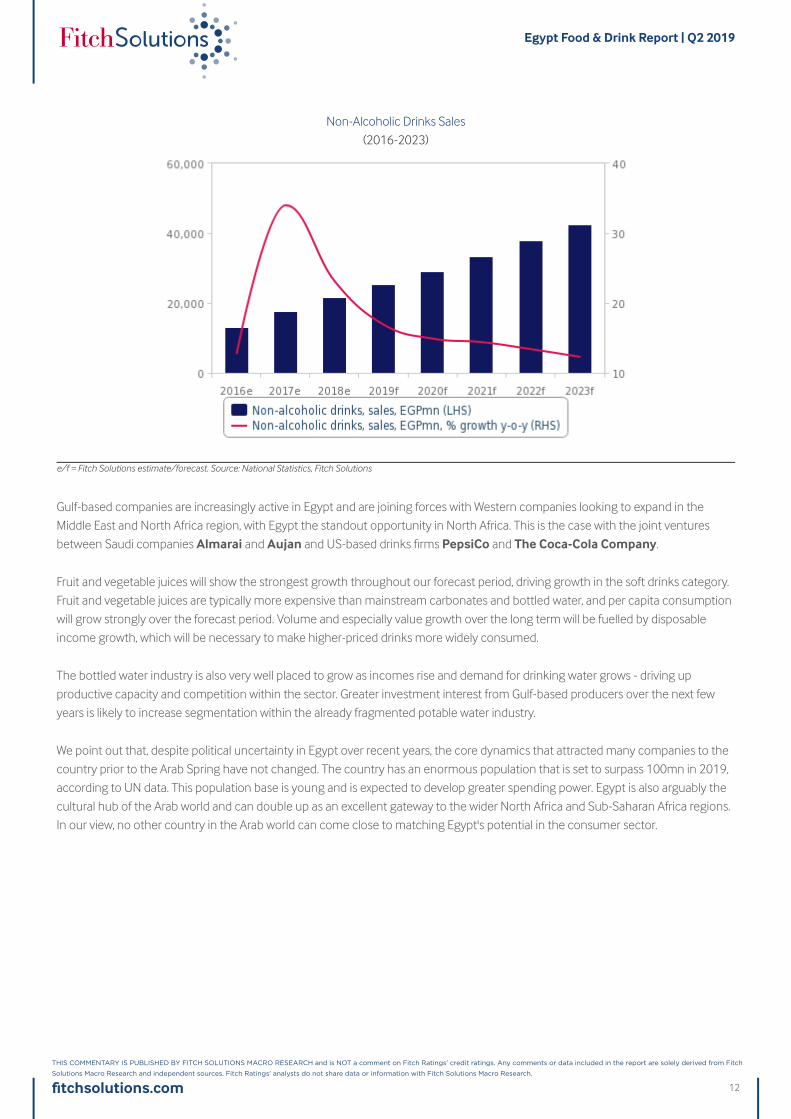
Non-Alcoholic Drinks Sales
(2016-2023)
e/f = Fitch Solutions estimate/forecast. Source: National Statistics, Fitch Solutions
Gulf-based companies are increasingly active in Egypt and are joining forces with Western companies looking to expand in the
Middle East and North Africa region, with Egypt the standout opportunity in North Africa. This is the case with the joint ventures
between Saudi companies Almarai and Aujan and US-based drinks firms PepsiCo and The Coca-Cola Company.
Fruit and vegetable juices will show the strongest growth throughout our forecast period, driving growth in the soft drinks category.
Fruit and vegetable juices are typically more expensive than mainstream carbonates and bottled water, and per capita consumption
will grow strongly over the forecast period. Volume and especially value growth over the long term will be fuelled by disposable
income growth, which will be necessary to make higher-priced drinks more widely consumed.
The bottled water industry is also very well placed to grow as incomes rise and demand for drinking water grows - driving up
productive capacity and competition within the sector. Greater investment interest from Gulf-based producers over the next few
years is likely to increase segmentation within the already fragmented potable water industry.
We point out that, despite political uncertainty in Egypt over recent years, the core dynamics that attracted many companies to the
country prior to the Arab Spring have not changed. The country has an enormous population that is set to surpass 100mn in 2019,
according to UN data. This population base is young and is expected to develop greater spending power. Egypt is also arguably the
cultural hub of the Arab world and can double up as an excellent gateway to the wider North Africa and Sub-Saharan Africa regions.
In our view, no other country in the Arab world can come close to matching Egypt's potential in the consumer sector.
Egypt Food & Drink Report | Q2 2019
fitchsolutions.com
THIS COMMENTARY IS PUBLISHED BY FITCH SOLUTIONS MACRO RESEARCH and is NOT a comment on Fitch Ratings' credit ratings. Any comments or data included in the report are solely derived from Fitch
Solutions Macro Research and independent sources. Fitch Ratings' analysts do not share data or information with Fitch Solutions Macro Research.
12
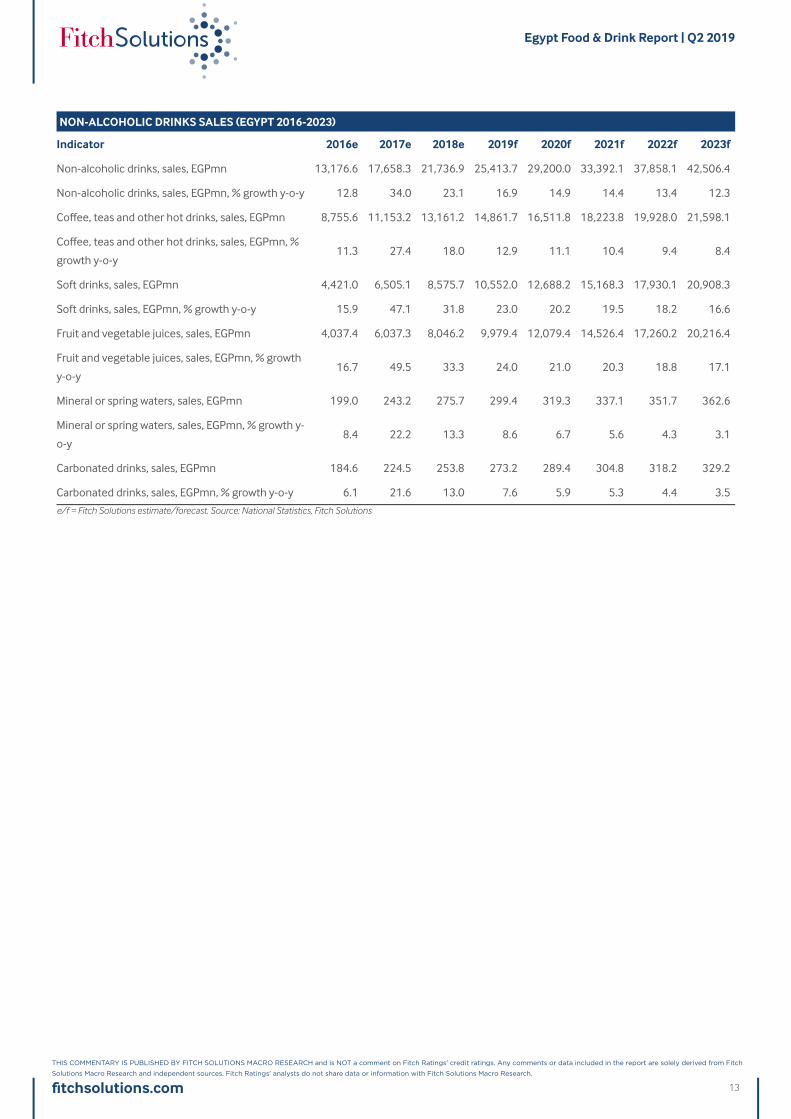
NON-ALCOHOLIC DRINKS SALES (EGYPT 2016-2023)
Indicator 2016e 2017e 2018e 2019f 2020f 2021f 2022f 2023f
Non-alcoholic drinks, sales, EGPmn 13,176.6 17,658.3 21,736.9 25,413.7 29,200.0 33,392.1 37,858.1 42,506.4
Non-alcoholic drinks, sales, EGPmn, % growth y-o-y 12.8 34.0 23.1 16.9 14.9 14.4 13.4 12.3
Coffee, teas and other hot drinks, sales, EGPmn 8,755.6 11,153.2 13,161.2 14,861.7 16,511.8 18,223.8 19,928.0 21,598.1
Coffee, teas and other hot drinks, sales, EGPmn, %
growth y-o-y11.3 27.4 18.0 12.9 11.1 10.4 9.4 8.4
Soft drinks, sales, EGPmn 4,421.0 6,505.1 8,575.7 10,552.0 12,688.2 15,168.3 17,930.1 20,908.3
Soft drinks, sales, EGPmn, % growth y-o-y 15.9 47.1 31.8 23.0 20.2 19.5 18.2 16.6
Fruit and vegetable juices, sales, EGPmn 4,037.4 6,037.3 8,046.2 9,979.4 12,079.4 14,526.4 17,260.2 20,216.4
Fruit and vegetable juices, sales, EGPmn, % growth
y-o-y16.7 49.5 33.3 24.0 21.0 20.3 18.8 17.1
Mineral or spring waters, sales, EGPmn 199.0 243.2 275.7 299.4 319.3 337.1 351.7 362.6
Mineral or spring waters, sales, EGPmn, % growth y-
o-y8.4 22.2 13.3 8.6 6.7 5.6 4.3 3.1
Carbonated drinks, sales, EGPmn 184.6 224.5 253.8 273.2 289.4 304.8 318.2 329.2
Carbonated drinks, sales, EGPmn, % growth y-o-y 6.1 21.6 13.0 7.6 5.9 5.3 4.4 3.5
e/f = Fitch Solutions estimate/forecast. Source: National Statistics, Fitch Solutions
Egypt Food & Drink Report | Q2 2019
fitchsolutions.com
THIS COMMENTARY IS PUBLISHED BY FITCH SOLUTIONS MACRO RESEARCH and is NOT a comment on Fitch Ratings' credit ratings. Any comments or data included in the report are solely derived from Fitch
Solutions Macro Research and independent sources. Fitch Ratings' analysts do not share data or information with Fitch Solutions Macro Research.
13
Industry Risk/Reward Index
MENA Food & Non-Alcoholic Drinks Risk/Reward Index: Saudi ArabiaGradually Scales Up Rankings
Key View: The Middle East and North Africa (MENA) region offers a unique balance of rewards and risks and so sits in the middle of
our global Food and Non-Alcoholic Drink Risk Reward Index in fourth position out of six regions covered. UAE continues to lead in
the region, although on the back of slower household spending, the country has slipped down in its global position. Saudi Arabia is
one of the most rewarding countries in the region and has seen its score improve as a result of the government's expansionary fiscal
policy. Egypt and Morocco lead in North Africa, although Egypt has seen stronger improvements and offers the most attractive
growth in real household spending as well as a large and growing urban population.
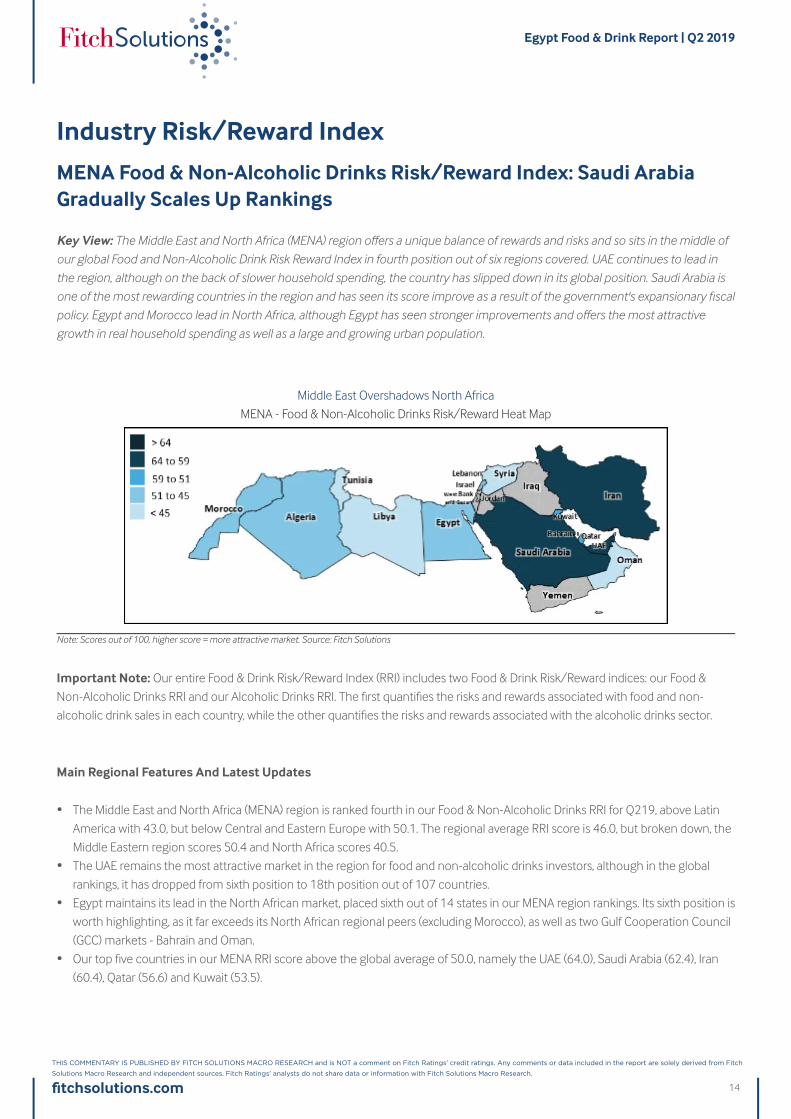
Middle East Overshadows North Africa
MENA - Food & Non-Alcoholic Drinks Risk/Reward Heat Map
Note: Scores out of 100, higher score = more attractive market. Source: Fitch Solutions
Important Note: Our entire Food & Drink Risk/Reward Index (RRI) includes two Food & Drink Risk/Reward indices: our Food &
Non-Alcoholic Drinks RRI and our Alcoholic Drinks RRI. The first quantifies the risks and rewards associated with food and non-
alcoholic drink sales in each country, while the other quantifies the risks and rewards associated with the alcoholic drinks sector.
Main Regional Features And Latest Updates
• The Middle East and North Africa (MENA) region is ranked fourth in our Food & Non-Alcoholic Drinks RRI for Q219, above Latin
America with 43.0, but below Central and Eastern Europe with 50.1. The regional average RRI score is 46.0, but broken down, the
Middle Eastern region scores 50.4 and North Africa scores 40.5.
• The UAE remains the most attractive market in the region for food and non-alcoholic drinks investors, although in the global
rankings, it has dropped from sixth position to 18th position out of 107 countries.
• Egypt maintains its lead in the North African market, placed sixth out of 14 states in our MENA region rankings. Its sixth position is
worth highlighting, as it far exceeds its North African regional peers (excluding Morocco), as well as two Gulf Cooperation Council
(GCC) markets - Bahrain and Oman.
• Our top five countries in our MENA RRI score above the global average of 50.0, namely the UAE (64.0), Saudi Arabia (62.4), Iran
(60.4), Qatar (56.6) and Kuwait (53.5).
Egypt Food & Drink Report | Q2 2019
fitchsolutions.com
THIS COMMENTARY IS PUBLISHED BY FITCH SOLUTIONS MACRO RESEARCH and is NOT a comment on Fitch Ratings' credit ratings. Any comments or data included in the report are solely derived from Fitch
Solutions Macro Research and independent sources. Fitch Ratings' analysts do not share data or information with Fitch Solutions Macro Research.
14
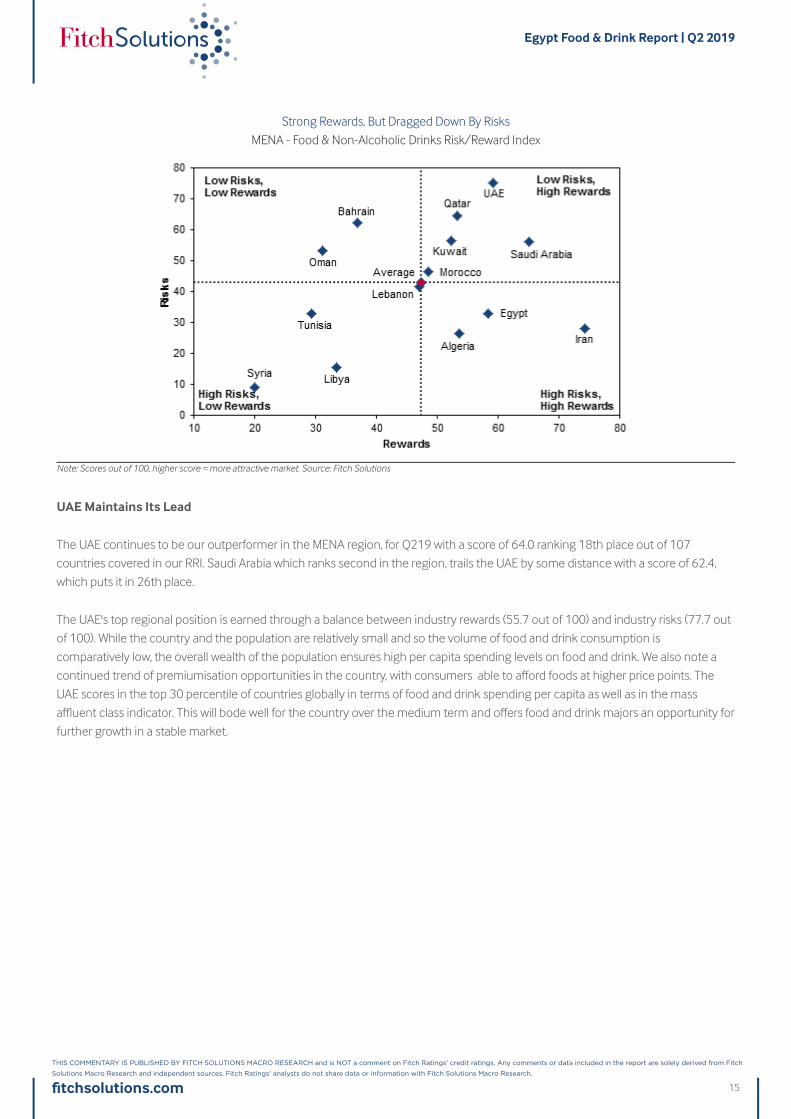
Strong Rewards, But Dragged Down By Risks
MENA - Food & Non-Alcoholic Drinks Risk/Reward Index
Note: Scores out of 100, higher score = more attractive market. Source: Fitch Solutions
UAE Maintains Its Lead
The UAE continues to be our outperformer in the MENA region, for Q219 with a score of 64.0 ranking 18th place out of 107
countries covered in our RRI. Saudi Arabia which ranks second in the region, trails the UAE by some distance with a score of 62.4,
which puts it in 26th place.
The UAE's top regional position is earned through a balance between industry rewards (55.7 out of 100) and industry risks (77.7 out
of 100). While the country and the population are relatively small and so the volume of food and drink consumption is
comparatively low, the overall wealth of the population ensures high per capita spending levels on food and drink. We also note a
continued trend of premiumisation opportunities in the country, with consumers able to afford foods at higher price points. The
UAE scores in the top 30 percentile of countries globally in terms of food and drink spending per capita as well as in the mass
affluent class indicator. This will bode well for the country over the medium term and offers food and drink majors an opportunity for
further growth in a stable market.
Egypt Food & Drink Report | Q2 2019
fitchsolutions.com
THIS COMMENTARY IS PUBLISHED BY FITCH SOLUTIONS MACRO RESEARCH and is NOT a comment on Fitch Ratings' credit ratings. Any comments or data included in the report are solely derived from Fitch
Solutions Macro Research and independent sources. Fitch Ratings' analysts do not share data or information with Fitch Solutions Macro Research.
15
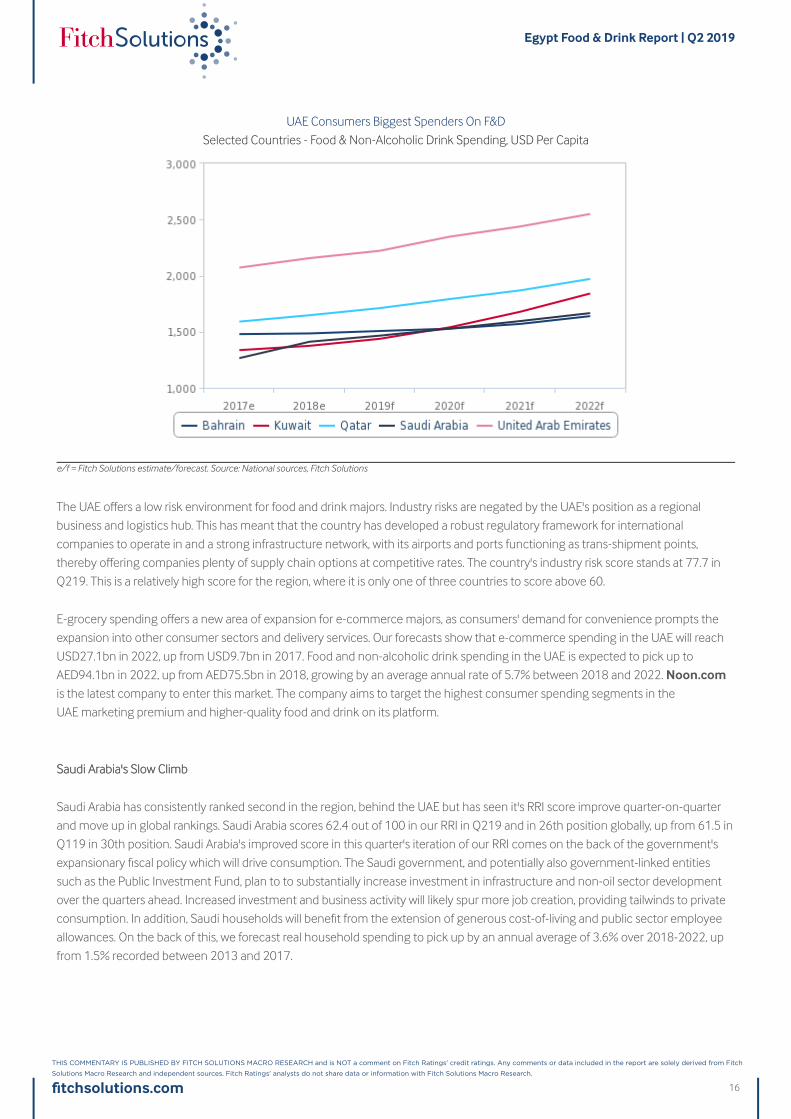
UAE Consumers Biggest Spenders On F&D
Selected Countries - Food & Non-Alcoholic Drink Spending, USD Per Capita
e/f = Fitch Solutions estimate/forecast. Source: National sources, Fitch Solutions
The UAE offers a low risk environment for food and drink majors. Industry risks are negated by the UAE's position as a regional
business and logistics hub. This has meant that the country has developed a robust regulatory framework for international
companies to operate in and a strong infrastructure network, with its airports and ports functioning as trans-shipment points,
thereby offering companies plenty of supply chain options at competitive rates. The country's industry risk score stands at 77.7 in
Q219. This is a relatively high score for the region, where it is only one of three countries to score above 60.
E-grocery spending offers a new area of expansion for e-commerce majors, as consumers' demand for convenience prompts the
expansion into other consumer sectors and delivery services. Our forecasts show that e-commerce spending in the UAE will reach
USD27.1bn in 2022, up from USD9.7bn in 2017. Food and non-alcoholic drink spending in the UAE is expected to pick up to
AED94.1bn in 2022, up from AED75.5bn in 2018, growing by an average annual rate of 5.7% between 2018 and 2022. Noon.comis the latest company to enter this market. The company aims to target the highest consumer spending segments in the
UAE marketing premium and higher-quality food and drink on its platform.
Saudi ArSaudi Arabia's Sloabia's Slow Climbw Climb
Saudi Arabia has consistently ranked second in the region, behind the UAE but has seen it's RRI score improve quarter-on-quarter
and move up in global rankings. Saudi Arabia scores 62.4 out of 100 in our RRI in Q219 and in 26th position globally, up from 61.5 in
Q119 in 30th position. Saudi Arabia's improved score in this quarter's iteration of our RRI comes on the back of the government's
expansionary fiscal policy which will drive consumption. The Saudi government, and potentially also government-linked entities
such as the Public Investment Fund, plan to to substantially increase investment in infrastructure and non-oil sector development
over the quarters ahead. Increased investment and business activity will likely spur more job creation, providing tailwinds to private
consumption. In addition, Saudi households will benefit from the extension of generous cost-of-living and public sector employee
allowances. On the back of this, we forecast real household spending to pick up by an annual average of 3.6% over 2018-2022, up
from 1.5% recorded between 2013 and 2017.
Egypt Food & Drink Report | Q2 2019
fitchsolutions.com
THIS COMMENTARY IS PUBLISHED BY FITCH SOLUTIONS MACRO RESEARCH and is NOT a comment on Fitch Ratings' credit ratings. Any comments or data included in the report are solely derived from Fitch
Solutions Macro Research and independent sources. Fitch Ratings' analysts do not share data or information with Fitch Solutions Macro Research.
16
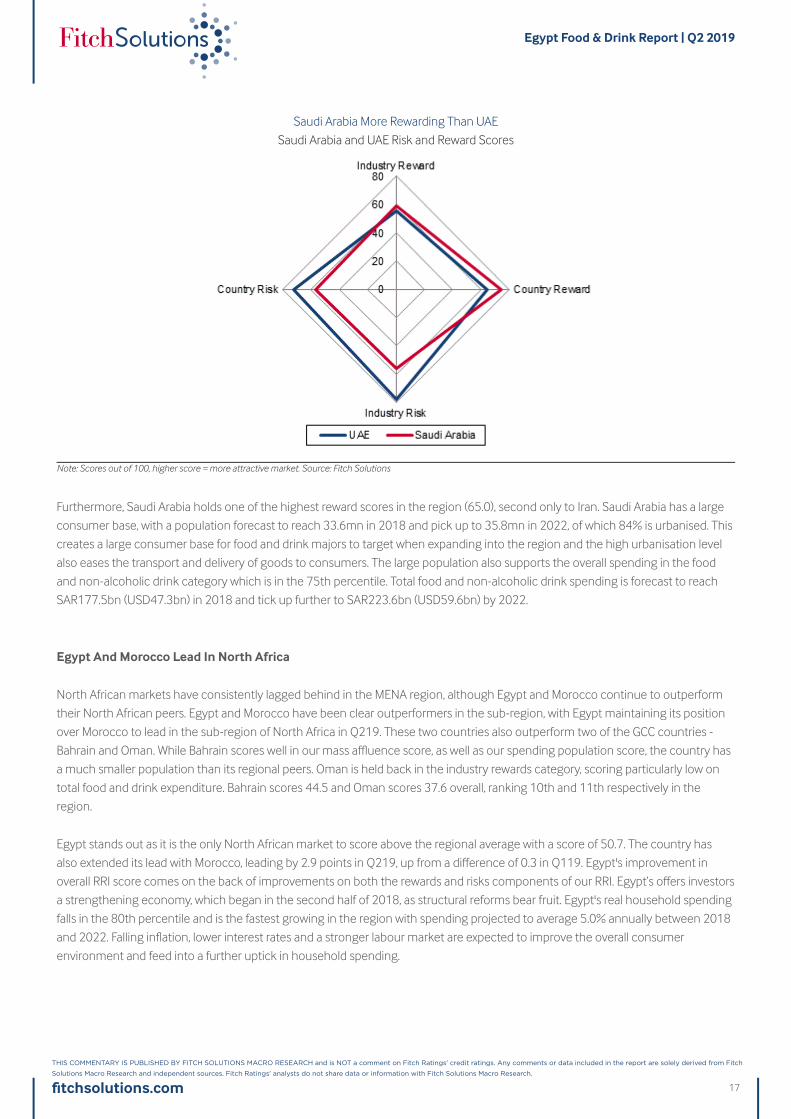
Saudi Arabia More Rewarding Than UAE
Saudi Arabia and UAE Risk and Reward Scores
Note: Scores out of 100, higher score = more attractive market. Source: Fitch Solutions
Furthermore, Saudi Arabia holds one of the highest reward scores in the region (65.0), second only to Iran. Saudi Arabia has a large
consumer base, with a population forecast to reach 33.6mn in 2018 and pick up to 35.8mn in 2022, of which 84% is urbanised. This
creates a large consumer base for food and drink majors to target when expanding into the region and the high urbanisation level
also eases the transport and delivery of goods to consumers. The large population also supports the overall spending in the food
and non-alcoholic drink category which is in the 75th percentile. Total food and non-alcoholic drink spending is forecast to reach
SAR177.5bn (USD47.3bn) in 2018 and tick up further to SAR223.6bn (USD59.6bn) by 2022.
Egypt And Morocco Lead In North Africa
North African markets have consistently lagged behind in the MENA region, although Egypt and Morocco continue to outperform
their North African peers. Egypt and Morocco have been clear outperformers in the sub-region, with Egypt maintaining its position
over Morocco to lead in the sub-region of North Africa in Q219. These two countries also outperform two of the GCC countries -
Bahrain and Oman. While Bahrain scores well in our mass affluence score, as well as our spending population score, the country has
a much smaller population than its regional peers. Oman is held back in the industry rewards category, scoring particularly low on
total food and drink expenditure. Bahrain scores 44.5 and Oman scores 37.6 overall, ranking 10th and 11th respectively in the
region.
Egypt stands out as it is the only North African market to score above the regional average with a score of 50.7. The country has
also extended its lead with Morocco, leading by 2.9 points in Q219, up from a difference of 0.3 in Q119. Egypt's improvement in
overall RRI score comes on the back of improvements on both the rewards and risks components of our RRI. Egypt’s offers investors
a strengthening economy, which began in the second half of 2018, as structural reforms bear fruit. Egypt's real household spending
falls in the 80th percentile and is the fastest growing in the region with spending projected to average 5.0% annually between 2018
and 2022. Falling inflation, lower interest rates and a stronger labour market are expected to improve the overall consumer
environment and feed into a further uptick in household spending.
Egypt Food & Drink Report | Q2 2019
fitchsolutions.com
THIS COMMENTARY IS PUBLISHED BY FITCH SOLUTIONS MACRO RESEARCH and is NOT a comment on Fitch Ratings' credit ratings. Any comments or data included in the report are solely derived from Fitch
Solutions Macro Research and independent sources. Fitch Ratings' analysts do not share data or information with Fitch Solutions Macro Research.
17
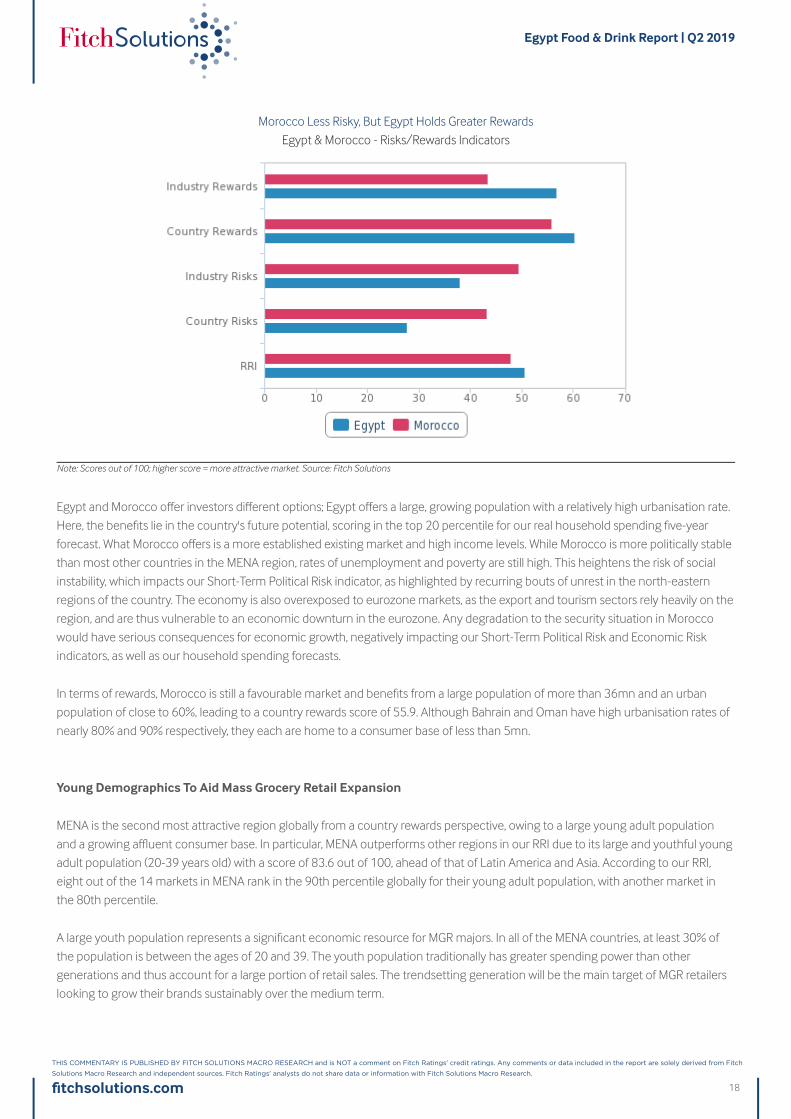
Morocco Less Risky, But Egypt Holds Greater Rewards
Egypt & Morocco - Risks/Rewards Indicators
Note: Scores out of 100; higher score = more attractive market. Source: Fitch Solutions
Egypt and Morocco offer investors different options; Egypt offers a large, growing population with a relatively high urbanisation rate.
Here, the benefits lie in the country's future potential, scoring in the top 20 percentile for our real household spending five-year
forecast. What Morocco offers is a more established existing market and high income levels. While Morocco is more politically stable
than most other countries in the MENA region, rates of unemployment and poverty are still high. This heightens the risk of social
instability, which impacts our Short-Term Political Risk indicator, as highlighted by recurring bouts of unrest in the north-eastern
regions of the country. The economy is also overexposed to eurozone markets, as the export and tourism sectors rely heavily on the
region, and are thus vulnerable to an economic downturn in the eurozone. Any degradation to the security situation in Morocco
would have serious consequences for economic growth, negatively impacting our Short-Term Political Risk and Economic Risk
indicators, as well as our household spending forecasts.
In terms of rewards, Morocco is still a favourable market and benefits from a large population of more than 36mn and an urban
population of close to 60%, leading to a country rewards score of 55.9. Although Bahrain and Oman have high urbanisation rates of
nearly 80% and 90% respectively, they each are home to a consumer base of less than 5mn.
Young Demographics To Aid Mass Grocery Retail Expansion
MENA is the second most attractive region globally from a country rewards perspective, owing to a large young adult population
and a growing affluent consumer base. In particular, MENA outperforms other regions in our RRI due to its large and youthful young
adult population (20-39 years old) with a score of 83.6 out of 100, ahead of that of Latin America and Asia. According to our RRI,
eight out of the 14 markets in MENA rank in the 90th percentile globally for their young adult population, with another market in
the 80th percentile.
A large youth population represents a significant economic resource for MGR majors. In all of the MENA countries, at least 30% of
the population is between the ages of 20 and 39. The youth population traditionally has greater spending power than other
generations and thus account for a large portion of retail sales. The trendsetting generation will be the main target of MGR retailers
looking to grow their brands sustainably over the medium term.
Egypt Food & Drink Report | Q2 2019
fitchsolutions.com
THIS COMMENTARY IS PUBLISHED BY FITCH SOLUTIONS MACRO RESEARCH and is NOT a comment on Fitch Ratings' credit ratings. Any comments or data included in the report are solely derived from Fitch
Solutions Macro Research and independent sources. Fitch Ratings' analysts do not share data or information with Fitch Solutions Macro Research.
18
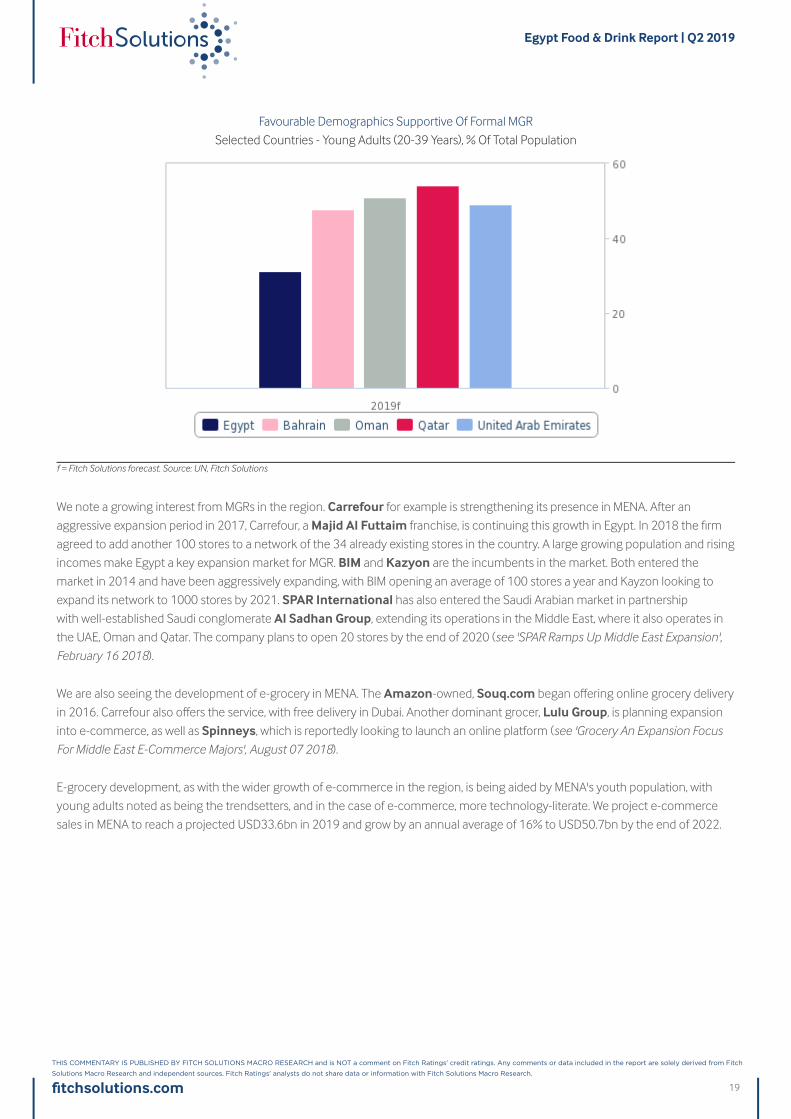
Favourable Demographics Supportive Of Formal MGR
Selected Countries - Young Adults (20-39 Years), % Of Total Population
f = Fitch Solutions forecast. Source: UN, Fitch Solutions
We note a growing interest from MGRs in the region. Carrefour for example is strengthening its presence in MENA. After an
aggressive expansion period in 2017, Carrefour, a Majid Al Futtaim franchise, is continuing this growth in Egypt. In 2018 the firm
agreed to add another 100 stores to a network of the 34 already existing stores in the country. A large growing population and rising
incomes make Egypt a key expansion market for MGR. BIM and Kazyon are the incumbents in the market. Both entered the
market in 2014 and have been aggressively expanding, with BIM opening an average of 100 stores a year and Kayzon looking to
expand its network to 1000 stores by 2021. SPAR International has also entered the Saudi Arabian market in partnership
with well-established Saudi conglomerate Al Sadhan Group, extending its operations in the Middle East, where it also operates in
the UAE, Oman and Qatar. The company plans to open 20 stores by the end of 2020 (see 'SPAR Ramps Up Middle East Expansion',
February 16 2018).
We are also seeing the development of e-grocery in MENA. The Amazon-owned, Souq.com began offering online grocery delivery
in 2016. Carrefour also offers the service, with free delivery in Dubai. Another dominant grocer, Lulu Group, is planning expansion
into e-commerce, as well as Spinneys, which is reportedly looking to launch an online platform (see 'Grocery An Expansion Focus
For Middle East E-Commerce Majors', August 07 2018).
E-grocery development, as with the wider growth of e-commerce in the region, is being aided by MENA's youth population, with
young adults noted as being the trendsetters, and in the case of e-commerce, more technology-literate. We project e-commerce
sales in MENA to reach a projected USD33.6bn in 2019 and grow by an annual average of 16% to USD50.7bn by the end of 2022.
Egypt Food & Drink Report | Q2 2019
fitchsolutions.com
THIS COMMENTARY IS PUBLISHED BY FITCH SOLUTIONS MACRO RESEARCH and is NOT a comment on Fitch Ratings' credit ratings. Any comments or data included in the report are solely derived from Fitch
Solutions Macro Research and independent sources. Fitch Ratings' analysts do not share data or information with Fitch Solutions Macro Research.
19
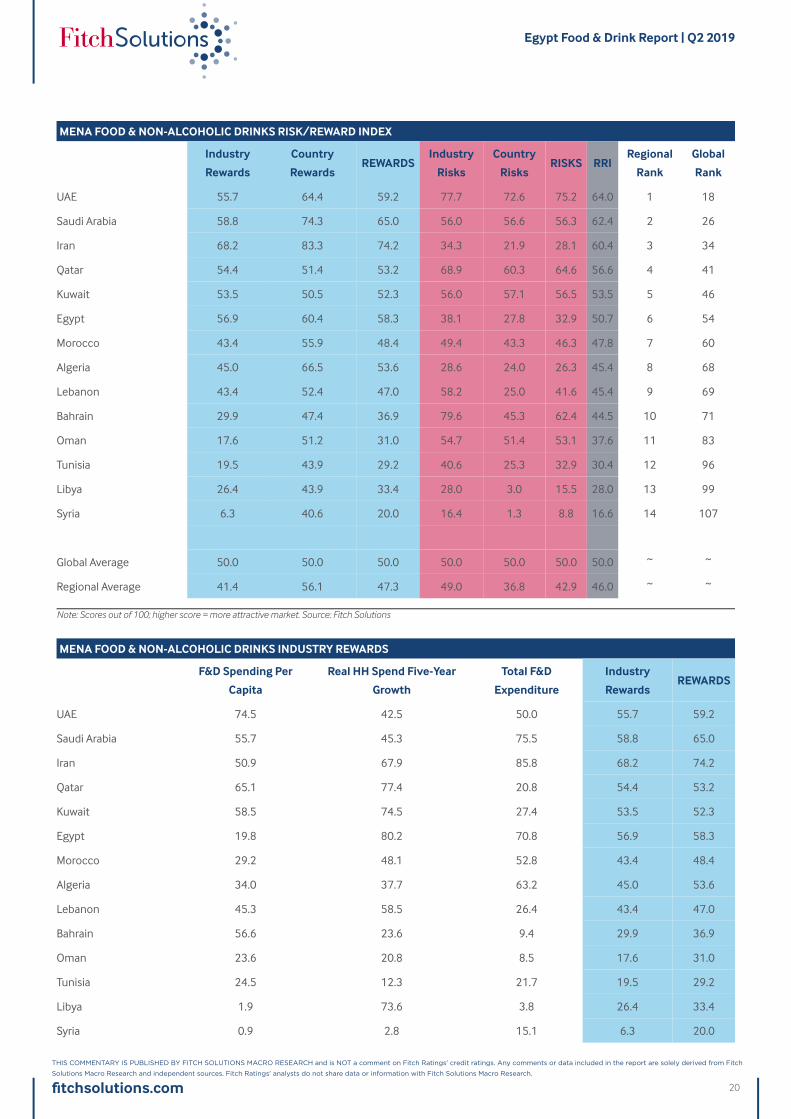
MENA FOOD & NON-ALCOHOLIC DRINKS RISK/REWARD INDEX
Industry
Rewards
Country
RewardsREWARDS
Industry
Risks
Country
RisksRISKS RRI
Regional
Rank
Global
Rank
UAE 55.7 64.4 59.2 77.7 72.6 75.2 64.0 1 18
Saudi Arabia 58.8 74.3 65.0 56.0 56.6 56.3 62.4 2 26
Iran 68.2 83.3 74.2 34.3 21.9 28.1 60.4 3 34
Qatar 54.4 51.4 53.2 68.9 60.3 64.6 56.6 4 41
Kuwait 53.5 50.5 52.3 56.0 57.1 56.5 53.5 5 46
Egypt 56.9 60.4 58.3 38.1 27.8 32.9 50.7 6 54
Morocco 43.4 55.9 48.4 49.4 43.3 46.3 47.8 7 60
Algeria 45.0 66.5 53.6 28.6 24.0 26.3 45.4 8 68
Lebanon 43.4 52.4 47.0 58.2 25.0 41.6 45.4 9 69
Bahrain 29.9 47.4 36.9 79.6 45.3 62.4 44.5 10 71
Oman 17.6 51.2 31.0 54.7 51.4 53.1 37.6 11 83
Tunisia 19.5 43.9 29.2 40.6 25.3 32.9 30.4 12 96
Libya 26.4 43.9 33.4 28.0 3.0 15.5 28.0 13 99
Syria 6.3 40.6 20.0 16.4 1.3 8.8 16.6 14 107
Global Average 50.0 50.0 50.0 50.0 50.0 50.0 50.0 ~ ~
Regional Average 41.4 56.1 47.3 49.0 36.8 42.9 46.0 ~ ~
Note: Scores out of 100; higher score = more attractive market. Source: Fitch Solutions
MENA FOOD & NON-ALCOHOLIC DRINKS INDUSTRY REWARDS
F&D Spending Per
Capita
Real HH Spend Five-Year
Growth
Total F&D
Expenditure
Industry
RewardsREWARDS
UAE 74.5 42.5 50.0 55.7 59.2
Saudi Arabia 55.7 45.3 75.5 58.8 65.0
Iran 50.9 67.9 85.8 68.2 74.2
Qatar 65.1 77.4 20.8 54.4 53.2
Kuwait 58.5 74.5 27.4 53.5 52.3
Egypt 19.8 80.2 70.8 56.9 58.3
Morocco 29.2 48.1 52.8 43.4 48.4
Algeria 34.0 37.7 63.2 45.0 53.6
Lebanon 45.3 58.5 26.4 43.4 47.0
Bahrain 56.6 23.6 9.4 29.9 36.9
Oman 23.6 20.8 8.5 17.6 31.0
Tunisia 24.5 12.3 21.7 19.5 29.2
Libya 1.9 73.6 3.8 26.4 33.4
Syria 0.9 2.8 15.1 6.3 20.0
Egypt Food & Drink Report | Q2 2019
fitchsolutions.com
THIS COMMENTARY IS PUBLISHED BY FITCH SOLUTIONS MACRO RESEARCH and is NOT a comment on Fitch Ratings' credit ratings. Any comments or data included in the report are solely derived from Fitch
Solutions Macro Research and independent sources. Fitch Ratings' analysts do not share data or information with Fitch Solutions Macro Research.
20
F&D Spending Per
Capita
Real HH Spend Five-Year
Growth
Total F&D
Expenditure
Industry
RewardsREWARDS
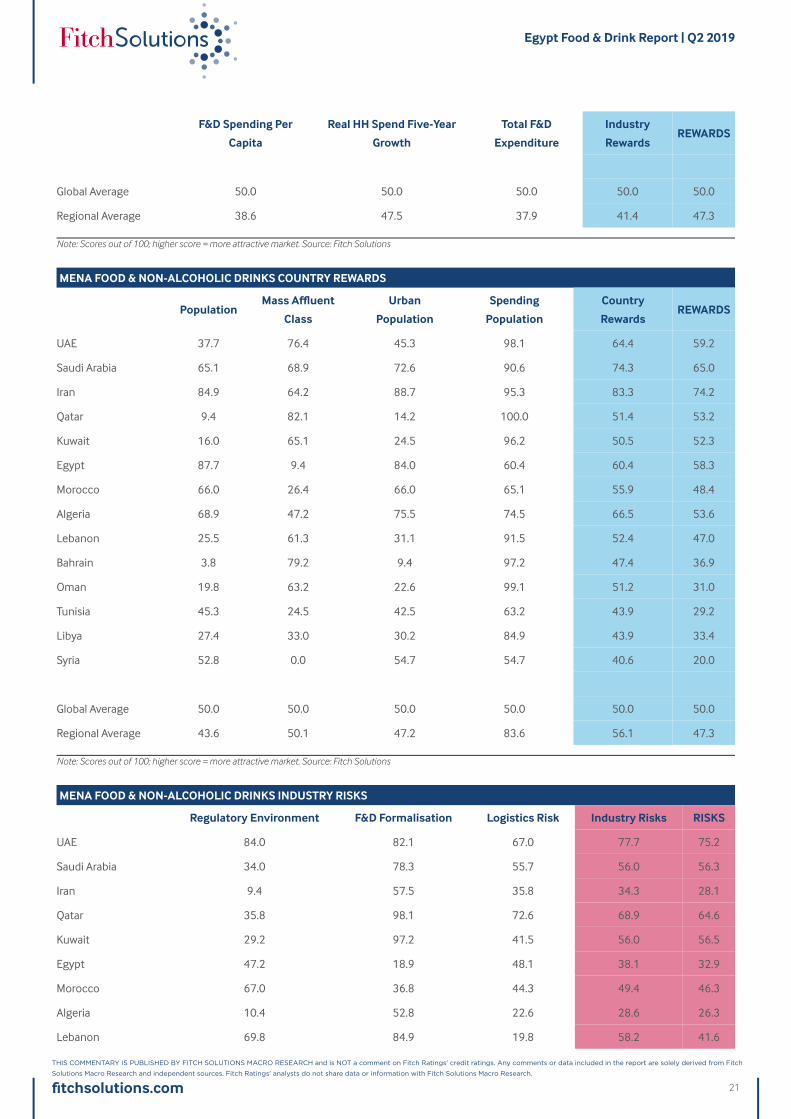
Global Average 50.0 50.0 50.0 50.0 50.0
Regional Average 38.6 47.5 37.9 41.4 47.3
Note: Scores out of 100; higher score = more attractive market. Source: Fitch Solutions
MENA FOOD & NON-ALCOHOLIC DRINKS COUNTRY REWARDS
PopulationMass Affluent
Class
Urban
Population
Spending
Population
Country
RewardsREWARDS
UAE 37.7 76.4 45.3 98.1 64.4 59.2
Saudi Arabia 65.1 68.9 72.6 90.6 74.3 65.0
Iran 84.9 64.2 88.7 95.3 83.3 74.2
Qatar 9.4 82.1 14.2 100.0 51.4 53.2
Kuwait 16.0 65.1 24.5 96.2 50.5 52.3
Egypt 87.7 9.4 84.0 60.4 60.4 58.3
Morocco 66.0 26.4 66.0 65.1 55.9 48.4
Algeria 68.9 47.2 75.5 74.5 66.5 53.6
Lebanon 25.5 61.3 31.1 91.5 52.4 47.0
Bahrain 3.8 79.2 9.4 97.2 47.4 36.9
Oman 19.8 63.2 22.6 99.1 51.2 31.0
Tunisia 45.3 24.5 42.5 63.2 43.9 29.2
Libya 27.4 33.0 30.2 84.9 43.9 33.4
Syria 52.8 0.0 54.7 54.7 40.6 20.0
Global Average 50.0 50.0 50.0 50.0 50.0 50.0
Regional Average 43.6 50.1 47.2 83.6 56.1 47.3
Note: Scores out of 100; higher score = more attractive market. Source: Fitch Solutions
MENA FOOD & NON-ALCOHOLIC DRINKS INDUSTRY RISKS
Regulatory Environment F&D Formalisation Logistics Risk Industry Risks RISKS
UAE 84.0 82.1 67.0 77.7 75.2
Saudi Arabia 34.0 78.3 55.7 56.0 56.3
Iran 9.4 57.5 35.8 34.3 28.1
Qatar 35.8 98.1 72.6 68.9 64.6
Kuwait 29.2 97.2 41.5 56.0 56.5
Egypt 47.2 18.9 48.1 38.1 32.9
Morocco 67.0 36.8 44.3 49.4 46.3
Algeria 10.4 52.8 22.6 28.6 26.3
Lebanon 69.8 84.9 19.8 58.2 41.6
Egypt Food & Drink Report | Q2 2019
fitchsolutions.com
THIS COMMENTARY IS PUBLISHED BY FITCH SOLUTIONS MACRO RESEARCH and is NOT a comment on Fitch Ratings' credit ratings. Any comments or data included in the report are solely derived from Fitch
Solutions Macro Research and independent sources. Fitch Ratings' analysts do not share data or information with Fitch Solutions Macro Research.
21
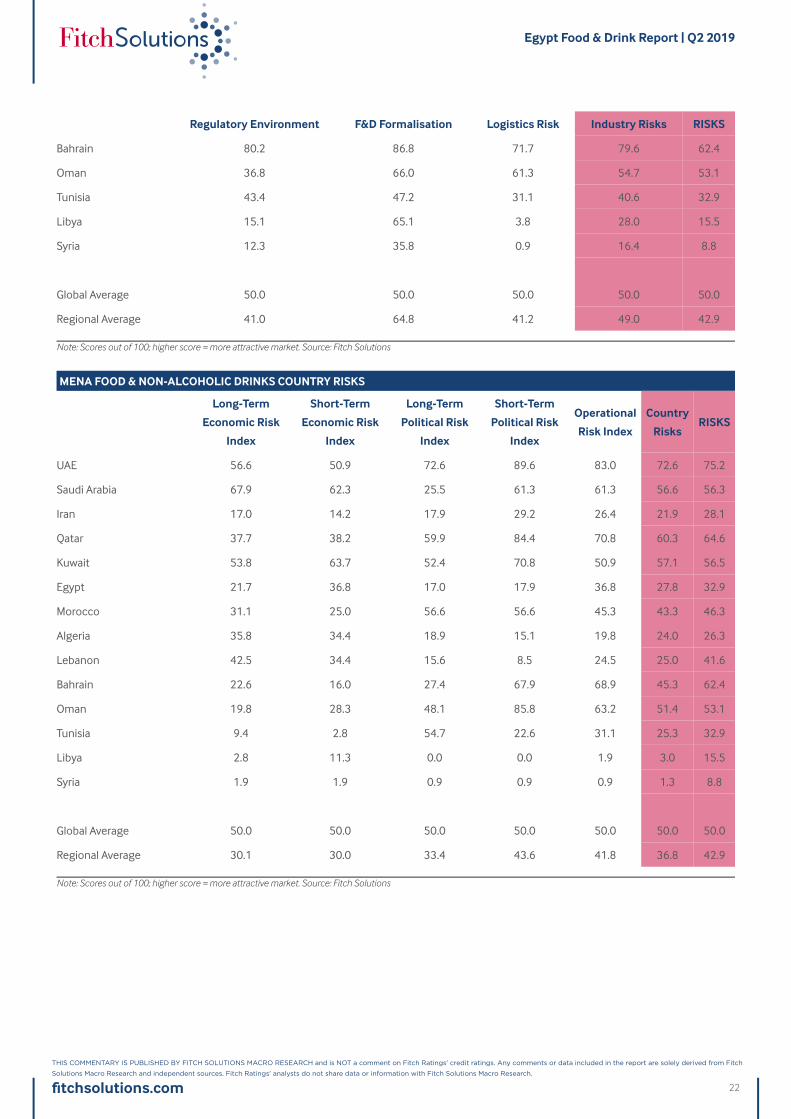
Regulatory Environment F&D Formalisation Logistics Risk Industry Risks RISKS
Bahrain 80.2 86.8 71.7 79.6 62.4
Oman 36.8 66.0 61.3 54.7 53.1
Tunisia 43.4 47.2 31.1 40.6 32.9
Libya 15.1 65.1 3.8 28.0 15.5
Syria 12.3 35.8 0.9 16.4 8.8
Global Average 50.0 50.0 50.0 50.0 50.0
Regional Average 41.0 64.8 41.2 49.0 42.9
Note: Scores out of 100; higher score = more attractive market. Source: Fitch Solutions
MENA FOOD & NON-ALCOHOLIC DRINKS COUNTRY RISKS
Long-Term
Economic Risk
Index
Short-Term
Economic Risk
Index
Long-Term
Political Risk
Index
Short-Term
Political Risk
Index
Operational
Risk Index
Country
RisksRISKS
UAE 56.6 50.9 72.6 89.6 83.0 72.6 75.2
Saudi Arabia 67.9 62.3 25.5 61.3 61.3 56.6 56.3
Iran 17.0 14.2 17.9 29.2 26.4 21.9 28.1
Qatar 37.7 38.2 59.9 84.4 70.8 60.3 64.6
Kuwait 53.8 63.7 52.4 70.8 50.9 57.1 56.5
Egypt 21.7 36.8 17.0 17.9 36.8 27.8 32.9
Morocco 31.1 25.0 56.6 56.6 45.3 43.3 46.3
Algeria 35.8 34.4 18.9 15.1 19.8 24.0 26.3
Lebanon 42.5 34.4 15.6 8.5 24.5 25.0 41.6
Bahrain 22.6 16.0 27.4 67.9 68.9 45.3 62.4
Oman 19.8 28.3 48.1 85.8 63.2 51.4 53.1
Tunisia 9.4 2.8 54.7 22.6 31.1 25.3 32.9
Libya 2.8 11.3 0.0 0.0 1.9 3.0 15.5
Syria 1.9 1.9 0.9 0.9 0.9 1.3 8.8
Global Average 50.0 50.0 50.0 50.0 50.0 50.0 50.0
Regional Average 30.1 30.0 33.4 43.6 41.8 36.8 42.9
Note: Scores out of 100; higher score = more attractive market. Source: Fitch Solutions
Egypt Food & Drink Report | Q2 2019
fitchsolutions.com
THIS COMMENTARY IS PUBLISHED BY FITCH SOLUTIONS MACRO RESEARCH and is NOT a comment on Fitch Ratings' credit ratings. Any comments or data included in the report are solely derived from Fitch
Solutions Macro Research and independent sources. Fitch Ratings' analysts do not share data or information with Fitch Solutions Macro Research.
22
Market Overview
Food
We expect Egypt's food market to show signs of recovery in 2019 as inflation rapidly cools and the successful implementation of
reforms draws foreign investment, boosting economic growth and job creation.
Recent Developments
• In January 2019, France-based dairy producer Lactalis, which already has a subsidiary in Egypt, acquired 100% of the
Greenland Group for an undisclosed sum. Founded in 1995, Greenland has 8 factories in Egypt producing cheese, ghee, milk,
juices and other fresh dairy products, and exports to 50 countries globally.
• According to Egypt's Export Council for Food Industries, food exports during H1 2018 totalled USD1.44bn, led by frozen
vegetables (USD191mn), soft drinks (USD187mn) and cheese (USD139m). Arab countries accounted for the largest share of the
exports of Egyptian food industries by 52%, worth USD753mn, followed by the EU with 15% of total exports (USD213mn).
• Egypt is the fourth-largest halal food market globally, behind Indonesia, Turkey, and Pakistan.
• The majority of Egypt's population falls into lower-income brackets and consumes a higher proportion of traditional,
unprocessed food products.
Market Drivers And Trends
We expect Egypt's food market to continue showing signs of recovery during 2019 as inflation rapidly cools and the successful
implementation of reforms draw foreign investment, boosting economic growth and job creation. Egypt introduced sweeping
economic reforms at the end of 2016 as part of a three-year USD12bn International Monetary Fund loan programme, floating its
currency and cutting subsidies to attract foreign investment that withdrew after the 2011 uprising. While this led to high consumer
price inflation as the currency devaluation/foreign currency shortage impaired businesses' ability to import, thus raising the prices
of imported foodstuffs, we believe most of these price increases have now filtered through.
In a bid to keep food prices low, the Egyptian government has also mandated the state grain buyer, the General Authority for Supply
Commodities (GASC), to import essential food items and distribute these items to the public and private sectors. The GASC is
working with Egypt's central bank to ensure it has the required amount of foreign currency to fulfil this mandate. It will be accepting
tenders for the import of meat, soy bean and corn as part of this mandate. The GASC has purchased wheat for the private sector,
which pushed down the price from EGP2,450 per tonne to EGP1,950 per tonne. The Egyptian government is receiving support, in
the form of loans, in order to facilitate foreign currency liquidity: the World Bank will loan Egypt USD3bn over a period of three years
starting at the end of 2015, and the African Development Bank will lend Egypt USD500mn.
Food Processing
Egypt's processed food industry continues to develop steadily, having attracted investment from a number of multinationals such
as Nestlé and Kraft, which are predominantly attracted by the size of the Egyptian market.
A number of domestic and regional companies such as UAE's Agthia Group (formerly the Emirates Foodstuff and Mineral Water
Company) and Saudi Arabia's Halwani Brothers and Almarai are also present and aiming to capitalise on the growing demand for
processed and packaged food products.
Egypt Food & Drink Report | Q2 2019
fitchsolutions.com
THIS COMMENTARY IS PUBLISHED BY FITCH SOLUTIONS MACRO RESEARCH and is NOT a comment on Fitch Ratings' credit ratings. Any comments or data included in the report are solely derived from Fitch
Solutions Macro Research and independent sources. Fitch Ratings' analysts do not share data or information with Fitch Solutions Macro Research.
23
Local player Edita Food Industries opened a new production facility in July 2017. The Egyptian company now has five facilities in
Egypt, encompassing 28 production lines and a nationwide distribution network. The firm's customer base includes more than
67,000 wholesale and retail customers, while it exports to more than 16 markets in the region.
Unlike in most countries in the Middle East - particularly the wealthy Gulf Cooperation Council (GCC) block - the majority of Egypt's
population falls in the lower-income bracket and consumes a higher proportion of traditional food products purchased from
independent grocery outlets. These products are cheaper and are also perceived to be healthier than packaged alternatives, which
reinforces consumer scepticism regarding the merits of processed and packaged foods. As a result, such products are mainly
consumed by middle- and higher-income consumers, who appreciate shopping in large and modern mass grocery retail (MGR)
outlets.
However, there are increasing signs that the processed food industry could be taking off. For example, though around 80% of
Egyptians consume milk that has not been packaged or pasteurised, this number is quickly shrinking (it was as high as 90% just a
couple of years ago), indicating growth opportunities for dairy producers. Growing fears over food hygiene and safety could
ultimately work in the favour of the packaged food industry.
Although a number of major gains have been made by the food production industry, key challenges still remain. Sector-wide
certification for exports must be established, and small producers continue to have a hard time keeping up with international
standards, especially those of the EU, which are particularly stringent. New standards were set for all food producers by the 2008
Decree no. 757 for the end of 2009. As of the end of 2010, they were also required to meet international guidelines laid out in either
the International Organization for Standardization (ISO)'s 22000 or in the Hazard Analysis and Critical Control Points. Standards
have to be improved if exporters are to take advantage of impending free-trade access to the EU. Having finally established the Food
Export Council, a body that lobbies on behalf of the industry and helps in the drafting and negotiation of foreign trade agreements,
the industry has moved in the right direction. However, despite being announced in 2008, the creation of an independent food
safety agency that would be in charge of safety activities (including the drafting of harmonised safety legislation) has taken time to
materialise. Local sources indicated that mentality must also change in line with standards before the benefits of modernisation can
become more tangible.
Trade
Egypt has ambitious plans to modernise its food-processing sector, with the ultimate aim of increasing the export markets across
the Middle East and Africa in particular. Free-trade agreements with neighbouring Middle Eastern countries are leading to an
increase in export demand for Egyptian processed foods, such as frozen vegetables, dairy products, juices, herbs, spices and
confectionery.
Many multinational companies have highlighted Egypt as a key hub for regional exports. Its geographic position between the Middle
East and North Africa, as well as its regionally advanced transport infrastructure, makes it a natural selection if political stability can
prevail. The Coca-Cola Company, for example, has highlighted Egypt in this regard.
Exports to the EU have also been increasing. Under the terms of a free-trade agreement, the EU has free access to the Egyptian
market for around 90% of its agricultural and fisheries exports, while around 70% of Egyptian agricultural products have free entry
to the EU.
The cyclical nature of Egyptian rice exportation keeps the crop relatively profitable for farmers who, aided by subsidies, continue to
drain increasingly overburdened water supplies. Over the longer term, the removal of subsidies may contribute to lower cultivation,
while the improvement of irrigation can help Egypt reduce water wastage. Incentives to promote the production of less water-
intensive crops would undoubtedly contribute to a more sustainable outlook.
Egypt Food & Drink Report | Q2 2019
fitchsolutions.com
THIS COMMENTARY IS PUBLISHED BY FITCH SOLUTIONS MACRO RESEARCH and is NOT a comment on Fitch Ratings' credit ratings. Any comments or data included in the report are solely derived from Fitch
Solutions Macro Research and independent sources. Fitch Ratings' analysts do not share data or information with Fitch Solutions Macro Research.
24
Confectionery
The Egyptian confectionary market is dominated by chocolate sales. The market is supplied by a mix of local producers and
importers. Multinational Cadbury (now part of Mondelēz International) is one of the leading players, partly on account of its
historical heritage as a UK-based company. Its value share of the chocolate segment is in the region of 50%. However, Mondelēz
has been the subject of public backlash in recent months over claims that its workers are being penalised for attempting to organise
labour unions. Mondelēz's businesses in Egypt and Tunisia stand accused of such practices.
In more recent years, political turmoil and security issues have hindered local operations of foreign companies. For example, in
August 2013, the Egyptian division of Mondelēz suspended production operations in the country. Production was halted on August
16 amid scenes of extreme civil unrest as government forces clashed with protesters on the streets of Egypt. Despite the social and
political turmoil currently spreading across the county, Ola Loutfi from Mondelēz Egypt said the company would 'accommodate the
current situation and work around solutions to continue work and ensure productivity'.
One of the more prominent local players is Edita Food Industries, which is a baked goods leader and offers popular cake brands such
as Molto, Bake Rolz and Todo. It also has the local rights to produce Hostess Brands' HoHos product. Edita opened a new
production facility in July 2017, and now has five manufacturing facilities, encompassing 28 production lines and a nationwide
distribution network. The firm's customer base includes more than 67,000 wholesale and retail customers, while it exports to more
than 16 markets in the region. El Rashidy El Mizan is one of the key players in the sugar confectionary segment. Its portfolio
contains a popular halva product.
Foreign investors have shown growing interest in mergers and acquisitions. For example, in January 2015, US-based cereal maker
Kellogg Company concluded its USD125mn takeover of Egyptian snack-maker Bisco Misr. Kellogg paid EGP89.86 (USD12.48) a
share for 85.93% of total outstanding shares in Bisco Misr.
Dairy
The Egyptian dairy industry, which has received considerable attention over the past few years, is relatively well developed, yet it is
fragmented and shared among about 300 companies. One of the key players is Juhayna Food Industries, which is also a leading
juice manufacturer. The conglomerate operates seven factories in Egypt.
Egypt's largest dairy producer is Dina Farms, a subsidiary of agriculture and consumer goods conglomerate Gozour, which is
owned by Citadel Capital. Dina Farms completed a sizeable expansion in May 2013 at a cost of USD12.9mn, adding 2,400 milking
cows to its herd in just six months. The group currently has a total herd size of about 15,000 head of cattle, with 9,000 milking cows.
Another leading local dairy producer is Beyti, which was acquired by IDJ, a joint venture (JV) between Saudi Almarai and PepsiCo,
for USD115mn. Beyti currently holds a 20% market share in milk production and a slightly lower share in yoghurt production (both
are likely to increase when Beyti is brought to full capacity). Further dairy-focused plays by Almarai were highlighted during its
announcement in June 2014 of a USD345mn investment in Egypt that included the establishment of a dairy farm with 5,000 head
of cattle and plans for future investment in another 20,000-head farm.
Foreign companies are also increasingly prominent in Egypt's dairy sector. In 2015, Denmark-based dairy cooperative ArlaFoods entered into a joint venture with Juhayna, establishing a new company ARJU. Juhayna owns a 51% stake in ARJU, while Arla
holds the remaining 49% and will be in charge of its daily management. Both the firms plan to boost the JV's capital to EGP500mn
(USD63.84mn) in the future, with the aim to generate EUR100mn (USD110.2mn) in revenues by 2020, according to Safwat Sabet,
the chairman of Juhayna.
In January 2019, France-based Lactalis, which already has a subsidiary in Egypt as part of a joint venture with local player Hawala,
acquired 100% of the Greenland Group for an undisclosed sum. Founded in 1995, Greenland has eight factories in Egypt
Egypt Food & Drink Report | Q2 2019
fitchsolutions.com
THIS COMMENTARY IS PUBLISHED BY FITCH SOLUTIONS MACRO RESEARCH and is NOT a comment on Fitch Ratings' credit ratings. Any comments or data included in the report are solely derived from Fitch
Solutions Macro Research and independent sources. Fitch Ratings' analysts do not share data or information with Fitch Solutions Macro Research.
25
producing cheese, ghee, milk, juices and other fresh dairy products. Greenland also owns and operates the only whey production
facility in the Middle East region and exports its products to around 50 countries globally. Describing its strategy for Egypt, Lactalis
said its aim is to be a major producer of dairy products and the acquisition of Greenland will "effectively strengthen our position in
the cheese category".
Halal Food
Egypt is the fourth-largest halal food market globally, behind Indonesia, Turkey, and Pakistan.The importance of the halal food
industry is continuing to grow in the Middle East and other Muslim-majority populations, driven by rising disposable incomes and
consumption levels. Increasing health-consciousness and interest in ethical consumption are also key drivers, as halal foods are
generally perceived to be healthier. Egypt is comfortably the largest market for halal foods in the North Africa region.
Breakneck income growth has benefited the industry immensely, as meat consumption has increased, which has led to
considerable product innovation. While consumers are traditionally partial to fresh meat, the demand for packaged and processed
meat has picked up across the region. Health and hygiene scares have been a major driver in changing consumer habits and have
ultimately benefited the packaged-meat industry. Meat and halal products are now being imported from many countries, including
Australia, New Zealand, Ireland, Brazil, Canada and the US. In fact, most distributors of halal products are not from Muslim countries;
many international producers recognised the potential of the market and invested accordingly.
Although it is Malaysia that has taken the lead in developing and modernising this sector, regional producers have increased
production and are slowly reducing the Gulf region's import dependence. Companies such as UAE-based Al Islami Foods have
started to assume the regional mantle.
Food Services
Egypt's food services sector is relatively well developed. Political and economic turmoil in the country during 2011-2014 took its toll
on the industry, but greater stability over recent years has facilitated rapid development of new food services concepts. The sector
remains highly fragmented, with independent local providers accounting for more than 80% of total sales.
Fast food and full-service restaurants are the most popular formats, while the presence of self-serving cafeterias is limited - mostly
due to the availability of cheap labour. Egypt is home to many major international food services brands, such as KFC, KrispyKreme and Pizza Hut, all of which are managed by local franchisee Egyptian Co for International Touristic Projects, a
subsidiary of Kuwait-based Americana Group. McDonald's franchise, consisting of around 80 outlets, is operated by Manfoods(Mansour Group). In May 2016, Manfoods announced plans to invest around EGP480mn in the modernisation and expansion of
the fast food chain, expecting to have around 170 outlets in Egypt by 2020. The most prominent domestic fast food networks
include Cook Door, Mo'men, Smiley's Grill, Gad and El-Shabrawy. Rapid development of large shopping complexes, such as
the Mall of Egypt, will provide another boost to the food services sector.
UberEATS added Cairo, Egypt to its operations in 2018, following on from launches in the UAE, where the food delivery app has
over 1,000 regular users. According to the company, UberEATS is the first international food delivery service to launch in
Egypt and partners with national and local restaurants to provide a fast delivery service. The app is a localised version, tailored to
catering to these markets and Arabic speakers.
Egypt Food & Drink Report | Q2 2019
fitchsolutions.com
THIS COMMENTARY IS PUBLISHED BY FITCH SOLUTIONS MACRO RESEARCH and is NOT a comment on Fitch Ratings' credit ratings. Any comments or data included in the report are solely derived from Fitch
Solutions Macro Research and independent sources. Fitch Ratings' analysts do not share data or information with Fitch Solutions Macro Research.
26
The Egyptian parliament approved a draft law in April 2018 to regulate the country's large informal food vending sector. The draft
law aims to comprehensively legalise mobile food carts by granting operating licenses from administrative authorities. Authorities
will also issue best practices for the vendors to comply with, as well as stating the conditions and characteristics for each type of
food cart. The law will help reduce the crisis of youth unemployment to a large extent, as it will create formal job opportunities, while
also preventing violations and traffic problems caused by unlicensed street vendors.
Egypt Food & Drink Report | Q2 2019
fitchsolutions.com
THIS COMMENTARY IS PUBLISHED BY FITCH SOLUTIONS MACRO RESEARCH and is NOT a comment on Fitch Ratings' credit ratings. Any comments or data included in the report are solely derived from Fitch
Solutions Macro Research and independent sources. Fitch Ratings' analysts do not share data or information with Fitch Solutions Macro Research.
27
Drink
Similarly to most soft drinks industries in emerging markets, Egypt's carbonates category is dominated by The Coca-Cola Company
and PepsiCo, both of which run extensive marketing campaigns. However, Gulf-based companies are increasingly active in Egypt. In
some cases, such as the joint venture between Almarai and PepsiCo, Gulf and Western companies are combining forces to make
headway in the Middle East and North Africa region, with Egypt the standout market. Most notable among domestic companies
represented in the soft drinks industry are Faragello and Juhayna Food Industries.
Recent Developments
• Al Ahram Beverages, a subsidiary of Heineken, dominates Egypt's alcohol drinks sector. In its FY18 results, released in
February 2019, Heineken highlighted Egypt as an outperforming market in the Africa, Middle East & Eastern Europe
region, reporting strong double-digit growth in beer volumes in the country.
• Pepsico Egypt announced in October 2018 that it would be pumping new investments worth USD515mn over the coming
four years while also allocating more than USD16mn to develop production lines in the beverages sector to promote its
operations in Egypt.
• Consumption of coffee reached 45,000 tons in the first half of 2018, up from 40,000 tons in H1 2017, according to a report by
the Egyptian Chamber of Commerce. Egypt imports 100% of its coffee, with 70% from Indonesia due to its relative affordability.
• Traditional loose tea accounts for a significant proportion of hot drink sales.
Market Drivers And Trends
Alcoholic Drinks
The arrival of Egyptian International Beverage Company (EIBCO) has helped fuel greater competition in the alcoholic drinks
sector, which could help boost value and volume sales in the long term. However, the Al Ahram Beverages Company (owned by
Heineken) continues to dominate the sector so EIBCO's presence is unlikely to be felt much in the short term. Heineken became
the leading company in Egypt's beverages sector in 2003 following its purchase of a 97.8% stake in Al Ahram, which at that time
had a monopoly over alcoholic beverages in the country.
Since Al Ahram was privatised in 1997, the sector has undergone strong growth and is still considered to have great potential for
expansion. However, due to the country's predominantly Muslim population, beer sales rely upon tourist consumption. While
tourism continues to recover following the peak of the Arab Spring in 2011, numbers have still not returned to pre-crisis highs.
Nevertheless, the alcoholic drinks industry continues to grow, albeit from a very low base.
As a result of such a dynamic, Al Ahram is targeting its non-alcoholic beer offering. The company plans to use Heineken's worldwide
distribution network to penetrate other Islamic markets, such as Indonesia, Morocco and Lebanon. The Fairouz brand is certified as
halal by Al-Azhar University, Sunni Islam's most prestigious religious body. Certification gives the brand an enormous advantage in
Islamic markets where practising Muslims do not consume alcoholic beverages.
However, after enjoying a lengthy period of dominance, Al Ahram has recently been challenged by EIBCO, which has set itself
ambitious market-share targets and has initiated a process of rapid product development in an attempt to unseat Al Ahram. The
reintroduction of competition in the sector, after years of Al Ahram pre-eminence, is likely to benefit the industry considerably,
providing a renewed growth spurt.
Egypt Food & Drink Report | Q2 2019
fitchsolutions.com
THIS COMMENTARY IS PUBLISHED BY FITCH SOLUTIONS MACRO RESEARCH and is NOT a comment on Fitch Ratings' credit ratings. Any comments or data included in the report are solely derived from Fitch
Solutions Macro Research and independent sources. Fitch Ratings' analysts do not share data or information with Fitch Solutions Macro Research.
28
Soft Drinks
Similarly to most soft drinks industries in emerging markets, Egypt's carbonates category is dominated by The Coca-ColaCompany and PepsiCo, both of which run extensive marketing campaigns. However, Gulf-based companies are increasingly
active in Egypt. In some cases, such as the joint venture between Almarai and PepsiCo, Gulf and Western companies are combining
forces to make headway in the Middle East and North Africa region, with Egypt the standout market.
In 2016, Coca-Cola announced that it would invest USD500mn in Egypt over the next three years. Such an investment is intended
to increase domestic consumption and to develop its Egyptian operations as a regional export hub. Coca-Cola's plan includes
launching a bottling plant in 6th of October City and expanding the concentrates plant in the Free Zone in Nasr City.
Egyptian dairy and fruit juice producer Beyti, jointly owned by Gulf conglomerate Almarai (52) and PepsiCo (48%), obtained a
long-term loan of USD44mn from The European Bank for Reconstruction and Development (EBRD) in November 2017. The loan
will go towards increasing production capacity, expanding logistical capabilities and delivering a higher number of points of sale. This
follows Almarai/PepsiCo's announcement in 2014 that they would invest a minimum of USD345mn in their Egyptian operations,
including the building of a new juice factory and dairy farm.
Sales of carbonates are high in the country, particularly among younger consumers. Consumers are increasingly brand-conscious
and are responding positively to new product launches targeting rising health-consciousness trends. Mecca Cola was previously a
notable beneficiary of the boycott of US products, managing to significantly boost its market share as a result of its pledge to
donate a percentage of profits to Palestinian and Egyptian causes. Most prominent among domestic companies represented in the
soft drinks industry are Faragello and Juhayna Food Industries.
Unlike the carbonates subsector, the bottled water industry has a sizeable domestic presence. The Mansour Group-owned Hayat
and Sadat-owned Aqua Siwa brands are among the most widely consumed products. In terms of multinational presence, Coca-
Cola's Dasani and Nestlé's Pure Life are among the most popular brands. Pure Life was launched in Egypt in 2002 and now has a
reported market share of around 15%, emerging as a challenger to major brands such as Evian and Volvic. While most brands are
first developed in the West, then exported to emerging markets, Nestlé has been taking the opposite approach with Pure Life,
launching it first in developing markets. The product is able to compete with local brands as it is affordable and benefits from the
Nestlé brand name.
The fruit juice segment is more of a long-term opportunity for investors, given the low purchasing power of most of the population.
However, given its higher-value profile, fruit juices will benefit from Egypt's economic development and will grow from a currently
low base. That said, the category will remain underdeveloped in comparison with Middle Eastern markets for a number of years to
come.
Hot Drinks
The leader in the tea segment is the domestic Badawy & Sons Company. Led by its Al Arosa brand, which accounts for more than
half of the total market by value, the firm's product range appeals to the majority of Egypt's population. Unilever's Lipton tea brand
follows in second place and is particularly popular among the country's middle to high-income consumers. Still, it is not as dominant
in Egypt as it is in a number of more affluent Middle East markets. In Egypt, the low spending capability of most consumers means
Lipton does not register the sort of volume one might expect in a country with a population surpassing 80mn. However, as the
middle class grows over the longer term, Lipton will be among the main benefactors.
Egypt's fast-growing hot drinks industry has attracted investment from multinational giant Nestlé, which in early 2018 announced
its plans to acquire domestic instant coffee company Caravan Marketing.
Traditional loose tea still dominates the market in Egypt, accounting for the vast majority of sales. However, tea bags are growing in
Egypt Food & Drink Report | Q2 2019
fitchsolutions.com
THIS COMMENTARY IS PUBLISHED BY FITCH SOLUTIONS MACRO RESEARCH and is NOT a comment on Fitch Ratings' credit ratings. Any comments or data included in the report are solely derived from Fitch
Solutions Macro Research and independent sources. Fitch Ratings' analysts do not share data or information with Fitch Solutions Macro Research.
29
popularity as they are considered a higher-quality, premium product, owing to their greater convenience and better quality. Black
tea is the traditional tea of choice in the region and continues to dominate the market. However, in recent years, other
varieties such as green tea, fruit and herbal teas have also started to grow in popularity.
A sizeable youth population has been the key driver behind the rapid increase in the consumption of chocolate-based hot drinks,
which are popular in both on- and off-trade channels. Such flavoured powdered drinks are available both in the winter (hot) and
summer (chilled), which has contributed to their popularity.
Egypt Food & Drink Report | Q2 2019
fitchsolutions.com
THIS COMMENTARY IS PUBLISHED BY FITCH SOLUTIONS MACRO RESEARCH and is NOT a comment on Fitch Ratings' credit ratings. Any comments or data included in the report are solely derived from Fitch
Solutions Macro Research and independent sources. Fitch Ratings' analysts do not share data or information with Fitch Solutions Macro Research.
30
Mass Grocery Retail
The Egyptian mass grocery retail sector is developing steadily as consumers trade up to formal grocery retailing, especially in major
cities such as Cairo and Alexandria. Despite good progress, the market remains fragmented and continues to be dominated by
small, family-run, independent stores in highly populated urban areas.
We expect investment in Egypt's formal grocery retail space to accelerate over the coming years, despite the near-term economic
challenges and inflationary environment. While discounters and traditional stores are best-positioned in these conditions, we see
robust growth opportunities for all formats in 2019, given that food and drink is an essential good, and is relatively shielded from an
economic downturn. Moreover, Egypt's long-term consumer fundamentals are arguably the most attractive in the region for
grocery firms, on the back of its large, youthful and growing population.
Recent Developments
• From 2018 onwards, UAE-based retail giant Majid Al Futtaim plans to ramp up expansion of its Carrefour stores in Egypt,
adding 100 new stores to the 37 stores it already operates in the country. Majid Al Futtaim signed an agreement with Egypt’s
Ministry of Investment and International Cooperation and the National Service Projects Organization as part of the deal.
• Knockmart Food Industries and Jumia Egypt announced in a joint statement in November 2017 that they have entered
into a strategic partnership to launch online grocery platform Jumia Fresh. The companies' early-mover advantage and Jumia's
expertise in e-commerce in Egypt should ensure that the new platform becomes a major force in the country's nascent online
grocery market.
• Mass grocery retail chains operating in Egypt are confronting increased price sensitivity among consumers by running
promotions, creating loyalty programs, and offering bulk discounts. In some cases, they have also substituted imported products
for domestic alternatives.
• We are seeing aggressive expansion of discount stores, as the middle class increasingly seeks lower prices, particularly in the
high-inflation environment. Kazyon (182 stores) and Turkey's BIM (256 stores) are the most successful hard discounters in
Egypt. Both are planning further expansion.
• The Egyptian MGR market continues to be dominated by the informal sector, with traditional stores and wet markets accounting
for an estimated 97% of all grocery outlets and 70% of total sales.
Major Players
Mansour Group-owned Metro (not to be confused with the German Metro Group, which recently ceased operations in Egypt) is
the largest domestic retailer by turnover and has stores in Cairo, Alexandria, Giza, Mansoura and Iasmailia. Most of its outlets are
open 24 hours a day in order to meet the growing demand for convenience. Metro's strategy has also been to diversify its store
formats. Carrefour MAF sought a takeover of Metro in Egypt in 2013, though the deal fell through.
Spinneys Group and Carrefour MAF rank among the leading foreign retailers operating in Egypt. Carrefour MAF is the market
leader in the hypermarket category. Originally a joint venture between Carrefour and Majid Al Futtaim (MAF), the business is now
100% owned by MAF following a deal in 2013. MAF is now the Middle East's sole franchisee of the Carrefour fascia. MAF is currently
engaging in strong expansion plans in the Middle East, though it has particularly targeted Egypt. In 2018, the group announced that
it planned to add 100 new hypermarkets over the coming years, a considerable investment given the company currently only
operates 37 stores.
Meanwhile, Dubai-based Spinneys, which first opened in Egypt in 2007, has expanded rapidly in recent years, quadrupling the size of
Egypt Food & Drink Report | Q2 2019
fitchsolutions.com
THIS COMMENTARY IS PUBLISHED BY FITCH SOLUTIONS MACRO RESEARCH and is NOT a comment on Fitch Ratings' credit ratings. Any comments or data included in the report are solely derived from Fitch
Solutions Macro Research and independent sources. Fitch Ratings' analysts do not share data or information with Fitch Solutions Macro Research.
31
its store network since 2015, with plans to add further stores in 2019.
Saudi Arabia's Panda Retail also entered the Egyptian market in 2015, focusing on the cities of Cairo, Alexandria, Mansoura and
Assiut. Panda opened its first hypermarket in Upper Egypt in Q417, and plans to open a further 15 branches in the region. The
company has over 480 stores in the Middle East, although these are predominantly based in its domestic market.
We are seeing aggressive expansion of discount stores, as the middle class increasingly seeks lower prices, particularly in the high-
inflation environment. Kazyon (182 stores) and Turkey's BIM (256 stores) are the most successful hard discounters in Egypt,
opening small supermarket outlets that are conveniently located in urban neighbourhoods. Both retailers are planning on further
expansion.
However, not all international retailers have enjoyed success in Egypt. British retailer Sainsbury's withdrew from the country in
2001, having presided over a network of 100 stores employing more than 5,000 people. Sainsbury's attributed its departure to an
Egyptian consumer boycott, fuelled by rumours of 'Zionist' backers within the corporation. However, a more likely explanation is that
the company erred strategically after trying to replicate British retail trends and consumption habits in the Egyptian market, rather
than tailoring their offering to meet the needs of local consumers.
South African retailer Shoprite was present in the Egyptian market for 10 years through a joint venture with the Egyptian-Kuwaiti Holding Company. However, Shoprite closed its store network in 2006 in line with plans to improve its general group
operating efficiency. The company hoped that Egypt would become one of its leading international markets; on entering the
country, it planned 100 stores within 10 years. Yet, at the end of that period, Shoprite had just seven stores. Shoprite blamed difficult
local planning laws and restrictions that prevented it from opening the number of stores it required to warrant its investment. It is
likely that poor planning and unrealistic targets in the context of Egypt's operating environment also played a role.
Market Drivers And Trends
Egypt's mass grocery retail sector is poised for robust growth over our forecast period on the back of growing investment, rising
incomes and a favourable demographic profile (large young adult population). Investment activity continues to step up, enabling
consumers to trade up to formal grocery retailing, especially in major cities such as Cairo and Alexandria.
Despite good progress in recent years, the market remains fragmented and continues to be dominated by small, family-run,
independent stores in highly populated urban areas. These informal grocers and traditional wet markets make up an estimated 70%
of total grocery spending. However, the market share of such outlets has declined in recent years as the sector has begun to
develop steadily. While the estimated 65,000-plus family-run shops and traditional markets still account for the majority of food
sales in the country, this figure is declining - a trend that can be attributed to the increasing presence of foreign retailers.
Regional MGR operators are showing greater interest in Egypt, and as store openings increase across the country, formal food
retail's share of total food and drink sales will grow.
Sales via supermarkets and hypermarkets remain relatively small as a total proportion of grocery sales, hindered by the fact that the
majority of Egyptians do not have transport to travel to the often out-of-town malls housing these modern outlets. However the
hypermarket model is gradually emerging in Egypt, and will continue to grow over our forecast period, due to the value-added
services offered. Poor infrastructure also makes journey times slow, meaning shoppers often only want to make one journey for
groceries, and large formats fulfil this purpose.
The rising number of discount stores and the possible arrival of a warehouse/cash-and-carry-style format in the country will appeal
to the large number low-income consumers in Egypt. However, small, independent stores will retain significant market influence for
the time being, since they cater for both higher- and lower-income consumers.
Egypt Food & Drink Report | Q2 2019
fitchsolutions.com
THIS COMMENTARY IS PUBLISHED BY FITCH SOLUTIONS MACRO RESEARCH and is NOT a comment on Fitch Ratings' credit ratings. Any comments or data included in the report are solely derived from Fitch
Solutions Macro Research and independent sources. Fitch Ratings' analysts do not share data or information with Fitch Solutions Macro Research.
32
Egypt's large and youthful population will yield considerable demographic dividends for players in the organised retail sector over
the near to medium term. With a population of more than 90mn, of which around 55% is younger than 30, retailers stand to benefit
from a large and diverse consumer market. An expanding young adult population (20-39 years) will drive sales in the formal food
retailing sector as this cohort tends to embrace modern consumption patterns and is willing to make higher value purchases. We
forecast the young adult population to make up over 30% of the total population over our five-year forecast period.
Rising incomes will support food and non-alcoholic drink sales in the organised retail sector. We expect private-labels and affordable
mass-market offerings to perform well as the majority of Egyptian households fall into low income brackets. While consumer
purchasing power came under heavy pressure in 2017 due to elevated inflation following sharp currency devaluation, we forecast a
strong recovery in household incomes from 2018 and 2019 onwards. We forecast growth in the USD5,000-10,000 income bracket
to rise from 3mn households in 2017, which was down from 6.8mn in 2016, to 13.7mn by 2022. As a result, quality and shifting
preferences towards branded packaged goods will increasingly determine purchasing decisions, driving demand for formalisation
even beyond our five-year outlook.
Egypt Food & Drink Report | Q2 2019
fitchsolutions.com
THIS COMMENTARY IS PUBLISHED BY FITCH SOLUTIONS MACRO RESEARCH and is NOT a comment on Fitch Ratings' credit ratings. Any comments or data included in the report are solely derived from Fitch
Solutions Macro Research and independent sources. Fitch Ratings' analysts do not share data or information with Fitch Solutions Macro Research.
33
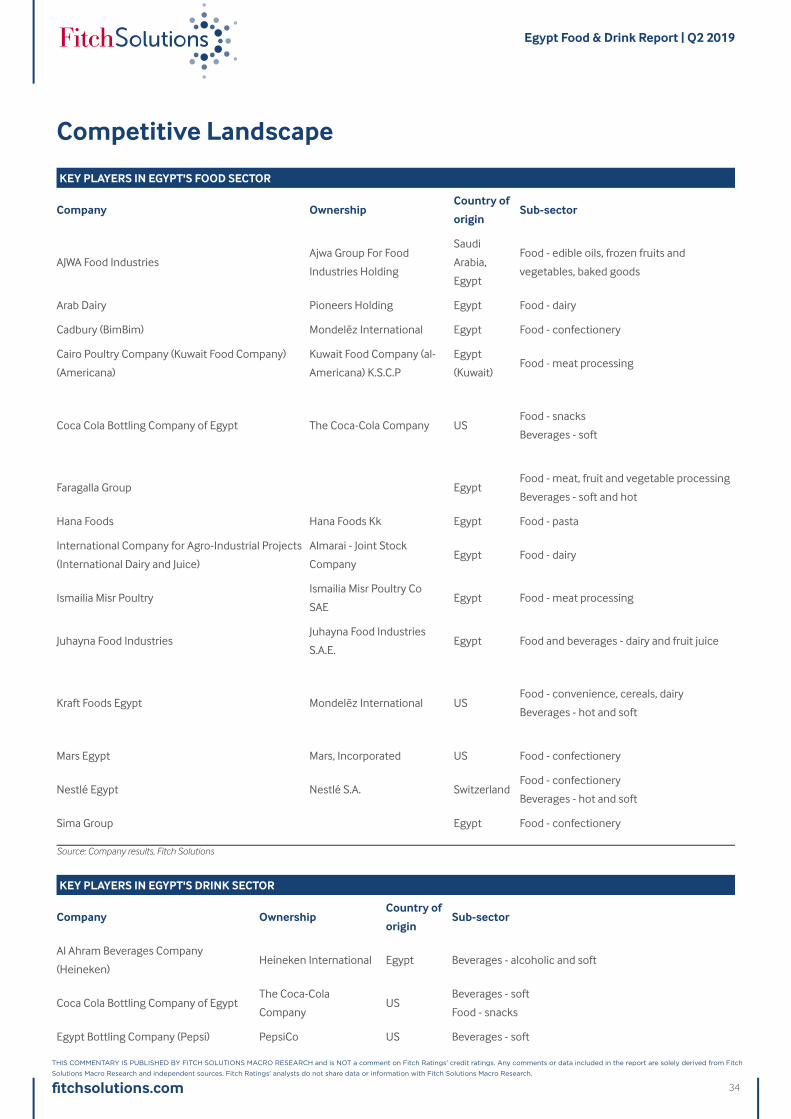
Competitive Landscape
KEY PLAYERS IN EGYPT'S FOOD SECTOR
Company OwnershipCountry of
originSub-sector
AJWA Food IndustriesAjwa Group For Food
Industries Holding
Saudi
Arabia,
Egypt
Food - edible oils, frozen fruits and
vegetables, baked goods
Arab Dairy Pioneers Holding Egypt Food - dairy
Cadbury (BimBim) Mondelēz International Egypt Food - confectionery
Cairo Poultry Company (Kuwait Food Company)
(Americana)
Kuwait Food Company (al-
Americana) K.S.C.P
Egypt
(Kuwait)Food - meat processing
Coca Cola Bottling Company of Egypt The Coca-Cola Company USFood - snacks
Beverages - soft
Faragalla Group EgyptFood - meat, fruit and vegetable processing
Beverages - soft and hot
Hana Foods Hana Foods Kk Egypt Food - pasta
International Company for Agro-Industrial Projects
(International Dairy and Juice)
Almarai - Joint Stock
CompanyEgypt Food - dairy
Ismailia Misr PoultryIsmailia Misr Poultry Co
SAEEgypt Food - meat processing
Juhayna Food IndustriesJuhayna Food Industries
S.A.E.Egypt Food and beverages - dairy and fruit juice
Kraft Foods Egypt Mondelēz International USFood - convenience, cereals, dairy
Beverages - hot and soft
Mars Egypt Mars, Incorporated US Food - confectionery
Nestlé Egypt Nestlé S.A. SwitzerlandFood - confectionery
Beverages - hot and soft
Sima Group Egypt Food - confectionery
Source: Company results, Fitch Solutions
KEY PLAYERS IN EGYPT'S DRINK SECTOR
Company OwnershipCountry of
originSub-sector
Al Ahram Beverages Company
(Heineken)Heineken International Egypt Beverages - alcoholic and soft
Coca Cola Bottling Company of EgyptThe Coca-Cola
CompanyUS
Beverages - soft
Food - snacks
Egypt Bottling Company (Pepsi) PepsiCo US Beverages - soft
Egypt Food & Drink Report | Q2 2019
fitchsolutions.com
THIS COMMENTARY IS PUBLISHED BY FITCH SOLUTIONS MACRO RESEARCH and is NOT a comment on Fitch Ratings' credit ratings. Any comments or data included in the report are solely derived from Fitch
Solutions Macro Research and independent sources. Fitch Ratings' analysts do not share data or information with Fitch Solutions Macro Research.
34
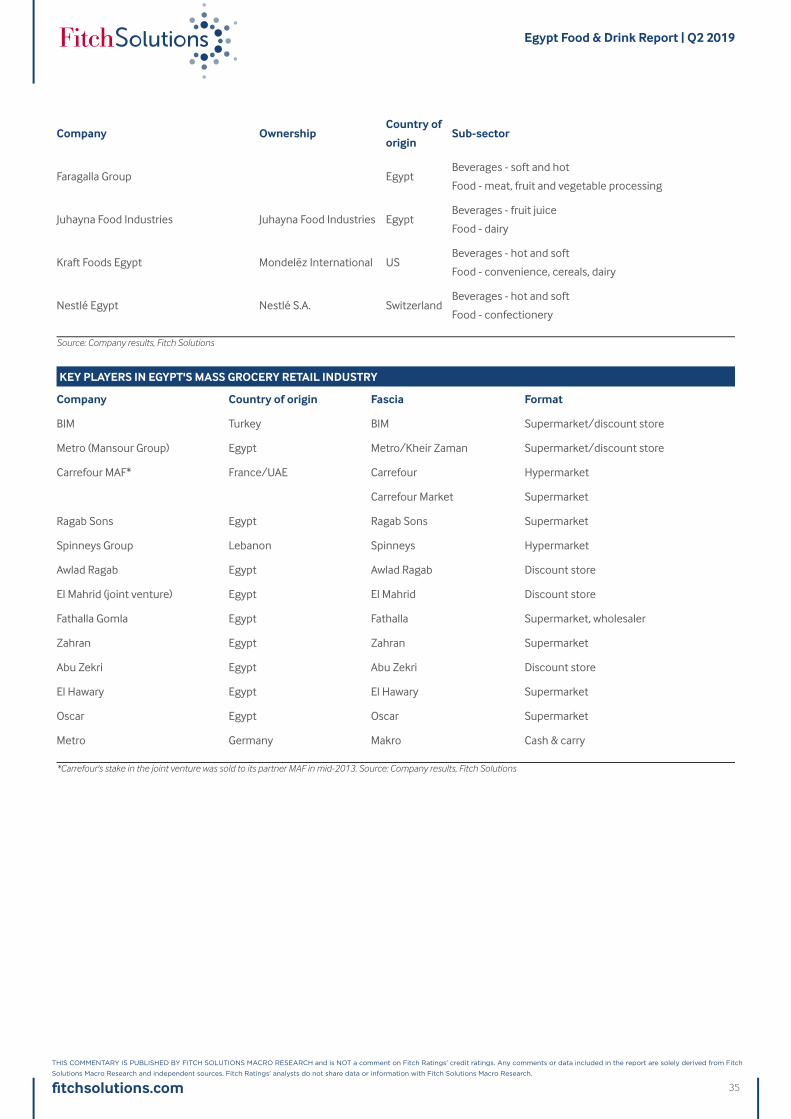
Company OwnershipCountry of
originSub-sector
Faragalla Group EgyptBeverages - soft and hot
Food - meat, fruit and vegetable processing
Juhayna Food Industries Juhayna Food Industries EgyptBeverages - fruit juice
Food - dairy
Kraft Foods Egypt Mondelēz International USBeverages - hot and soft
Food - convenience, cereals, dairy
Nestlé Egypt Nestlé S.A. SwitzerlandBeverages - hot and soft
Food - confectionery
Source: Company results, Fitch Solutions
KEY PLAYERS IN EGYPT'S MASS GROCERY RETAIL INDUSTRY
Company Country of origin Fascia Format
BIM Turkey BIM Supermarket/discount store
Metro (Mansour Group) Egypt Metro/Kheir Zaman Supermarket/discount store
Carrefour MAF* France/UAE Carrefour Hypermarket
Carrefour Market Supermarket
Ragab Sons Egypt Ragab Sons Supermarket
Spinneys Group Lebanon Spinneys Hypermarket
Awlad Ragab Egypt Awlad Ragab Discount store
El Mahrid (joint venture) Egypt El Mahrid Discount store
Fathalla Gomla Egypt Fathalla Supermarket, wholesaler
Zahran Egypt Zahran Supermarket
Abu Zekri Egypt Abu Zekri Discount store
El Hawary Egypt El Hawary Supermarket
Oscar Egypt Oscar Supermarket
Metro Germany Makro Cash & carry
*Carrefour's stake in the joint venture was sold to its partner MAF in mid-2013. Source: Company results, Fitch Solutions
Egypt Food & Drink Report | Q2 2019
fitchsolutions.com
THIS COMMENTARY IS PUBLISHED BY FITCH SOLUTIONS MACRO RESEARCH and is NOT a comment on Fitch Ratings' credit ratings. Any comments or data included in the report are solely derived from Fitch
Solutions Macro Research and independent sources. Fitch Ratings' analysts do not share data or information with Fitch Solutions Macro Research.
35
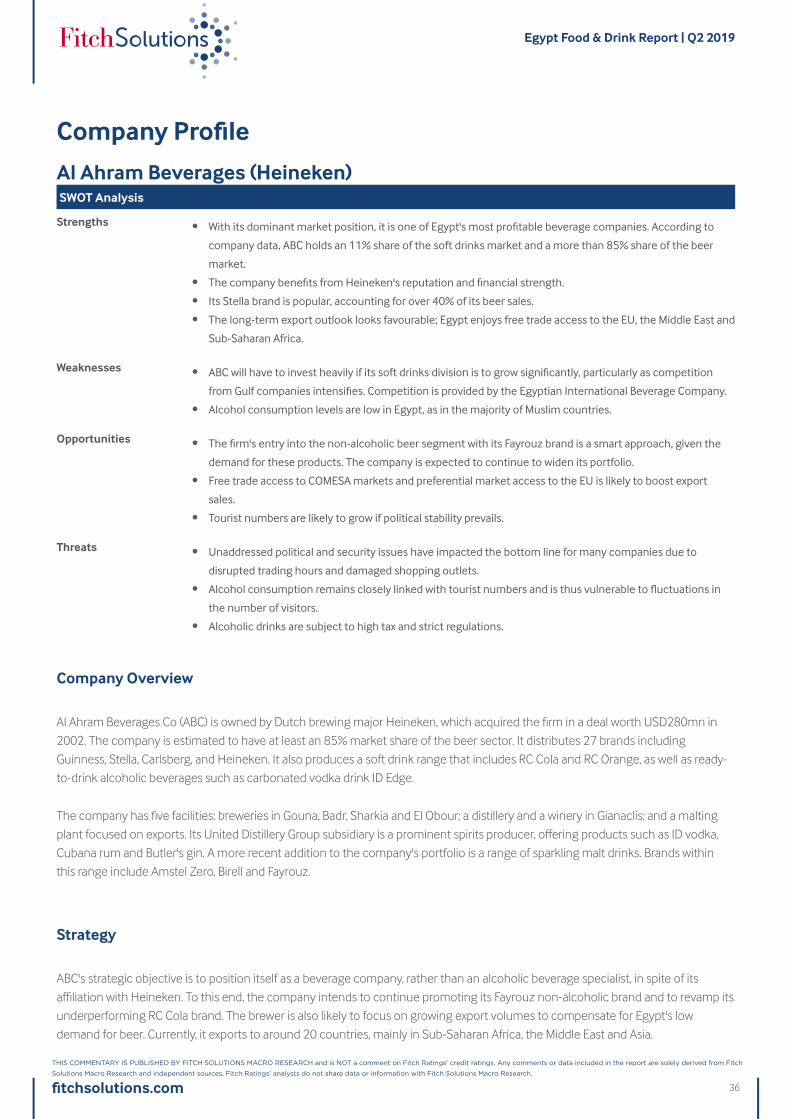
Company Profile
Al Ahram Beverages (Heineken)SWOT Analysis
Strengths • With its dominant market position, it is one of Egypt's most profitable beverage companies. According to
company data, ABC holds an 11% share of the soft drinks market and a more than 85% share of the beer
market.
• The company benefits from Heineken's reputation and financial strength.
• Its Stella brand is popular, accounting for over 40% of its beer sales.
• The long-term export outlook looks favourable; Egypt enjoys free trade access to the EU, the Middle East and
Sub-Saharan Africa.
Weaknesses • ABC will have to invest heavily if its soft drinks division is to grow significantly, particularly as competition
from Gulf companies intensifies. Competition is provided by the Egyptian International Beverage Company.
• Alcohol consumption levels are low in Egypt, as in the majority of Muslim countries.
Opportunities • The firm's entry into the non-alcoholic beer segment with its Fayrouz brand is a smart approach, given the
demand for these products. The company is expected to continue to widen its portfolio.
• Free trade access to COMESA markets and preferential market access to the EU is likely to boost export
sales.
• Tourist numbers are likely to grow if political stability prevails.
Threats • Unaddressed political and security issues have impacted the bottom line for many companies due to
disrupted trading hours and damaged shopping outlets.
• Alcohol consumption remains closely linked with tourist numbers and is thus vulnerable to fluctuations in
the number of visitors.
• Alcoholic drinks are subject to high tax and strict regulations.
Company Overview
Al Ahram Beverages Co (ABC) is owned by Dutch brewing major Heineken, which acquired the firm in a deal worth USD280mn in
2002. The company is estimated to have at least an 85% market share of the beer sector. It distributes 27 brands including
Guinness, Stella, Carlsberg, and Heineken. It also produces a soft drink range that includes RC Cola and RC Orange, as well as ready-
to-drink alcoholic beverages such as carbonated vodka drink ID Edge.
The company has five facilities: breweries in Gouna, Badr, Sharkia and El Obour; a distillery and a winery in Gianaclis; and a malting
plant focused on exports. Its United Distillery Group subsidiary is a prominent spirits producer, offering products such as ID vodka,
Cubana rum and Butler's gin. A more recent addition to the company's portfolio is a range of sparkling malt drinks. Brands within
this range include Amstel Zero, Birell and Fayrouz.
Strategy
ABC's strategic objective is to position itself as a beverage company, rather than an alcoholic beverage specialist, in spite of its
affiliation with Heineken. To this end, the company intends to continue promoting its Fayrouz non-alcoholic brand and to revamp its
underperforming RC Cola brand. The brewer is also likely to focus on growing export volumes to compensate for Egypt's low
demand for beer. Currently, it exports to around 20 countries, mainly in Sub-Saharan Africa, the Middle East and Asia.
Egypt Food & Drink Report | Q2 2019
fitchsolutions.com
THIS COMMENTARY IS PUBLISHED BY FITCH SOLUTIONS MACRO RESEARCH and is NOT a comment on Fitch Ratings' credit ratings. Any comments or data included in the report are solely derived from Fitch
Solutions Macro Research and independent sources. Fitch Ratings' analysts do not share data or information with Fitch Solutions Macro Research.
36
Recent Developments
2019
In its FY18 results, released in February, Heineken highlighted Egypt (along with South Africa, Ethiopia and Rwanda) as an
outperforming market in Africa, reporting strong volume growth in the country. Overall beer volume growth rose by 5.0%
organically in the Africa, Middle East & Eastern Europe region in FY18, with regional operating profit up 16.2% y-o-y.
2018
Hans Essaadi, will take up the position of managing director of Heineken Egypt, effective Sept 1 2018. Essaadi was previously MD of
Heineken Malaysia. In this role, Essaadi steered the company to deliver year-on-year improved financial performance through
driving commercial excellence, focusing on innovation, optimising cost efficiencies, uplifting sustainability initiatives and ensuring
more structured people development plans are in place, according to Heineken Malaysia.
2017
According to ABC's managing director, the company has been forced to increase the price of its products by more than 10% due to
the devaluation of the Egyptian currency. Almost 25% of the raw materials used for production are imported from abroad, which
requires using the US dollar and therefore increases the cost of production. A gradual recovery in Egyptian tourist arrivals should
provide some upside support from 2017 onwards, given that tourists are a key consumer of alcoholic drinks in Egypt.
2016
The company did not expect to reach its 2016 financial targets due to a sharp decline in tourist arrivals.
Financial Data
• 2018 Global revenue: EUR22,470mn
• 2017 Global revenue: EUR21,910mn
• 2016 Global revenue: EUR20,792mn
Egypt Food & Drink Report | Q2 2019
fitchsolutions.com
THIS COMMENTARY IS PUBLISHED BY FITCH SOLUTIONS MACRO RESEARCH and is NOT a comment on Fitch Ratings' credit ratings. Any comments or data included in the report are solely derived from Fitch
Solutions Macro Research and independent sources. Fitch Ratings' analysts do not share data or information with Fitch Solutions Macro Research.
37
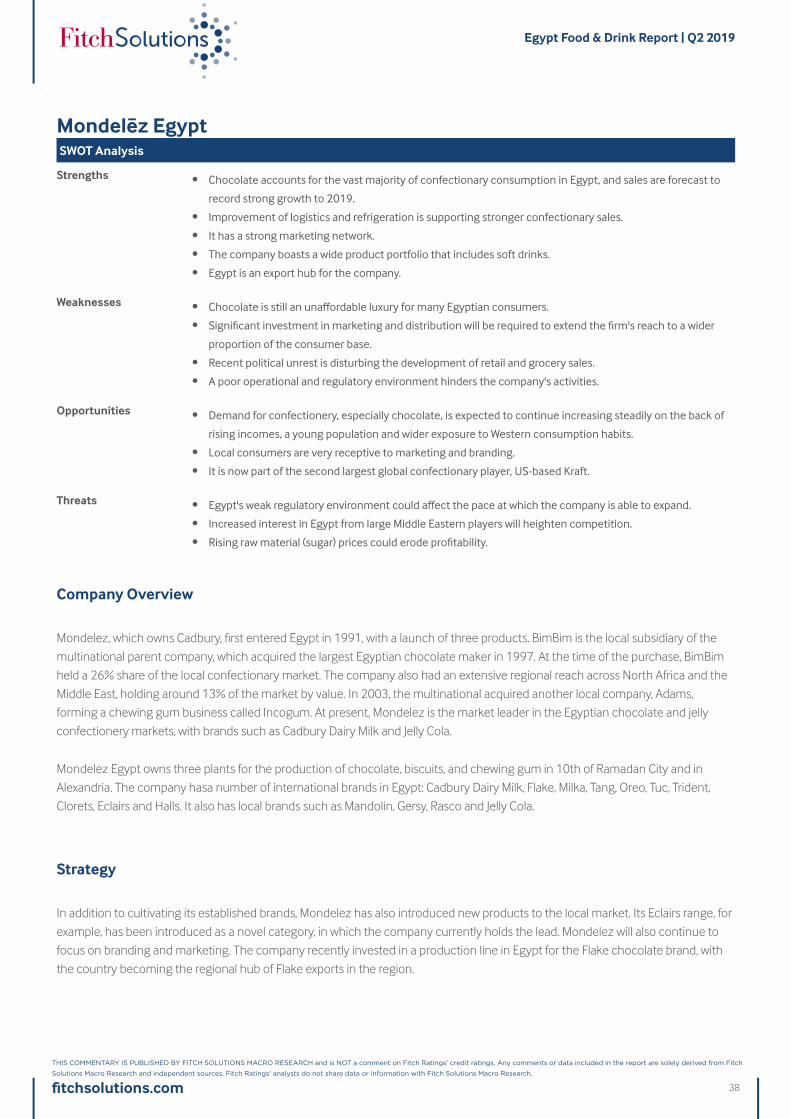
Mondelēz EgyptSWOT Analysis
Strengths • Chocolate accounts for the vast majority of confectionary consumption in Egypt, and sales are forecast to
record strong growth to 2019.
• Improvement of logistics and refrigeration is supporting stronger confectionary sales.
• It has a strong marketing network.
• The company boasts a wide product portfolio that includes soft drinks.
• Egypt is an export hub for the company.
Weaknesses • Chocolate is still an unaffordable luxury for many Egyptian consumers.
• Significant investment in marketing and distribution will be required to extend the firm's reach to a wider
proportion of the consumer base.
• Recent political unrest is disturbing the development of retail and grocery sales.
• A poor operational and regulatory environment hinders the company's activities.
Opportunities • Demand for confectionery, especially chocolate, is expected to continue increasing steadily on the back of
rising incomes, a young population and wider exposure to Western consumption habits.
• Local consumers are very receptive to marketing and branding.
• It is now part of the second largest global confectionary player, US-based Kraft.
Threats • Egypt's weak regulatory environment could affect the pace at which the company is able to expand.
• Increased interest in Egypt from large Middle Eastern players will heighten competition.
• Rising raw material (sugar) prices could erode profitability.
Company Overview
Mondelez, which owns Cadbury, first entered Egypt in 1991, with a launch of three products. BimBim is the local subsidiary of the
multinational parent company, which acquired the largest Egyptian chocolate maker in 1997. At the time of the purchase, BimBim
held a 26% share of the local confectionary market. The company also had an extensive regional reach across North Africa and the
Middle East, holding around 13% of the market by value. In 2003, the multinational acquired another local company, Adams,
forming a chewing gum business called Incogum. At present, Mondelez is the market leader in the Egyptian chocolate and jelly
confectionery markets, with brands such as Cadbury Dairy Milk and Jelly Cola.
Mondelez Egypt owns three plants for the production of chocolate, biscuits, and chewing gum in 10th of Ramadan City and in
Alexandria. The company hasa number of international brands in Egypt: Cadbury Dairy Milk, Flake, Milka, Tang, Oreo, Tuc, Trident,
Clorets, Eclairs and Halls. It also has local brands such as Mandolin, Gersy, Rasco and Jelly Cola.
Strategy
In addition to cultivating its established brands, Mondelez has also introduced new products to the local market. Its Eclairs range, for
example, has been introduced as a novel category, in which the company currently holds the lead. Mondelez will also continue to
focus on branding and marketing. The company recently invested in a production line in Egypt for the Flake chocolate brand, with
the country becoming the regional hub of Flake exports in the region.
Egypt Food & Drink Report | Q2 2019
fitchsolutions.com
THIS COMMENTARY IS PUBLISHED BY FITCH SOLUTIONS MACRO RESEARCH and is NOT a comment on Fitch Ratings' credit ratings. Any comments or data included in the report are solely derived from Fitch
Solutions Macro Research and independent sources. Fitch Ratings' analysts do not share data or information with Fitch Solutions Macro Research.
38
Recent Developments
2016
Mondelez Egypt Foods reached sales worth USD1.4bn during the first nine months of 2016. The company’s regional director for
Egypt and North Africa, Bilal Sharbatly, said that Mondelez acquired more than 40% of the market volume, which amounts to
EGP3.5bn.
2015
In May 2015, Mondelēz Egypt Foods opened a new production line for Marvelous Creations Chocolate, a Cadbury innovation. Bassil
Abul Ata, chief executive officer and managing director of Mondelēz Egypt and Levant, said: 'So far we have invested nearly
EGP200mn in the establishment of new production lines in Egypt so that we can offer outstanding products such as Marvelous
Creations to the Egyptian and regional consumer. We have trained about 125 workers on the latest production methods, working
on transferring production technology from abroad into the domestic market. It is expected that Marvelous Creations will increase
the company's chocolate exports in 2015, for Egypt is the export hub for more than 20 countries in the region.'
Egypt Food & Drink Report | Q2 2019
fitchsolutions.com
THIS COMMENTARY IS PUBLISHED BY FITCH SOLUTIONS MACRO RESEARCH and is NOT a comment on Fitch Ratings' credit ratings. Any comments or data included in the report are solely derived from Fitch
Solutions Macro Research and independent sources. Fitch Ratings' analysts do not share data or information with Fitch Solutions Macro Research.
39
Cairo Poultry CompanySWOT Analysis
Strengths • It is the exclusive supplier to fast-food restaurants such as KFC, Pizza Hut, McDonald's and Burger King, and
to a range of high-end hotels, such as Marriott.
• It is one of Egypt's leading poultry companies by sales.
• There is promising export exposure to the wider Middle East region.
• Vertical integration allows for lower operational costs.
Weaknesses • Consumer purchasing power is low.
• The mass grocery retail network is underdeveloped.
• CPC has had to invest considerably in recent years in a new processing plant and in a print and television
media campaign to convince consumers that eating frozen chicken poses no health risks.
Opportunities • The demand for processed meat is expected to continue rising steadily on the back of rising incomes and
wider exposure to Western consumption habits.
• Continued growth in Egypt's and the region's food services industry will increase the demand for CPC's
poultry range.
Threats • Many consumers remain cautious of processed meats.
• Egypt's weak regulatory environment could affect the pace of expansion.
• Bird flu is an ongoing threat.
Company Overview
Established in 1977, Cairo Poultry Company (CPC) is Egypt's leading poultry producer and specialises in two main areas: poultry
operations (including around 350 broiler and 200 breeder houses) and poultry feed. The company is listed on the Cairo stock
exchange. CPC is a subsidiary of the Kuwait Food Company (Americana), which operates through 14 subsidiaries (including New
Cairo Poultry Company, Cairo Feed Company and Cairo Broilers Company). It is involved in the production of poultry compound feed
and concentrates, the production of broilers (chickens for roasting), chicken processing (including slaughtering and freezing), and
other value-added processed product ranges. It currently has two production facilities in the country. Export markets include the
UAE, Kuwait, Bahrain, Qatar, Oman and Saudi Arabia.
Strategy
The company has invested in the expansion of its production facilities. In one of the latest developments on this front, in October
2012, CPC approved the creation of a new poultry feed plant in Nubaria (northern Egypt). The investment of EGP170mn will
reportedly lead to annual production volumes of around 650,000 tonnes.
Financial Data
Sales
• 2017: EGP4.3bn
• 2016: EGP2.65bn
• 2015: EGP2.26bn
Egypt Food & Drink Report | Q2 2019
fitchsolutions.com
THIS COMMENTARY IS PUBLISHED BY FITCH SOLUTIONS MACRO RESEARCH and is NOT a comment on Fitch Ratings' credit ratings. Any comments or data included in the report are solely derived from Fitch
Solutions Macro Research and independent sources. Fitch Ratings' analysts do not share data or information with Fitch Solutions Macro Research.
40
• 2014: EGP2.27bn
Profit
• 2017: EGP364mn
• 2016: EGP263mn
• 2014: EGP170mn
Egypt Food & Drink Report | Q2 2019
fitchsolutions.com
THIS COMMENTARY IS PUBLISHED BY FITCH SOLUTIONS MACRO RESEARCH and is NOT a comment on Fitch Ratings' credit ratings. Any comments or data included in the report are solely derived from Fitch
Solutions Macro Research and independent sources. Fitch Ratings' analysts do not share data or information with Fitch Solutions Macro Research.
41
Coca-Cola EgyptSWOT Analysis
Strengths • It is one of the two leading soft drinks companies in Egypt.
• Its product portfolio is strong and supported by extensive marketing campaigns.
• The company has successfully targeted younger generations.
• It is backed by a powerful parent company.
• Soft drinks benefit from the weak alcoholic drinks segment in Egypt.
Weaknesses • Much of the population has low purchasing power.
• Non-carbonates are disadvantaged by their relatively high prices.
• The underdeveloped mass grocery retail network hinders access to novel products.
• PepsiCo is still the dominant force in Egyptian soft drinks.
Opportunities • There is an increased interest in healthier alternatives to sugary carbonates.
• Economic development will increase consumer purchasing power.
• Consumers are increasingly brand-conscious.
• Significant recent investment will produce production facilities for both domestic consumption and exports.
Threats • PepsiCo provides strong competition and invests heavily in marketing and promotion.
• Its name was tarnished by the court case over property ownership and expropriation.
• Traditional carbonates face increasing pressure over their negative impact on health.
• Political instability could continue to weaken consumer and investor sentiment.
Company Overview
Coca-Cola is one of the two key players in the Egyptian soft drinks sector, alongside PepsiCo. Both have strong brands and
portfolios, supported by targeted advertising campaigns. Coca-Cola has also increased its focus on healthier alternatives, through
launches of products such as Coke Zero.
Cola-Cola has a long history of operations in Egypt, which were particularly expanded in the 1950s through an increased
collaboration with the local licensed bottler. In 1994, ENBC was acquired by Coca-Cola for USD142mn, which subsequently
renamed it The Coca-Cola Bottling Company of Egypt (TCCBCE). Coca-Cola has nine local bottling plants and some 30 sales and
distribution centres. Having expanded very quickly, the company has also outsourced its call centre. TCCBCE has a strong
relationship with Symantec Corporation, which provides data protection solutions.
Strategy
The company aims to maintain and strengthen its portfolio, as well as to cut costs. Coca-Cola is present in the mineral water
industry in Egypt, which is expected to provide a longer-term boost to its revenues and brand awareness. The company also
supports various community programmes, such as the provision of safe drinking water in the Egyptian governorate of Beni Suef,
which was organised in 2010 as part of the Replenish Africa Initiative funded by The Coca-Cola Africa Foundation.
Egypt Food & Drink Report | Q2 2019
fitchsolutions.com
THIS COMMENTARY IS PUBLISHED BY FITCH SOLUTIONS MACRO RESEARCH and is NOT a comment on Fitch Ratings' credit ratings. Any comments or data included in the report are solely derived from Fitch
Solutions Macro Research and independent sources. Fitch Ratings' analysts do not share data or information with Fitch Solutions Macro Research.
42
Recent Developments
2016
In July 2016, Coca-Cola announced that it will invest USD500mn in Egypt over the following three years. Such investment is aimed
at increasing domestic consumption and developing its Egyptian operations as a regional export hub. Coca-Cola's plan includes
launching a bottling plant in 6th of October City and expanding the concentrates plant in the Free Zone in Nasr City.
Financial Data
• Estimated annual sales: USD500mn
Egypt Food & Drink Report | Q2 2019
fitchsolutions.com
THIS COMMENTARY IS PUBLISHED BY FITCH SOLUTIONS MACRO RESEARCH and is NOT a comment on Fitch Ratings' credit ratings. Any comments or data included in the report are solely derived from Fitch
Solutions Macro Research and independent sources. Fitch Ratings' analysts do not share data or information with Fitch Solutions Macro Research.
43
PepsiCo EgyptSWOT Analysis
Strengths • It is one of Egypt's leading soft drinks companies.
• Pepsi has a wide product portfolio, with carbonates as top sellers.
• The company has successfully targeted younger generations.
• It is backed by a powerful parent company.
• Soft drinks benefit from the weak alcoholic drinks industry in Egypt.
Weaknesses • Much of the population has low purchasing power.
• Non-carbonates are disadvantaged by their relatively high prices.
• The underdeveloped mass grocery retail network hinders access to novel products.
Opportunities • There is an increased interest in healthier alternatives to sugary carbonates.
• Economic development will increase consumer purchasing power.
• Targeted marketing campaigns will ensure that new Pepsi products will place well.
• The company has recently entered the promising dairy market.
• It has large investment plans over the next several years.
Threats • Coca-Cola provides strong competition and has a much stronger regional presence than in the past.
• Political instability could continue to negatively impact consumer sentiment, as well as profitability, due to
disruptions to trading and logistical operations.
Company Overview
Pepsi has a strong reputation and presence in Egypt and is one of the leaders in establishing global-level food safety standards. The
company is associated with youth; its partnership with Vodafone and sponsorship of football form part of its focused advertising to
this demographic group. Pepsi's local operations bottle Mirinda, 7Up and Mountain Dew across seven plants in the country.
Distribution is undertaken through a network of 24 warehouses.
Strategy
Pepsi is likely to continue focusing on new product development and advertising, especially to select demographic groups. Rising
health-consciousness has led the company to launch a zero-calorie Pepsi Max product.
To demonstrate the importance the company attaches to Egypt, Pepsi revealed that the AMENA (Asia, Middle East and North Africa)
region brings in 10% of global revenues, which equates to around USD6.3bn. Of these regions, Egypt was cited as one of the top
seven focus markets, along with India, China, Egypt, Saudi Arabia, Australia and Pakistan.
Recent Developments
2018
Pepsico Egypt announced in October 2018 plans to pump new investments worth USD515mn during the upcoming four years, and
allocate more than USD16mn to develop production lines in the beverages sector to promote its operations in Egypt. The Chairman
of Pepsico, Mohamed Shelbaya, announced that the volume of the company’s investment in Egypt over the last four years from
Egypt Food & Drink Report | Q2 2019
fitchsolutions.com
THIS COMMENTARY IS PUBLISHED BY FITCH SOLUTIONS MACRO RESEARCH and is NOT a comment on Fitch Ratings' credit ratings. Any comments or data included in the report are solely derived from Fitch
Solutions Macro Research and independent sources. Fitch Ratings' analysts do not share data or information with Fitch Solutions Macro Research.
44
2014 till 2017 had amounted to USD606mn.
2017
The investments that PepsiCo has injected since FY15 have reached USD1bn, according to the company’s general manager,
Mohamed Shelbaya. According to Shelbaya, PepsiCo controls 55% of the carbonated soft drinks market in Egypt.
PepsiCo’s sales declined by 10-12% because of the high inflation rate in Egypt over H117.
2016
In October 2016, the Egyptian government seized the company's sugar stocks, forcing Pepsi to halt production in several of its lines.
2015
According to reports in May 2015, Pepsi plans to invest USD500mn in Egypt in 2015. 'Egypt is the anchor of our North African
operations and one of our most important and promising markets,' said Farid. 'We have only scratched the surface of the long-term
growth opportunities that exist for PepsiCo and our partners in Egypt and we are confident that this investment will help us
continue our momentum in the country.' The investment will be aimed at strengthening and expanding PepsiCo's operations and
production capacities. The company operates 11 manufacturing facilities throughout Egypt, has approximately 47 distribution
centres/warehouses/offices and employs 10,500 personnel in Egypt.
Financial Data
• 2014 sales (Egypt): USD1.2bn
Egypt Food & Drink Report | Q2 2019
fitchsolutions.com
THIS COMMENTARY IS PUBLISHED BY FITCH SOLUTIONS MACRO RESEARCH and is NOT a comment on Fitch Ratings' credit ratings. Any comments or data included in the report are solely derived from Fitch
Solutions Macro Research and independent sources. Fitch Ratings' analysts do not share data or information with Fitch Solutions Macro Research.
45
FaragallaSWOT Analysis
Strengths • It is one of Egypt's largest food and beverage companies.
• Its wide product portfolio covers the meat processing, dairy and fruit juice industries.
• Faragalla operates its own trading and distribution arm, Egyptco.
• The company's production facilities have received international certification.
• It is one of the main suppliers to international restaurants in Egypt, including McDonald's.
• Its export geography is wide.
Weaknesses • Faragalla will have to invest heavily to grow its brands as competition stiffens.
• Fresh foods are traditionally considered healthier than processed foods.
• Political unrest has been disturbing the growth of retail and grocery sales.
Opportunities • Its dairy and fruit juice segments should benefit from wider industry growth.
• The company has the ability to innovate.
• The continued growth of the mass grocery retail industry is likely to improve Faragalla's routes to market.
• Opportunities for export growth could strengthen over the coming years, with additional capacity already in
place.
• Financial backing from the European Bank for Reconstruction and Development will enable the company to
pursue expansion plans.
Threats • It faces increasing competition from ambitious domestic and regional rivals intent on capitalising on the size
of the Egyptian market.
• Many Egyptian consumers live below the poverty line and cannot afford the company's products.
Company Overview
Faragalla is one of Egypt's and the Middle East's leading food companies. It began operations as a bakery and meat manufacturer in
1974, but has since expanded into frozen vegetables, instant meals and canned produce. The company has manufacturing
agreements with multinationals such as Del Monte (juice production) and France-based Danone (dairy products) and has sought to
increase and modernise its production lines over the years.
Three separate food processing companies operate under the Faragalla group, encompassing 28 ISO-certified production lines.
According to local sources, Faragalla holds a 28% share of the country's juice and milk market, a position it is seeking to strengthen
with additional homogenised and sterilised products, in collaboration with TetraPak. Faragalla's leading juice brands include
Faragello, Faragello Gold, Yahoo! and Sabaho.
Strategy
The company has sought to maintain its market position by constantly re-evaluating and updating its product range and extending
its production capacity whenever suitable opportunities arise. It has differentiated itself from potential multinational market entrants
by showing a high degree of sensitivity to the needs of Egyptian consumers. It rebranded its entire Faragello range, despite keeping
the company name of Faragalla, in order to appease consumers who felt uneasy disposing of packages branded with the word 'alla'.
Faragalla was among the first manufacturers to respond to consumer concerns about the nutritional content of packaged foods,
doing so by emphasising the health benefits of its food on its packaging. This is likely to remain the company's best opportunity,
with issues surrounding food health and hygiene at the top of consumers' agendas owing to bird flu outbreaks.
Egypt Food & Drink Report | Q2 2019
fitchsolutions.com
THIS COMMENTARY IS PUBLISHED BY FITCH SOLUTIONS MACRO RESEARCH and is NOT a comment on Fitch Ratings' credit ratings. Any comments or data included in the report are solely derived from Fitch
Solutions Macro Research and independent sources. Fitch Ratings' analysts do not share data or information with Fitch Solutions Macro Research.
46
According to an announcement made by Faragalla's Chairman Mohamed Farag Amer in June 2015, the group's total investments in
Egypt were worth USD1.3bn. He noted that the group was seeking to increase market share by providing new products to the local
market. This led to investments worth EGP2bn over 2016/17 to establish three new factories, including a factory for the production
of sauce in metal containers and a juice factory in glass containers, besides a new factory for packaging (Tetra Pak) and the
development of a frozen-vegetable factory.
Recent Developments
2017
Faragalla is targeting USD70mn worth of exports by the end of 2017. 'The volume of exports from the beginning of 2017 to August
reached USD45mn, while the company targets USD70mn by the end of the year, growth of 35% compared to last year,' said
Mohamed Abd El Sabour, the company’s export manager.
2016
In 2016, the company planned to expand its production of tomatoes, frozen vegetables and milk, following around USD200mn in
investment during 2015.
2015
The European Bank for Reconstruction and Development announced in November 2015 that it will be providing Faragalla with a
long-term EGP200mn loan. The loan will be used partially to refinance existing short-term debt and also to finance working capital
requirements. The purpose of the loan is to facilitate Faragalla's goal to capture a bigger share of the local market, which is growing,
and to support export capabilities.
Egypt Food & Drink Report | Q2 2019
fitchsolutions.com
THIS COMMENTARY IS PUBLISHED BY FITCH SOLUTIONS MACRO RESEARCH and is NOT a comment on Fitch Ratings' credit ratings. Any comments or data included in the report are solely derived from Fitch
Solutions Macro Research and independent sources. Fitch Ratings' analysts do not share data or information with Fitch Solutions Macro Research.
47
Juhayna Food IndustriesSWOT Analysis
Strengths • It is one of the leading dairy companies in Egypt, and is also a major juice manufacturer.
• There is a steadily rising demand for dairy products.
• Considerable investment in capacity expansion has been made in recent years.
• The company benefits from a strong brand following.
Weaknesses • Consumers have low purchasing power.
• The mass grocery retail network is underdeveloped.
• There is strong competition from Gulf companies in the dairy and juice industries.
Opportunities • The demand for dairy and non-traditional soft drinks is expected to continue rising steadily on the back of
rising incomes and wider exposure to Western consumption habits.
• Continued growth in Egypt's and the region's food services industry will increase the demand for the
company's dairy and juice products.
• Expanding and more aspirational middle classes are providing a solid growth platform.
• A joint venture with Arla Foods could strengthen the company's market position.
Threats • Egypt's weak regulatory environment could affect the pace at which the company is able to expand.
• The uneasy political situation negatively impacts the company's bottom line.
• Multinationals show strong interest in Egypt's food and drink sectors.
• Fluctuations in raw material costs could affect company's profits.
Company Overview
Juhayna Food Industries, also a leading juice manufacturer, is a key player in the Egyptian dairy industry. The conglomerate operates
seven facilities in Egypt. Juhayna has leading companies such as EgyptAir and Air France, as well as leading restaurant chains and
luxury hotels in the country, as its clients.
Strategy
We believe that Egyptian companies such as Juhayna will be more resilient to political instability than some of the multinationals
present in the country, which up until early 2011 saw Egypt as a genuinely exciting prospect. The big companies will not abandon
their investments and are likely to continue to regard Egypt as a long-term growth opportunity.
Consumption of both juice and dairy is likely to increase over the next few years. Juhayna is strongly placed in both sectors. It has a
wide and segmented product range, and a turnover base, which will allow it to be one of the domestic companies playing a lead role
in the development of the food and drink industry. Juhayna holds a particularly strong position in packaged dairy, with a market
share of about 65%, according to al-Borsa. Recent market studies indicate that Juhayna enjoys a level of brand awareness that is
significantly more pronounced than its leading competitors on the Egyptian market. Fears over food safety and industry
modernisation have boosted the development of the packaged food sector in Egypt, which is expected to continue to grow in the
coming years.
Egypt Food & Drink Report | Q2 2019
fitchsolutions.com
THIS COMMENTARY IS PUBLISHED BY FITCH SOLUTIONS MACRO RESEARCH and is NOT a comment on Fitch Ratings' credit ratings. Any comments or data included in the report are solely derived from Fitch
Solutions Macro Research and independent sources. Fitch Ratings' analysts do not share data or information with Fitch Solutions Macro Research.
48
Recent Developments
2018
Juhayna Food Industries’ consolidated revenues increased 22% to reach EGP3.48bn, marking a net profit of EGP240mn. Standalone
profit came in at EGP84.68mn, compared to EGP75.63mn during the same half of 2017, an 11.97% increase. The company
attributed the increase to the improvement in consumer purchasing power, and measures Juhayna took such as optimizing sales,
while improving the efficiency and productivity of the whole company.
2017
Juhayna reported an increase of 268% y-o-y in consolidated profits for 2017 due to higher revenues driven by the inflationary
environment. Food manufacturers’ earnings have proved relatively resilient due to food being an essential good. Net profit hit EGP
197.7m in 2017, up from EGP 53.6m a year prior, the company highlighted in a filing to the Egyptian Exchange. Revenues climbed
to EGP 6.06bn in 2017, versus EGP 4.9bn in 2016.
On the other hand, standalone profits declined to EGP 142.5m in 2017 from EGP 200.3m the year before, as manufacturers – bulk
importers of commodities such as wheat, milk powder and corn – raised prices by 80-90% in 2017, prompting a year-on-year
decline in volume sales.
2016
In December, the company planned to start manufacturing products of Denmark-based Arla Foods. Production will take place in
Juhayna's factory in 6th of October City, with the products destined for both Egyptian and foreign markets.
2015
Juhayna posted a 64% y-o-y increase in net profit for the nine months ended September 2015, recording net profits of EGP8.2mn.
The growth in net profit was driven by higher sales in the yoghurt and juice segments as well as a lower effective income tax rate.
In mid-2015, Denmark-based dairy cooperative Arla Foods formed a joint venture (JV) with Juhayna for dairy product sales in Egypt.
The JV will add cheese, butter and infant formula to Juhayna's current product portfolio, including UHT milk, yoghurt and juice. The
new venture, which will initially employ around 50 people, plans to increase the number of employees to more than 100 over the
next two years, with sales operations beginning in October 2015. Juhayna will own a 51% stake in the JV, with the remaining 49%
owned by Arla.
In January 2015, the company announced its consolidated results for 2014, reporting a 12% rise in total consolidated revenue to
EGP3.7bn. Net income declined by 48% to EGP170mn, while the company's net profit margin declined by 5 percentage points to
4.6%.
Egypt Food & Drink Report | Q2 2019
fitchsolutions.com
THIS COMMENTARY IS PUBLISHED BY FITCH SOLUTIONS MACRO RESEARCH and is NOT a comment on Fitch Ratings' credit ratings. Any comments or data included in the report are solely derived from Fitch
Solutions Macro Research and independent sources. Fitch Ratings' analysts do not share data or information with Fitch Solutions Macro Research.
49
Financial Data
Sales
• 2017: EGP6.06bn
• 2016: EGP4.99bn
• 2015: EGP4.23bn
• 2014: EGP3.68bn
• 2013: EGP3.29bn
Egypt Food & Drink Report | Q2 2019
fitchsolutions.com
THIS COMMENTARY IS PUBLISHED BY FITCH SOLUTIONS MACRO RESEARCH and is NOT a comment on Fitch Ratings' credit ratings. Any comments or data included in the report are solely derived from Fitch
Solutions Macro Research and independent sources. Fitch Ratings' analysts do not share data or information with Fitch Solutions Macro Research.
50
Majid Al Futtaim (Carrefour)SWOT Analysis
Strengths • MAF has a strong brand name in the Carrefour franchise.
• It is the sole franchisee of the Carrefour brand, with a contract until 2025.
• The company's operations in 15 countries across the Middle East and North Africa mean that the company
is relatively well diversified.
• MAF stocks more than 55,000 products and has many in-store value-added offerings.
• It is planning a major expansion of its operations in Egypt over the next five years.
Weaknesses • Significant capital expenditure will be required for MAF to realise the potential of Egypt's fledgling mass
grocery retail industry.
• Recent political unrest is disturbing the development of retail.
• Many customers are unable to access modern mass grocery retail outlets.
• Densely populated urban areas limit hypermarket expansion in key cities.
Opportunities • Hypermarket and supermarket sales are forecast to grow dynamically over the coming years.
• Its renowned private-label range is popular with price-conscious consumers.
• Recent health and hygiene scares have led more Egyptians to convert to modern retail formats.
• Significant investment in expansion could further strengthen the company's position in Egypt.
Threats • Car ownership in Egypt is still quite low, meaning that Carrefour's hypermarkets remain inaccessible to many
consumers.
• The potential of the Egyptian mass grocery retail sector means that multinationals are likely to enter in the
near future.
• Although it is improving, Egypt's bureaucratic regulatory environment has the potential to slow expansion.
• The entrance of the LuLu retail group into Egypt will increase competition in the mass grocery retail sector.
Company Overview
Originally conceived as a joint venture, Carrefour's partnership with Majid Al Futtaim (MAF) was aimed at expanding its presence
across the high-growth Middle East and North Africa region. MAF is now the sole owner of the Carrefour franchise in the Middle
Eastern region, having bought the France-based company's 25% stake for EUR530mn. MAF Carrefour has grown to nearly 160
stores across the hypermarket and supermarket formats. The company currently offers more than 55,000 products in Egypt,
including grocery, personal care and hardware items.
Strategy
MAF/Carrefour has fundamentally altered Egypt's mass grocery retail landscape by introducing its 'one-stop shop' hypermarket
model. MAF's strategy for the Middle East region has been to drive modernisation and create demand for its brand, rather than delay
market entry until modernisation occurs. The company has tapped into a small but constantly expanding middle class, which has
been enough to sustain it. As this middle class and overall demand for Western goods has grown, Carrefour has been able to expand
its store network. Carrefour's strategy is also to diversify its in-store offering, providing toy corners, games areas and a wider variety
of international products in order to set itself apart from local rivals. Under the new agreement, MAF will retain a franchise
agreement with Carrefour until 2025, so the stores will retain the popular Carrefour banner at least until then.
MAF was looking to expand its footprint in the region and purchase Mansour Group's Metro network of supermarkets in Egypt for a
reported USD300mn. However, the acquisition was not completed and MAF has since prioritised other MENA markets, as
Egypt Food & Drink Report | Q2 2019
fitchsolutions.com
THIS COMMENTARY IS PUBLISHED BY FITCH SOLUTIONS MACRO RESEARCH and is NOT a comment on Fitch Ratings' credit ratings. Any comments or data included in the report are solely derived from Fitch
Solutions Macro Research and independent sources. Fitch Ratings' analysts do not share data or information with Fitch Solutions Macro Research.
51
highlighted by the USD500mn purchase of Retail Arabia in June 2017. Retail Arabia operates the Geant supermarket chain in the
UAE, Kuwait and Bahrain.
Recent Developments
2018
MAF plans to expand its franchise Carrefour stores in Egypt, adding 100 new stores to the 37 stores it already operates in in the
country. Majid Al Futtaim signed an agreement with Egypt’s Ministry of Investment and International Cooperation and the National
Service Projects Organization as part of the deal.
Announcing its FY17 results, MAF said currency devaluation in Egypt has impacted its EBITDA, which reached AED4.2bn (USD1.1bn),
while revenue grew 8% to AED33.2bn (USD9bn). At constant foreign exchange rates, group revenue would have grown by 14% and
EBITDA by 5%, the firm added. While the Egyptian pound has lost nearly half of its value since the currency was devalued in
November 2016, structural reforms that are taking place in the country are starting to bear fruit, boosting economic growth and
prospects for improved performance in Egypt for the company in 2018.
2017
In June, MAF purchased Retail Arabia for USD500mn.
2015
In March, the company said it would increase its planned investments in Egypt by EGP4.5bn (USD590mn). In a memorandum of
understanding signed with Egypt's government at an international economic conference, MAF said the projects would add to the
existing EGP18bn five-year plan to invest in Egypt. This investment plan includes establishing the City Centre Almaza with EGP3.5bn,
developing the Mall of Egypt with investments of EGP5bn and expanding the Carrefour hypermarkets and supermarkets network to
55 outlets by the end of 2019.
Financial Data
2016
• Sales: EGP4.92bn (Egypt only)
Egypt Food & Drink Report | Q2 2019
fitchsolutions.com
THIS COMMENTARY IS PUBLISHED BY FITCH SOLUTIONS MACRO RESEARCH and is NOT a comment on Fitch Ratings' credit ratings. Any comments or data included in the report are solely derived from Fitch
Solutions Macro Research and independent sources. Fitch Ratings' analysts do not share data or information with Fitch Solutions Macro Research.
52
Metro (Mansour Group)SWOT Analysis
Strengths • Metro is one of the largest organised retailers in Egypt, with a store network spread across major cities.
• It is present in both supermarkets and discount stores, making it accessible to a wider range of consumers
than its rivals.
• 24-7 store hours allow the retailer to benefit from growing demand for convenience.
Weaknesses • The company will have to continue investing heavily in store openings to increase sales and brand
recognition, particularly as investment by foreign retailers intensifies.
• Consumer weakness is disturbing the growth of retail sales across the sector.
Opportunities • With the largest store presence, Metro is well placed to capitalise on the steady emergence of formal grocery
retailing.
• Metro's Kheer Zaman discount store network is well placed to benefit from the growing demand for discount
retailing, particularly in low-income urban neighbourhoods.
• Egyptian consumers react favourably to value-added in-store offerings.
Threats • The continuing price-consciousness of consumers will lower the potential of high margin and premium
products.
• Competition from Majid Al Futtaim (MAF)'s Carrefour hypermarkets could mean the loss of a number of
Metro's supermarket consumers.
• Takeover talks with MAF are currently ongoing.
• The entrance of the LuLu retail group in Egypt will increase competition in the mass grocery retail sector.
Company Overview
Metro is one of Egypt's largest grocery retailers, with 66 stores spread across 15 cities. Every Metro store is open 24 hours a day, as
the concept was created to meet the growing demand for convenience retail. Metro is rumoured to be a takeover target of UAE-
based Majid Al Futtaim (MAF), which has recently acquired full control of its MENA joint venture with Carrefour and is likely to solidify
its regional presence.
Strategy
Metro is set to continue opening new stores to grow turnover. In addition, the company aims to boost same-store sales by
improving its value-for-money offerings and increasing price competitiveness - techniques that have proved effective. Metro has
been making an effort to cater to consumers' taste for value-added in-store offerings. It is also responding to the strong demand for
convenience by offering a home-delivery service for goods ordered over the phone. Finally, a relatively new aspect of Metro's
strategy is the diversification of its store offering. New stores will adopt cost-cutting techniques to keep prices low, and will also be
smaller than standard Metro stores.
Egypt Food & Drink Report | Q2 2019
fitchsolutions.com
THIS COMMENTARY IS PUBLISHED BY FITCH SOLUTIONS MACRO RESEARCH and is NOT a comment on Fitch Ratings' credit ratings. Any comments or data included in the report are solely derived from Fitch
Solutions Macro Research and independent sources. Fitch Ratings' analysts do not share data or information with Fitch Solutions Macro Research.
53
Recent Developments
2014
In January, MAF announced that it expected to purchase Metro in Q114, reportedly at a cost of USD200-300mn. The deal was not
completed and MAF began to prioritise other MENA markets.
Financial Data
• Estimated annual sales: EGP2,697mn (USD152mn)
Egypt Food & Drink Report | Q2 2019
fitchsolutions.com
THIS COMMENTARY IS PUBLISHED BY FITCH SOLUTIONS MACRO RESEARCH and is NOT a comment on Fitch Ratings' credit ratings. Any comments or data included in the report are solely derived from Fitch
Solutions Macro Research and independent sources. Fitch Ratings' analysts do not share data or information with Fitch Solutions Macro Research.
54
Spinneys GroupSWOT Analysis
Strengths • It is one of the leading mass grocery retail operators in Egypt and regionally.
• A wide range of products is on offer, including private-label goods.
• The company is expected to remain committed to Egypt.
• It has focused marketing and advertising campaigns.
Weaknesses • Significant capital expenditure is required for expansion.
• Its premium nature may impact on growth in the short term, due to moderate economic growth.
• Many customers are unable to access modern mass grocery retail outlets.
Opportunities • Hypermarket and supermarket sales are growing on the back of changing economic and demographic
conditions.
• Recent health and hygiene scares have led more Egyptians to convert to modern retail formats, which offer
cleaner shopping environments.
Threats • Car ownership in Egypt is still quite low, so hypermarkets remain inaccessible to many consumers.
• Although it is improving, Egypt's bureaucratic regulatory environment has the potential to slow expansion.
• MAF in particular continues to pose a major competitive threat.
• The company could sell assets in certain non-core markets.
• The entrance of the LuLu retail group into Egypt, with further expansion plans, will increase competition in
the mass grocery retail sector.
Company Overview
Spinneys is the leading premium supermarket retailer in the Middle East, having entered the Egyptian market in 2007. The retailer,
owned by UAE-based private equity firm The Abraaj Group, has an impressive range of own-label products, encompassing both
grocery (including rice and sugar) and non-grocery items. Spinneys is a growing force regionally, with an expanding presence in the
Middle East and North Africa region (Jordan, Lebanon, the UAE and Qatar). It is also present through franchise agreements in some
markets.
Strategy
The potential for new store openings remains in place, although the retailer is likely to focus on the existing stores and product
ranges in the shorter term. The private-label offering (under Spinneys and Spinneys Basic brands) is expected to be boosted by
rising food prices, which may lead Spinneys to expand the already extensive range of products. Spinneys has said that it is actively
seeking new development opportunities throughout the Levant and Southern Asia.
The company's growth strategy in Egypt is focused on reaching shoppers in urban areas with new, smaller formats, such as
supermarkets, while also offering fresh innovations in its core hypermarket stores. 'Our growth plan looks different today than it did
a few years back, driven by shoppers' expectations for convenience and high service levels,' said the company's CEO Mohanad Adly.
'The smaller supermarket format offers an exceptional quick-trip shopping experience to meet those needs for consumers who are
becoming busier every day.' The company has committed to a total investment worth EGP500mn in the Egyptian market until
2019, Adly highlighted. The chain is planning to double the number of its branches in Egypt to 24 branches over this period.
Egypt Food & Drink Report | Q2 2019
fitchsolutions.com
THIS COMMENTARY IS PUBLISHED BY FITCH SOLUTIONS MACRO RESEARCH and is NOT a comment on Fitch Ratings' credit ratings. Any comments or data included in the report are solely derived from Fitch
Solutions Macro Research and independent sources. Fitch Ratings' analysts do not share data or information with Fitch Solutions Macro Research.
55
Recent Developments
2018
According to Bloomberg reports, Portugal-based retailer Sonae is in discussions to acquire Spinneys operations in Egypt from the
The Abraaj Group. Any deal is likely to include a local partner.
In December 2018, Spinney's opened two new stores in Egypt, including a new multi-million-pound branch in El Shorouk city.
According to Spinneys CEO, Mohanad Adly, "the new store in Shorouk reflects our ongoing commitment to the Egyptian market.
Over the last four years, we successfully quadrupled the number of operating stores in the Egyptian market and in 2019, we will
continue to introduce Spinneys to as many Egyptian consumers as we possibly can.”
2017
Spinneys opened its first store in the Upper Egypt region in February 2017. The store is located in the Cityscape Mall.
2016
Throughout 2016, Spinneys opened four new supermarkets in Egypt. Currently, the retailer has a total of 10 outlets in the country.
In 2017, the company plans to launch five additional stores across Egypt.
2015
On September 18, Spinneys opened a store in Giza.
On June 12, Spinneys opened a new, 1,600sq m store in Hurghada. This was the second store opening in 2015, following the
successful launch of the Moqattam branch in Cairo.
In May, the retailer opened a new branch in Moqattam. Spinneys announced plans to open two more stores in Alexandria and New
Cairo in 2015. The CEO highlighted that the opening of the store reflects Spinneys' commitment to expanding in Egypt. The
retailer's expansion strategy is focused on reaching consumers in urban areas using supermarket formats and innovations in its
existing hypermarkets.
Financial Data
• 2016 sales: EGP1.55bn (USD10mn) (estimate)
Egypt Food & Drink Report | Q2 2019
fitchsolutions.com
THIS COMMENTARY IS PUBLISHED BY FITCH SOLUTIONS MACRO RESEARCH and is NOT a comment on Fitch Ratings' credit ratings. Any comments or data included in the report are solely derived from Fitch
Solutions Macro Research and independent sources. Fitch Ratings' analysts do not share data or information with Fitch Solutions Macro Research.
56
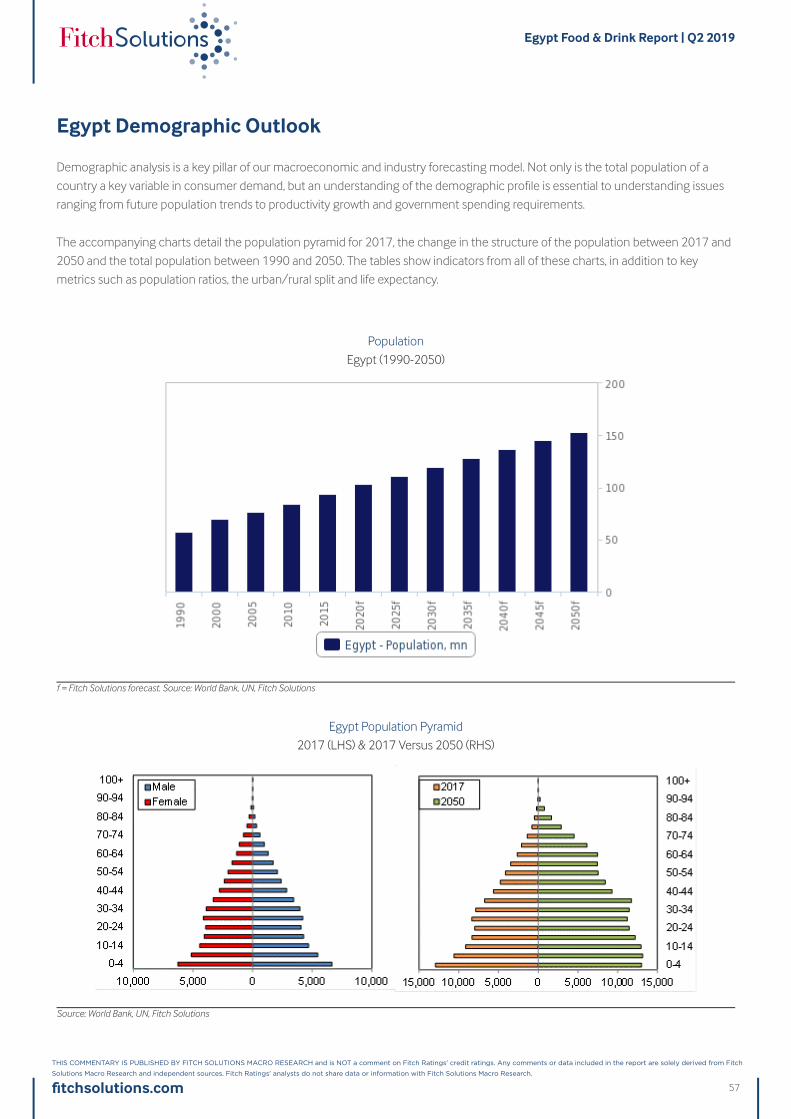
Egypt Demographic Outlook
Demographic analysis is a key pillar of our macroeconomic and industry forecasting model. Not only is the total population of a
country a key variable in consumer demand, but an understanding of the demographic profile is essential to understanding issues
ranging from future population trends to productivity growth and government spending requirements.
The accompanying charts detail the population pyramid for 2017, the change in the structure of the population between 2017 and
2050 and the total population between 1990 and 2050. The tables show indicators from all of these charts, in addition to key
metrics such as population ratios, the urban/rural split and life expectancy.
Population
Egypt (1990-2050)
f = Fitch Solutions forecast. Source: World Bank, UN, Fitch Solutions
Egypt Population Pyramid
2017 (LHS) & 2017 Versus 2050 (RHS)
Source: World Bank, UN, Fitch Solutions
Egypt Food & Drink Report | Q2 2019
fitchsolutions.com
THIS COMMENTARY IS PUBLISHED BY FITCH SOLUTIONS MACRO RESEARCH and is NOT a comment on Fitch Ratings' credit ratings. Any comments or data included in the report are solely derived from Fitch
Solutions Macro Research and independent sources. Fitch Ratings' analysts do not share data or information with Fitch Solutions Macro Research.
57
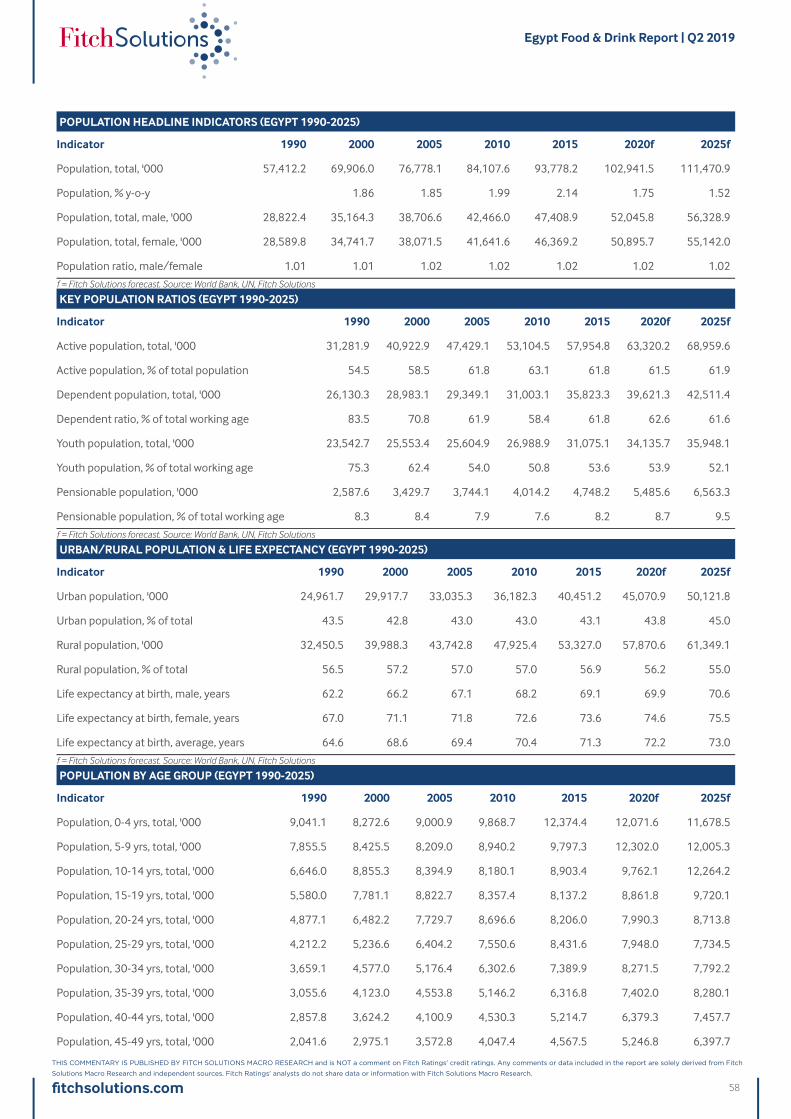
POPULATION HEADLINE INDICATORS (EGYPT 1990-2025)
Indicator 1990 2000 2005 2010 2015 2020f 2025f
Population, total, '000 57,412.2 69,906.0 76,778.1 84,107.6 93,778.2 102,941.5 111,470.9
Population, % y-o-y 1.86 1.85 1.99 2.14 1.75 1.52
Population, total, male, '000 28,822.4 35,164.3 38,706.6 42,466.0 47,408.9 52,045.8 56,328.9
Population, total, female, '000 28,589.8 34,741.7 38,071.5 41,641.6 46,369.2 50,895.7 55,142.0
Population ratio, male/female 1.01 1.01 1.02 1.02 1.02 1.02 1.02
f = Fitch Solutions forecast. Source: World Bank, UN, Fitch Solutions
KEY POPULATION RATIOS (EGYPT 1990-2025)
Indicator 1990 2000 2005 2010 2015 2020f 2025f
Active population, total, '000 31,281.9 40,922.9 47,429.1 53,104.5 57,954.8 63,320.2 68,959.6
Active population, % of total population 54.5 58.5 61.8 63.1 61.8 61.5 61.9
Dependent population, total, '000 26,130.3 28,983.1 29,349.1 31,003.1 35,823.3 39,621.3 42,511.4
Dependent ratio, % of total working age 83.5 70.8 61.9 58.4 61.8 62.6 61.6
Youth population, total, '000 23,542.7 25,553.4 25,604.9 26,988.9 31,075.1 34,135.7 35,948.1
Youth population, % of total working age 75.3 62.4 54.0 50.8 53.6 53.9 52.1
Pensionable population, '000 2,587.6 3,429.7 3,744.1 4,014.2 4,748.2 5,485.6 6,563.3
Pensionable population, % of total working age 8.3 8.4 7.9 7.6 8.2 8.7 9.5
f = Fitch Solutions forecast. Source: World Bank, UN, Fitch Solutions
URBAN/RURAL POPULATION & LIFE EXPECTANCY (EGYPT 1990-2025)
Indicator 1990 2000 2005 2010 2015 2020f 2025f
Urban population, '000 24,961.7 29,917.7 33,035.3 36,182.3 40,451.2 45,070.9 50,121.8
Urban population, % of total 43.5 42.8 43.0 43.0 43.1 43.8 45.0
Rural population, '000 32,450.5 39,988.3 43,742.8 47,925.4 53,327.0 57,870.6 61,349.1
Rural population, % of total 56.5 57.2 57.0 57.0 56.9 56.2 55.0
Life expectancy at birth, male, years 62.2 66.2 67.1 68.2 69.1 69.9 70.6
Life expectancy at birth, female, years 67.0 71.1 71.8 72.6 73.6 74.6 75.5
Life expectancy at birth, average, years 64.6 68.6 69.4 70.4 71.3 72.2 73.0
f = Fitch Solutions forecast. Source: World Bank, UN, Fitch Solutions
POPULATION BY AGE GROUP (EGYPT 1990-2025)
Indicator 1990 2000 2005 2010 2015 2020f 2025f
Population, 0-4 yrs, total, '000 9,041.1 8,272.6 9,000.9 9,868.7 12,374.4 12,071.6 11,678.5
Population, 5-9 yrs, total, '000 7,855.5 8,425.5 8,209.0 8,940.2 9,797.3 12,302.0 12,005.3
Population, 10-14 yrs, total, '000 6,646.0 8,855.3 8,394.9 8,180.1 8,903.4 9,762.1 12,264.2
Population, 15-19 yrs, total, '000 5,580.0 7,781.1 8,822.7 8,357.4 8,137.2 8,861.8 9,720.1
Population, 20-24 yrs, total, '000 4,877.1 6,482.2 7,729.7 8,696.6 8,206.0 7,990.3 8,713.8
Population, 25-29 yrs, total, '000 4,212.2 5,236.6 6,404.2 7,550.6 8,431.6 7,948.0 7,734.5
Population, 30-34 yrs, total, '000 3,659.1 4,577.0 5,176.4 6,302.6 7,389.9 8,271.5 7,792.2
Population, 35-39 yrs, total, '000 3,055.6 4,123.0 4,553.8 5,146.2 6,316.8 7,402.0 8,280.1
Population, 40-44 yrs, total, '000 2,857.8 3,624.2 4,100.9 4,530.3 5,214.7 6,379.3 7,457.7
Population, 45-49 yrs, total, '000 2,041.6 2,975.1 3,572.8 4,047.4 4,567.5 5,246.8 6,397.7
Egypt Food & Drink Report | Q2 2019
fitchsolutions.com
THIS COMMENTARY IS PUBLISHED BY FITCH SOLUTIONS MACRO RESEARCH and is NOT a comment on Fitch Ratings' credit ratings. Any comments or data included in the report are solely derived from Fitch
Solutions Macro Research and independent sources. Fitch Ratings' analysts do not share data or information with Fitch Solutions Macro Research.
58
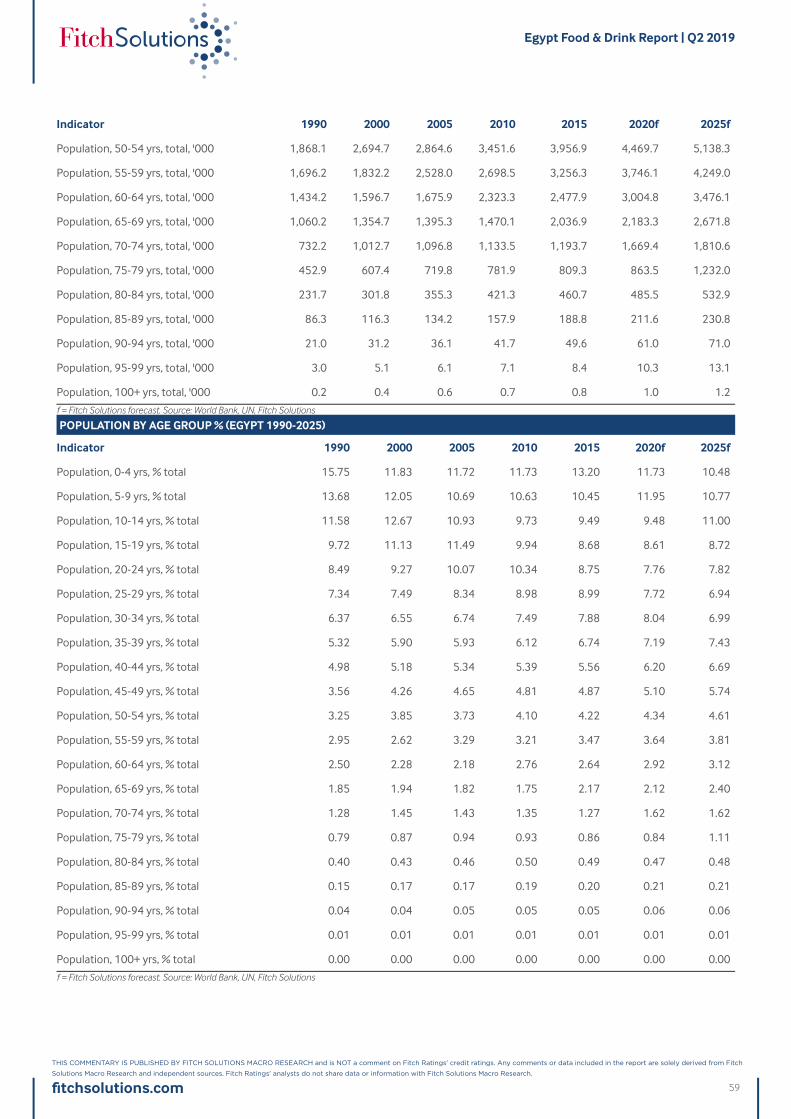
Indicator 1990 2000 2005 2010 2015 2020f 2025f
Population, 50-54 yrs, total, '000 1,868.1 2,694.7 2,864.6 3,451.6 3,956.9 4,469.7 5,138.3
Population, 55-59 yrs, total, '000 1,696.2 1,832.2 2,528.0 2,698.5 3,256.3 3,746.1 4,249.0
Population, 60-64 yrs, total, '000 1,434.2 1,596.7 1,675.9 2,323.3 2,477.9 3,004.8 3,476.1
Population, 65-69 yrs, total, '000 1,060.2 1,354.7 1,395.3 1,470.1 2,036.9 2,183.3 2,671.8
Population, 70-74 yrs, total, '000 732.2 1,012.7 1,096.8 1,133.5 1,193.7 1,669.4 1,810.6
Population, 75-79 yrs, total, '000 452.9 607.4 719.8 781.9 809.3 863.5 1,232.0
Population, 80-84 yrs, total, '000 231.7 301.8 355.3 421.3 460.7 485.5 532.9
Population, 85-89 yrs, total, '000 86.3 116.3 134.2 157.9 188.8 211.6 230.8
Population, 90-94 yrs, total, '000 21.0 31.2 36.1 41.7 49.6 61.0 71.0
Population, 95-99 yrs, total, '000 3.0 5.1 6.1 7.1 8.4 10.3 13.1
Population, 100+ yrs, total, '000 0.2 0.4 0.6 0.7 0.8 1.0 1.2
f = Fitch Solutions forecast. Source: World Bank, UN, Fitch Solutions
POPULATION BY AGE GROUP % (EGYPT 1990-2025)
Indicator 1990 2000 2005 2010 2015 2020f 2025f
Population, 0-4 yrs, % total 15.75 11.83 11.72 11.73 13.20 11.73 10.48
Population, 5-9 yrs, % total 13.68 12.05 10.69 10.63 10.45 11.95 10.77
Population, 10-14 yrs, % total 11.58 12.67 10.93 9.73 9.49 9.48 11.00
Population, 15-19 yrs, % total 9.72 11.13 11.49 9.94 8.68 8.61 8.72
Population, 20-24 yrs, % total 8.49 9.27 10.07 10.34 8.75 7.76 7.82
Population, 25-29 yrs, % total 7.34 7.49 8.34 8.98 8.99 7.72 6.94
Population, 30-34 yrs, % total 6.37 6.55 6.74 7.49 7.88 8.04 6.99
Population, 35-39 yrs, % total 5.32 5.90 5.93 6.12 6.74 7.19 7.43
Population, 40-44 yrs, % total 4.98 5.18 5.34 5.39 5.56 6.20 6.69
Population, 45-49 yrs, % total 3.56 4.26 4.65 4.81 4.87 5.10 5.74
Population, 50-54 yrs, % total 3.25 3.85 3.73 4.10 4.22 4.34 4.61
Population, 55-59 yrs, % total 2.95 2.62 3.29 3.21 3.47 3.64 3.81
Population, 60-64 yrs, % total 2.50 2.28 2.18 2.76 2.64 2.92 3.12
Population, 65-69 yrs, % total 1.85 1.94 1.82 1.75 2.17 2.12 2.40
Population, 70-74 yrs, % total 1.28 1.45 1.43 1.35 1.27 1.62 1.62
Population, 75-79 yrs, % total 0.79 0.87 0.94 0.93 0.86 0.84 1.11
Population, 80-84 yrs, % total 0.40 0.43 0.46 0.50 0.49 0.47 0.48
Population, 85-89 yrs, % total 0.15 0.17 0.17 0.19 0.20 0.21 0.21
Population, 90-94 yrs, % total 0.04 0.04 0.05 0.05 0.05 0.06 0.06
Population, 95-99 yrs, % total 0.01 0.01 0.01 0.01 0.01 0.01 0.01
Population, 100+ yrs, % total 0.00 0.00 0.00 0.00 0.00 0.00 0.00
f = Fitch Solutions forecast. Source: World Bank, UN, Fitch Solutions
Egypt Food & Drink Report | Q2 2019
fitchsolutions.com
THIS COMMENTARY IS PUBLISHED BY FITCH SOLUTIONS MACRO RESEARCH and is NOT a comment on Fitch Ratings' credit ratings. Any comments or data included in the report are solely derived from Fitch
Solutions Macro Research and independent sources. Fitch Ratings' analysts do not share data or information with Fitch Solutions Macro Research.
59
Food & Drink Glossary
Food & Drink
Food Consumption: All four food consumption indicators (food consumption in local currency, food consumption in US dollar
terms, per capita food consumption and food consumption as a percentage of GDP) relate to off-trade food and non-alcoholic
drinks consumption, unless stated in the relevant table/section.
Off-trade: Relates to an item consumed away from the premises on which it was purchased. For example, a bottle of water bought
in a supermarket would count as off-trade, while a bottle of water purchased as part of a meal in a restaurant would count as on-
trade.
Canned Food: Relates to the sale of food products preserved by canning. This is inclusive of canned meat and fish, canned ready
meals, canned desserts and canned fruits and vegetables. Volume sales are measured in tonnes as opposed to on a unit basis to
allow for cross-market comparisons.
Confectionery: Refers to retail sales of chocolate, sugar confectionery and gum products. Chocolate sales include chocolate bars
and boxed chocolates; gum sales incorporate both bubble gum and chewing gum; and sugar confectionery sales include hard-
boiled sweets, mints, jellies and medicated sweets.
Trade: In the majority of Fitch Solutions' Food & Drink reports, we use the UN Standard International Trade Classification, using
categories Food and Live Animals, Beverages and Tobacco, Animal and Vegetable Oils, Fats and Waxes and Oil-seeds and Oleaginous
Fruits. Where an alternative classification is used due to data availability, this is clearly stated.
Drinks Sales: Soft drinks sales (including carbonates, fruit juices, energy drinks, bottled water, functional beverages and ready-to-
drink tea and coffee), alcoholic drinks sales (including beer, wine and spirits) and tea and coffee sales (excluding ready-to-drink tea
and coffee products that are incorporated under Fitch Solutions' soft drinks banner) are all off-trade only, unless stated.
Mass Grocery Retail
Mass Grocery Retail: Fitch Solutions classifies mass grocery retail (MGR) as organised retail, performed by companies with a
network of modern grocery retail stores and modern distribution networks. MGR differs from independent or traditional retail, which
relates to informal, independent-owned grocery stores or traditional market retailing. MGR incorporates hypermarket, supermarket,
convenience and discount retailing, and in unique cases cooperative retailing. Where supermarkets are independently owned and
not classified as MGR, Fitch Solutions will state so clearly within the relevant report.
Hypermarket: Fitch Solutions classifies hypermarkets as retail outlets selling both groceries and a large range of general
merchandise goods (non-food items) and typically more than 2,500sq m in size. Traditionally only found on the outskirts of towns,
hypermarkets are increasingly appearing in urban locations.
Supermarket: Supermarkets are the original and still most globally prevalent form of self-service grocery retail outlet. Fitch
Solutions classifies supermarkets as more than 300sq m, up to the size of a hypermarket. The typical supermarket carries both fresh
and processed food and will stock a range of non-food items, most commonly household and beauty goods. The average
supermarket will increasingly offer some added-value services, such as dry cleaning or in-store ATMs.
Discount Stores: Although most commonly between 500sq m and 1,500sq m in size, similar to supermarkets, discount stores will
typically have a smaller floor space than their supermarket counterparts. Other distinguishing features include the prevalence of
low-priced and private label goods, an absence of added-value services, often called a no-frills environment, and a high product
Egypt Food & Drink Report | Q2 2019
fitchsolutions.com
THIS COMMENTARY IS PUBLISHED BY FITCH SOLUTIONS MACRO RESEARCH and is NOT a comment on Fitch Ratings' credit ratings. Any comments or data included in the report are solely derived from Fitch
Solutions Macro Research and independent sources. Fitch Ratings' analysts do not share data or information with Fitch Solutions Macro Research.
60
turnover rate.
Convenience Stores: Fitch Solutions' classification of convenience stores includes small outlets typically less than 300sq m in size,
with long opening hours and located in high footfall areas. These stores mainly sell fast-moving food and drink products (such as
confectionery, beverages and snack foods) and non-food items, typically stocking only two or three brand choices per item and
often carrying higher prices than other forms of grocery store.
Cooperatives: Fitch Solutions classifies cooperatives as retail stores that are independently owned but club together to form
buying groups under a cooperative arrangement, trading under the same banner, although each is privately owned. The
arrangement is similar to a franchise system, although all profits are returned to members. The term is becoming more archaic, with
fewer cooperatives remaining that conform to this model. Most cooperative groups now have a more centralised management
structure, operate more like normal supermarkets, and are thus classified as such in Fitch Solutions' reports.
Food & Drink Methodology
Fitch Solutions Food & Drink Forecasting & Sourcing
How We Generate Our Industry Forecasts
Fitch Solutions' industry forecasts are generated using the best-practice techniques of time-series modelling and causal/
econometric modelling. The precise form of model we use varies from industry to industry, in each case being determined, as per
standard practice, by the prevailing features of the industry data being examined. Fitch Solutions mainly uses OLS estimators and in
order to avoid relying on subjective views and encourage the use of objective views, Fitch Solutions uses a 'general-to-specific'
method. Fitch Solutions mainly uses a linear model, but simple non-linear models, such as the log-linear model, are used when
necessary. During periods of 'industry shock', for example a deep industry recession, dummy variables are used to determine the
level of impact.
Effective forecasting depends on appropriately-selected regression models. Fitch Solutions selects the best model according to
various different criteria and tests, including, but not exclusive to:
• R2 tests explanatory power; Adjusted R2 takes degree of freedom into account
• Testing the directional movement and magnitude of coefficients
• Hypothesis testing to ensure co-efficients are significant (normally t-test and/or P-value)
• All results are assessed to alleviate issues related to auto-correlation and multi-co-linearity
Fitch Solutions uses the selected best model to perform forecasting.
It must be remembered that human intervention plays a necessary and desirable role in all of Fitch Solutions' industry forecasting.
Experience, expertise and knowledge of industry data and trends ensures that analysts spot structural breaks, anomalous data,
turning points and seasonal features where a purely mechanical forecasting process would not.
Within the Food & Drink industry, this intervention might include, but is not exclusive to: significant company expansion plans; new
product development that might influence pricing levels; dramatic changes in local production levels; product taxation; the
regulatory environment and specific areas of legislation; changes in lifestyles and general societal trends; the formation of bilateral
and multilateral trading agreements and negotiations; political factors influencing trade; and the development of the industry in
neighbouring markets that are potential competitors for foreign direct investment.
Example of Food Consumption Model:
Egypt Food & Drink Report | Q2 2019
fitchsolutions.com
THIS COMMENTARY IS PUBLISHED BY FITCH SOLUTIONS MACRO RESEARCH and is NOT a comment on Fitch Ratings' credit ratings. Any comments or data included in the report are solely derived from Fitch
Solutions Macro Research and independent sources. Fitch Ratings' analysts do not share data or information with Fitch Solutions Macro Research.
61
(Food Consumption)t = β0 + β1*(GDP)t + β2*(Inflation)t + β3*(Lending Rate)t + β4* (Foreign Exchange Rate)t + β5*(Government
Expenditure)t + β6*(Food Consumption)t-1 + εt
Sourcing
Fitch Solutions uses the following sources in the compilation of data, developments and analysis for its range of Food & Drink
reports: national statistics offices; local industry governing-bodies and associations; local trade associations; government
departments, particularly trade, agricultural and commerce ministries; officially-released information and financial results from local
and multinational companies; cross-referenced information from local and international news agencies and trade press outlets;
figures from global organisations, such as the World Trade Organization (WTO), the World Health Organization (WHO), the United
Nations Food and Agricultural Organization (FAO) and the Organisation for Economic Co-operation and Development (OECD).
Egypt Food & Drink Report | Q2 2019
fitchsolutions.com
THIS COMMENTARY IS PUBLISHED BY FITCH SOLUTIONS MACRO RESEARCH and is NOT a comment on Fitch Ratings' credit ratings. Any comments or data included in the report are solely derived from Fitch
Solutions Macro Research and independent sources. Fitch Ratings' analysts do not share data or information with Fitch Solutions Macro Research.
62
Food & Drink (Non-Alcoholic Drinks) Risk/Reward Index
Our Food & Drink (Non-Alcoholic Drinks) Risk/Reward Index (RRI) quantifies and ranks a country's attractiveness within the context
of the Food & Drink (Non-Alcoholic Drinks) industry, based on the balance between the Risks and Rewards of entering and
operating in different countries.
We combine industry-specific characteristics with broader economic, political and operational market characteristics. We weight
these inputs in terms of their importance to investor decision making in a given industry. The result is a nuanced and accurate
reflection of the realities facing investors in terms of:
1) the balance between opportunities and risk; and
2) between sector-specific and broader market traits.
This enables users of the index to assess a market's attractiveness in a regional and global context.
The index uses a combination of our proprietary forecasts and analyst assessments of the regulatory climate. As regulations evolve
and forecasts change, so the index scores change providing a highly dynamic and forward-looking result.
The Food & Drink (Non-Alcoholic Drinks) Risk/Reward Index universe comprises 107 countries.
Benefits of using Fitch Solutions' Food & Drink (Non-Alcoholic Drinks) RRI
• Global Rankings: One global table, ranking all the countries in Fitch Solutions' universe for Food & Drink (Non-Alcoholic Drinks)
from least (closest to zero) to most attractive (closest to 100).
• Accessibility: Easily accessible, top down view of the global, regional or sub-regional Risk/Reward profiles.
• Comparability: Identical methodology across 107 countries for Food & Drink (Non-Alcoholic Drinks) allows users to build lists of
countries they wish to compare, beyond the confines of a global or regional grouping.
• Scoring: Scores out of 100 with a wide distribution, provide nuanced investment comparisons. The higher the score, the more
favourable the country profile.
• Quantifiable: Quantifies the rewards and risks of doing business in the Food & Drink (Non-Alcoholic Drinks) sector in different
countries around the world and helps identify specific flashpoints in the overall business environment.
• Comprehensive: Comprehensive set of indicators, assessing industry-specific risks and rewards alongside political, economic
and operating risks.
• Entry Point: A starting point to assess the outlook for the Food & Drink (Non-Alcoholic Drinks) sector, from which users can dive
into more granular forecasts and analyses to gain a deeper understanding of the market.
• Balanced: Multi-indicator structure prevents outliers and extremes from distorting final scores and rankings.
• Methodology is a combination of proprietary Fitch Solutions forecasts, analyst insights and globally acceptable benchmark
indicators (for example, World Bank's Doing Business Scores, Transparency International's Corruption Perceptions Index).
Egypt Food & Drink Report | Q2 2019
fitchsolutions.com
THIS COMMENTARY IS PUBLISHED BY FITCH SOLUTIONS MACRO RESEARCH and is NOT a comment on Fitch Ratings' credit ratings. Any comments or data included in the report are solely derived from Fitch
Solutions Macro Research and independent sources. Fitch Ratings' analysts do not share data or information with Fitch Solutions Macro Research.
63
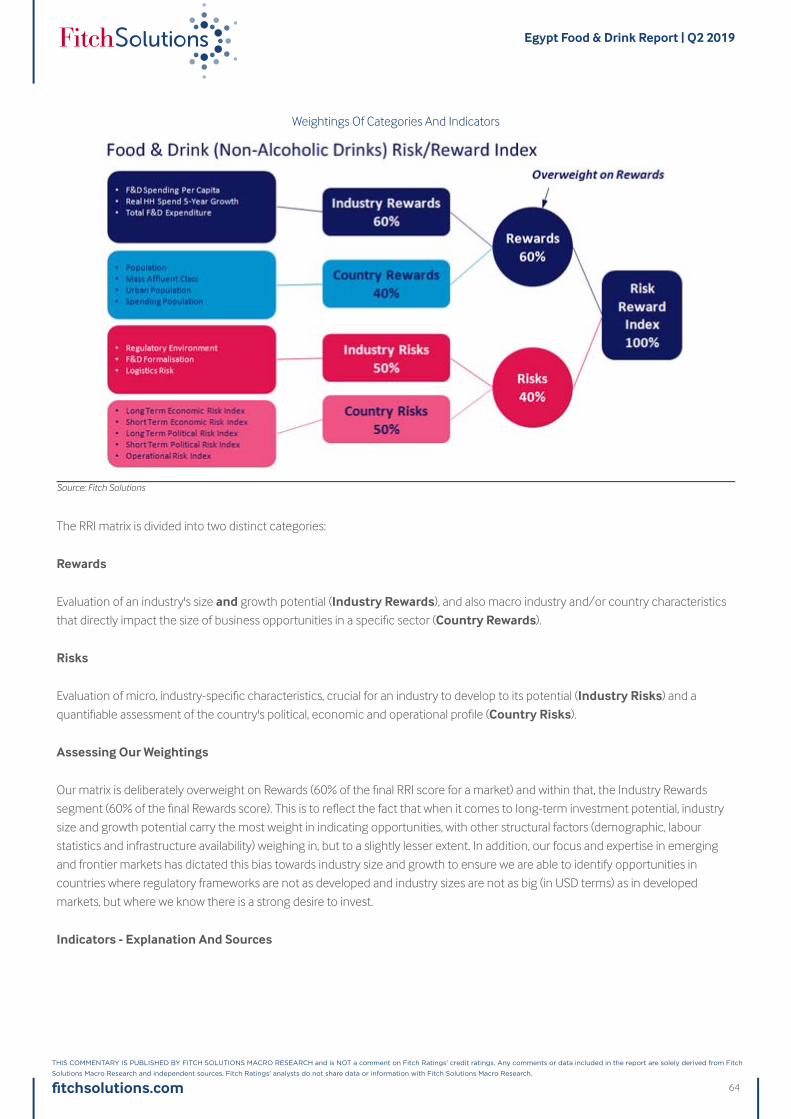
Weightings Of Categories And Indicators
Source: Fitch Solutions
The RRI matrix is divided into two distinct categories:
Rewards
Evaluation of an industry's size and growth potential (Industry Rewards), and also macro industry and/or country characteristics
that directly impact the size of business opportunities in a specific sector (Country Rewards).
Risks
Evaluation of micro, industry-specific characteristics, crucial for an industry to develop to its potential (Industry Risks) and a
quantifiable assessment of the country's political, economic and operational profile (Country Risks).
Assessing Our Weightings
Our matrix is deliberately overweight on Rewards (60% of the final RRI score for a market) and within that, the Industry Rewards
segment (60% of the final Rewards score). This is to reflect the fact that when it comes to long-term investment potential, industry
size and growth potential carry the most weight in indicating opportunities, with other structural factors (demographic, labour
statistics and infrastructure availability) weighing in, but to a slightly lesser extent. In addition, our focus and expertise in emerging
and frontier markets has dictated this bias towards industry size and growth to ensure we are able to identify opportunities in
countries where regulatory frameworks are not as developed and industry sizes are not as big (in USD terms) as in developed
markets, but where we know there is a strong desire to invest.
Indicators - Explanation And Sources
Egypt Food & Drink Report | Q2 2019
fitchsolutions.com
THIS COMMENTARY IS PUBLISHED BY FITCH SOLUTIONS MACRO RESEARCH and is NOT a comment on Fitch Ratings' credit ratings. Any comments or data included in the report are solely derived from Fitch
Solutions Macro Research and independent sources. Fitch Ratings' analysts do not share data or information with Fitch Solutions Macro Research.
64
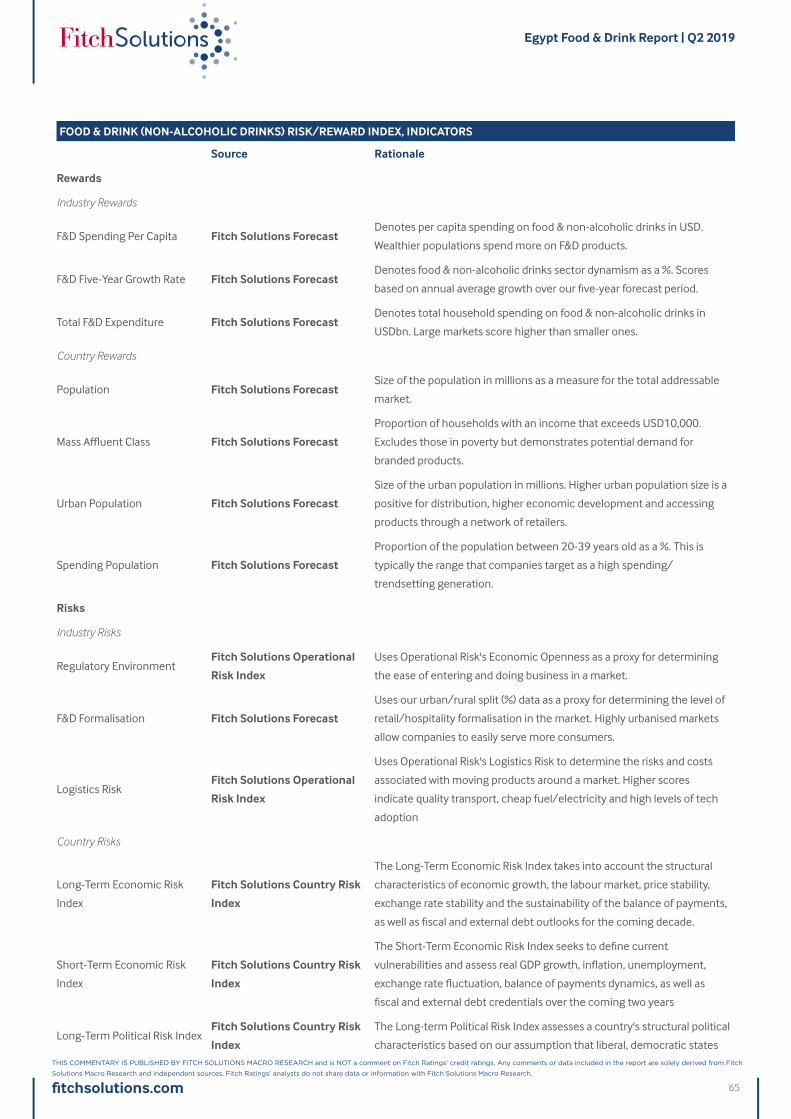
FOOD & DRINK (NON-ALCOHOLIC DRINKS) RISK/REWARD INDEX, INDICATORS
Source Rationale
Rewards
Industry Rewards
F&D Spending Per Capita Fitch Solutions ForecastDenotes per capita spending on food & non-alcoholic drinks in USD.
Wealthier populations spend more on F&D products.
F&D Five-Year Growth Rate Fitch Solutions ForecastDenotes food & non-alcoholic drinks sector dynamism as a %. Scores
based on annual average growth over our five-year forecast period.
Total F&D Expenditure Fitch Solutions ForecastDenotes total household spending on food & non-alcoholic drinks in
USDbn. Large markets score higher than smaller ones.
Country Rewards
Population Fitch Solutions ForecastSize of the population in millions as a measure for the total addressable
market.
Mass Affluent Class Fitch Solutions Forecast
Proportion of households with an income that exceeds USD10,000.
Excludes those in poverty but demonstrates potential demand for
branded products.
Urban Population Fitch Solutions Forecast
Size of the urban population in millions. Higher urban population size is a
positive for distribution, higher economic development and accessing
products through a network of retailers.
Spending Population Fitch Solutions Forecast
Proportion of the population between 20-39 years old as a %. This is
typically the range that companies target as a high spending/
trendsetting generation.
Risks
Industry Risks
Regulatory EnvironmentFitch Solutions Operational
Risk Index
Uses Operational Risk's Economic Openness as a proxy for determining
the ease of entering and doing business in a market.
F&D Formalisation Fitch Solutions Forecast
Uses our urban/rural split (%) data as a proxy for determining the level of
retail/hospitality formalisation in the market. Highly urbanised markets
allow companies to easily serve more consumers.
Logistics RiskFitch Solutions Operational
Risk Index
Uses Operational Risk's Logistics Risk to determine the risks and costs
associated with moving products around a market. Higher scores
indicate quality transport, cheap fuel/electricity and high levels of tech
adoption
Country Risks
Long-Term Economic Risk
Index
Fitch Solutions Country Risk
Index
The Long-Term Economic Risk Index takes into account the structural
characteristics of economic growth, the labour market, price stability,
exchange rate stability and the sustainability of the balance of payments,
as well as fiscal and external debt outlooks for the coming decade.
Short-Term Economic Risk
Index
Fitch Solutions Country Risk
Index
The Short-Term Economic Risk Index seeks to define current
vulnerabilities and assess real GDP growth, inflation, unemployment,
exchange rate fluctuation, balance of payments dynamics, as well as
fiscal and external debt credentials over the coming two years
Long-Term Political Risk IndexFitch Solutions Country Risk
Index
The Long-term Political Risk Index assesses a country's structural political
characteristics based on our assumption that liberal, democratic states
Egypt Food & Drink Report | Q2 2019
fitchsolutions.com
THIS COMMENTARY IS PUBLISHED BY FITCH SOLUTIONS MACRO RESEARCH and is NOT a comment on Fitch Ratings' credit ratings. Any comments or data included in the report are solely derived from Fitch
Solutions Macro Research and independent sources. Fitch Ratings' analysts do not share data or information with Fitch Solutions Macro Research.
65
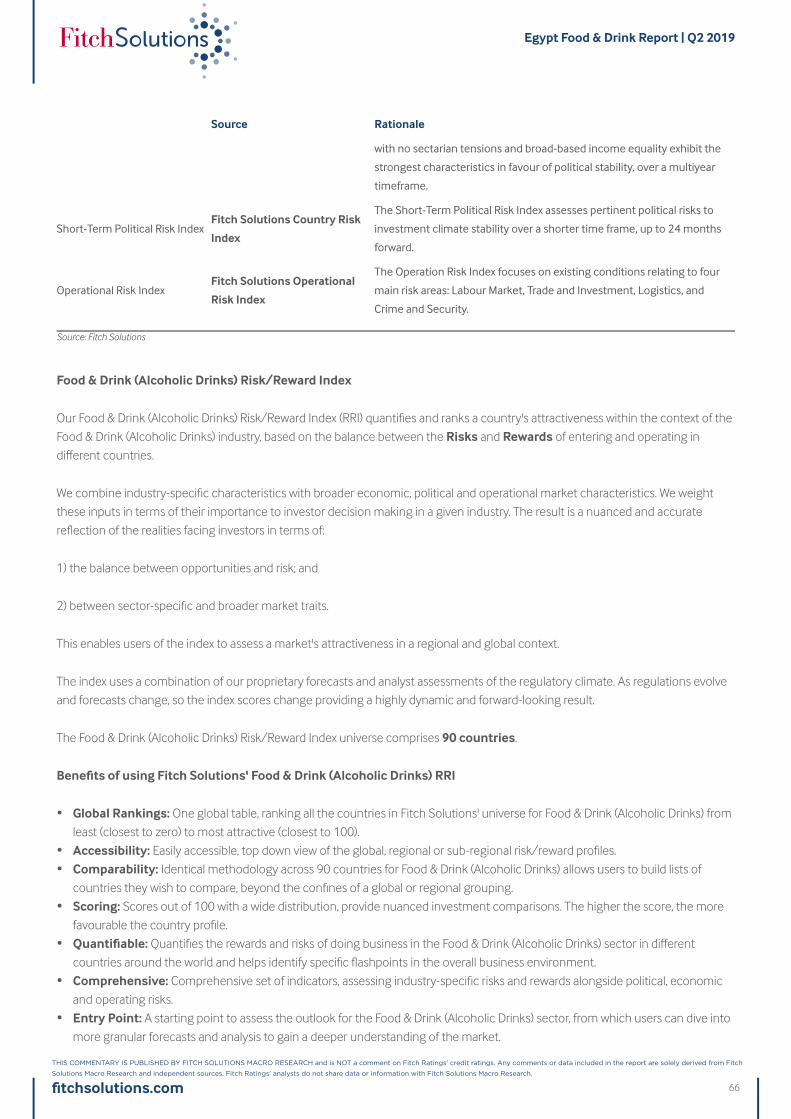
Food & Drink (Alcoholic Drinks) Risk/Reward Index
Our Food & Drink (Alcoholic Drinks) Risk/Reward Index (RRI) quantifies and ranks a country's attractiveness within the context of the
Food & Drink (Alcoholic Drinks) industry, based on the balance between the Risks and Rewards of entering and operating in
different countries.
We combine industry-specific characteristics with broader economic, political and operational market characteristics. We weight
these inputs in terms of their importance to investor decision making in a given industry. The result is a nuanced and accurate
reflection of the realities facing investors in terms of:
1) the balance between opportunities and risk; and
2) between sector-specific and broader market traits.
This enables users of the index to assess a market's attractiveness in a regional and global context.
The index uses a combination of our proprietary forecasts and analyst assessments of the regulatory climate. As regulations evolve
and forecasts change, so the index scores change providing a highly dynamic and forward-looking result.
The Food & Drink (Alcoholic Drinks) Risk/Reward Index universe comprises 90 countries.
Benefits of using Fitch Solutions' Food & Drink (Alcoholic Drinks) RRI
• Global Rankings: One global table, ranking all the countries in Fitch Solutions' universe for Food & Drink (Alcoholic Drinks) from
least (closest to zero) to most attractive (closest to 100).
• Accessibility: Easily accessible, top down view of the global, regional or sub-regional risk/reward profiles.
• Comparability: Identical methodology across 90 countries for Food & Drink (Alcoholic Drinks) allows users to build lists of
countries they wish to compare, beyond the confines of a global or regional grouping.
• Scoring: Scores out of 100 with a wide distribution, provide nuanced investment comparisons. The higher the score, the more
favourable the country profile.
• Quantifiable: Quantifies the rewards and risks of doing business in the Food & Drink (Alcoholic Drinks) sector in different
countries around the world and helps identify specific flashpoints in the overall business environment.
• Comprehensive: Comprehensive set of indicators, assessing industry-specific risks and rewards alongside political, economic
and operating risks.
• Entry Point: A starting point to assess the outlook for the Food & Drink (Alcoholic Drinks) sector, from which users can dive into
more granular forecasts and analysis to gain a deeper understanding of the market.
Source Rationale
with no sectarian tensions and broad-based income equality exhibit the
strongest characteristics in favour of political stability, over a multiyear
timeframe.
Short-Term Political Risk IndexFitch Solutions Country Risk
Index
The Short-Term Political Risk Index assesses pertinent political risks to
investment climate stability over a shorter time frame, up to 24 months
forward.
Operational Risk IndexFitch Solutions Operational
Risk Index
The Operation Risk Index focuses on existing conditions relating to four
main risk areas: Labour Market, Trade and Investment, Logistics, and
Crime and Security.
Source: Fitch Solutions
Egypt Food & Drink Report | Q2 2019
fitchsolutions.com
THIS COMMENTARY IS PUBLISHED BY FITCH SOLUTIONS MACRO RESEARCH and is NOT a comment on Fitch Ratings' credit ratings. Any comments or data included in the report are solely derived from Fitch
Solutions Macro Research and independent sources. Fitch Ratings' analysts do not share data or information with Fitch Solutions Macro Research.
66
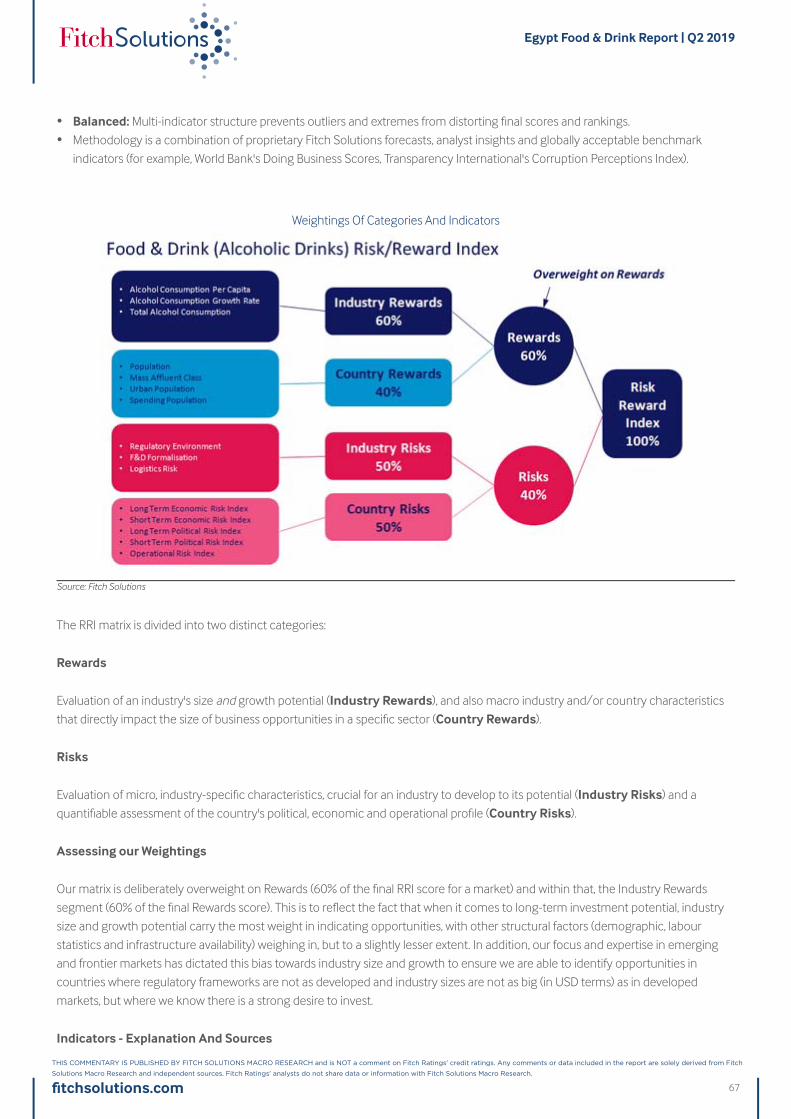
• Balanced: Multi-indicator structure prevents outliers and extremes from distorting final scores and rankings.
• Methodology is a combination of proprietary Fitch Solutions forecasts, analyst insights and globally acceptable benchmark
indicators (for example, World Bank's Doing Business Scores, Transparency International's Corruption Perceptions Index).
Weightings Of Categories And Indicators
Source: Fitch Solutions
The RRI matrix is divided into two distinct categories:
Rewards
Evaluation of an industry's size and growth potential (Industry Rewards), and also macro industry and/or country characteristics
that directly impact the size of business opportunities in a specific sector (Country Rewards).
Risks
Evaluation of micro, industry-specific characteristics, crucial for an industry to develop to its potential (Industry Risks) and a
quantifiable assessment of the country's political, economic and operational profile (Country Risks).
Assessing our Weightings
Our matrix is deliberately overweight on Rewards (60% of the final RRI score for a market) and within that, the Industry Rewards
segment (60% of the final Rewards score). This is to reflect the fact that when it comes to long-term investment potential, industry
size and growth potential carry the most weight in indicating opportunities, with other structural factors (demographic, labour
statistics and infrastructure availability) weighing in, but to a slightly lesser extent. In addition, our focus and expertise in emerging
and frontier markets has dictated this bias towards industry size and growth to ensure we are able to identify opportunities in
countries where regulatory frameworks are not as developed and industry sizes are not as big (in USD terms) as in developed
markets, but where we know there is a strong desire to invest.
Indicators - Explanation And Sources
Egypt Food & Drink Report | Q2 2019
fitchsolutions.com
THIS COMMENTARY IS PUBLISHED BY FITCH SOLUTIONS MACRO RESEARCH and is NOT a comment on Fitch Ratings' credit ratings. Any comments or data included in the report are solely derived from Fitch
Solutions Macro Research and independent sources. Fitch Ratings' analysts do not share data or information with Fitch Solutions Macro Research.
67
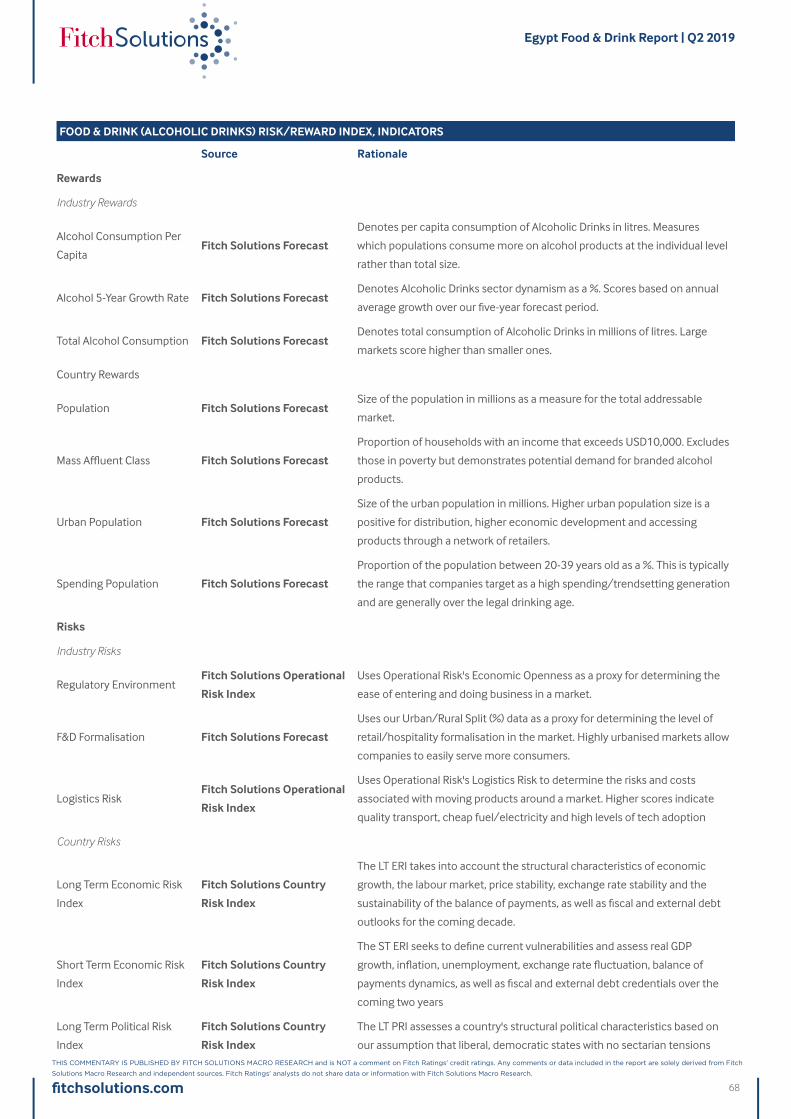
FOOD & DRINK (ALCOHOLIC DRINKS) RISK/REWARD INDEX, INDICATORS
Source Rationale
Rewards
Industry Rewards
Alcohol Consumption Per
CapitaFitch Solutions Forecast
Denotes per capita consumption of Alcoholic Drinks in litres. Measures
which populations consume more on alcohol products at the individual level
rather than total size.
Alcohol 5-Year Growth Rate Fitch Solutions ForecastDenotes Alcoholic Drinks sector dynamism as a %. Scores based on annual
average growth over our five-year forecast period.
Total Alcohol Consumption Fitch Solutions ForecastDenotes total consumption of Alcoholic Drinks in millions of litres. Large
markets score higher than smaller ones.
Country Rewards
Population Fitch Solutions ForecastSize of the population in millions as a measure for the total addressable
market.
Mass Affluent Class Fitch Solutions Forecast
Proportion of households with an income that exceeds USD10,000. Excludes
those in poverty but demonstrates potential demand for branded alcohol
products.
Urban Population Fitch Solutions Forecast
Size of the urban population in millions. Higher urban population size is a
positive for distribution, higher economic development and accessing
products through a network of retailers.
Spending Population Fitch Solutions Forecast
Proportion of the population between 20-39 years old as a %. This is typically
the range that companies target as a high spending/trendsetting generation
and are generally over the legal drinking age.
Risks
Industry Risks
Regulatory EnvironmentFitch Solutions Operational
Risk Index
Uses Operational Risk's Economic Openness as a proxy for determining the
ease of entering and doing business in a market.
F&D Formalisation Fitch Solutions Forecast
Uses our Urban/Rural Split (%) data as a proxy for determining the level of
retail/hospitality formalisation in the market. Highly urbanised markets allow
companies to easily serve more consumers.
Logistics RiskFitch Solutions Operational
Risk Index
Uses Operational Risk's Logistics Risk to determine the risks and costs
associated with moving products around a market. Higher scores indicate
quality transport, cheap fuel/electricity and high levels of tech adoption
Country Risks
Long Term Economic Risk
Index
Fitch Solutions Country
Risk Index
The LT ERI takes into account the structural characteristics of economic
growth, the labour market, price stability, exchange rate stability and the
sustainability of the balance of payments, as well as fiscal and external debt
outlooks for the coming decade.
Short Term Economic Risk
Index
Fitch Solutions Country
Risk Index
The ST ERI seeks to define current vulnerabilities and assess real GDP
growth, inflation, unemployment, exchange rate fluctuation, balance of
payments dynamics, as well as fiscal and external debt credentials over the
coming two years
Long Term Political Risk
Index
Fitch Solutions Country
Risk Index
The LT PRI assesses a country's structural political characteristics based on
our assumption that liberal, democratic states with no sectarian tensions
Egypt Food & Drink Report | Q2 2019
fitchsolutions.com
THIS COMMENTARY IS PUBLISHED BY FITCH SOLUTIONS MACRO RESEARCH and is NOT a comment on Fitch Ratings' credit ratings. Any comments or data included in the report are solely derived from Fitch
Solutions Macro Research and independent sources. Fitch Ratings' analysts do not share data or information with Fitch Solutions Macro Research.
68
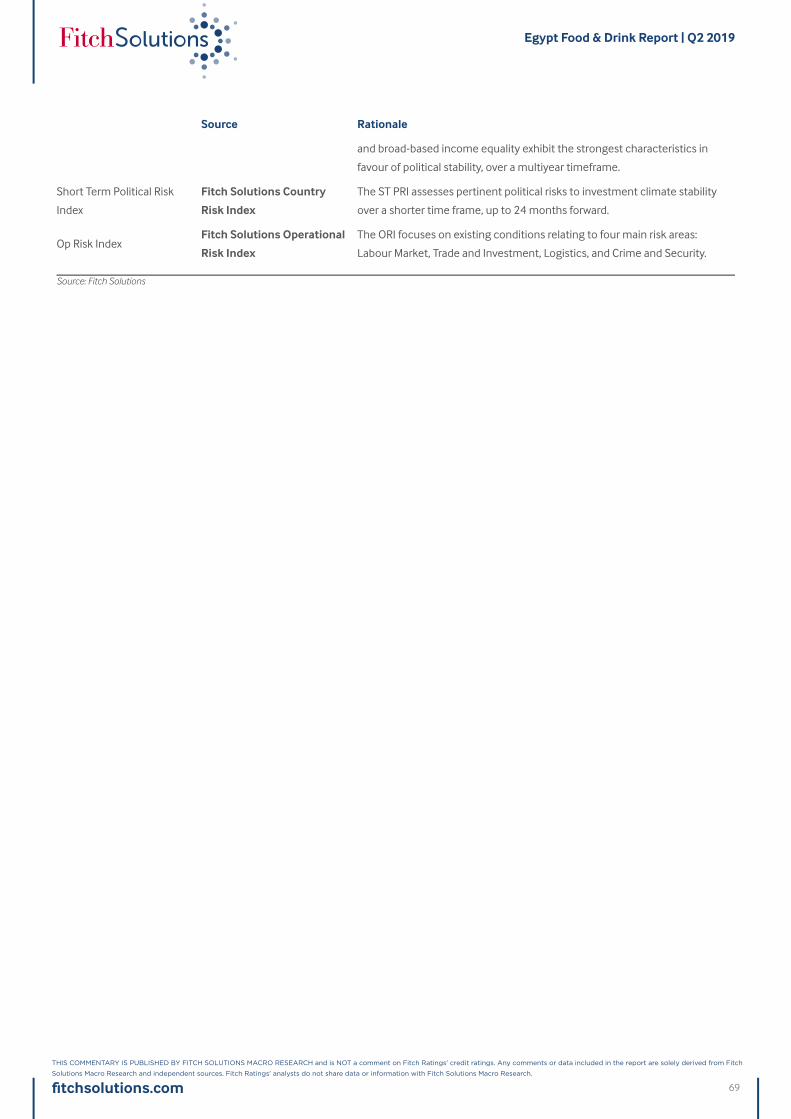
Source Rationale
and broad-based income equality exhibit the strongest characteristics in
favour of political stability, over a multiyear timeframe.
Short Term Political Risk
Index
Fitch Solutions Country
Risk Index
The ST PRI assesses pertinent political risks to investment climate stability
over a shorter time frame, up to 24 months forward.
Op Risk IndexFitch Solutions Operational
Risk Index
The ORI focuses on existing conditions relating to four main risk areas:
Labour Market, Trade and Investment, Logistics, and Crime and Security.
Source: Fitch Solutions
Egypt Food & Drink Report | Q2 2019
fitchsolutions.com
THIS COMMENTARY IS PUBLISHED BY FITCH SOLUTIONS MACRO RESEARCH and is NOT a comment on Fitch Ratings' credit ratings. Any comments or data included in the report are solely derived from Fitch
Solutions Macro Research and independent sources. Fitch Ratings' analysts do not share data or information with Fitch Solutions Macro Research.
69
Egypt Food & Drink Report | Q2 2019
fitchsolutions.com
THIS COMMENTARY IS PUBLISHED BY FITCH SOLUTIONS MACRO RESEARCH and is NOT a comment on Fitch Ratings' credit ratings. Any comments or data included in the report are solely derived from Fitch
Solutions Macro Research and independent sources. Fitch Ratings' analysts do not share data or information with Fitch Solutions Macro Research.
70
FitFitch Solutions, 30 North Cch Solutions, 30 North Colonnadeolonnade, Canary W, Canary Wharfharf, L, London. E14 5GN, UKondon. E14 5GN, UK
TTel:el: +44 (0)20 7248 0468
FFax:ax: +44 (0)20 7248 0467
WWeb:eb: www.fitchsolutions.com
ISISSN:SN: 1749-267X
CCopopy Deadline:y Deadline: February 2019
© 20© 2019 Fit19 Fitch Solutions Grch Solutions Group Limitoup Limited.ed. All rights rAll rights reserveserved.ed.
All information, analysis, forecasts and data provided by Fitch Solutions Group Limited is for the exclusive use of subscribing persons or organisations (including thoseusing the service on a trial basis). All such content is copyrighted in the name of Fitch Solutions Group Limited and as such no part of this content may be reproduced,repackaged, copied or redistributed without the express consent of Fitch Solutions Group Limited.
All content, including forecasts, analysis and opinion, has been based on information and sources believed to be accurate and reliable at the time of publishing. FitchSolutions Group Limited makes no representation of warranty of any kind as to the accuracy or completeness of any information provided, and accepts no liabilitywhatsoever for any loss or damage resulting from opinion, errors, inaccuracies or omissions affecting any part of the content.
This report from Fitch Solutions Macro Research is a product of Fitch Solutions Group Ltd, UK Company registration number 08789939 ('FSG'). FSG is an affiliate of FitchRatings Inc. ('Fitch Ratings'). FSG is solely responsible for the content of this report, without any input from Fitch Ratings. Copyright © 2019 Fitch Solutions Group Limited.