Embed Size (px)
Citation preview
Flycatcher: Fusion of Gaze with Hierarchical Image Segmentation for Robust Object Detection
by
Jeffrey M. Bartelma
B.S., Massachusetts Institute of Technology (2003)
Submitted to the Department of Electrical Engineering and Computer Science in Partial Fulfillment of the Requirements for the Degree of
Master of Engineering in Electrical Engineering and Computer Science
at the Massachusetts Institute of Technology
July 2004
© Massachusetts Institute of Technology 2004. All rights reserved.
The author hereby grants to MIT permission to reproduce and distribute publicly paper and electronic copies of this thesis document in whole or in part.
Author …………………………………………………………………………………….. Department of Electrical Engineering and Computer Science
July 21, 2004
Certified by ……………………………………………………………………………….. Deb Roy
Associate Professor of Media Arts and Sciences Thesis Supervisor
Accepted by ……………………………………………………………………………….. Arthur C. Smith
Chairman, Departmental Committee on Graduate Students

2

3
Flycatcher: Fusion of Gaze with Hierarchical Image Segmentation for Robust Object Detection
by Jeffrey M. Bartelma
Submitted to the Department of Electrical Engineering and Computer Science
on July 21, 2004 in partial fulfillment of the requirements for the degree of Master of Engineering in Electrical Engineering and Computer Science
ABSTRACT. We present Flycatcher, a prototype system illustrating the idea of gaze-based image processing in the context of object segmentation for wearable photography. The prototype includes a wearable eye tracking device that captures real-time eyetraces of a user, and a wearable video camera that captures first-person perspective images of the user’s visual environment. The system combines the deliberate eyetraces of the user with hierarchical image segmentation applied to scene images to achieve reliable object segmentation. In evaluations with certain classes of real-world images, fusion of gaze and image segmentation information led to higher object detection accuracy than either signal alone. Flycatcher may be integrated with assistive communication devices, enabling individuals with severe motor impairments to use eye control to communicate about objects in their environment. The system also represents a promising step toward an eye-driven interface for “copy and paste” visual memory augmentation in wearable computing applications. Thesis Supervisor: Deb Roy Title: Associate Professor of Media Arts and Sciences

4
Contents
CHAPTER 1: INTRODUCTION AND MOTIVATIONS..............................................6
CHAPTER 2: OBJECT SEGMENTATION USING EYE MOVEMENTS..............10
2.1 Gaze-Based Input and Control..........................................................................................................................10
2.2 An Eyetrace Interface ..........................................................................................................................................12
2.3 Experiments ............................................................................................................................................................14 2.3.1 Equipment ...................................................................................................................................................... 14 2.3.2 Procedure ........................................................................................................................................................ 15 2.3.3 Stimuli ............................................................................................................................................................. 17
2.4 Object Segmentation Us ing Eye Movements.................................................................................................19 2.4.1 Algorithm........................................................................................................................................................ 20 2.4.2 Establishing Ground Truth by Manual Image Annotation .............................................................. 21 2.4.3 Results ............................................................................................................................................................. 22
CHAPTER 3: OBJECT SEGMENTATION USING COMPUTER VISION ...........25
3.1 Hierarchical Image Segmentation....................................................................................................................25
3.2 Evaluation ...............................................................................................................................................................26
CHAPTER 4: OBJECT SEGMENTATION BY COMBINING EYE MOVEMENTS AND COMPUTER VISION ...........................................................................................28
4.1 The Fusion Method...............................................................................................................................................28
4.2 Algorithm................................................................................................................................................................29
4.3 Algorithm Rationale.............................................................................................................................................31
4.4 Example ...................................................................................................................................................................34
4.5 Results ......................................................................................................................................................................34
CHAPTER 5: CONTRIBUTIONS................................................................................39
REFERENCES ...............................................................................................................40
APPENDIX A: SUBJECT INSTRUCTIONS FOR EXPERIMENTS.......................41

5
Acknowledgments
The author gratefully acknowledges Yair Ghitza for providing an implementation and
description of the Kropatsch and Haxhimusa hierarchical segmentation algorithm, as well
as Deb Roy, Josh Juster, and Aditi Garg for helpful comments and suggestions.

6
Chapter 1: Introduction and Motivations
Continued innovation in hardware design is making it increasingly practical to move
computation away from the desktop and into our everyday lives. Driven by demand for
products such as portable audio decoders, compact, high-capacity storage devices have
recently become fairly inexpensive. At the same time, the burgeoning popularity of
camera phones in the U.S., Europe and especially Japan, where market penetration is
projected to reach nearly 100% in 2005[1], demonstrates a mass interest in high-
availability autobiographical image capture. This confluence of factors makes it practical
and timely to consider always-available systems for recording a "visual diary" of a
person's lifetime experiences, from their point of view[2].
In this paper we describe an interface to an image capture system that integrates the
user’s eye gaze, captured using a wearable eye tracker, to help determine which region of
an image is of particular importance to the user. In essence this is the classic problem of
object segmentation expressed in the context of a human-assistive system. This is an
important problem for several reasons. First, to the extent that major ingredients of a
solution are not particular to object segmentation it will provide an initial model for how
to simplify traditionally difficult image processing problems using gaze information.
Second, the determination of meaningful, salient, or otherwise important image areas
would provide effective means for automatic summarization, indexing and search of
captured content. Third, images from portable capture devices are increasingly being
used for the direct communication of ideas in a visual form.1 Identifying the important
1 See http://picturephoning.com/archives/002604.htm for a number of examples reported

7
part of an image amounts to enabling the expressive power of indexicals--indicative or
demonstrative words such as “this”, “that”, “these” and “those”--for visual
communication.
This final point is a significant one and underlies a key application motivating this
work. Over two million individuals with speech impairments in the U.S. alone[3] rely on
Augmentative and Alternative Communication (AAC) devices to help express their
everyday thoughts, needs, and ideas. Some of these devices now support extensible
symbolic vocabularies, from which a user can assemble utterances for visual or spoken
output. However, the means of extension are too cumbersome to permit new symbols to
be defined on demand, for immediate use in an utterance. On the timescale of a
conversation, this shortcoming limits AAC users to relatively small, fixed vocabulary
which acts to isolate them from their present environment and conversational partners.
For the sake of concreteness let us consider a specific scenario illustrating the problem:
An AAC user, Allen, and his mother go to a department store to find him clothes
for a wedding in the family. Allen's mother finds six different ties and eight different
sports jackets, and asks for his opinions. Allen's AAC device might contain symbols for
sports jackets and ties, but it doesn't have a way to refer to a specific tie, nor a specific
sports jacket or any of its parts.
Allen thinks one of the blue ties is too narrow, and dislikes the large buttons on one
of the jackets. In a similar situation, most people would point at the narrow tie and say,
"That is too narrow", and similarly for the jacket, "Those buttons are too big".
Unfortunately Allen has no effective means of pointing, either physically or
in recent print media.

8
grammatically (with demonstrative words like this, that or those). Using his present AAC
device it may be too difficult or time consuming for Allen to say anything more than
"The tie on left; the jacket on right". Without access to indexicals Allen is unable to
speak effectively about his immediate spatiotemporal surroundings.
Our prototype addresses this problem by enabling a user to capture important parts
of a scene using his or her eyes. In this respect the prototype enables a kind of eye-driven
"copy-and-paste" operation for copying pieces of the user's environment into his or her
electronic communication aid. To capture a cropped image of the sports jacket he wishes
to discuss, Allen needs only trace an outline of the jacket with his eyes, pressing a button
once to begin his trace, and again to end it. The new symbol could then be used in
conversation, that is, displayed to his mother on the device's output screen, and optionally
pronounced with a default vocalization of "this" or "that". Preliminary experiments
suggest that Flycatcher, our prototype gaze-based object segmenter, substantially solves
this example problem for a set of stimuli depicting real- life retail displays including
jackets, shirts, pants, and so forth. In this paper we describe how Flycatcher works,
focusing particularly on the three core algorithms that together comprise the bulk of its
technical contribution:
• processing inherently noisy outlines of an object as traced with the eyes into a
reasonable approximation of that object's bounds;
• using the unreliable results of image-based hierarchical segmentation to reinforce
one another;
• combining top-down information about the user's intent (derived from eyetraces)
with bottom-up information about the structure of the image (derived from

9
hierarchical segmentation techniques) into a single, more accurate approximation
of the region of interest.
The remainder of this paper is structured as follows. Chapter 2 provides background
on some relevant aspects of eye gaze analysis and introduces an object segmentation
algorithm that uses only gaze information, ignoring the structure of the image itself. We
evaluate the performance of the gaze-only algorithm on a set of three experiments.
Chapter 3 reviews a purely image-based approach to object segmentation and gives an
informal evaluation of its performance on the same three datasets. Finally, Chapter 4
presents and evaluates a new algorithm that incorporates gaze information into a
hierarchical segmentation technique to achieve more robust object segmentation.

10
Chapter 2: Object Segmentation Using Eye Movements
2.1 Gaze-Based Input and Control
As we discuss more fully in the next section, image-based object segmentation is an
extremely difficult problem that has largely eluded computer vision researchers for
decades.2 In assistive systems designed to aid or enhance the capabilities of a human
user, under some circumstances it makes sense for the human to assist the system in
solving some subproblem that is easy for people and hard for computers, provided it is
possible to do so in an unobtrusive way. Image-based object segmentation and object
recognition are just two problems where a small human investment in effort can pay very
large dividends in the overall usefulness of the integrated system. In the case of icon
capture for AAC devices, there is a profound difference of utility between a fully
automatic object segmenter that does not work and a mostly automatic object segmenter
that does.
There are obvious advantages to using gaze information to control a computer
system. This is especially true of systems intended to aid non-verbal or other disabled
populations, because many individuals with partial paralysis or poor limb dexterity
nonetheless can control their eyes. In such cases gaze input may be one of the only
options[5]. More generally, gaze control leaves the hands free or mostly free, which is of
course crucial for always-on applications. Even when hands-free operation is not 2 If we accept that humans' ability to parse unfamiliar scenes into coherent objects is owed in part to domain knowledge accumulated from a lifetime of interaction with the world, it is also an underdetermined problem. Practical systems incorporating an object segmentation component often define their own models of what constitutes an object, according to the needs of the system and the environment in which it operates[4].

11
important there is evidence that gaze-based selection is faster than using a conventional
selection device such as a mouse, at least in some circumstances[6].
However there are a number of important caveats and potential pitfalls associated
with eye control. First, most present eyetracking systems are still expensive and bulky,
and not very practical particularly for mobile use. However there are some encouraging
trends in this regard. Some models of Canon cameras are now equipped with eye-
controlled autofocus systems[7], and IBM’s BlueEyes research project is exploring the
value of eye-tracking, among other input modalities, in producing more user-aware
consumer electronics[8].
A more lasting issue affecting gaze-based control is that what we believe our eyes
to be doing and what they are really doing are rarely the same thing. For example, when
we perceive our eyes to be motionlessly fixating on a stationary object, they are actually
in constant involuntary motion, and occasionally make large saccades of 15-20 degrees of
visual angle with neither our knowledge nor control[9]. Similarly,
what we believe to be smooth, uninterrupted tracking of figures is in fact a set of discrete
stops and small (involuntary) saccades, not always even lying on the line one is trying to
track[9]. And although we perceive that we can move our eyes either quickly or slowly,
individual saccades are themselves limited in amplitude to 20 degrees and of fixed
duration given an amplitude. In other words, not only are voluntary eye movements
subject to limited conscious control, but we are not even normally aware of this fact.
Finally, eyes move very quickly--peak angular velocity is about 1 degree per millisecond-
-so appropriately recording eye movements requires equipment accurate on a very fine
timescale.

12
Apart from these difficulties inherent to nature of eye movements, eyetracking
systems are also susceptible to several kinds of measurement error. Yarbus' original
experiments were performed using an invasive technique involving eyeball suction
clamps and eyelid restraints. Modern techniques, while noninvasive, are prone to several
types of error Yarbus did not face (depending on the exact system used):
• imperfect calibration, leading to small, mostly translational inaccuracies;
• horizontal and vertical correlation factors calculated by the calibration process that
may not be accurate for all regions of an image, therefore causing distortion of the
trajectory trace, especially near the extremes of an image;
• temporary loss of infrared corneal reflection (usually due to blinks) needed to
calculate where the user is looking causing erratic leaps and spikes in eyetraces.
The accuracy of recorded data also depends to some extent on the nature of the control
interface. If the interface requires unnatural movements such as long fixations or
intentional blinking, the resulting eyestrain will decrease accuracy by introducing extra
noise. But even with a natural control interface, if we are to use gaze information as
input for an object segmenter, we must be prepared to clean up inherently noisy data.
2.2 An Eyetrace Interface There are many possible gaze-based interfaces for incorporating users' knowledge
of object boundaries into the classic problem of object segmentation. For example, one
could ask users to denote interesting regions by:
• pressing a button while looking at the center of the region;
• pressing a button while looking at each of several locations within the region of

13
interest, to mark them all as part of the same object;
• or, looking at and marking with button presses the top, bottom, leftmost and
rightmost points of the region of interest.
Our prototype system, Flycatcher, instead asks users to create eyetraces, that is, to trace a
rough outline of the region of interest with their eyes, pressing a button to indicate the
beginning and end of the tracing process. There are several advantages to this choice.
First, it is a fairly intuitive way to mark part of an image as interesting or important,
similar, for example, to how we circle a location on a map. Second, it is possible to
derive from the eyetrace at least approximations to the same data we could collect
directly through a less intuitive interface. For example, our methods use the eyetrace to
approximate the centroid of the region as well as a number of points interior to it.
Finally, and crucially, the eyetrace provides a strong hint as to the approximate overall
size of the region to be captured. As we will more fully explain in Section 4, this allows
Flycatcher to choose which of several candidate regions hypothesized by analyzing the
image itself is most likely the best answer.
Flycatcher uses keypresses to signify that the system should begin and end the
recording of an eyetrace. However our framework is general, and keypresses could be
trivially replaced by another input modality, e.g. simple vocalizations. Additionally it
may be possible to further streamline the interface to require only one such signal by
intelligently closing partial eyetraces, but our early prototype does not attempt this.
Using the gaze interface outlined above we collected eyetracking data from subjects
for three experiments. The data from these experiments were used to evaluate the
efficacy of our object segmentation algorithms. We now describe our experimental
14
methodology.
2.3 Experiments
2.3.1 Equipment
In the experiments, subjects (MIT graduate and undergraduate students) used a wearable
eyetracker (I-Scan Model ETL-500) which includes two miniature video cameras
mounted on a headband. The first camera, the eye camera, is directed towards the user's
left eye. Using infrared illumination, it provides reliable video of the subject's eye
movements which are converted into point-of-regard (POR) information by I-Scan's
image processing firmware. A second scene camera is also mounted on the headband. It
points outwards to capture a view of the environment as seen from the subject's
perspective. Although the current configuration of hardware (head worn eye tracker
tethered to a workstation) is not immediately suitable for mobile wearable operation, we
envision future versions of the hardware in which the eye and scene camera are further
miniaturized and integrated into a wearable device resembling a pair of ordinary eye
glasses.[2]
The eyetracker generates the x-y coordinates of the subject's visual point of focus at
a rate of 60 samples per second and sends them to the serial port of a data recording
computer along with video from the scene camera. Frames are received at a rate of 15-20
frames per second at a resolution of 320 x 240 pixels.
The video and point-of-regard data is recorded using a custom program which
maintains a buffer of the last 10-15 seconds of timestamped frames and their
corresponding PORs. When a key is pressed to signify the beginning of an eyetrace, the

15
current timestamp t1 is noted. When a keypress arrives at t2 to signify the end of an
eyetrace, all frames between t1 and t2 are retrieved from the buffer and saved to disk for
future processing. If eye motion is slow at some point during the recording, adjacent
frames will bear the same POR information. Such duplicate frames are not saved as they
contain no new information.
This "buffer-and-fetch" architecture is a necessary consequence of the extreme time
sensitivity of eye movements. If significant processing—for example, special setup to
store frames—is triggered at t1, the regularity of reading and buffering subsequent frames
is disrupted, and the resulting eyetrace data is inaccurate. By delaying all processing until
after t2, only the frames read after t2 (which we do not care about) are affected.
2.3.2 Procedure
The three experiments were almost identical aside from the stimuli used. Subjects were
seated approximately 10 feet away from a stimulus array situated on a empty white wall.

16
Figure 1. Experimental setup. An experimenter (left) controlled an overhead LCD projector displaying stimuli on a wall in front of the subject.
See Figure 1. In each of 15-25 trials an experimenter read the subject a short description
of one of the stimuli visible on the wall, for example, "the blue triangle". Subjects were
instructed to outline the stimulus with their gaze (i.e. trace its outermost contour), using
the space bar of a keyboard to signify the beginning and end of the outlining process.
Subjects typically rested their hands on the keyboard and so did not need to look away
from the stimulus to find the space bar. Subjects were instructed to trace at a speed they
found personally comfortable. Following the subject's second button press, the
experimenter paused several seconds before describing another stimulus for the next trial.
See Appendix A for the full text of instructions given to subjects.

17
2.3.3 Stimuli
Although subjects faced the same tasks in all three experiments, the stimuli for each
experiment were different and were chosen for different reasons.
The purpose of Experiment 1 was to act as an initial, simplified proving ground for
our gaze-based segmentation algorithms. The stimuli for Experiment 1 are five shapes
cut out of colored construction paper: a red rectangle, a blue triangle, a maroon
semicircle, a black square, and a green "peanut" shape.
Figure 2. Stimulus array for Experiment 1.
See Figure 2. These stimuli served as a valuable testbed, with unambiguous correct and
incorrect answers, for developing techniques combining gaze and image-based
information. Furthermore the sharp edges of these stimuli helped us to a clearer picture of
the noise contained in real- life eyetracking data, as there could be no doubt which
contours subjects were trying to trace. We recorded data from three subjects for this pilot
experiment.
The purpose of Experiment 2 was to test the performance of the prototype on one of
the actual motivating problems for this thesis. The stimuli for this experiment are color
digital photographs of real- life retail displays in Cambridge, MA stores taking during

18
daylight hours.
Figure 3. Representative stimuli for Experiment 2.
See Figure 3 for some representative examples. The stimuli realistically simulate
scenarios in which a speech-disabled AAC user wishes to capture an image of some item,
for example, a specific jacket or pair of pants, in order to talk about it. The photographs
were projected on the wall of a darkened room from an LCD projector situated behind the
subject as shown in Figure 1. As in Experiment 1, the experimenter read descriptions of
target objects (e.g., “the blue jacket in the middle”) to prompt participants to trace
objects. We recorded data from 4 subjects for this experiment.
The purpose of Experiment 3 was to test the performance of the prototype
segmenting objects from natural scenes. The dataset was chosen to shed some light on
modes of failure for images with complex color and illumination makeup. The stimuli for
this experiment are 26 color digital photographs selected from the Berkeley Segmentation
Dataset and Benchmark[10]. The photographs include animals in the wild, flowers,
boats, people, statues, and so forth.

19
Figure 4. Representative stimuli for Experiment 3.
See Figure 4 for representative examples. As in Experiment 2, stimuli were displayed
using an overhead LCD projector to a total of four subjects. For Experiment 3 subjects
were given the additional instruction that if an object had a very complex shape, it would
be acceptable to simplify the outline, and that they should do whatever they found most
comfortable. For example, rather than tracing the legs of a horse individually, subjects
could simply sweep their gaze under all four hooves at once. For the most part subjects
did choose to simplify complex outlines. Aside from the stimuli used this was the only
difference between the three experiments.
2.4 Object Segmentation Using Eye Movements We will begin our exploration of gaze-based object segmentation by discussing
algorithms that take into account only the gaze information we collected, and ignore
information in the image itself.

20
The raw eyetraces collected from users in Experiments 1, 2, and 3 include many of the
previously described errors common to noninvasive eyetracking. Imperfect calibration is
evident in the form of small translational inaccuracies. Eyetraces are sometimes distorted
at the top and bottom extremes of images and are frequently interrupted by a blink, which
is then followed by random noise. We also found that subjects purporting to trace the
contours of an object often actually "cut corners" or exclude the edges of the area.
Anecdotally, the faster a subject completed his or her eyetraces, the more likely they were
to have cut corners. Most eyetraces were completed in 2-3 seconds; slightly longer times
were typical for complex outlines (wildlife), and shorter times for very simple ones (an
oval).
Due to the noise observed, the rectangular bounds of the eyetrace itself are often
poor indicators of the true spatial extent of the traced object. To generate a better
approximation of the region of interest represented by an eyetrace, we have developed the
following algorithm. Given a raw eyetrace in the form of a sequence of video frames
from the eyetracker scene camera and their respective PORs, the algorithm produces a
rectangular bounding box representing the hypothesized region of interest.
2.4.1 Algorithm
1. Filter the sequence of frames to remove all those recorded during or after a blink, as
these frames typically contain only erratic, misleading noise. (With the ISCAN ETL-500,
blinks typically appear as sudden jumps of the POR to (0,0)).
2. Interpret the PORs for remaining frames to define a (possibly self- intersecting)

21
polygon P.
3. Beginning with the smallest rectangle R that bounds P, iteratively “slide in” (by
STEP_SIZE pixels) the side of R which would result in a new rectangle excluding the
smallest possible area of P. Continue until R bounds only FRACTION percent of P's total
area.
4. Grow the resulting rectangle in accordance with its present aspect ratio until it contains
the POR for the first frame in the sequence.
5. Add a small pad of minimum thickness PAD pixels to the perimeter of the rectangle,
again in accordance with its present aspect ratio.
Our present implementation uses FRACTION=0.85, STEP_SIZE=1, and PAD=4.
However any similar numbers also work without significantly damaging performance.
The rationale for this bounding box “squashing” operation is as fo llows. Both our
limited conscious eye control and inherent measurement error set practical limits on the
precision of recorded eyetraces. For this reason most very sharp spikes are apt to
represent meaningless noise rather than an intentionally drawn object boundary. In the
sense that this algorithm penalizes long thin protrusions it can be likened somewhat to a
crude low-pass filter. The growing operation of step 4 arises from the observation that
subjects frequently begin their eyetrace with gaze fixed exactly on the target contour,
even if they diverged significantly later. Lastly step 5 attempts to reclaim the small
amount of legitimate object area that may have been excluded during the previous squash
operation, as well as compensate for many users’ tendency to “cut corners” or exclude a
region’s edges when tracing it.
2.4.2 Establishing Ground Truth by Manual Image Annotation

22
To facilitate a quantitative analysis of the results, an experimenter hand-marked
every test image with a rectangular bounding box G (the ground truth, or official
solution) tightly bounding the object the subject was asked to trace. Annotation was
performed using a lightweight piece of custom software. The software enables an
annotator to draw a box superimposed on the scene camera image using an ordinary
mouse with a crosshair cursor.
2.4.3 Results We assessed the overall quality of the algorithm's output rectangle R using the
measure
||||
RGRG
q∪∩
=
a ratio of the number of pixels enclosed in both rectangles to the total number of pixels
enclosed in at least one of the rectangles. Note the formula penalizes both misses—pixels
contained in the actual solution G but not the hypothesized solution R—and false
alarms—pixels contained in R but not G. In so doing this measure encompasses all
major factors by which two rectangles can be said to differ: x position, y position, aspect
ratio, total area, and so forth. The measure reaches its maximum of 1.0 only when the
ground truth and proposed solution are identical. It considers all proposed solutions that
do not overlap the ground truth at all (q=0.0) to be equivalently, and maximally,
unsuitable approximations. This behavior corresponds to the reasonable intuition that
all proposed solutions containing zero percent of the desired area are equally worthless.
Additionally the measure has the desirable properties of numeric stability (so it can be

23
meaningfully averaged, multiplied, etc.) and symmetry (allowing more efficient pairwise
comparisons among a group). The results are shown in Table 1:
Experiment no. Median quality q Number of subjects Number of trials
1 0.59 3 69
2 0.66 4 82
3 0.66 4 111
Table 1. Gaze-only results.
As can be seen from the table performance remains stable as image complexity
increases and is just as good for natural images as the intentionally simplified problem.
When combining eyetracking information with information in the image itself (as we will
describe in Section 4) the purely gaze-based algorithm represents a reasonable fallback
solution for complex images where bottom-up object segmentation techniques provide
little useful information. Figure 5 shows some results of this algorithm on stimuli from
the first two experiments.
24
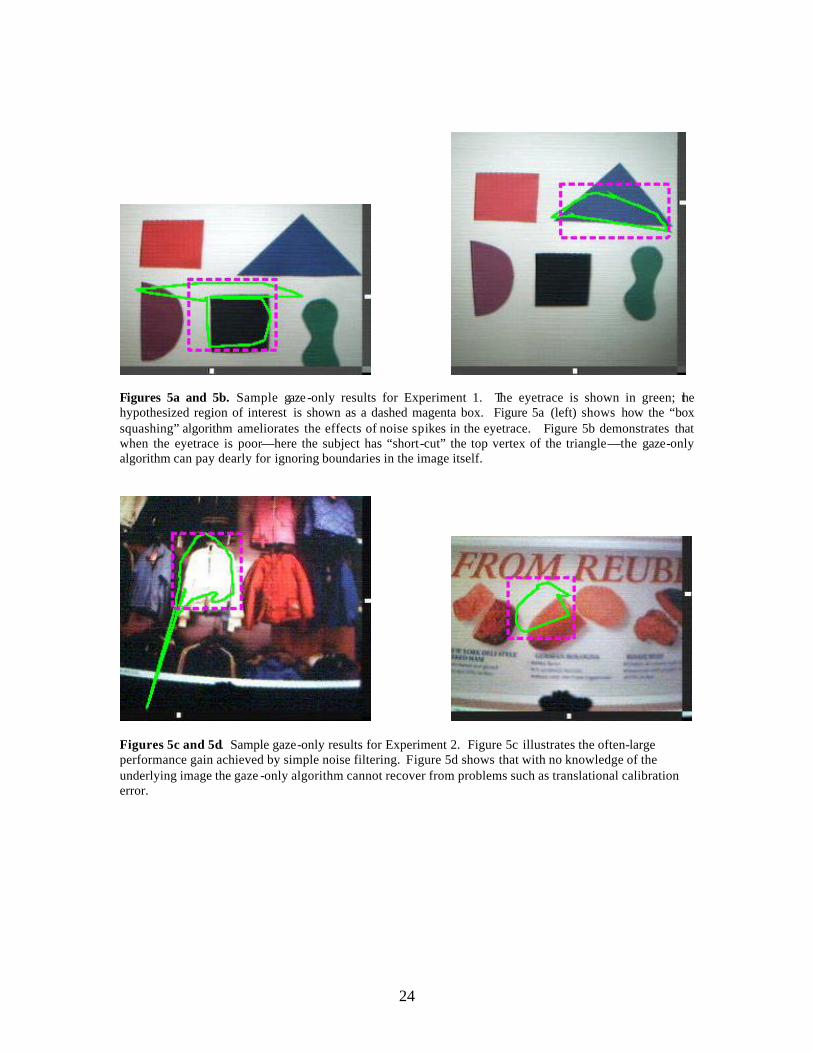
Figures 5a and 5b. Sample gaze -only results for Experiment 1. The eyetrace is shown in green; the hypothesized region of interest is shown as a dashed magenta box. Figure 5a (left) shows how the “box squashing” algorithm ameliorates the effects of noise spikes in the eyetrace. Figure 5b demonstrates that when the eyetrace is poor—here the subject has “short-cut” the top vertex of the triangle—the gaze-only algorithm can pay dearly for ignoring boundaries in the image itself.
Figures 5c and 5d. Sample gaze-only results for Experiment 2. Figure 5c illustrates the often-large performance gain achieved by simple noise filtering. Figure 5d shows that with no knowledge of the underlying image the gaze -only algorithm cannot recover from problems such as translational calibration error.

25
Chapter 3: Object Segmentation Using Computer Vision Generic object segmentation, i.e., parsing an arbitrary image into regions corresponding
to human judgments of object boundaries, is an unsolved problem of computer vision.
The lesser problem of robustly dividing an image into coherent regions based on color is
also surprisingly elusive. Although there are many approaches to this latter problem[11]
in general they are unreliable. Here we explore the behavior of one recent color-based
segmentation algorithm on our three data sets.
3.1 Hierarchical Image Segmentation
Kropatsch and Haxhimusa's hierarchical segmentation algorithm[12] produces from
an image and a seed point P a set of hierarchically related regions of points which contain
P. In other words, each region in the set contains all regions smaller than itself.
The algorithm proceeds in two main stages. The first stage performs connected
component analysis based on Saturation and Value channels in HSV space (Hue,
Saturation, Value). Hue is ignored due to image properties of the scene camera. For
every pixel in the image, the two-channel values are stored in a color map structure. The
color map is then scanned to find ten representative colors. The representative colors are
added incrementally and are chosen based on maximum distance from each previously
found representative color. Each pixel is then set to its nearest representative color, based
on its original color and proximity in SV space. Finally, connected component analysis is
performed to group locally adjacent regions of the same color.
The second stage of the algorithm performs graph contraction of the previously
found connected components. Each component is treated as a node in a graph, with edges

26
connecting adjacent regions in the graph. For a specified number of iterations, locally
adjacent nodes are grouped based on distance in SV color space. Grouped nodes are then
contracted to form one node while preserving the adjacency structure of the graph. This
iterative approach allows for multiple “levels” of segmentation and accounts for the
hierarchical nature of the results: each iteration of graph contraction potentially grows the
region containing P.
If we consider the seed point P to represent the current focus of a user's gaze, we
can interpret the set of regions produced by the algorithm as hypotheses regarding the
spatial extent of likely objects containing P. For example, if the user's point of regard
were resting on a coffee cup atop a table, segmentation level 2 might be the region of
points comprising the cup, and segmentation level 4, produced by two further iterations
of graph contraction, might be the region of points comprising the tabletop.
3.2 Evaluation Using the same three datasets as in the previous chapter, we performed an informal
evaluation. Looking ahead to the way eyetraces are employed in our combination
method (described in Section 4), to choose a seed point for running the algorithm on each
frame, we first calculated the centroid C of the eyetrace polygon and chose a random
point M on eyetrace polygon itself. We then used as a seed the point 1/3 the distance
from C to M. As expected the algorithm performed well on for the colored construction
paper blobs of dataset 1. However given the more realistic datasets of Experiments 2 and
3 viewed through the eyetracker's scene camera, performance was quite erratic. The
algorithm produces only connected regions, but these regions are typically irregular in

27
shape and often sprawled across regions of the image containing unrelated parts of the
scene. Additionally small translations of the seed point can dramatically change the
results.
These issues notwithstanding, strong agreement between adjacent segmentation
levels and nearby seed points is often evident. And though the irregular regions
themselves seldom correspond to human intuition, often the bounding box of at least one
hypothesized region does. That the results, broadly taken, still contain obvious structure
despite being generally poor and individually unreliable raises the idea of using cross-
hierarchical agreement to help distinguish stable regions from noise. If a particular
hypothesis is generated by multiple nearby seed points it is likely to specify a genuine
region.
Even so, problems remain: first, if several hypotheses recur in the respective
hierarchies of nearby points, the algorithm offers no principled way to choose among
them. Second, at the highest level of segmentation (after many graph contractions) the
hypothesis generated will be the same almost regardless of seed point; namely, it will be
the region containing every point in the image. To figure out the extent of the region that
is important to the user, we don’t just need cross-hierarchical agreement—we need cross-
hierarchical agreement on a good hypothesis.

28
Chapter 4: Object Segmentation By Combining Eye Movements and Computer Vision
4.1 The Fusion Method
We have discussed two very different algorithms for inferring the spatial extent of a
particular object in an image. Each of these approaches has both significant strengths and
substantial shortcomings. Object segmentation via eyetraces alone provides a clear
picture of user intent and generally good performance even for very complex images, but
can be derailed by correlation factor errors, calibration problems, accidental overshoot,
and other phenomena. Hierarchical image segmentation can exploit color information in
the image itself to produce a set of hypotheses regarding the location of objects possibly
containing a given point. But it provides no principled way to choose among these
hypotheses, which are themselves inherently unstable and non-robust with respect to
real-world data.
We have developed a technique which we call the fusion method which combines
top-down information about the user's intent (derived from eyetraces) with bottom-up
information about the structure of the image itself (derived using the hierarchical
segmentation algorithm.) When the source images contain visual structure sufficient for
hierarchical segmentation to offer at least some good hypotheses, the fusion method
provides a principled way to choose among them, and usually performs much better than
either method independently. When hierarchical segmentation generates no agreed-upon
hypotheses consistent with the gaze data, the fusion method falls back to the gaze-only
solution.

29
The fusion method runs hierarchical segmentation multiple times beginning at a
number of seed points derived from the eyetrace. Then it performs similarity-based
grouping among the results to obtain a list of self-similar hypothesis groups. Finally, it
calculates a prototypical (average) bounding box for each group, and selects as its answer
the prototypical box most similar to the gaze-only solution computed as in Section 2,
provided it passes a minimum similarity threshold. A detailed description of the
algorithm follows.
4.2 Algorithm 1. Filter the sequence of frames to remove all those recorded during or after a blink.
2. Calculate the gaze-only solution for the eyetrace as in Section 2. This is the query box.
3. Calculate the centroid C of the eyetrace polygon.
4. Choose a subset of the frames on which to run the hierarchical segmentation algorithm.
Our present implementation uses ten evenly spaced frames (the first and the last of the
sequence, plus eight frames between, spaced as evenly as possible), but results are fairly
insensitive to this number.
5. For each of the frames to be segmented, choose a seed point part way down the line
connecting C and the point of regard for that frame. The present implementation chooses
seed points 1/3 of the way from C to the point of regard.
6. Apply a mild Gaussian blur to the frames that will be segmented. This is purely to
help the segmenter overlook small noise in the image. The present implementation
applies a 5-pixel Gaussian blur. Blur size is not critical.
7. Apply the hierarchical segmentation algorithm to the chosen frames using the
calculated seed points.

30
8. Collect a single master list of hypotheses (each a list consisting of all points in the
hypothesized region) generated by the algorithm. For example, if segmenting each of 10
frames to segmentation levels 1, 2, 3, 4, and 5, this list of candidate hypotheses will be 10
* 5= 50 elements long.
9. Divide the horizontal and vertical pixel range into NBUCKETS total rectangular
buckets. Create a length NBUCKETS vector v for each region, setting vi to the number of
points of that region contained within bucket i. Finally, for each unique pair of regions
compute and store the chi-square divergence
∑≠∈
−=
0
2)(),(2
iki i
iix k
khkhD
of their respective vectors h and k. The present implementation, which operates on 320 x
240 pixel eyetracker images, uses 20 buckets in the x-direction and 20 buckets in the y-
direction, such that NBUCKETS=400 and each bucket is 16 pixels by 12 pixels in size.
10. Use the pairwise similarities previously calculated to divide the hypotheses into non-
overlapping groups. The present implementation uses a single-pass clustering algorithm
similar to that of Hill[13]. No two hypotheses with chi-square divergence greater than
the empirically chosen value of 200 may be placed in the same group. Modest variations
in this number do not affect final results much.
11. Compute a prototypical bounding box for each group by averaging the bounding
boxes of its hypotheses.
12. Return the prototypical bounding box with highest similarity quotient q >= TOL to
the query box that is also not implausibly small (presently, less than 400 total pixels;

31
results are not very sensitive to this number). If no such bounding box exists, return the
query box itself, that is, the gaze-only solution as calculated in step 2. TOL for the
present implementation is 0.375.
4.3 Algorithm Rationale It is an obvious idea to increase the reliability of an unreliable algorithm by running
it multiple times and looking for regularities. However without seed points from the
same object, multiple runs of the hierarchical segmentation algorithm are not likely to
yield any regularities at all. Of course, if we knew which pixels in the image were and
were not from the same object, we would already have an object segmenter and thus no
need for seed points.
The eyetrace gives us a way out of this quandary: it is a statement of human
judgment that all points interior to the eyetrace belong to the same object. Yet, if this
statement were free of all noise and error, it would also be the desired object segmenter
and we would never need to examine the image itself. In this way the fusion algorithm
performs mutual disambiguation with two noisy data sources.
After grouping hypotheses and computing prototypes for each group (steps 8-11
above), we have the results of what is essentially a more robust, self-reinforcing
hierarchical segmentation algorithm. Small amounts of noise or a seed point landing
outside the region of interest are unlikely be disastrous to performance. However,
without the eyetrace we still have no principled way to choose between alternatives
generated by this more robust segmenter. In this context the eyetrace is regarded as a
noisy statement of human judgment regarding spatial extent of the region of interest. By
eliminating much of the noise from this statement (as in Section 2) and using it to guide

32
the choice of segmentation results, the fusion method arrives at a region consistent with
information from both the human user and the image itself.
The fusion algorithm falls back to the gaze-only solution when no hypotheses of
about the right size are found. The TOL parameter, or winner tolerance, defines what is
meant by “about the right size”. It describes the maximum amount of deviation we are
willing to accept between the output of the gaze-only algorithm and the final output of
the fusion method. In essence setting TOL=0 means “always use the best image-based
solution, no matter how far it strays from the gaze-based solution” and TOL=1 means
simply “always use the purely gaze-based solution”. The setting of TOL is a tradeoff.
The lower TOL is, the more dramatic the improvement fusion can achieve over the gaze-
only algorithm when the image provides helpful information. But a low setting for TOL
also means the fusion method can be led further astray by poor segmentation hypotheses.
This is the only parameter for which modest changes produce noticeable differences in
the fusion method's final results. That said, over all trials, TOL values ranging between
0.375 and 0.6 demonstrated roughly equivalent aggregate performance.

33
Figure 6. Sample run of the fusion algorithm.

34
4.4 Example
Figure 6 is a pictorial illustration of one complete run of the fusion algorithm.
From the original image and its recorded eyetrace we first find the gaze-only solution as
in Chapter 2, pictured at top. We then use the eyetrace to calculate seed points for the
hierarchical segmentation process. Although the present implementation segments from
ten seed points, due to space constraints we only show three, which appear in white.
Each seed point gives rise to a column of segmentation hypotheses, one for each
segmentation level. In the figure we show the actual regions hypothesized by
segmentation levels 1-5 in bright green. Note that there is significant agreement among
hypotheses for both neighboring segmentation levels and neighboring seed points. We
divide the 15 total hypotheses into similarity groups to capture the essence of this cross-
hierarchical agreement. In this example there happen to be five groups of hypotheses,
indicated with red in the diagram. The level 1 segmentation for seed point 3 comprises
its own group because it is too dissimilar to every other hypotheses to share in a group.
We then calculate a prototype for each group by averaging the bounding boxes of its
member hypotheses. Finally, we look for the group prototype whose bounding box most
closely matches the gaze-only solution. In this case, it is the prototype for group 3. We
return its bounding box as the final solution of the fusion algorithm.
4.5 Results
By using gaze-based and image-based analysis techniques to complement one
another, the fusion algorithm was able to succeed in many instances where both

35
techniques separately failed--particularly on dataset 2, the retail displays.
Figure 7. Median performance by algorithm for each experiment.
Experiment no. Eyetrace q Fusion q Number of subjects Number of trials
1 0.59 0.88 3 69
2 0.66 0.83 4 82
3 0.66 0.63 4 111
Table 2. Fusion results.

36
As can be seen3 from Table 2 the fusion algorithm vastly outperformed the
gaze-only algorithm for both datasets 1 and 2. Performance on dataset 1 was
exceptionally strong. This was expected because the brightly colored shapes of paper are
usually segmented cleanly by Kropatsch and Haxhimusa's original algorithm, thus
providing the fusion method with several high-quality hypotheses. Figure 8 shows some
typical results. There were few failures; those that did occur were typically caused by a
very poor eyetrace which landed the majority of seed points on the wall itself, rather than
the colored region.
Figure 8. Sample fusion results for Experiment 1. Eyetraces are shown in green, the gaze-only solution is shown as a dashed magenta box, and the output of the fusion algorithm is in blue. Using the color structure of the images the fusion algorithm was able to overcome these inaccurate eyetraces to achieve an excellent solution.
For dataset 3, the gaze-only method had slightly higher median accuracy than the
fusion method. Although there were many natural images for which the fusion method
bested the gaze-only method--see Figure 9 for some striking examples--there were
3 By way of interpretation it should be noted that achieving a perfect score of 1.0 entails identifying the extent of the desired region down to the very last pixel. In all three datasets, but especially sets 2 and 3, region borders are frequently unclear, and certainly are not sharp to single-pixel accuracy. A score of 0.90 or greater is very good.

37
slightly more instances in which the underlying segmenter generated misleading
hypotheses bounds nonetheless sufficiently similar to the gaze-only results to be accepted
as the final output. See Figure 10. Given the typically poor results of the underlying
segmenter on such images this too was expected.
Figure 9. In these two natural images from Experiment 3 the hiera rchical segmenter discovered enough color structure to successfully override a translational calibration inaccuracy (left) and a relatively imprecise eyetrace (right).
Figure 10. Interesting failure modes for Experiment 3. At left, the eyetrace intended to capture the cabin instead captured its roof, a much stronger color region. The natural image at right illustrates a problem inherent to color-based object segmentation; the algorithm has no notion that the soldier’s white face and gray helmet are both part of the same object. It may be possible to address this issue with a region unification algorithm.
In several cases results illustrated the limitations of object segmentation based on
colored regions. For example, we understand the white face of the soldier in Figure 10b
and his dark gray helmet to be part of the same object, but as regions of color they are

38
clearly distinct. One future direction for segmenting complex objects would be the
development a "unification" stage that selectively merges previously discovered regions
of color within the scope of the eyetrace.
Far more interesting and significant are the results for dataset 2, the real- life retail
displays. The median segmentation accuracy for items such as shirts, pants, jackets, and
bologna is nearly as high as that for brightly-colored blobs of construction paper on an
empty wall. While imperfect (see Figure 11) these numbers suggest that the fusion
method is a promising step toward the goal of an eye-driven interface enabling users to
"copy and paste" images of environmental objects into electronic storage. Figure 12
shows the prototype succeeding on two trials of the specific motivating problem of
enabling AAC users to import images of, and therefore
discuss, specific items in a retail setting.
Figure 11. Failure mode for Experiment 2. The eyetrace correctly suggests only the pink shirt at left should be in the region of interest. However attracted by the strong color similarity of the red shirt on the right, the fusion algorithm places both shirts in the region of interest. This situation could be prevented by setting a tighter allowable tolerance between the gaze-only solution and the output of the fusion algorithm.

39
Figure 12. Sample segmentation results for Experiment 2. The algorithm successfully discovers the
spatial extents of the red and blue jackets.
40
Chapter 5: Contributions
We have presented a prototype object detection system that combines top-down
information about a user’s judgments and intent, derived from eyetracking data, with
bottom-up information about the color structure of an image into a single, more robust
segmentation result consistent with both data sources. Using a fusion of gaze-based and
image-based information, our prototype, Flycatcher, achieved higher object detection
accuracy on certain classes of real-world data than approaches based on either signal
alone. Related technical contributions of this work are algo rithms for processing
“eyetraces” of an object into an approximation of the object’s bounds and increasing the
robustness of image-based hierarchical segmentation through cross-hierarchy agreement.
Flycatcher illustrates the broader idea that unobtrusively leveraging human expertise,
e.g., through gaze analysis, can add a great deal of power to human assistive computer
systems. This may be particularly true of systems in traditionally difficult areas of image
processing.
As an experimental eye-driven interface for high-availability wearable photography
Flycatcher also represents a step toward “copy and paste” style visual memory
augmentation and the simplified acquisition and communication of ideas in visual form,
particularly for the speech disabled. Toward that end we are working to integrate
Flycatcher into an experimental assistive communication device under development at
Northeastern University[14].

41
References
1. Eurotechnology Japan K.K. Camera phones: Disruptive innovation for imaging (market and trend report, 4th version), January 14, 2004. 2. Roy, D.K., Ghitza, Y., Bartelma, J., & Kehoe, C. Visual memory augmentation: Using eye gaze as an attention filter. Submitted 2004. 3. Gulens, M. (December 2000) The AAC Mentor Project at Penn State University. Retrieved July 2004 from http://mcn.ed.psu.edu/~mentor/Public/aac.html 4. Ross, M.G. and Kaelbling, L.P. A systematic approach to learning object segmentation. NIPS 2003 Workshop on Open Challenges in Cognitive Vision, December 2003. 5. DiMattia, P., Curran, F.X., and Gips, J. An eye control teaching device for students without language expressive capacity: EagleEyes. Edwin Mellen Press, 2001. 6. Ware, C. and Mikaelian, H.H. An evaluation of an eye tracker as a device for computer input. In J.M. Carroll & P.P. Tanner, eds, CHI + GI 1987 Conference Proceedings, SIGCHI Bulletin, ACM, pp. 183-188. Special issue. 7. Canon Advantage Eye Controlled Focus. (n.d.) Retrieved July 2004 from http://consumer.usa.canon.com/ir/controller?act=CanonAdvantageTopicDtlAct&id=2649
8. IBM Almaden Research Center: Creating computers that know how you feel. (n.d.) Retrieved July 2004 from http://www.almaden.ibm.com/cs/BlueEyes/index.html 9. Yarbus, A.L. Eye Movements and Vision. Translated by Basil Haigh. Plenum Press: New York, 1967. 10. Martin, D. and Fowlkes, C. (November 12, 2003) The Berkeley Segmentation Dataset and Benchmark, retrieved June 2004 from http://www.cs.berkeley.edu/projects/vision/grouping/segbench/ 11. Forsyth, D.A. and Ponce, J. Computer Vision: A Modern Approach. Prentice Hall, 2002. 12. Kropatsch, W.G. and Haxhimusa, Y. Grouping and Segmentation in a Hierarchy of Graphs. Proceeding of the 16th IS&T/SPIE Annual Symposium, 2004. 13. Hill, D. A Vector Clustering Technique. Mechanised Information Storage, Retrieval and Dissemination, North-Holland, Amsterdam, 1968. 14. Patel, R. and Pilato, S. A Visually-Oriented, Context-Engaged Language Learning and Communication Aid.

42
Appendix A: Subject Instructions for Experiments In this experiment you will help test an eye-driven interface for designating important regions in a scene. The experiment consists of one set of approximately 20 trials. In each trial, I will show you an image with the overhead projector and briefly describe an area of the picture. Your job is to cut out the area by tracing an outline of the region with your eyes. Press the spacebar once when you begin tracing, and once as you finish. The trials will be separated by several seconds apiece. Your signal to proceed will be my reading the next description. When you are waiting between trials feel free to look wherever you choose. Throughout, there is no pressure to proceed either very fast or very slow; move your eyes naturally and comfortably.


![Streaming Hierarchical Video Segmentationjcorso/pubs/jcorso_ECCV2012_streamgbh.pdf · streaming hierarchical video segmentation framework that leverages ideas from data streams [24]](https://img.dokumen.tips/doc/110x75/5be36a3509d3f20a668b58cb/streaming-hierarchical-video-jcorsopubsjcorsoeccv2012streamgbhpdf-streaming.jpg)