Embed Size (px)
Citation preview
Techniques of Water-Resources Investigations of the United States Geological Survey
Chapter Al2
FLUOROMETRIC PROCEDURES FOR DYE TRACING By James F. Wilson, Jr., Ernest D. Cobb,
and Frederick A. Kilpatrick
BOOK 3
APPLICATIONS OF HYDRAULICS
Revised 1986

FLUOROMETRICPROCEDURESFORDYETRACING 15
Photomultiplier
A photomultiplier is a special vacuum tube that detects incident radiation and amplifies the resulting electronic signal. The photomultiplier tube used in most fluorometers is sensitive primarily to the blue and UV end of the spec- trum, while the rhodamine WT and pontacyl pink dyes fluoresce primarily in the orange range. However, some of the standard tubes are very sensitive to the red wavelengths, which accounts in part for a wide variation in sensitivity among instruments. Red-sensitive photomultiplier tubes are available for some fluorometers. The fluorometer manufacturer should be contacted concerning the availability and installation of such tubes if they are de- sired. The sensitivity of the red-sensitive photomultiplier tube can be as much as three to five times that of the standard tube.
Range control
Most fluorometers have a means of manually controlling available sensitivity. In the Turner model 111, this control is accomplished by a range selector between the lamp and the pri- mary filter (see fig. 8). The four positions are called 30x, 10x, 3x, and 1 x , indicating their approximate relative sensitivity. For example, the 30x scale gives a reading approximately three times as high as the reading on the 10X scale for the same fluorescent sample. How- ever, the true relationship between the scales varies among instruments. Average values for a group of four instruments were found to be 19X, ‘7.6x, 2.8x, and IX when the far-UV lamp was used. There is evidence that these ratios vary with intensity of lamp output.
Sensitivity, or range control, is electronically adjusted in the FLM/AMINCO fluorocolorime- ter by use of multiplier and fine-adjust controls. The multiplier control is used to select one of seven ranges of sensitivity available in the measuring circuit. These scales of relative in- tensity are as follows: X 100, X30, X 10, X3, x 1, x .3, and x . 1. All scales are exact multi- ples. For example, when the 0 to 0.1 (X .l) scale is selected, 0.1 is full scale. When the multiplier switch is changed to the 0 to 1.0 (X 1) scale, 0.1 is one-tenth of full scale and indicates the same relative intensity. This allows background to be suppressed on the most sensitive scale and to
*emain suppressed on all scales. This, along with the fact that scales are exact multiples, is fery useful during calibration when performing precision analysis.
Other fluorometers have similar manual con- trols for sensitivity. Some fluorometers, such as the Turner Designs model 10 fluorometer, pro- vide for optional automatic selection of sensitiv- ity scale-a useful feature for continuous sampl- ing.
Preferred systems
For general use with rhodamine WT or pon- ;acyl pink dyes, a preferred system for use lyith the Turner model 111 fluorometer consists If either the standard door, high-sensitivity kit, and far-UV lamp or the standard door without the high-sensitivity kit but with the green T-5 lamp. In either system, the 546- and 590- nanometer filters should be used. Equivalent lamps and filters should be used with other Buorometers. The Turner Designs “rhodamine accessory kit” contains the proper lamp and filters for the Turner Designs model 10 fluorometer. The FLMlAMINCO also has a “rhodamine kit” for use with its fluorocolorime- ter. Other fluorometers may not have high-sen- sitivity kits or may have other means of in- creasing sensitivities. For maximum sensitivity with the flow-through door, the green T-5 lamp is recommended, as the high-sensitivity kit is not part of this door. It is not necessary to modify the FLM/AMINCO’s fluorocolorimeter or the Turner Designs model 10 with a high- sensitivity kit as these instruments have the needed sensitivity built into them.
The high-sensitivity kit should not be used when using acid yellow 7 because the fluorome- ter is quite sensitive to this dye and the high- sensitivity kit may enhance background fluores- cence too much. For use with acid yellow 7, the far-UV lamp, the 2A and 47B filters (used as a primary filter), and the 2A-12 flter (used as a secondary filter) are preferred. \
Accessory equipment
Temperature-control apparatus
Because fluorescence depends on tempera- ture, all fluorometer readings must be either
16 TECHNIQUES OF WATER-RESOURCES INVESTIGATIONS
taken at or adjusted to a common temperature. Except for very precise work-discharge mea- surements, for example-special equipment for controlling temperature usually is not neces- sary. The procedures for minimizing the need for temperature corrections and for making such corrections are discussed elsewhere in this manual.
For the Turner model 111 fluorometer, the rather high temperatures generated by the lamp and other components can make it difficult to obtain readings not affected by warming of the samples. The best apparatus for very close control of sample temperature is the constant- temperature fluorometer door. The standard door is easily removed for replacement by the constant-temperature door, which takes the same cuvettes as the standard door and comes equipped with the high-sensitivity kit. Circulat- ing water is used to cool a copper block sur- rounding the cuvette. Sample temperatures are held to less than 3°F (2%) higher than the cir- culating temperature, minimizing the effect of the compartment temperature, which usually is very high (near lOO”F, or 38°C). Because small pumps tend to warm the circulating water, it is generally preferable to divert water directly from a tap. This procedure also allows for pre- cise regulation of the circulation temperature, but difficulties can arise if the tapwater temper- ature is unstable. For measuring discharge by dye dilution or for accurate determinations of dye recovery, the constant-temperature door has a distinct advantage. For most time-of-tra- vel and dispersion measurements, the standard door is adequate, provided significant tempera- ture differences are either avoided or accounted for in the data used.
Both field and standards samples should be brought to a common temperature before labo- ratory analysis. This can be accomplished by al- lowing all samples to come to room tempera- ture or by placing all sample bottles in a con- stant-temperature bath.
For temperature control in a laboratory setup with the Turner model 111 fluorometer, the constant-temperature door should be used when analyzing samples that have been brought to room temperature. For best results, the temperature of the circulating water in the door should be adjusted to that of room temper- ature. Another excellent setup is to combine
the constant-temperature door with a constant- temperature bath: Samples can be stored in the bath before testing and the bath water circu- lated through the fluorometer door.
The sample compartment in many fluoromet- ers, such as the Turner Designs model 10, and the FLM/AMINCO fluorocolorimeter, i;s pro- tected from the heat-producing components of the fluorometer. Thus, there is no need to pro- vide temperature control for the sample while it is in the fluorometer, although the Turner Designs model 10 has an optional sample holder designed for temperature control. Neverthe- less, regardless of fluorometer used, all samples need to be brought to a common temperature prior to sample analysis.
Portable power supplies
Most fluorometers require l&volt ahernat- ing current, 60 cycles per second. For dependa- ble, consistent results, commercial-line power should be used. In the laboratory there is no problem; in the field there may be outlets at motels, gas stations, public and private build- ings, picnic grounds, boat docks, and gaging stations. Often, however, fluorometers must be used al; sites where commercial power is not available. Portable power supplies, although to be used as a last resort, can be extremely help- ful if properly used.
The best portable power sources for the Turner model 111 fluorometer and the FLM/ AMINCO fluorocolorimeter are gasoline-driven generators. Generators may be used for either single or continuous (flow-through) sampling, and al,so for operating additional appliances such as lights or an electric pump. A 1.5- kilowat,t generator is usually adequate. If the Turner model 111 is used, a constant-voltage transformer should be placed on the line be- tween the generator and the fluorometer to smooth out variations in generator output that might affect fluorometer readout. Such varia- tions are nearly always present even though they are not apparent in the output of other ap- pliances; serious variations have occurreId with some generators, preventing consistent fluorometer readings. The constant-voltage transformer should be used only wit.h the fluorometer to protect the fluorometer :and to prevent overloading the transformer. A con- stant-voltage transformer is not needed with

FLUOROMETRIC PROCEDURES FOR DYE TRACING 17
l the FLM/AMINCO fluorocolorimeter or the Turner Designs model 10.
pling point or of the dye profile along a traverse with a boat-mounted fluorometer. In addition to a fluorometer, basic equipment includes flow- through fittings for the fluorometer, intake and discharge hoses, a portable pump, a power sup- ply, and a strip-chart recorder.
Another portable power source for the Turner model 111 fluorometer is a storage bat- tery with electronic converter (inverter), excel- lent for quick “tailgate” setups of short dura- tion. The converter, which converts direct cur- rent to alternating current, is connected to the battery by jumper cables. As a precaution, al- ways keep cigarettes and open flames away from wet-cell batteries to avoid the possibility of igniting battery fumes.
A constant-voltage transformer should al- ways be used between the converter and the Turner model 111 fluorometer. However, the drain on the battery is considerable, and even with fresh batteries and constant attention to conservation, readout trouble and a dead bat- tery may occur. An alternating-current voltme- ter is a very useful accessory for monitoring the condition of the system. When a drop of 2 volts or more in transformer output is observed, the system should be shut down immediately and the battery recharged. If the battery of an au- tomobile is used, running the vehicle’s engine during operation of the fluorometer will help, but it will not keep up entirely with the drain on the battery. Intermittent use of the system is the best procedure. The data obtained using this procedure can be considered only approxi- mate because of inadequate fluorometer war- mup time. The Turner model 111 requires at least a l-hour warmup time for analytical stabilization, the Turner Designs model 10 about 5 minutes, and the FLM/AMINCO fluorocolorimeter about 10 minutes.
Some fluorometers require less power and are more readily adapted to field requirements than others. For example, the Turner Designs model 10 fluorometer can operate directly from a 12-volt storage battery, 115 volts, or 230 volts alternating current. The current demand for the fluorometer, when operating from a 12-volt battery, is only 2 amperes. An external power converter and a constant-voltage transformer are not necessary with this piece of equipment.
Continuous-sampling equipment
Continuous sampling is strictly a field opera- tion and is used primarily to obtain a continu- ous record of the passage of dye at a fixed sam-
A flow-through door is used in place of the standard door on the Turner model 111 fluorometer. The green T-5 lamp provides needed sensitivity when using the flow-through door. The outside of this door has standard gar- den-hose fittings to which intake and discharge hoses are attached. Some other fluorometers have other means of converting the unit for flow-through operation. With the Turner De- signs model 10, for example, the front plate is removed to gain access to the single-sample fittings, which are easily replaced by the flow- through fittings. With any fluorometer, opaque plastic garden hose or other opaque nonadsorp- tive tubing, such as polyethylene, should be used for the intake line.
If line power is available, an electric pump may be used. Alternatives are an electric pump with a generator, a gasoline-driven pump, or a battery-driven direct-current pump. If a generator is used to power both a fluorometer and a pump, the pump should be connected on a line separate from that for the fluorometer and the constant-voltage transformer. It is best to place the pump on the intake side of the fluorometer. This placement will reduce the likelihood of air bubbles forming from dissolved oxygen and passing through the cuvette, a phenomenon often mistaken for air leakage in the system; this is a common problem on cold, oxygen-saturated streams. Air bubbles can cause inconsistent and erratic readings. The use of extremely small hoses and fittings also can cause dissolved oxygen to come out of solution and form bubbles and, hence, cause operational difficulties.
Water may leak around various fittings if pressures in the flow-through system are high. Discharge lines from the fluorometer should be kept short to reduce back-pressure. Also, pumps should be sized to produce a good rate of flow through the system without creating ex- cessive pressure in the system. The system should be checked for leaks with the pump run- ning, but before the fluorometer has been turned on.

18 TECHNIQUESOF WATER-RESOURCES INVESTIGATIONS
A recorder can be used with most fluoromet- ers. Special electrical outlets for this pm-pose are provided on most fluorometers.
Fluorometer Operation
General procedure in the laboratory
As a general rule, samples should be analyzed as soon as possible after they are collected to minimize possible deterioration of fluorescence due to other chemicals or substances present in the water. In the absence of such substance, sam- ples may be retained for weeks without loss of fluorescence strength, providing they are in non- sorptive containers protected from light.
Preparations
The basic steps in preparing the samples and the fluorometer for sample testing are as follows: 1. Prepare samples. For best results, stream
samples should be allowed to stand overnight to stabilize the temperature, to settle out any suspended matter, and to allow dissolved oxygen to come out of solution. High turbid- ity may require centrifuging or a longer settling time. Always protect samples from sunlight. Standards samples and background samples should be treated in the same man- ner as river samples, being allowed to come to the same temperature as the stream sam- ples.
2. Check lamp type. Use the far-UV lamp or the green T-5 lamp with rhodamine WT or pon- tacyl pink and the far-UV lamp with acid yel- low 7.
3. Check filter placement. The primary filters (green for rhodamine WT and pontacyl pink and dark blue for acid yellow 7) must be placed between the lamp and the sam- ple. The secondary filters (orange and blue, with the blue filter nearest the sample, for rhodamine WT and pontacyl pink, and dark yellow for acid yellow 7) must be placed be- tween the sample and the photomultiplier tube. For consistent orientation, place a mark, if none exists, in a corner of all filters and always position the filters in the
fluorometer so that the mark is in the lovver right-hand corner.
4. Check location and position of fluorometer. Unless the fluorometer is completely light- shielded by the manufacturer, the fluorometer will need to be externally shielded from direct or strongly reilected sunlight. It should also be placed in ,a loca- tion that is not expected to experience rapid changes in air temperature. Place the fluorometer on a level, firm base. Allow room for air circulation, especially if the in- strument has a cooling fan. For exrample, don’t operate a fluorometer on a car seat as the cushion may restrict a bottom cooling fan.
5. Hook up constant-temperature door, if used. Start circulation of cooling water with door removed to avoid damage due to unex- pected leakage.
6. Plug in fluorometer cord; have all panel switches off.
7. Turn on fluorometer. Various fluorometers have different means of doing this. The Turner model 111 fluorometer has both a power and a start switch. The power switch must be turned on and then the start switch held in the “up” position for about 10 seconds to turn on the lamp and assure vaporization of the mercury. For this instrument, verification that the lamp is on should be made by observing the lamp through the primary filter. CAU- TION-Do not view the lamp directly; ul- traviolet rays can injure the eyes. If power is interrupted, even momentarily, the lamp has to be restarted.
Some fluorometers have a single “on” switch to start the fluorometer. Carefully check the instruction manual for the fluorometer being used for the appropriate startup procedure.
8. Allow adequate time for fluorometer warm- up. Different fluorometers require differ- ent warmup times. The Turner moadel 111 fluorometer requires at least 1 hour, and preferably 2 hours, to adequately stabilize the operating temperature. The Turner Designs model 10 fluorometer is supposed to be stabilized for most uses within 5 min- utes of startup. The FLM/AMINCO fluorocolorimeter requires about 10 min-

FLUOROMETRIC PROCEDURES FOR DYE TRACING 19
utes of warmup. For high-accuracy work, a 1 ‘7. Secondary Rayleigh, Raman, and Tyndall longer warmup time should be provided to allow the temperature of the filters to stabilize. When mercury lamps are used, the fluorometer should be allowed to cool off, when the instrument is turned off, be- fore restarting. The analysis of any sam- ples prior to complete warmup will provide only approximate data. Carefully check the appropriate manual for the warmup time required for any specific instrument.
Background readings I
Fluorometer readings for stream samples must be adjusted for the background readings for the streamwater in which the test was made and for the water used for preparing standard solutions for calibration. Although it contains no dye, the background may produce a positive fluorometer reading. This is especially true when filters for acid yellow 7 dye are being used. Background readings may be due to one or more of the following: 1. Light emitted by other fluorescent material
present in the water-always possible, but not usually a problem with rhodamine WT or pontacyl pink with the recommended filters.
2. Light leakage from outside the fluorometer. 3. Light scattered by turbidity of the sample.
Tyndall scatter occurs at about the same wavelength as the light reaching the sam- ple. High turbidity may cause some light to pass the 590 secondary filter; the 23A filter passes more of this kind of light and should not be used with turbid samples.
4. Light from the lamp passing straight through the filter system.
5. Light scattered or fluoresced by the filter or the sample holder. In dye tracing, these problems usually are not significant if prop- er precautions are taken.
6. Light scattered by the water. Rayleigh scat- ter occurs at the wavelength of light reach- ing the sample and is cut off effectively by either the 90 or 23A secondary filters. Raman scatter always occurs at wavelengths longer than those of the excit- ing light. With excitation at 546 nm, the 590 filter effectively cuts off the Raman spectrum of water; the 23A filter does not.
scatter peaks, as well as secondary fluores- cence peaks, which occur at wavelengths approximately double those of their respec- tive primary peaks. The 590 filter elimi- nates the secondary peaks; the 23A filter does not.
Set the dial to zero with the water used for preparation of the standards. Check and record the readings on all scales. Background readings for distilled water, even on the most sensitive scale, will usually be quite small. Without changing the zero setting of the fluorometer, test the stream background samples on all scales and record the readings. Some fluoromet- ers have a blank-suppression knob, used to reset the background reading to zero. If this is done, background is subtracted automatically from subsequent sample readings. Some users, however, prefer to manually subtract the back- ground component.
Sample testing
Accurate results will be obtained if consis- tency in fluorometer procedures are followed. The essential steps in testing samples in the fluorometer are as follows: 1. Rinse cuvette once with tapwater and (or)
with the solution to be tested, then fill to within about 0.25 in (6 mm) of the top with the solution to be tested. Wipe outside of cuvette with laboratory tissue. If air bub- bles are visible on the inside of the cuvette, dislodge them by gently tapping the cuvette. Handle cuvettes only near the top. Avoid spilling solution into the cuvette hol- der. For best results, use the same cuvette for testing all samples.
2. Insert cuvette in the fluorometer. Close the door gently but tightly to avoid spillage or, in the case of the Turner Designs model 10 or the FLM/AMINCO fluorocolorimeter, place the cap back over the cuvette com- partment.
3. Observe the dial reading after the dial has stabilized. A jittery dial (2 Y4 dial division) is normal for some fluorometers. For the greatest sensitivity, read each sample on the most sensitive scale possible. It is un- necessary to read every sample on every scale, although occasionally it may be de- sirable to read the same sample on two

20 TECHNIQUESOF WATER-RESOURCESINVESTIGATIONS
scales. Another practice sometimes em- ployed is to use only the most sensitive scale on which all samples can be read. If samples were fist analyzed in the field, reanalysis of the one containing the peak concentration will identify the scale that can be used for all of the sample set. This may also preclude calibration of the fluorometer on other than the scales actu- ally used.
16. Turn off the fluorometer before other appli- 0 antes to prevent sudden voltage surges through the fluorometer. Some fluoromet- ers are protected against such surges.
‘7. Clean and rinse cuvettes for storage. A min- ute residue of dye may form inside impro- perly cleaned bottles and cuvettles that. have contained high concentrations.
If the sample is warmed while in the fluorometer, which is the situation with the Turner model 111 fluorometer without the constant-temperature door, the dial will start to creep downward. The reading should be made before the warming be- comes effective. With some fluorometers, the response time may be slow, causing samples having higher dial readings to warm more than others. A degree of con- sistency can be obtained by always closing the door with the dummy cuvette in place between each sample analysis so that the dial returns to zero each time. Standards having the same dial reading will warm in a like manner, and thus the calibration will reflect the tendency for the higher reading samples to warm up. This is why consis- tency of technique in the analysis of both stream samples and standards usually will produce good results.
Special procedures in the fiel’d
Discrete sampling
In some applications of dye tracing, some or all samples are tested in the field, primarily as a guide to sampling, and retained for final test- ing lat,er in the laboratory. The purpose of re- testing is to minimize the effects of power fluc- tuations, turbidity, light leakage into the :8uororneter, and sample temperatures, all of ,which tend to be more variable in the field than :in the lab. However, if field tests will be consid- lered fnnal, special attention should be given to proper fluorometer warmup, sample-tempera- ture monitoring, and the other steps described in the preceding section.
Even if the samples are to be retested in the oi laboratory, the field-testing procedures are ba- ~ sically the same as outlined in the preceding section. The important differences are as fol- lows:
In the process of filling the cuvette from the sample bottle, settled solid materials may be agitated into suspension again. Oc- casionally one or more large particles will cause a high reading which will drop off rapidly as the particles settle again. Such a dropoff will usually appear immediately, whereas a dropoff due to warming of the sample usually follows a brief delay. If the former problem occurs, hold the cuvette outside the instrument (to prevent warm- ing) while the large particles settle to the bottom.
1. The site layout need not be elaborate. If the fluorometer is not internally shielded from external light, the fluorometer will have to
4. Record the reading. The fluorometer resolu- tion is about +l percent of full scale; read- ings to the nearest 0.5 to 1 percent should suffice.
be shaded. Tents, trailers, or bridges can be used to provide shade. It is best to pro- ~ tect the fluorometer from adverse weather conditions to the extent possible, even ~ though some fluorometers are watertight. I
2. Often the long warmup recommended for the I Turner model 111 fluorometer is not possi- ble. A 2-minute warmup may be used, I especially for a mobile setup, but a full I warmup is desirable if the samples are not to be retested in the laboratory. Data based on insufficient fluorometer warmup may be very inaccurate and should be so treated.
5. Occasionally check and record the distilled- 3. A wide range in sample temperatures may be water readings. Check the distilled-water found. Temperature corrections usually are reading again just before turning off the not necessary in the field if sample readings fluorometer. are used only as a guide to sampling. If field

FLUOROMETRIC PROCEDURES FOR DYE TRACING 21
readings are to be considered final, sample temperatures must be taken.
4. Samples from highly turbid streams may have high and variable background readings; fluorescence of the dye may be totally masked by the scattered light. In such a case, the flow-through door may be useless; single samples may have to stand for an hour or two before meaningful readings can be obtained. Air bubbles in water from cold, turbulent streams also may cause temporary interfer- ence in both flow-through and single-sample cuvettes.
5. All samples collected should be tested if pos- sible. Retain at least the first and last set of background samples obtained before the dye arrived at each site. Intervening back- ground samples may be discarded and the bottles reused. Usually, all samples con- taining dye should be retained for retesting in the lab.
6. A neutral-density filter may be used to ob- tain readings for samples that otherwise would be off the scale; usually the lo-per- cent neutral-density filter is adequate. Off- scale readings seldom will occur, except at sampling sites very close to injection sites.
Flow-through sampling
Flow-through, or continuous, sampling can be used in the field for many applications of fluorescence tracing. Flow-through sampling limits the use of a fluorometer to one point in one cross section (possibly more than one point if a system of multiple intakes and valves is used). Flow-through sampling requires a sus- tained power supply for the fluorometer and pump and continuous surveillance for break- downs and, for some fluorometers, for needed changes of scale.
The advantage of flow-through sampling is that a continuous strip-chart record is obtained. Continuous sampling is useful when a very complete time-concentration curve is needed or as a guide to sampling. It also is useful for un- attended monitoring, provided the fluorometer has an automatic scale-change feature, such as that of the Turner Designs model 10. It should be noted that generally the strip-chart record represents both a field test and a final test. Some important points are listed below.
1. For some fluorometers, commercial power or a gasoline-driven generator should be used; the pump and fluorometer are too great a load for sustained use with a battery con- verter. However, fluorometers with rela- tively low power requirements operate very well with a 12-volt battery.
2. The recorder is powered through the fluorometer. The fluorometer dial on most or all instruments operates whether or not the recorder is turned on. The recorder reading occasionally should be compared with that of the dial and differences noted on the chart. The manufacturer’s instruc- tions on operation of the recorder should be on hand in the field.
3. Use opaque plastic garden hose or polyethylene tubing on the intake side; rubber has a strong affinity for the dye. Light leakage into the fluorometer has oc- curred when clear hoses were used. Be sure garden-hose connections have washers.
4. Use the most sensitive scale possible; moni- tor for necessary scale changes.
5. Flow-through setups must be prepared in time to test and record stream background readings before the dye arrives at the in- take hose. In streams with very heavy sus- pended loads, the background count from scattered light may totally mask fluores- cence. Under such conditions, the flow- through method should not be used; grab sampling will permit settling of the sus- pended material and accurate analysis sub- sequently in the laboratory.
6. Occasionally check and record the water temperature near the intake or at the dis- charge hose. Temperature corrections for the recorded data may be necessary.
7. Occasionally mark watch time and a dial reading on the recorder chart for possible corrections; some recorders have event markers useful for this purpose.
8. Occasionally collect grab samples from the discharge hose for later retesting and cor- relation with chart readings. Key the grab samples to the chart record (Hubbard and others, 1982, p. 13). The correlation will be more accurate when concentrations are not changing rapidly.
22 TECHNIQUES OF WATER-RESOURCES INVESTIGATIONS
9. The flow-through fluorometer may be boat- mounted, along with a battery or generator, as needed, for use in spatial sampling. The setup will give continuous longitudinal or lateral profiles of the dye concentration at the depth of the intake. A pipe or hollow airplane wing strut may be attached to the side of the boat to hold the intake hose in place. The length of the in- take hose should be kept to a minimum to minimize lag and dispersion in the hose. Special attention will be needed in the field to adequately define the boat location for correlation with the fluorometer readings.
Troubleshooting
A fluorometer is a surprisingly durable in- strument, even in the field, although it is less likely to cause trouble if it is never moved from the laboratory bench. Preventive maintenance of a fluorometer is not necessary, but it is good practice to avoid rough treatment. In the field, instruments should be carried on the back seat or floor of a car and padded to prevent sudden shifting.
Excessive heat and frequent starting and stopping of the fluorometer may damage or burn out some electrical components, especially the main lamp. Assure proper ventilation at all times and leave the fluorometer on as long as practical-all day in the laboratory, for exam- ple. It also is good practice to keep the operator’s manual with the fluorometer at all times and to be sure that all operators are aware of the section on troubleshooting con- tained in the manual.
Operating difficulties due to malfunction of instrument components seldom occur and are usually not difficult to correct. The most com- mon indicator of trouble is the dial; it may move radically or not all. Some of the things to check, not necessarily in the order given, are as fol- lows: 1. Is the lamp on? 2. Is the power source adequate? A drop in
power input is a constant threat when using a battery and converter.
3. If the dial will not drop from the off-scale position, try a smaller aperture, a neutral- density filter, or a weaker sample. For the Turner model 111 fluorometer, check the
reference lamp by following instructions in thLe operators manual, replace the main lamp, and test all radio tubes (the latter are easily removed from the back of the fluorometer). Replacements should be the slightly more expensive industrial grade tubes, if possible. If the dial runs rapidly upward when the door is opened, thle cutoff switch inside the door latch is not working properly.
If none of the above procedures work, it may be necessary to return the instrument to the manufacturer; some adjustments and repairs (for example, light-pipe adjust- ment, alignment of optics, or replacement of the photomultiplier tube), are too difficult for most local repair shops. The schematic electronic diagram in the manual should be provided if the work is dlone loc- ally. If in doubt concerning the ability of a local shop to do the needed work, return the instrument to the manufacturer.
Fluorometer Calibration Fluorometer readings are relative vialues of
fluorescence intensity. To convert readings to concentrations of a fluorescent solute, it is neces- sary first to calibrate a particular fluorometer using standards, or prepared solutions of known concentration. A calibration is simply the relation of fluorometer readout units to dye concentra- tion.
Fluorometer readings alone can be used in some applications. The exact relation between each of the fluorometer scales used would have to be known (to convert all readings to a common scale); for computations of dye recovery OI strearn discharge, a series of precise dilutions of the injected solution would be necessary t,o obtain equivalent readings on the scale used.
Although dye concentrations may not be neces- sary for some types of data analysis, it is neces- sary t.hat concentrations be determined and re- ported in accordance with Geological Survey pol- icy. Such data are necessary for assurance that concentration values are below the maximum al- lowable levels prescribed in current policy state- ments. Also, because dial readings reflect the in- dividual characteristics of the particular fluorometer used (even among those of the same brand), data from two or more fluorometers can
FLUOROMETRIC PROCEDURES FOR DYE TRACING 23 be compared only on the basis of readings for known concentrations.
Concentration units
The Geological Survey’s standard practice in reporting results of water analyses is to use mil- ligrams per liter (mg/L) or micrograms per liter (kg/L) for dissolved constituents. Weight-per- volume units are assumed to be equivalent to weight-per-weight units if the solution contains less than 7,000 mg/L dissolved solids (specific conductance less than about 10,000 pmhos).This relationship is a convenience in preparing stan- dard solutions volumetrically.
Below 7,000 mg/L dissolved solids, 1 mL of water is considered to weigh 1 g. Selected units are defined as follows:
1 kilogram (kg) = 1,OOOgrams (g) 1 g = 1,000 milligrams (mg)
Img = l,OOOmicrograms(~g) 1 liter(L) = 1,000 milliliters (mL)
1 mL water = 1 cubic centimeter (cm”) 1 mL pure water = 1 g at 4°C
lmgperkg=lmgperL=lpartper million ippm)
1 kgperkg=l pgperL=lpartper billion (ppb)
To illustrate, 1 g of pontacyl pink (powder) dissolved in 1 billion mL of final solution (distil- led water diluent) is 1 kg/L. One mL of rhodamine WT solution (20 percent by weight, specific gravity 1.19) dissolved in 1 billion mL of final solution is 0.238 kg/L (1 mLxO.20 g/ gxl.l9xlO-’ = 0.238~10“). Concentration values may be rounded for easier handling. A convenient procedure for most applications is to round to three significant figures above 1 pg/L and to the nearest hundredth below 1 pg/L. (Example: 2,380, 238, 23.8, 2.38, 0.24, 0.02.) However, for very precise work such as dis- charge measurements, use three significant figures for all concentrations.
Preparation of standard solutions
Dye standards-solutions of known concen- tration-should be prepared in a laboratory. Al- though most investigators will prefer to use a volumetric method of preparing standards as described below, a weighing method may also be used. Weighing is required with powdered
and may be used with dye solutions.
Weights may replace volumes in the dilution equations given later. Specific gravity of the new solution must be considered if the new sol- ution has a concentration greater than 7,000 mg/L.
Equipment and supplies
Standards are prepared by diluting the dye (liquid or powder) used in the test. Distilled water or chlorine-free tapwater should be used for the dilution process in preparing standards. Never use fresh chlorinated tapwater. Tapwa- ter will normally lose its chlorine if allowed to stand in an open container for about 12 hours. The use of streamwater for standards is advo- cated by some investigators as a means of can- celing any reactions to the dye that may be oc- curring in the stream due to foreign substances or chemicals. Such reactions are not necessarily duplicable in the bottles, and hence this prac- tice for this purpose is not recommended. In addition to dye and water, the following equip- ment is suggested:
1. Volumetric transfer flasks without stoppers (to be used for measuring diluent amounts for transfer to suitable containers) a. 2,000 mL b. 1,000 mL
500 mL i. 250 mL
2. Graduated cylinders a. 500 mL b. 250 mL c. 100 mL
3. Volumetric pipets (“to contain” type) with squeeze bulb or length of flexible extension tubing a. 10 mL b. 20 mL
:. 25 mL 50 mL
4. Large-mouth Erlenmeyer flasks in l,OOO- and 2,000-milliliter sizes (about a dozen l- gallon glass condiment jars may be substi- tuted)
5. Wash bottles 6. Glass sample bottles about 1 oz in size 7. Laboratory towels or wipes 8. Laboratory soapless cleaner and brushes 9. Fluorometer and appropriate accessories
LO. Disposable laboratory gloves

24 TECHNIQUES OF WATER-RESOURCES INVESTIGATIONS
Glass equipment is preferred. Rubber and polyethylene are known to absorb dye; do not use rubber stoppers in flasks. Note whether each pipet used is rated “to contain,” which means that the solution left in the tip must be included in the measurement by blowing out, or “to deliver,” which means that the amount re- maining in the tip is not included in the mea- surement. “To contain” pipets are preferred; the viscous nature of the dye solution obtained from the manufacturer may cause an error in volume from the “to deliver” type of pipet.
A squeeze bulb or a piece of flexible tubing attached to the top of the pipet should be used for pipetting to avoid sucking the dye into the mouth.
The use of volumetric flasks and graduated cylinders as mixing containers is discouraged. These flasks not only are difficult to clean but allow no extra room for agitating and mixing. Volumetric flasks and graduated cylinders should be restricted to measuring the desired quantities of chlorine-free water into separate containers. Large-mouth beakers, Erlenmeyer flasks, or plain l-gallon (3,785- milliliter) condi- ment jars, which can be obtained from most restaurants, are large enough to allow easy mixing of dye and water, are strong and dura- ble, can be obtained at little or no cost, and can be easily cleaned with laboratory detergent and water. The mixing of dye and water in these l- gallon jars can be accomplished by oscillating the jar and contents in a circular manner while keeping it firmly against a table or countertop. This avoids the use of stirrers, which must be cleaned.
Serial dilution procedure
The process of preparing dye standards for calibrating a fluorometer involves step-by-step reduction of the stock dye solution used in the test by known dilutions until concentrations on the order of those occurring in the stream are reached. This is generally known as a serial-di- lution process. For each step of a serial dilu- tion, the new concentration may be computed as
cn=cl [&]=wG [&I , (1)
where Cj = initial concentration, C, = new concentration after
one dilution step, S, = specific gravity of the
initial dye solution, V, = pipet volume of the dye solution, V, = volume of the added diluent, and W, = weight of the dye or of the
initial solution. Where the specific gravities are nearly 1.00, the following formula may be used:
(2)
The dilution factor, Dj, is computed asi shown following equation 4 and is the amount of dilu- tion o’f Cj for any one step in the serial-dilution process.
Rhodamine WT, as supplied by the manufac- turer., has a concentration of 20 percent by weight. At least a four-step serial dilution is re- quired to obtain standard concentrations in the range needed. Thus, the concentrations of final standards obtained by a four-step serial dilution may be computed by the equations
Step 1 Step 2
c,=c,s G [&],+&I2
Step 3 Step 4
or
C,=C,S, D,xD,xD,xD, , (4) where the terms are as previously defined ex- cept that C,= iinal concentration of the
standard obtained after the fourth step,
C, = concentration of the dye solution, usually as obtained from the .manufacturer,
Di = .a dilution factor at step i equal to
, and

FLUOROMETRICPROCEDURESFOR DYE TRACING 25
Table 2,Aonvenient three-step serial dilutions for preparation of working solution
Dye used in test
I Serial dilutions I I I-irst I Second I Third
1 vd I (mL)
v, 1 vd (mL) I (mL)
V" I v
I Working I solution, .
(mL) I (mif) VW I ln 'g'L hL) I I I I I
Rhodamine WT 3,792 i 20 3,500 i 20 3,500 i 100 (20 percent; 2,585 I 20 SG 1.19) (cl I
3,000 I 20 100 20 2,068 I 20 3,000 I 20 xi I 100
(d) 1 20 1,158 I 10 2,000 I 10 21000 I 100 I I I
i 1 wd ; (9)
VW 1 vd VW i vd VW 1 (mL) I (mL) (mL) I (ml-1 (mL) I
I I' Pontacyl pink and acid Is! I
lo 3,218 I 20 3,500 I 20 3,500 I 100
55 2,188 I 20 3,000 I 20 3,000 I 100
yellow 7 (cl I 1,233 I 10 2,000 I 10 2,000 I 100
(powder) I I f 1
a V, = the pipet volume of the dye solution for each step.
For the various dyes normally used, table 2 provides a range of convenient pipet and di- luent volumes to obtain “working solutions” by a three-step serial dilution. It will be noted that volumes, VW, for the first dilution are uneven, in order to compensate for the specific gravities of the different dyes so as to yield even concen- trations for the “working solution.” Such a pro- cedure simplifies subsequent dilution computa- tions and lessens chances of errors. This “work- ing solution” is used for all fourth or final stan- dards. It may be retained for future use where the same dye lot is to be used. Thus, the first three serial dilutions need not be repeated every time a dye test is performed from the same dye lot. This “working solution” should be sealed and stored out of direct light.
Because rhodamine WT, as supplied by the manufacturer, is quite viscous, small-volume measurements are apt to be in error. For this reason, the smallest pipet volume suggested for the first dilution is 20 mL; use a “to contain” type of pipet if available.
It is customary practice to vary the pipet vol-
a ume, V,, and diluent volumes, VW, in step 4
sufficiently to obtain a range in final standard concentrations. Table 3 provides a range of con- venient pipet and diluent volumes for the fourth dilution step to provide a complete range of final standard concentrations. Even volumes were employed to the extent possible for both convenience and to lessen potential measure- ment errors. Normally, all concentrations pro- vided would not be needed; those desired would merely be chosen from table 3. Judicious use of table 3 will often permit the use of only one or two pipets for the fourth-step dilutions, lessen- ing cleaning and handling problems as well as potential errors. For convenience, table 3 also provides for recording fluorometer readings during the calibration process.
The application of tables 2 and 3 in preparing dye standards is illustrated by the example in figure 10. Assume a time-of-travel test using rhodamine WT 20-percent dye has been per- formed and river concentrations are such that a Auorometer calibration covering concentrations from 1 to 25 pg/L is desired.
The steps in preparing dye standards for the example are described below. If C, is rhodamine WT 20 percent, the concentration that exists after the third dilution is 100 pg/L.

26 TECHNIQUES OF WATER-RESOURCES INVESTIGATIONS
Table 3.4onvenient fourth-step dilutions for preparing dye standards using a 1 OO-micrograms-per-liter working solution
kinal standard I V I v I (mdL) I (A
I Ffmhndard I F I uorometer number I concentration tug/L) I Scale
i Background I --- 1 --- 1 -.. I I I I i
I 1 2a I I 300 200 I I 100 200 I I 7, 50 I I I I I I b I 250 I 250 I I I I
3a I 100 I 150 I 413 I I I b I 200 I 300 I I I I I I
4 I 100 I 233 I I I I 5a I so I 150 I
45 3 I I I F-I
b I 100 I 300 I I I I 6a I 50 I 200 I 2r3 I I I
I b I 100 I 400 I I I I I I C i 125 i 500 i I I I
7a I 50 I 283 1 7b I I I I b I 100 I 566 I I I I I 8a I 20 I 180 I 10 I I I
b I :;
I 225 I
I C I 450 I d I 100 I 900 I I
I I I I
/ 9a b I I 20 25 I I 230 288 I I 8 I I I
C 50 I 575 I I I I I I 10a I 20 I 313 I 6 I I I
b 25 i 392 i I C 50 I 784 I I I
/ lla I 20 I 380 1 5 I I I b C I Ei
I 475 I I 950 I I I I I
12a I 20 I 480 I 4 I I I b I 25 I 600 I I I I
i C i 50 i i ,200 i I I I Ed I 20 1 641 1 3 I I I
b 25 I 808 1 C 50 I 1,617 I
14a I 10 I 490 I 2 I I I b C d
/ 15a b C I 1 25 20 10 I I I 2,475 1,980 990 I I I . I I
16a I 5 I 620 I . I I I b 10 I 1,240 I C 20 I 2,480 1
I d 25 I 3,100 1 17a I 5 I 828 I . I I I
b 10 I 1,657 1 C 20 I 3,313 I
1Ba I 5 I 995 I . I I I b I 10 I 1,990 I I I I
I 19 5 Il~-sm , I . I I I

FLUOROMETRIC PROCEDURES FOR DYE TRACING 27
DILUTIONS
1st 2nd 3rd (Working solution)
20 mL of cs
4th
(Standards)
20 mL 20‘mL 20 mL 20 mL 20 mL
SAMPLE a NUMBER
b C 6a 7a 6a 1Oa 12a 14b 15b
CONCENTRATION, pg/L 100 26 15 10 6 4 2 1
Figure 1 O.-Example of the use of tables 2 and 3 in preparing a set of standard solutions of rhodamine WT.
This is frequently referred to as the “working solution.” 1. Measure all diluent quantities before add-
ing dye. a. Based on line c for rhodamine WT,
table 2, measure 2,068 mL, 3,006 mL, and 3,000 mL of chlorine-free water into separate containers.
b. Based on table 3, in a like manner, measure VW volumes of water into seven separate containers to provide standards of 25, 15, 10, 6, 4, 2 and 1 pg/L as shown in figure 10.
2. Label the containers a, b, c, 5a, 7a, 8a, lOa, 12a, 14b, and 15b, as shown in figure 10, or by the concentration of the contents.
3. Label the sample bottles with the appropri- ate concentration values for the standard solutions 5a through 15b as listed in step 2 and shown in figure 10.
4. Pipet 20 mL of the rhodamine WT ZO-per- cent dye used in the test into container a and mix thoroughly. Cleanse pipet thor- oughly.
5. Pipet 20 mL from container a into container b and mix thoroughly. Cleanse pipet thoroughly. Continue until the “working solution” of 100 p,g/L is obtained on the third dilution.
6. Using 50- and ZO-milliliter pipets, add these amounts as appropriate to containers 5a through 15b. Note that the same ZO-milli- liter pipet may be used repeatedly for the fourth-step dilutions without cleaning each time.
7. Agitate all of the final solutions until each is thoroughly mixed. Do no use the pipet to stir solutions as this may introduce con- tamination. If containers are oscillated with a circular motion while being held firmly against the tabletop, spillage is less apt to occur and mixing will be accomplished.
8. Starting with the standard of smallest con- centration, pour into the previously labeled sample bottles.
9. Retain working solution in an airtight bot- tle that has been clearly labeled; store in a dark place for future use.
10. Analyze standards on fluorometer and re- cord dial readings in conventional man- ner. Treat standard samples in a manner similar to the river samples. For exam- ple, allow the standard samples to stand overnight in the same room or place them in a bath having the same temperature as the river samples.
28 TECHNIQUES OF WATER-RESOURCES INVESTIGATIONS
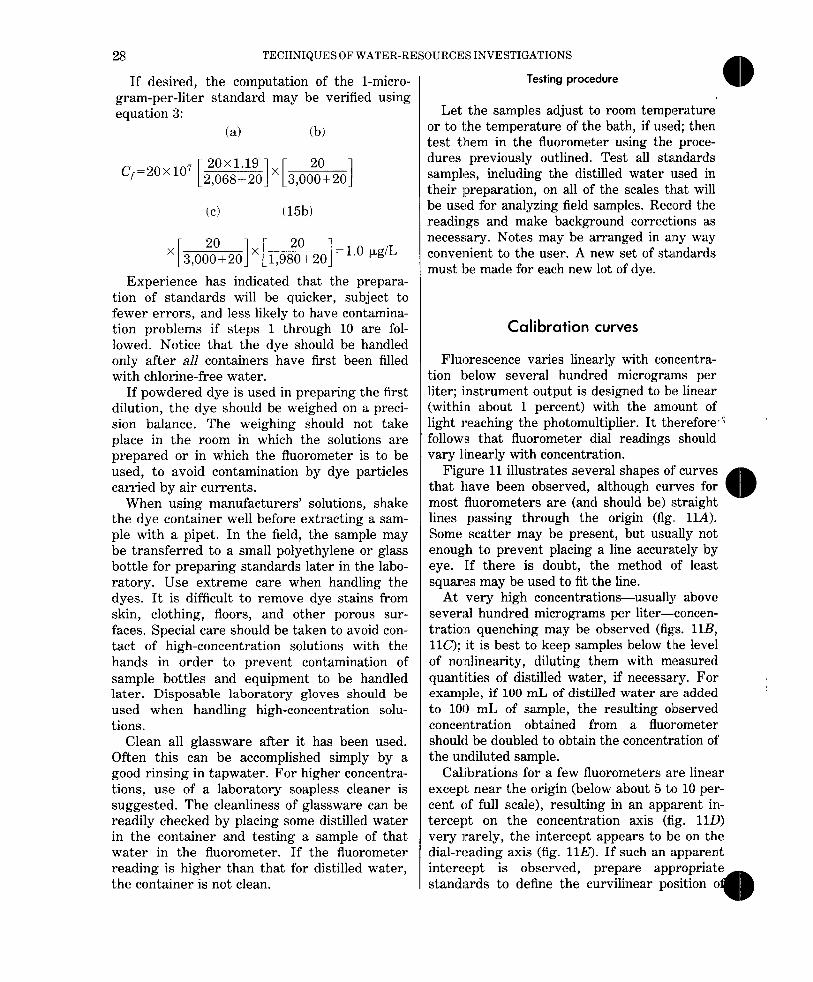
If desired, the computation of the l-micro- gram-per-liter standard may be verified using equation 3:
(a)
Cc)
(b)
’ [ 3,0::+20]
(15b)
20 1,980+20 I
=l.O JJgiL
Experience has indicated that the prepara- tion of standards will be quicker, subject to fewer errors, and less likely to have contamina- tion problems if steps 1 through 10 are fol- lowed. Notice that the dye should be handled only after all containers have first been filled with chlorine-free water.
If powdered dye is used in preparing the first dilution, the dye should be weighed on a preci- sion balance. The weighing should not take place in the room in which the solutions are prepared or in which the fluorometer is to be used, to avoid contamination by dye particles carried by air currents.
When using manufacturers’ solutions, shake the dye container well before extracting a sam- ple with a pipet. In the field, the sample may be transferred to a small polyethylene or glass bottle for preparing standards later in the labo- ratory. Use extreme care when handling the dyes. It is difficult to remove dye stains from skin, clothing, floors, and other porous sur- faces. Special care should be taken to avoid con- tact of high-concentration solutions with the hands in order to prevent contamination of sample bottles and equipment to be handled later. Disposable laboratory gloves should be used when handling high-concentration solu- tions.
Clean all glassware after it has been used. Often this can be accomplished simply by a good rinsing in tapwater. For higher concentra- tions, use of a laboratory soapless cleaner is suggested. The cleanliness of glassware can be readily checked by placing some distilled water in the container and testing a sample of that water in the fluorometer. If the fluorometer reading is higher than that for distilled water, the container is not clean.
Testing procedure
Let the samples adjust to room temperature or to the temperature of the bath, if used; then test them in the fluorometer using the proce- dures previously outlined. Test all standards samples, including the distilled water used in their preparation, on all of the scales that will be used for analyzing field samples. Recsord the readings and make background corrections as necessary. Notes may be arranged in any way convenient to the user. A new set of standards must be made for each new lot of dye.
Calibration curves
Fluorescence varies linearly with concentra- tion below several hundred micrograms per liter; instrument output is designed to ble linear (within about 1 percent) with the amount of light reaching the photomultiplier. It therefore.: follows that fluorometer dial readings should vary linearly with concentration.
Figure 11 illustrates several shapes of curves that have been observed, although curves for most fluorometers are (and should be) straight lines passing through the origin (fig. HA). Some scatter may be present, but usually not enough to prevent placing a line accuraltely by eye. If there is doubt, the method of least squares may be used to fit the line.
At very high concentrations-usually above several hundred micrograms per liter-concen- tratio:n quenching may be observed (figs. llB, 1lC); it is best to keep samples below the level of nonlinearity, diluting them with mleasured quantities of distilled water, if necessary. For example, if 100 mL of distilled water arts added to 100 mL of sample, the resulting oloserved concentration obtained from a fluorometer should be doubled to obtain the concentration of the undiluted sample.
Cal:ibrations for a few fluorometers are linear except near the origin (below about 5 to 10 per- cent of full scale), resulting in an apparent in- tercept on the concentration axis (fi.g. 110 very rarely, the intercept appears to be on the dial-reading axis (fig. 11E). If such an apparent intercept is observed, prepare standards to define the curvilinear

FLUOROMETRIC PROCEDURES FOR DYE TRACING 29
CONCENTRATION IC1+
A. Linear through origin (0) Theoretical and most observed. Defined by one point, but several points should be used.
b CONCENTRATION (CI --,
D. Linear except near base; apparent C-axis intercept.
Occasionally observed.
t t / $ s /' 8 z i z 8 iii 2 2 8 iii 2
0 0 CONCENTRATION lO-+ CONCENTRATION (Cl +
B. Nonlinear at high concentrations. C. Nonlinear die off. Caused by mild concentration quenching; Caused bv severe concentration concentrations in the nonlinear range should be diluted.
C=fD -bl/a
CONCENTRATION IC/ +
E. Linear except near base; apparent D-axis intercept
Rare; b usually small.
quenching or by overload on photomultiplier tube; samples
should be diluted.
CONCENTRATION (C/ ---+
F. Completely nonlinear.
Rare; difference from linear may or may not be significant. Fluorometer may require adjustment.
Figure 11 .-Types of fluorometer calibration curves.
the curve. G.K. Turner Associates (written commun., 1966) discovered that these two types of curves can result in the Turner model 111 fluorometer from incorrect alignment of the high-sensitivity kit installed on the standard door or as a part of the constant-temperature door. The problem, if serious, can be corrected by factory adjustment.
Complete nonlinearity (fig. 11F) has been found in some instruments; if the deviation from linearity is significant, return the fluorometer to the manufacturer for corrective action. However, if the high-sensitivity kit is used, a solution might be to remove the kit and
use a green T-5 lamp, as discussed previously in the section titled “Fluorometers.”
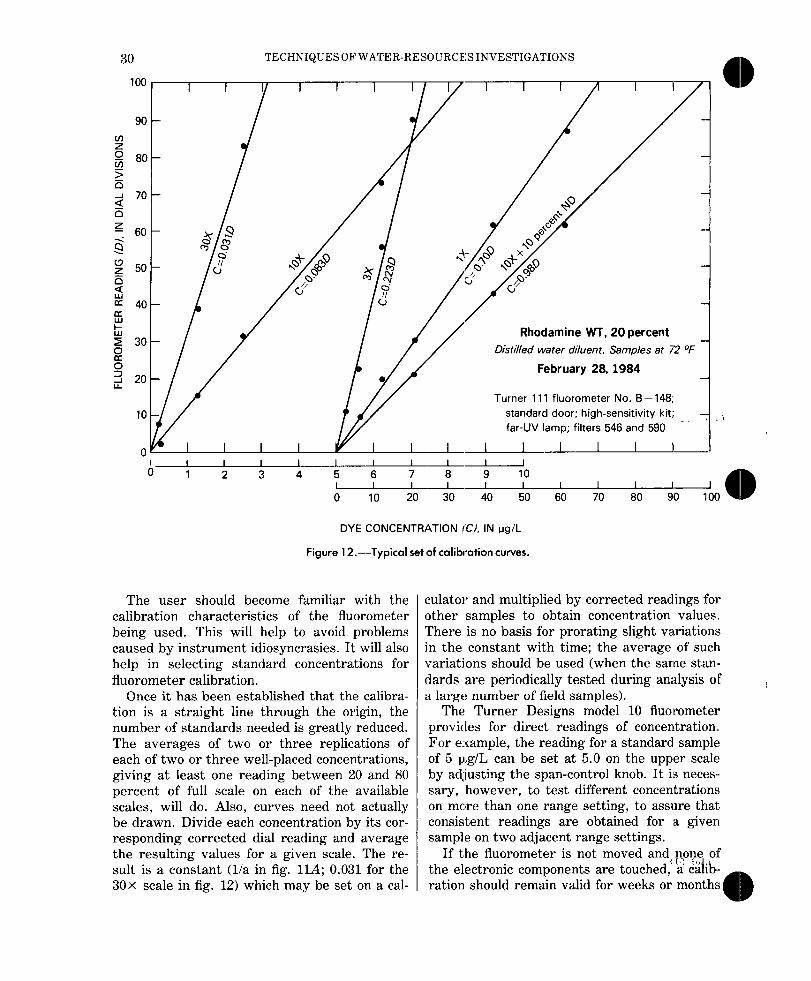
Plot the corrected fluorometer readings for the standards against their corresponding con- centrations on rectangular coordinates. An ex- ample of a set of calibration curves is given in figure 12. It is best to plot the curve for each fluorometer scale on a separate sheet for great- er plotting accuracy. On each curve, record the kind of dye, the dye lot, sample temperature, date, and fluorometer components and label the curves, as shown on the example. Label the axes in such a way that there can be no doubt about the units used.
TECHNIQUES OF WATER-RESOURCE23 INVESTIGATIONS
Rhodamine WT, 20 percent Distilled water diluent. Samples at 72 OF
February 28, 1984
Turner 111 fluorometer No. B-148; standard door; high-sensitivity kit; far-UV lamp; filters 546 and 590
3
I I I I I I b 1 2 3 4 5 6
I 7++0
-II ’ I I I I I
’ 0 10 20 30 40 50 60 70 80 90 100 0
DYE CONCENTRATION I%/, IN ug/L
Figure 12.-Typical set Iof calibration curves.
The user should become familiar with the calibration characteristics of the fluorometer being used. This will help to avoid problems caused by instrument idiosyncrasies. It will also help in selecting standard concentrations for fluorometer calibration.
Once it has been established that the calibra- tion is a straight line through the origin, the number of standards needed is greatly reduced. The averages of two or three replications of each of two or three well-placed concentrations, giving at least one reading between 20 and 80 percent of full scale on each of the available scales, will do. Also, curves need not actually be drawn. Divide each concentration by its cor- responding corrected dial reading and average the resulting values for a given scale. The re- sult is a constant (l/a in fig. 11A; 0.031 for the 30x scale in fig. 12) which may be set on a cal-
culator and multiplied by corrected readings fol other samples to obtain concentration values. There is no basis for prorating slight variations in the constant with time; the average of such variations should be used (when the same stan- dards are periodically tested during analysis of a large number of field samples).
The Turner Designs model 10 fluorometer provides for direct readings of concentration. For example, the reading for a standard sample of 5 p,g/L can be set at 5.0 on the upper scale by ad;justing the span-control knob. It is neces- sary, however, to test different concentrations on more than one range setting, to assure that consistent readings are obtained for a given sample on two adjacent range settings.
If the fluorometer is not moved and, p-one of the electronic components are touched,’ a cafib- ration should remain valid for weeks or months

FLUOROMETRIC PROCEDURES FOR DYE TRACING 31
of normal use. However, spot checks are desir- able. A different calibration will be needed for each dye lot used. Some of the more common causes of change in calibration are: 1. Jarring the fluorometer, as might be ex-
pected when it is used in the field. 2. Removing the lamp temporarily. 3. Changing the lamp or photomultiplier. 4. Damage to the lamp or photomultiplier. 5. Clouding and deterioration of filters with
time. 6. Changes in optical alignment. 7. Changes in temperature of standard sam-
ples. (Application of temperature-correc- tion factors will eliminate this problem.)
8. Contamination of the fluorometer with dye.
Calibration of the flow-through cuvette
Continuous sampling using the flow-through cuvette most often is used as just a guide for dis- crete sampling. If it is necessary to calibrate the flow-through cuvette, there are two ways to do it:
0
1. Correlate the flow-through readings on the dial or chart with readings for single samples collected at the discharge hose. Determine the concentration of these samples in the lab- oratory and use the data to develop a calibra- tion curve on or from the chart (Hubbard and others, 1982, p. 9).
2. Prepare large volumes of several standard sol- utions, pump them through the fluorometer, and record the readings. For this situation, river water may have to be used for both con- venience and to have standards at nearly the same temperature as that being pumped through the fluorometer. A container of “working solution” can be carried to the field to expedite preparation of these field stan- dards. If it is desirable to check calibration frequently in the field, the standard solution can be connected to the intake line with a sys- tem of T-connections and valves. When switching from stream to standard or back again, be sure to allow time for complete flushing of the water already in the system. Temperature corrections may have to be made in some instances.
The fn-st method is generally the easiest and bst satisfactory of the methods described. Be- y”
cause temperatures and potential contamination are more difficult to control with the second method, it is not recommended for most studies. Field calibrations generally should not be used when a high degree of accuracy is required.
Determination of Sample Concentration
The dial readings for final tests of a set of field samples are converted to concentration by three simple steps: (1) subtract background readings from readings for samples (unless background was suppressed with the fluorome- ter), (2) apply temperature-correction factors to the net readings, if necessary, and (3) convert the corrected readings to concentrations by ap- plying the calibration.
Because a uniform background value for all sampling sites is not likely, background samples should be collected at each site. Time variations in background also may occur but are often im- possible to monitor while dye is passing a site. Background readings usually should be sub- tracted before applying temperature-correction factors because most components of background either are not affected by temperature at all or are affected in a way different from the dyes. If standards and field samples have been brought to a common temperature and if reasonable care is taken, there will be no need for temper- ature corrections.
Aerial Photography as a Supplement to Fluorometry
In most applications of dye tracing, the dye cloud produced by either rhodamine WT or pontacyl pink remains visible for some time after injection-from a few hours to more than a day-during which it can be photographed. The visible color of acid yellow ‘7 disappears rather quickly and can be photographed only for a very short time after injection. While rhodamine WT or pontacyl pink is visible (above 25-50 pg/L), it can be photographed at ground level or from an aircraft. Photographs often yield useful supplementary information

32 TECHNIQUESOF WATER-RESC~URCESINVESTIGATIONS
about the spatial distribution of the dye cloud (Wilson, 1968a).
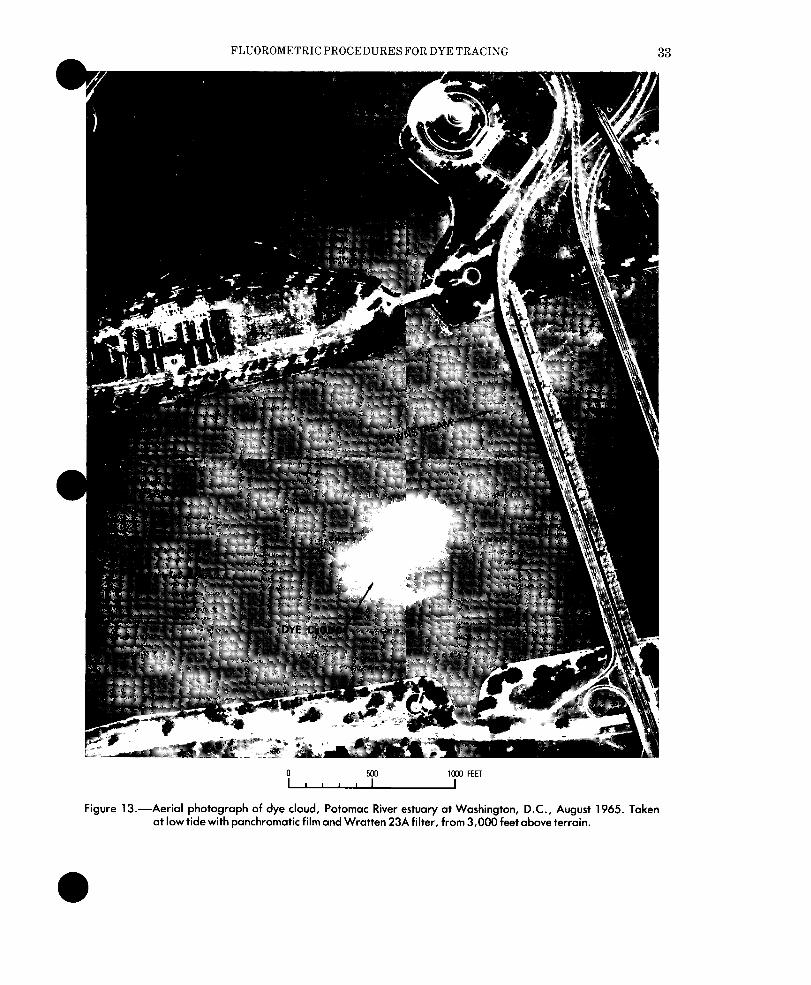
Color shots are both appealing and useful, but black-and-white photographs may be used to illustrate reports and are best for quantita- tive analysis. Black-and-white pictures are taken with panchromatic film and an orange, red, or deep-red filter. The result is a white dye cloud against dark water (fig. 13). Filters that may be used include Wratten 15 (G), 23A, and 25, and Corning 3-66.
Aerial photographs provide instantaneous synoptic views of the dye cloud and reveal de- tails of the shape of the cloud not usually dis- cernible from surface sampling data. Photoin- terpretation has potential use as a supplement to surface sampling in estuarine and reservoir studies but is limited to visible dye concentra- tions and to daylight hours. Ichiye and Plutchak (1966) demonstrated that there is an excellent correlation between film density and dye concentration using black-and-white photo- graphs of dye clouds. A densitometer is used to measure the relative magnitude of light trans- mitted through a film negative.
Selected References Abidi, S.L., 1982, Detection of diethylnitrosamine in nitrite-
rich water following treatment with rhoclamine flow trac- ers: Water Research, v. 16, p. 199204.
Andrews, C.L., 1960, Optics of the electromagnetic spec- trum: Englewood Cliffs, N.J., Prentice-Hall, 501 p.
Bailey, T.E., McCullough, C.A., and Gunnerson, C.G., 1966, Mixing and dispersion studies in San Francisco Bay: American Society of Civil Engineers Proceedings, v. 92, no. SA5, p. 2345.
Bowen, E.J., and Garlick, G.F.J., 1966, Luminescence: Inter- national Science and Technology, no. 56, p. 1829.
Buchanan, T.J., 1964, Time of travel of soluble contaminants in streams: American Society of Civil Engineers Proceed- ings, v. 90, no. SA3, Paper 3932,12 p.
Cobb, E.D., and Bailey, J.F., 1965, Measurement of dis- charge by dye-dilution methods: Unpublished report on file in Office of Surface Water, U.S. Geological Survey, Reston, Va.
Corning Glass Works, 1962, Glass color filters: Corning, N.Y., catalog, 25 p.
Davis, S.N., Thompson, G.M., Bentley, H.E.W., and Stiles, Gary, 1980, Ground-water tracers-A short review: Ground Water, v. 18, no. 1, p. 1423.
Dole, R.B., 1906, Use of fluorescein in the study of under- ground water, in Fuller, M.L., Underground-water pa- pers, 1906: U.S. Geological Survey Water-Supply Paper 160, p. 73-85.
Dunn, Bernard, and Vaupel, D.E., 1965, Effects of sample and fluorometer-compartment temperatures 011
fluorometer readings, in Geological Survey research 1965: U.S. Geological Survey Professional Paper 52&D, p. D225D22’7.
Eastman Kodak Company, 1965, Kodak Wratten filters for scientific and technical use: Rochester, N.Y., Kodak Pub- lication B3,77 p.
Feuerstein, D.L., and Selleck, R.E., 1963a, Fluorescent trac- ers for dispersion measurements: American Society of Civil Engineers Proceedings, v. 89, no. SA4, Paper 3586, p. l-21.
-196313, Tracers for dispersion measurements in surface waters: California University, Sanitary Engineering Re- search Laboratory, Berkeley, SERL Rept. 63 1,69 p.
Freeze, R.A., and Cherry, D.A., 1979, Groundwater: En- glewood Cliffs, N.J., Prentice-Hall, 604 p.
Harris, D.D., and Sanderson, R.B., 1968, Use of dye tracers to collect hydrologic data in Oregon: Water Resources Bulletin, v. 4, no. 2, p. 5168.
Hercules, D.M., 1966, Some aspects of fluorescence and phos- phorescence analysis: Analytical Chemistry, v. 38, no. 12, p. 29A43A.
Hubbard, E.F., Kilpatrick, F.A., Martens, L.A., and Wilson, J.F., Jr., 1982, Measurement of time of travel and disper- sion in streams by dye tracing: U.S. Geological Survey Techniques of Water- Resources Investigations, Book 3, Chapter A9,44 p.
Ichiye, Takashi, and Plutchak, N.B., 1966, Photodaensitomet- ric measurement of dye concentration in the ocean: Lim- nology and Oceanography, v. 11, no. 2, p. 364%:‘70.
Johnson, S. M., and Steinheimer, T. R., 1984, Potential for nit- rosamine formation resulting from the use of rhodamine WT for time of travel studies: A combined laboratory and field investigation: Preprint extended abstract for the 188th National Meeting of the Division of Environmental Chemistry, American Chemistry Society, Philadelphia, Penn., v. 24, no. 2, p. 70-71.
Kilpatrick, F.A., 1968, Flow calibration by dye-dilution mea- surement: American Society of Civil Engineers, Civil En- gineering, February 1968, p. 74-76.
Kilpatrick, F.A., and Cobb, E.D., in press, Measurement of discharge using tracers: U.S. Geological Survey Tech- niques of Water-Resources Investigations, Book 3, Chapter A16.
Parker! G.G., 1973, Tests of rhodamine WT dye for toxicity to oysters and fish: U.S. Geological Survey Journal Re- search, v. 1, no. 4, p. 499.
Pritchard, D.W., and Carpenter, J.H., 1960, Measurement of turbulent diffusion in estuarine and inshore waters: In- ternational Association of Scientific Hydrology Bulletin 20, p. 37-50.
Rathbun, R.E., Schultz, D.J., Stephens, D.W., and Tai, D.Y., 1977, Experimental modeling of the oxygen ab- sorption characteristics of streams and rivers: Proceed- ings of the International Association for Hydraulic Re- search, 17th Congress, v. 1, p. 483490.
Robinson, T.W., and Donaldson, Donald, 1967, Pontacyl bril- liant pink as a tracer dye in the movement of water in phreatophytes: Water Resources Research, v. 3, no. 1, p. 203-211.
0
FLUOROMETRIC PROCEDURES FOR DYE TRACING x?
Figure 13.-Aerial photograph of dye cloud, Potomac River estuary at Washington, D.C., August 1965. Taken at low tide with panchromatic film and Wratten 23A filter, from 3,000 feet above terrain.

34 TECHNIQUES OF WATER-RESOURCE:S INVESTIGATIONS
Scott, C.H., Norman, V.W., and Fields, F.K., 1969, Reduc- tion of fluorescence of two tracer dyes by contact with a fine sediment, in Geological Survey research 1969: U.S. Geological Survey Professional Paper 65&B, p. B164- B168.
Smart, P.L., and Laidlaw, I.M.S., 1977, An evaluation of some fluorescent dyes for water tracing: Water Re- sourcesResearch, v. 13, no. 1, p. 1533.
Stanbro, W. D., and Prych, D.A., 1979, Stability of rhodamine WT in saline waters: Water Resources Research, v. 15, no. 6, p. 1631-1632.
Udenfriend, Sidney, 1962, Fluorescence assay in biology and medicine: New York, Academic Press, 517~.
Umeda, Masao, 1956, Experimental study of xanthene dyes as carcinogenic agents: Gann, v. 47, p. 51-78.
Williams, R.T., and Bridges, J. W., 1964, Fluorescence of sol- utions-A review: Journal Clinical Pathology, v. 17, p.
371394. Wilson:, J.F., 1968a, Dye-cloud photography, in Chase, E.B.,
and Payne, F.N., compilers, Selected techniques in water resources investigations, 1966-67: U.S. Geological Survey Water-Supply Paper 1892, p. 3743.
--Y968b, Fluorometric procedures for dye tracing: U.S. Geological Survey Techniques of Water-Resources In- vestigations, Book3, ChapterA12,31 p.
Wright, R.R., and Collings, M.R., 1964, Application of fluorescent tracing techniques to hydrologic studies: American Water Works Association Journal, v. 56, no. 6, p. 748-754.
Yotsukura, Nobuhiro, and Kilpatrick, F.A., 19’73, Tracer simulation of soluble waste concentration: American So- ciety of Civil Engineers, Journal of the Environmental Engineering Division, v. 99, no. EE4, Proceedings Paper 9947, August 1973, p. 499-515.