Embed Size (px)
Citation preview
Fluorescence Imaging of Lubricants in Microtextured Bearings
by
Aswad Shiraz Manzoor
A thesis submitted to Imperial College London for the degree of Doctor of Philosophy
and Diploma of Imperial College (D.I.C.)
September 2009
Tribology Section Department of Mechanical Engineering
Imperial College London
2
Abstract
The work described here concerns the possibility that textured surfaces may reduce
coefficients of friction and increase load support within hydrodynamic bearings. This
topic is of particular interest in the context of the potential of texturing to reduce friction
in internal combustion engines using techniques adapted to suit high volume production,
such as Laser Honing. Despite the existence of a number of theoretical explanations
(which include shear rate reduction, inlet suction, effect of the presence of cavitation and
the mitigation of starvation) and numerous experimental reports as to the effect of
texture on friction, there has been no simultaneous study of friction, cavitation and oil
film thickness in textured hydrodynamic bearings. This is because such studies are
difficult. One must address certain barriers which include the large range of oil film
thicknesses encountered and the need for accurately known feature dimensions on the
surfaces in question.
A new test rig has been designed and constructed that enables the simultaneous
measurement of friction, load and oil film thickness. Novel features include a rotating
glass disc on a silicon pad, a high-sensitivity fluorescence imaging microscope system to
determine the oil film thickness and a non-contact displacement sensor for friction
measurement. The process of photolithography was used to accurately produce
predetermined textures on silicon surfaces. Tests were conducted on convergent plain
and textured silicon pads whilst concurrently monitoring friction, load, cavitation (if
present) and oil film thicknesses.
The results were compared to theoretical predictions based upon the solution of
Reynolds equation, with cavitation, in two dimensions. Results show broad agreement
with the theoretical predictions and suggest that textured surfaces may be either
beneficial or detrimental according to both their geometry and the operating conditions.

3
Acknowledgements
I would like to give profuse thanks to my supervisor Dr Andrew V. Olver for his
continual guidance and support during my studies. A special mention is also made for
Professor Hugh A. Spikes for giving me the initial opportunity to carry out this Ph.D. I
would also like to thank Mr Ian Pegg of Ford Motor Company for his encouragement
throughout the duration of this research and to Ford Motor Company for financial
support.
A most deserved mention is made for my esteemed colleagues Simon Medina and Mark
Fowell who have consistently been a source of inspiration for me when often faced with
times of rig-related dilemmas and troublesome errors. Thanks guys. An infinite thank you
also goes to Chrissy Stevens of the Tribology lab, without whom life would be so much
harder.
A mention to past and present members within the Tribology lab is made. Jian, Marc
Torrance, Atul, Markus, Shin, Philippa and Tina are just a few of the names to whom I
owe a great deal to. Special thanks also to Nasim Jensen and Ruddy Vincent.
To my friends and family I give sincere thanks. My sister Isma Summer and brother
Ahmar Faraz, to my most beloved and beautiful nephew Salahuddin Yusuf for providing a
most needed distraction at times, and to my late grandparents who consistently
maintained that a good education is vital to succeed in life.
And finally to my parents; the unconditional love and support that you have guaranteed
me over the years has ensured that everything meaningful I have achieved, I owe to you. I
dedicate this thesis to you both.

4
In the Name of Allah, the Most Gracious, the Most Merciful
5
Abstract............................................................................................ 2
Acknowledgements ......................................................................... 3
Nomenclature ................................................................................ 10
List of Figures ................................................................................. 11
Chapter 1 ........................................................................................ 15
Introduction .................................................................................. 15
1.1 Background ........................................................................................... 16
1.1.1 Textured Surfaces .............................................................................................. 16
1.1.2 Lubricant Film Thickness .................................................................................. 17
1.1.3 Cavitation .......................................................................................................... 17
1.2 Aims and Objectives .............................................................................. 18
1.3 Collaboration ......................................................................................... 19
1.4 Thesis Structure ..................................................................................... 19
Chapter 2 ........................................................................................ 21
Hydrodynamic Study – A Literature Review ................................ 21
2.1 Classical Lubrication ............................................................................. 22
2.1.1 Introduction ...................................................................................................... 22
2.1.2 Mechanisms of Fluid Film Formation................................................................ 23
2.1.3 Friction .............................................................................................................. 29
2.2 Textured Rubbing Surfaces................................................................... 31
6
2.2.1 Introduction ...................................................................................................... 31
2.2.2 A Theoretical Approach .................................................................................... 33
2.2.3 The Contribution of Experiment ...................................................................... 41
2.3 Film Thickness Measurements .............................................................. 46
2.3.1 Classical methods – Optical Interferometry ..................................................... 46
2.3.2 Laser Induced Fluorescence Methods .............................................................. 48
2.4 Cavitation .............................................................................................. 53
2.5 Summary of review ................................................................................ 55
Chapter 3 ........................................................................................ 56
Experimental Development ........................................................... 56
3.1 Introduction .......................................................................................... 57
3.2 The Design and Commissioning of the Test Rig ................................... 57
3.3 The Hydrodynamic Test Rig – General Outline ................................... 58
3.3.1 Film Thickness Measurements – L.I.F. System .................................................. 60
3.3.2 Test Specimen Loading Principle – The ‘Load Arm’ ......................................... 69
3.3.3 Friction Analysis System .................................................................................... 72
3.4 Peripheral Lubrication – Oil Supply ..................................................... 74
3.5 Rotating Disc – The Drive Train Mechanism ....................................... 76
3.6 The Test Pad Specimen .......................................................................... 76
3.7 Instrumentation .................................................................................... 85
3.7.1 Imaging .............................................................................................................. 87
3.7.2 Friction .............................................................................................................. 87
3.7.3 Disc Speed ......................................................................................................... 88
7
3.7.4 Test Pad Load ..................................................................................................... 89
3.7.5 Temperature Monitoring .................................................................................. 90
3.8 Experimental Data Capture and Storage .............................................. 91
3.9 Summary of Chapter .............................................................................. 93
Chapter 4 ........................................................................................ 96
Experimental Method .................................................................... 96
4.1 Introduction .......................................................................................... 97
4.2 System Calibration................................................................................. 97
4.2.1 L.I.F. Calibration ................................................................................................ 97
4.2.2 Friction Calibration .......................................................................................... 117
4.2.3 Load Calibration ............................................................................................... 118
4.3 Test Variables and their Controllability .............................................. 118
4.3.1 Oil Temperature ............................................................................................... 120
4.3.2 Variation of Convergence with load ................................................................ 123
4.3.3 Disc Speed ........................................................................................................ 124
4.4 The Test Procedure ............................................................................... 125
4.5 Summary ............................................................................................... 130
Chapter 5 ...................................................................................... 131
Hydrodynamic Test Rig Results .................................................. 131
5.1 Introduction ......................................................................................... 132
5.2 Variation of Minimum Film Thickness, ho ........................................... 132
8
5.3 Minimum film thickness and Friction versus Load for all Convergences
.................................................................................................................... 136
5.4 Friction variation between experimental pads and equivalent
theoretical plain pad for all convergences ............................................... 150
5.5 Load Support versus Convergence for all pads ................................... 156
5.6 Minimum film thickness comparison .................................................. 167
5.7 The Cavitating Case .............................................................................. 173
5.8 Summary ............................................................................................... 175
Chapter 6 ...................................................................................... 176
Discussion .................................................................................... 176
6.1 Introduction ......................................................................................... 177
6.2 Review of Results ................................................................................. 178
6.2.1 Film Thickness and Friction data ..................................................................... 178
6.2.2 Percentage difference in Friction data ............................................................. 180
6.2.3 Load support versus Convergence ratio .......................................................... 181
6.2.4 Minimum Film Thickness data ......................................................................... 183
6.2.5 Cavitation Implications .................................................................................... 183
6.2.6 Summary of experimental results discussion................................................... 184
6.3 Theoretical comparisons ...................................................................... 184
6.3.1 Influence of textured surfaces ......................................................................... 189
6.3.2 Summary ........................................................................................................... 190
6.4 Discussion of Experimental Technique and Future Proposals ........... 190
6.4.1 Friction calibration .......................................................................................... 191
9
6.4.2 Load calibration ............................................................................................... 191
6.4.3 Film thickness calibration ................................................................................ 192
6.4.4 Image analysis ................................................................................................... 192
6.4.5 Oil entrainment velocity .................................................................................. 194
6.4.6 Oil temperature and viscosity .......................................................................... 195
6.4.7 Theoretical Analyses Correction ...................................................................... 196
6.4.8 Summary ........................................................................................................... 196
6.5 Summary of discussions ....................................................................... 197
Chapter 7 ...................................................................................... 198
Conclusions .................................................................................. 198
7.1 Summary of thesis ................................................................................. 199
7.2 Conclusions .......................................................................................... 200
References .................................................................................... 202

10
Nomenclature
η Dynamic viscosity
h Film thickness
U1, U2 Velocities of surface 1 and 2 in the x direction
U Glass disc speed
V1, V2 Velocities of surface 1 and 2 in the y direction
w1,w2 Velocities of surface 1 and 2 in the z direction x,y,z Spatial co-ordinates
u,v,w Fluid co-ordinates
hp Pocket depth
K Convergence ratio
Kf Fringe order
P Fluid film pressure
larm, Length of the load arm
u Load arm displacement
F Friction
km Stiffness of load arm elastic hinge
l Length of pad bearing
b Breadth of pad nearing
W* Non-dimensional load support
W Load
dhy Increment of pad bearing in the z plane
hi Inlet film thickness
ho Minimum outlet film thickness
hoL Minimum outlet film thickness at the left hand side of pad
hoR Minimum outlet film thickness at the right hand side of pad
hoCtr Minimum outlet film thickness at the centre of the pad
µ Coefficient of friction
bs Length of elastic shim
ds Thickness of elastic shim
E Young’s Modulus
I Moment of inertia
θ Convergence angle of calibration piece
11
List of Figures
2.1 A converging oil wedge 25 2.2 Two surfaces in relative motion to each other 27 2.3 A honed cylinder liner 32 2.4 A laser honed steel sample 34 2.5 Load Support vs. Speed for various texture patterns 35 2.6 Friction vs. Crank angle obtained for a textured piston ring 35 2.7 Effect of oil starvation upon friction for various pocket depths 35 2.8 Effect of textured area upon load support 37 2.9 Effect of textured surfaces upon load support 38 2.10 Effect of textured surfaces upon coefficient of friction 39 2.11 Effect of textured surfaces upon load support 40 2.12 Effect of textured surfaces upon coefficient of friction 40 2.13 Effect of texturing upon friction torque for a laser-etched liner 43 2.14 Effect of textured surfaces upon friction torque for V-grooved and parallel grooved tappet shims 44 2.15 Effect of textured surfaces upon minimum film thickness for reciprocating textured surfaces 45 2.16 The PMT signal for a circular drop of oil (a) and a calibration trace (b) 49 3.1 Main system components 59 3.2 L.I.F. Microscope System 61 3.3 The fluorescent cube 63 3.4 The original dual microscope set-up 64 3.5 The absorption spectrum for „Dye-Lite‟ 67 3.6 Schematic of the Friction Analysis System 70 3.7 Side and plan views of the Load Arm arrangement 71 3.8 Free body diagram of the loading arm 73 3.9 Original layout of the Test Rig 75 3.10 An example of a laser honed steel pad specimen 77 3.11 Surface profile of a laser honed steel pad specimen 78 3.12 Three-dimensional surface plot of a laser honed steel pad 78 3.13 & 3.14 Pocketed specimens highlighting roughness 79 3.15 Surface profiles of the pocketed region within a laser honed pad 80 3.16 Textured surfaces on Silicon 81 3.17 & 3.18 Chromium 5 inch square masks, pocket geometries shown on the left, pad cut-out on the right 81 3.19 & 3.20 Examples of pocketed Silicon wafer pads produced 82 3.21 Optical profiles of the silicon (left) and steel (right) pad samples 83 3.22 Fluorescent imaging of doped oil within various stated pocket depths 83 3.23 Initial proposed design for the test pad holder 84 3.24 Instrumentation of the main system components 86 3.25 The non-contact displacement sensor and the strain gauge installation 88 3.26 The DAQ system 89
12
3.27 The oil delivery nozzle containing the type „T‟ thermocouple 90 3.28 The steel hinge „shim‟ assembly 93 3.29 The pad holder (gimbal) assembly 93 3.30 The oil pump assembly 94 3.31 The oil delivery nozzle in its operating position 94 3.32 An assembly view depicting the load arm, non-contact displacement sensor and the oil bath/nozzle arrangement 95 3.33 The completed test rig apparatus 95 4.1 The wedge calibration technique 99 4.2 The film thickness profile along the length of the pad 100 4.3 The profile of the silicon pad 101 4.4 The profile of the silicon pad 101 4.5 The profile of the silicon pad 102 4.6 The revised calibration piece 104 4.7 The revised calibration piece 104 4.8 The revised calibration piece 105 4.9 The revised film thickness profile along the length of the pad 106 4.10 The pad heater arrangement 107 4.11 Oil film temperature as given by the pad heater arrangement 108 4.12 Calibration curves produced for high and low gains 110 4.13 A comparison of the film thickness variation at low gain 112 4.14 A comparison of the film thickness variation at high gain 112 4.15 Variation of focussing depths through a known film thickness 114 4.16 Film thickness comparisons at high gain 115 4.17 A typical friction calibration relationship 117 4.18 A typical load calibration relationship 118 4.19 Pocketed pad specimens 119 4.20 Pocketed pad specimens 119 4.21 Film thickness comparisons at high gain 121 4.22 Oil viscosity versus temperature chart 122 4.23 The effect of static loading upon the attitude of the pad 123 4.24 The L.I.F. image locations as shown from above 127 5.1 A typical Plain pad configuration 133 5.2 The 120 point grid referencing layout 134 5.3 Film Thickness data for the 120 point grid test case 135 5.4 Minimum film thickness and Friction vs. Load for Plain Pad 140 5.5 Minimum film thickness and Friction vs. Load for A05 141 5.6 Minimum film thickness and Friction vs. Load for A05r 142 5.7 Minimum film thickness and Friction vs. Load for A07 143 5.8 Minimum film thickness and Friction vs. Load for A07r 144 5.9 Minimum film thickness and Friction vs. Load for C07 145 5.10 Minimum film thickness and Friction vs. Load for C07r 146 5.11 Minimum film thickness and Friction vs. Load for C06 147 5.12 Minimum film thickness and Friction vs. Load for C06r 148
13
5.13 Minimum film thickness vs. Load comparison between experimental plain and experimental A05 pads 149 5.14 Percentage difference in friction from equivalent theoretical plain pad for all experimental plain pad test cases for the full range of convergence ratios 150 5.15 Percentage difference in friction from equivalent theoretical plain pad for all experimental C07 test cases for the full range of convergence ratios 151 5.16 Percentage difference in friction from equivalent theoretical plain pad for all experimental C07r test cases for the full range of convergence ratios 151 5.17 Percentage difference in friction from equivalent theoretical plain pad for all experimental C06 test cases for the full range of convergence ratios 152 5.18 Percentage difference in friction from equivalent theoretical plain pad for all experimental C06r test cases for the full range of convergence ratios 152 5.19 Percentage difference in friction from equivalent theoretical plain pad for all experimental A07 test cases for the full range of convergence ratios 153 5.20 Percentage difference in friction from equivalent theoretical plain pad for all experimental A07r test cases for the full range of convergence ratios 153 5.21 Percentage difference in friction from equivalent theoretical plain pad for all experimental A05 test cases for the full range of convergence ratios 154 5.22 Percentage difference in friction from equivalent theoretical plain pad for all experimental A05r test cases for the full range of convergence ratios 154 5.23 Percentage difference in friction from equivalent theoretical plain pad for all experimental test pad configurations and convergence ratios 155 5.24 Load support vs. convergence for Plain and A05 pads 157 5.25 Load support vs. convergence for Plain and A05r pads 158 5.26 Load support vs. convergence for Plain and A07 pads 159 5.27 Load support vs. convergence for Plain and A07r pads 160 5.28 Load support vs. convergence for Plain and C07 pads 161 5.29 Load support vs. convergence for Plain and C07r pads 162 5.30 Load support vs. convergence for Plain and C06 pads 163 5.31 Load support vs. convergence for Plain and C06r pads 164 5.32 Load support vs. convergence for plain, A05, A05r and C07 experimental pads 166 5.33 Comparison of various minimum film thicknesses between theoretical plain pad values and the experimental plain pad 167 5.34 Comparison of minimum film thicknesses between theoretical plain pad values and experimental pad A05 168 5.35 Comparison of minimum film thicknesses between theoretical plain pad values and experimental pad A05r 168 5.36 Comparison of minimum film thicknesses between theoretical plain pad values and experimental pad A07 169 5.37 Comparison of minimum film thicknesses between theoretical plain pad values and experimental pad A07r 169 5.38 Comparison of minimum film thickness values between theoretical plain pad values and experimental pad C07 170 5.39 Comparison of minimum film thicknesses between theoretical plain
14
pad values and experimental pad C07r 170 5.40 Comparison of minimum film thicknesses between theoretical plain pad values and experimental pad C06 171 5.41 Comparison of minimum film thicknesses between theoretical plain pad values and experimental pad C06r 171 5.42 The cavitated zone within the pocketed area in test pad A07 174 6.1 Load support vs. Convergence ratio comparison between one dimensional theoretical plain pad and experimental plain and A05 pads 185 6.2 µB/ho vs. Convergence ratio comparison between both one & two dimensional plain pad theoretical and experimental plain pad 187 6.3 µB/ho vs. Convergence ratio comparison for experimental pads A05, A05r, C07, C07r and the experimental plain pad 188

Chapter 1
Introduction

Aswad Shiraz Manzoor Chapter 1 - Introduction
16
1.1 Background
This chapter introduces the current need for the work being undertaken in the field of
hydrodynamically flooded films in textured conformal surfaces. It aims to give a brief
overview of the areas of focus that are of particular interest when considering such
circumstances. Machined surfaces (such as piston liners situated within IC engines) have a
certain degree of roughness as a result of the manufacturing process they undergo.
Plateau honing is a prime example. This is in contrast to textured surfaces which have
been subjected to a deliberate surface finish technique.
1.1.1 Textured Surfaces
There has been a great deal of interest with regards to the recent discovery of using
textured surfaces when designing closely rubbing conformal contacts. Photo-etching and
focused laser surface texturing (L.S.T.) are two of the more popular choices for texturing
surfaces. Positive asperities are termed as „protuberances‟ while negative asperities are
known as „recesses‟. It is thought that the presence of these asperities may lead to the
onset of cavitation occurring within the lubricant film, and this is thought to give rise to
several phenomena; evidence has shown that these textured surfaces have resulted in
significant levels of improvement to not only the maximum load capacity within the
contact region, but also to favourable coefficient of friction reductions. This will be dealt
with in more detail later in Chapter 2.

Aswad Shiraz Manzoor Chapter 1 - Introduction
17
These textured surfaces are currently being utilised in many applications. Examples
include Journal bearings, Piston/Liner interfaces and Rotary/Lip seals. However, the
mechanisms of friction reduction are not yet fully understood either theoretically or by
means of validated experimental evidence and so further research is necessary.
1.1.2 Lubricant Film Thickness
If rubbing conformal contacts are to maintain their optimum working characteristics,
certain constraints must be adhered to at all times. Of these, the existence of a lubricant
film is vital as to prevent asperity-asperity contact which may lead to premature bearing
failure. These lubricant films can be of either aqueous or pseudo-solid form, and suffer as
a result of the harsh environments they have to rigorously endure. The film can vary from
tens of micrometers down to nanometres in thickness, depending upon the regime of
lubrication that the contact region is undergoing. Two fundamental fluid film regimes of
lubrication are Hydrodynamic (isoviscous rigid) and Elastohydrodynamic (piezo-viscous
elastic) lubrication. These will be discussed in more detail in Chapter 2.
1.1.3 Cavitation
Cavitation is the formation of a vapour phase (in a liquid) in response to the liquid being
subjected to sub-ambient or negative pressure.
It has been shown in previous work, discussed later in Chapter 2, that cavitation can
modify the antisymmetric pressure distribution which occurs near the surface asperities.

Aswad Shiraz Manzoor Chapter 1 - Introduction
18
It is thought that the balance of higher pressures over lower, often sub-ambient pressures
is the primary explanation for the generation of load support in parallel or near-parallel
surfaces.
1.2 Aims and Objectives
This particular study aims to improve the understanding (of the underlying principles) of
how microtextured surfaces give rise to reductions of coefficients of friction and
increased load support. A related issue is the evaluation of film thickness measurements
of the lubricant film, and the understanding of what precise role cavitation plays, if any,
in all of the above.
One of the primary aims of this study is to see how exactly the coefficient of friction is
reduced and load support is increased. It is hoped that the mechanisms by which this
occurs can be comprehensively understood.
Another important aim of the project is to evaluate the lubricant film thickness within
rubbing contacts. As cavitation occurs within the film, the film thickness will also be
measured simultaneously with friction. At present, the nature of the cavitation geometry
envisaged is thought to be highly influential within these mechanisms.
Aswad Shiraz Manzoor Chapter 1 - Introduction
19
The overall aim of the current research is to carry out simultaneous measurements of
friction and film thickness in textured bearings in order to distinguish the possible
mechanisms of friction reduction.
1.3 Collaboration
This research program includes a comparative analysis between the experimental results
gained from this specific programme and computational results being researched by a
collaborator concurrently. A Computational Fluid Dynamics (CFD) approach is closely
related to this project in terms of determining the influence of microtextured surfaces
upon reducing friction coefficients and increasing load support. The current work follows
on from computational analyses of hydrodynamically lubricating films in plain and
pocketed surfaces being undertaken at Imperial College; a two-dimensional code capable
of solving the separation of two non-conformal surfaces loaded against each other and in
relative motion, by a lubricating film.
1.4 Thesis Structure
The work described here in this thesis can effectively be partitioned into three main parts.
The first part (Chapters 1-2) is an introduction to, and how previous efforts have
attempted to deal with, the question of textured surfaces. A literature review will
highlight the areas of research which have been crucial in determining the knowledge base
thus far. But more importantly, it will identify those areas which have not yet been
Aswad Shiraz Manzoor Chapter 1 - Introduction
20
explored. A complete and thorough understanding of the exact nature of textured
surfaces and the impact that they have upon friction is key to the research being carried
out by the automotive industry at present.
The second part (Chapters 3-4) introduces the concept of the test rig and the techniques
used to develop the test method as well as the calibration applied to certain components
on the test rig. Each individual sub-system of the test rig is introduced and the reasoning
behind the specific design is given. The test pad specimens used in the current research
are described and the manner in which they are tested is explained.
The results produced using the hydrodynamic test rig are presented and commented
upon in the final portion of this thesis (Chapters 5-6). The results are compared against
theoretical predictions. Discussion of the significance of these results and comments are
offered where differences from analyses occur, and the method in which they may be
eliminated in future work proposals. A final summary and conclusions (Chapter 7) are
made as to the validity of the current findings.

Chapter 2
Hydrodynamic Study – A Literature Review
Aswad Shiraz Manzoor Chapter 2 – Hydrodynamic Study-A Literature Review
22
2.1 Classical Lubrication
This section deals with the fundamentals of lubrication theory. It aims to give an
overview of the main types of lubricating films present whenever there are two or more
opposing moving surfaces. It will deal briefly with how these films are formed and what
factors affect their relative performance under specific conditions. The issue of friction
and its relationship to the nature of film formed is also introduced.
2.1.1 Introduction
The majority of modern day machinery inevitably contains moving parts that are in
constant contact with each other and thus, continual rubbing and sliding occurs. These
contact surfaces are frequently situated within harsh environments and extreme working
conditions. As a result, damage and wear is usually associated with the presence of
friction due to surface interactions. Over the years, attempts have been made to alleviate
these problems by means of changing the working conditions (load, temperature &
speed) of the contacts, modifying the materials in contact, and introducing lubricants to
physically separate the contacting surfaces to name but a few solutions.
This has led to the gradual development of what we today call „Tribology‟, a term
originating from the Greek “tribos” which translates to attrition/rubbing. This is
effectively study of the „science and technology of interacting surfaces in relative motion‟
[1] or in simple terms, the effect of friction and wear between rubbing contacts and the
Aswad Shiraz Manzoor Chapter 2 – Hydrodynamic Study-A Literature Review
23
problems this causes. Continual demands upon tribological advances have ensured that
these disciplines regularly collaborate and extend on areas of interest.
2.1.2 Mechanisms of Fluid Film Formation
By separating the rubbing surfaces with a low shear strength film, the friction and surface
damage imposed upon the surfaces is greatly reduced. Inevitably, the surfaces of most
materials have a certain roughness value. This implies that there are asperities on the
surface layer of the material. For a lubricant film to be effective, its thickness should be
greater than the combined height of two such asperities on the opposing surfaces. This
would ensure that the two surfaces are physically separated during any movement. „Dry‟
contacts occur in the absence of any lubrication film [1].
The lubricant film can occur in a number of ways, more commonly known as the „fluid
film regimes‟ of lubrication. These are as follows;
Hydrodynamic Lubrication (HD) – Where the typical film thickness lies
between 1 and 100 µm. The oil is swept into the conformal contacts operating at
moderate to high speeds, and is classed as isoviscous.
Elastohydrodynamic Lubrication (EHL) – The film thickness are generally
smaller, ranging from 5 down to 0.1 µm. Again, the oil is dragged into the non-
Aswad Shiraz Manzoor Chapter 2 – Hydrodynamic Study-A Literature Review
24
conformal contact by the relative motion of the opposing surfaces, generally at
high pressure (piezo-viscous).
These fluid film regimes consist of a lubricant which is most commonly a hydrocarbon
based oil, gas or solid. Not only does the lubricant act to separate the surfaces, it also
serves to cool the surfaces, transport debris away from the rubbing areas, protect the
surfaces from water and to prevent wear. Lubricants are chosen so that they are effective
for long periods of time without the need for constant maintenance.
As Dowson [2] discussed in a recent review paper, the „birth‟ of fluid film lubrication
studies could be indebted to two leading figures in the nineteenth century, namely
Beauchamp Tower and Nikolai Petrov. Tower [3] commented on his experimental work
that a „coherent film of lubricant separated the bearing surfaces in well behaved bearings‟.
This was the result of the measurement of pressures within the bearing well beyond that
of the mean bearing pressure. This was discovered purely by chance. Petrov‟s [4] findings
were of the same conclusion however, he states that „the friction torque in rolling stock
bearings could be attributed to the shearing of a viscous lubricant in the annular gap
formed between a rotating shaft and concentric bearing‟. Leading on from this, Osborne
Reynolds [5] in 1886 suggested a theoretical approach to the fluid film formation
mechanism by effectively reducing the Navier-Stokes equations (explained in detail in [6])
to conditions suited to that of creeping flow. These were then combined with
fundamental continuity equations resulting in second order partial differential equations.
Aswad Shiraz Manzoor Chapter 2 – Hydrodynamic Study-A Literature Review
25
To this day, these equations are still used to describe the pressure generation and support
mechanisms in fluid-film bearings.
Hydrodynamic Lubrication – Action of Converging Wedge
All lubricated pairs effectively contain a convergent wedge, be they steep or shallow. It is
this convergence, coupled with the moving surface speed and oil viscosity, which
generates the oil pressure film. A liberal translation of the German descriptive phrase
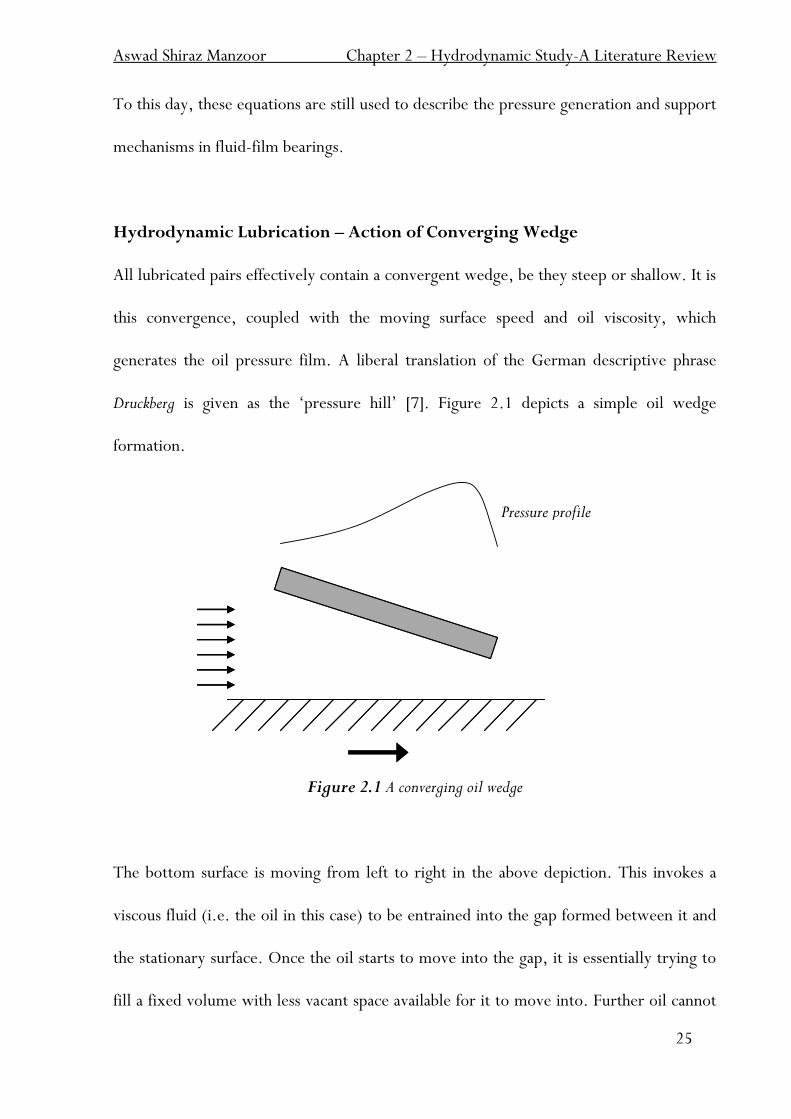
Druckberg is given as the „pressure hill‟ [7]. Figure 2.1 depicts a simple oil wedge
formation.
Figure 2.1 A converging oil wedge
The bottom surface is moving from left to right in the above depiction. This invokes a
viscous fluid (i.e. the oil in this case) to be entrained into the gap formed between it and
the stationary surface. Once the oil starts to move into the gap, it is essentially trying to
fill a fixed volume with less vacant space available for it to move into. Further oil cannot
Pressure profile
Aswad Shiraz Manzoor Chapter 2 – Hydrodynamic Study-A Literature Review
26
be accommodated within the gap at this instant. Oil is generally classed as an
incompressible fluid and thus, the only way to resolve the issue of the oil moving into a
reducing space is for the oil itself to generate a pressure. This has the consequence of
preventing further oil being forced into the converging wedge due to it encountering the
rising pressure (i.e. the pressure differential which is classed as the pressure hill [7]).
Once the oil already within the gap has travelled beyond the maximum pressure zone, it
is ejected through the reduced space the end of the convergent pad by means of the
elevated pressure gradient present.
The narrow angle created by the two opposing surfaces is often referred to as the shallow
wedge [7]. This design feature is intentionally created to entrain lubricant in between the
surfaces during relative motion. The lubricant is forced to withstand high pressures and
thus support external loading. As mentioned, the lubricant film has to be ideally thicker
than the combined thickness of the high points of the surface asperities. Neither
deformation of the surfaces nor increases in lubricant viscosity commonly occur in
hydrodynamic lubrication due to the relatively low pressures encountered within the
contacts. Plain journal bearings, thrust pad bearings and piston/liner interfaces are all
examples of hydrodynamic lubrication. By analysing the fluid flow inside the region of
interest mathematically, Reynolds equation can be derived [7]. This details two solid
surfaces sliding or squeezing past each other and the resultant pressure distribution within
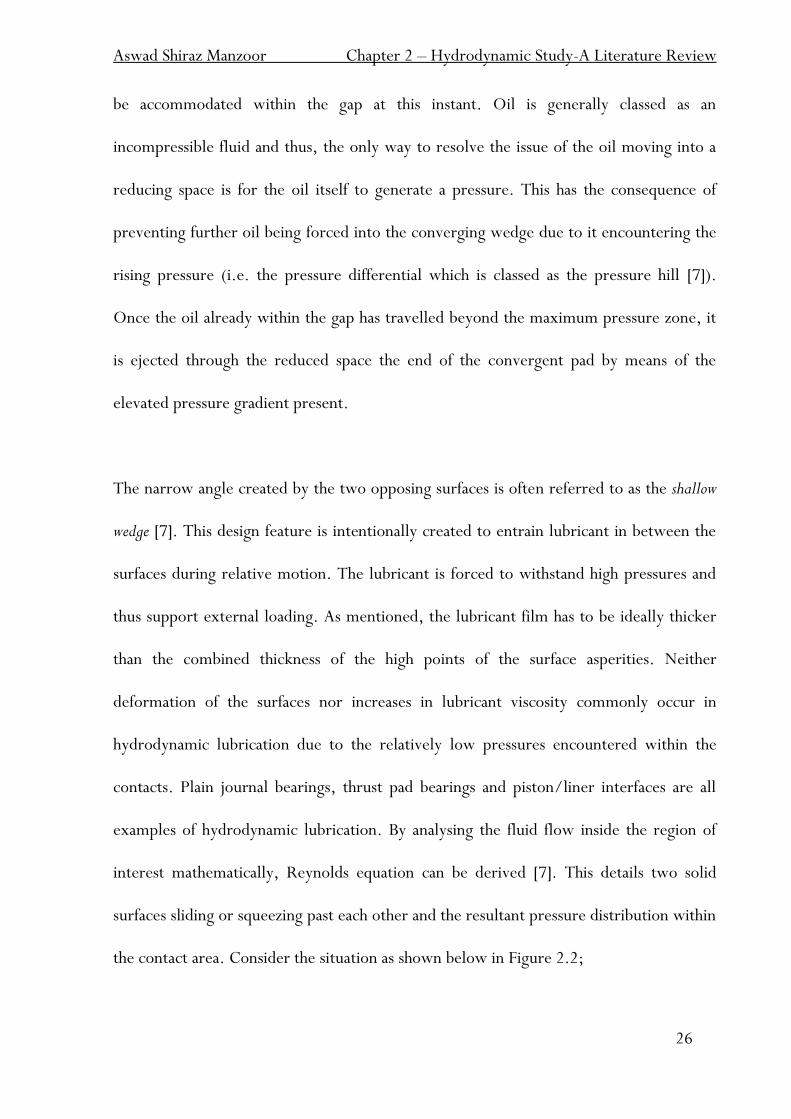
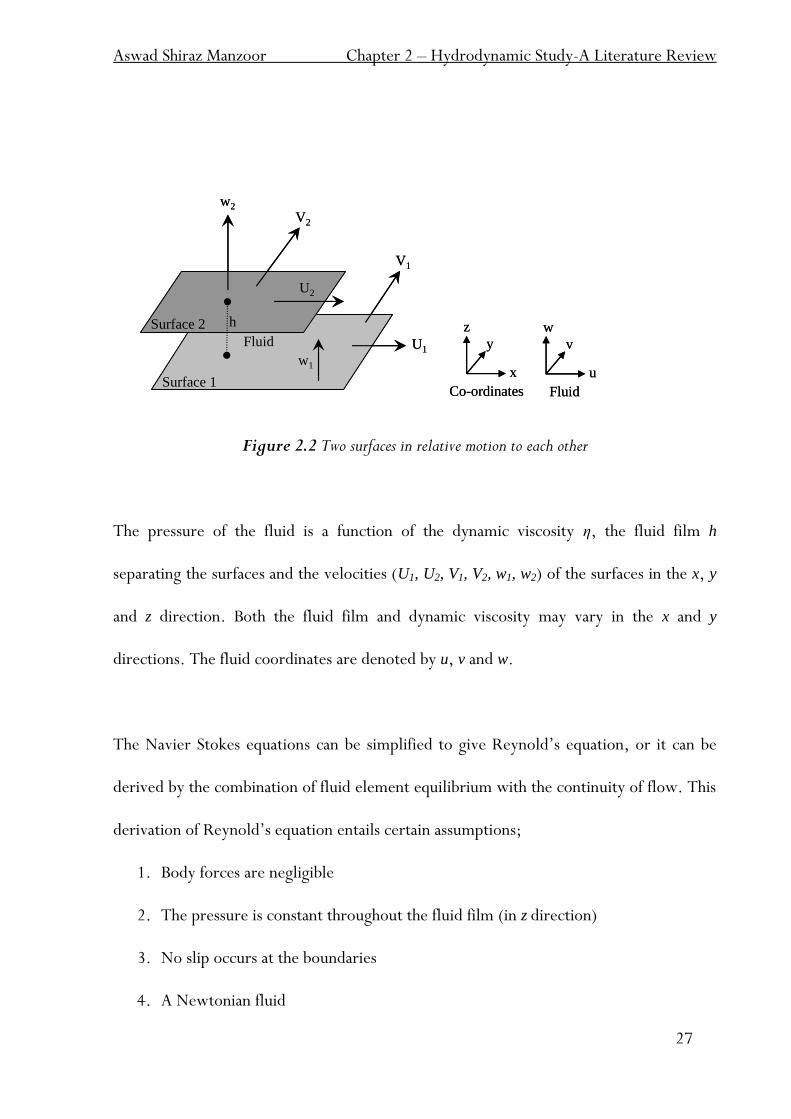
the contact area. Consider the situation as shown below in Figure 2.2;
Aswad Shiraz Manzoor Chapter 2 – Hydrodynamic Study-A Literature Review
27
Figure 2.2 Two surfaces in relative motion to each other
The pressure of the fluid is a function of the dynamic viscosity η, the fluid film h
separating the surfaces and the velocities (U1, U2, V1, V2, w1, w2) of the surfaces in the x, y
and z direction. Both the fluid film and dynamic viscosity may vary in the x and y
directions. The fluid coordinates are denoted by u, v and w.
The Navier Stokes equations can be simplified to give Reynold‟s equation, or it can be
derived by the combination of fluid element equilibrium with the continuity of flow. This
derivation of Reynold‟s equation entails certain assumptions;
1. Body forces are negligible
2. The pressure is constant throughout the fluid film (in z direction)
3. No slip occurs at the boundaries
4. A Newtonian fluid
h
U1
w1
V1
w2
U2
V2
x
z
yFluid
Surface 1
Surface 2
u
w
v
Co-ordinates Fluid
h
U1
w1
V1
w2
U2
V2
x
z
yFluid
Surface 1
Surface 2
u
w
v
Co-ordinates Fluid
Aswad Shiraz Manzoor Chapter 2 – Hydrodynamic Study-A Literature Review
28
5. Laminar flow
6. Negligible Inertia
7. Constant fluid film density
8. Constant velocity throughout the fluid film in x and y directions only, but not z
The first three assumptions are unequivocal for all cases, whilst 4, 5 and 6 are normally
valid and the last two are questionable (mainly due to possible thermal effects present in
the fluid film) [1].
The velocity profiles through the fluid film are first calculated using „equilibrium of an
element‟. These are in turn integrated to produce the fluid film flows. Finally,
„continuity of volume flow‟ is applied to produce Reynolds equation;
1211
33
26 wwy
hV
x
hU
y
ph
yx
ph
x (1)
This is Reynolds equation in 2-dimensions (which assumes U2 and V2 to be zero) as
derived fully in [1] and [7]. The terms on the left hand side of equation 1 above relate to
the Poiseuille flow; describing the nature of flow induced by the pressure gradient present
in the oil film (oil is driven from regions of high to low pressure). Pressure gradients in
the x and y direction effectively govern these terms.

Aswad Shiraz Manzoor Chapter 2 – Hydrodynamic Study-A Literature Review
29
Both the terms with U1 and V1 present refer to the Couette flow between the surfaces; the
flow induced by the sliding of one surface relative to the other. Oil is dragged into and
through the contact zone by the moving surface. The two variables that control this are
the surface sliding speed and the (changing) film thickness profile of the film.
The final term concerns the vertical oil flow present due to any vertical movement of the
surfaces, if present. This is referred to as the „squeeze film‟. In many applications of
Reynolds equation, this term is commonly equated to zero and removed from the above
equation.
Reynold‟s equation represents the continuity of mass (or of flow if constant density is
assumed) within the oil film whilst balancing the multiple driving forces behind oil
transport.
2.1.3 Friction
The term „mixed‟ lubrication is widely used when describing the lubrication regime of
gears and spinning disc experiments. The load is carried by a combination of
hydrodynamic forces (involving small coefficient of friction values) and „boundary‟
lubrication (coefficients of friction of up to one hundred orders of magnitude higher).
This boundary lubrication regime occurs when there is not enough hydrodynamic or
elastohydrodynamic lubrication film present to sufficiently separate the surfaces in
Aswad Shiraz Manzoor Chapter 2 – Hydrodynamic Study-A Literature Review
30
contact. As slower moving contacts rarely allow the formation of thicker lubricating films
to occur, this type of lubrication is considered crucial (the same applies in high
temperature contact situations where lubricant viscosity is low).
In thin fluid film bearings, friction results due to the presence of relatively high levels of
shear within the film. The shear stress (and consequently the strain rate) is elevated in the
thin film regions. The addition of pockets on the surfaces within these regions may
ultimately act to serve as a shear reducing mechanism [14].
Only the very ends or tips of the surface asperities of the material come into contact with
each other in the mixed lubrication regime. It is widely accepted that the mixed
lubrication regime is very important since a lot of everyday components and machinery
operate for part of their cycles in the mixed lubrication phase. Wear frequently occurs in
this regime, as is demonstrated practically by engine components such as cams and
piston/liner interfaces. Experimentation has shown that as the speed of a typical spinning
steel disc/pin configuration increases the friction reduces significantly, but is unaffected
by any loading differential. Lower coefficients of friction within high load bearings and
higher coefficients of friction within low load applications are often experienced. Low
coefficients of friction for low load contacts are in great demand.
Aswad Shiraz Manzoor Chapter 2 – Hydrodynamic Study-A Literature Review
31
2.2 Textured Rubbing Surfaces
A brief history of the concept of textured surfaces and their impact upon lubricated
surfaces is dealt with in this section. It can be separated into two main categories; the
theoretical approach followed by the contribution of experiment. Both are discussed with
their relative impacts upon the effect of texture within moving lubricated contacts.
2.2.1 Introduction
In recent years, there has been much interest in the growing field of surface texturing of
rubbing materials. All materials have a roughness, and processes such as cutting, polishing
and hardening can affect this roughness value. This can be thought of as a texture
naturally imposed upon the surface, even though man made. In contrast, surfaces can also
be textured intentionally, where textures of a certain specified geometry are fabricated.
This will be discussed in more detail later. One such process of texturing the surfaces is
by Laser Surface Texturing (L.S.T.), often referred to as laser honing [11]. This creates
small „dimples‟ or pockets on the material surface, with some having depths and widths
of up to 40 µm. These pocketed surfaces are being introduced more readily into high
friction applications, as they tend to show a favourable decrease in friction coefficients as
well as higher load bearing capabilities [11].
Honing (the process whereby material asperities are removed leading to an improved
surface finish) has been used to finish piston liners within IC engines for a number of
years. This process is often attributed to prevent scuffing, retain hot oil on the piston
Aswad Shiraz Manzoor Chapter 2 – Hydrodynamic Study-A Literature Review
32
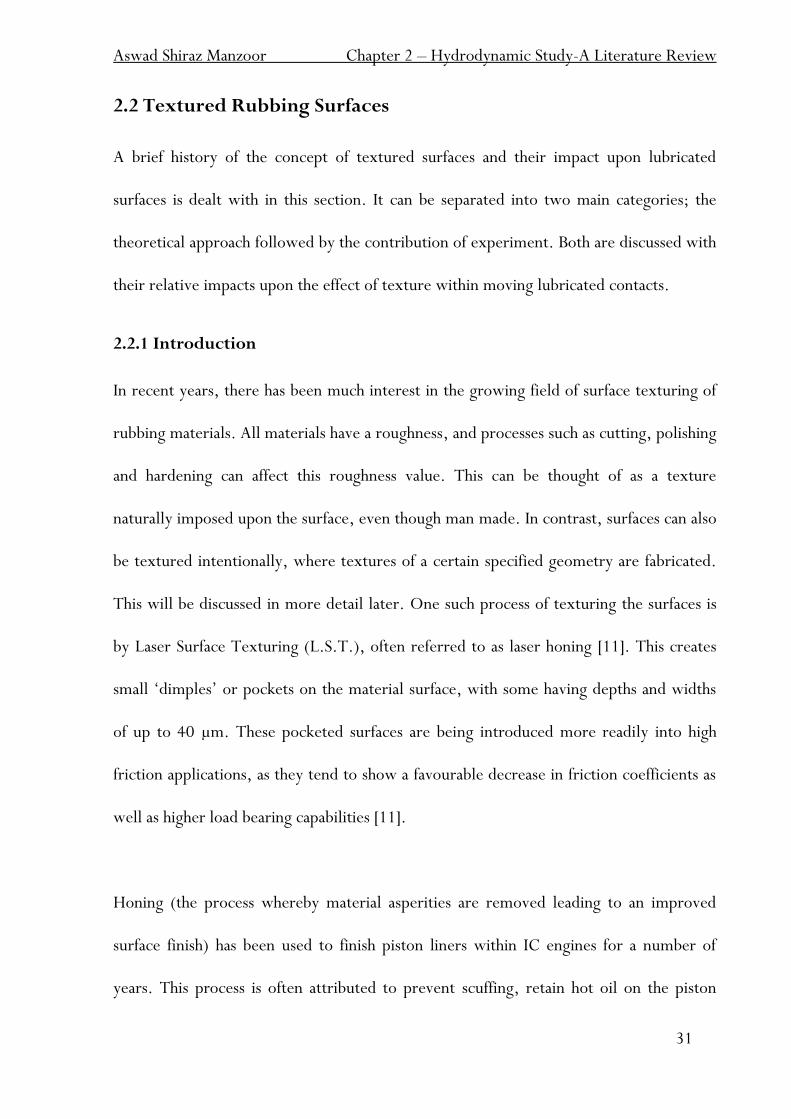
liner for adequate hydrodynamic lubrication and to accommodate wear debris, if and
when present [11 & 12]. A typical honed liner as measured on a 3D optical profiler is
depicted in Figure 2.3.
Figure 2.3 A honed cylinder liner
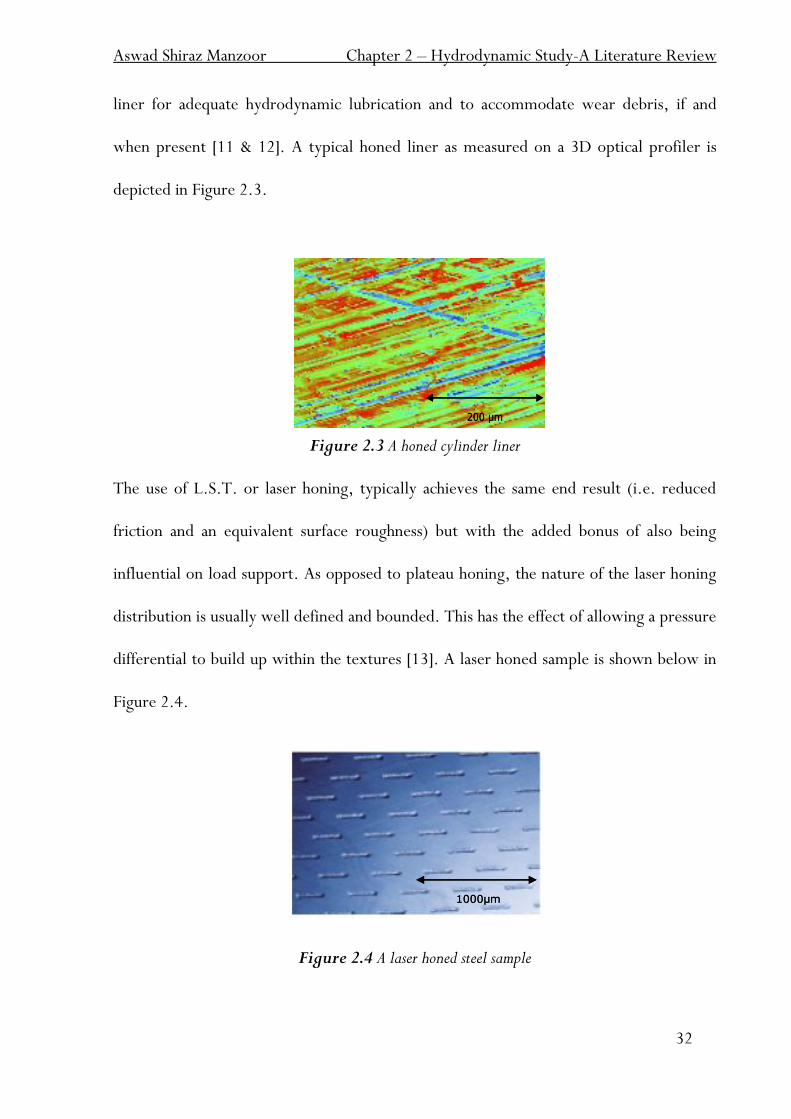
The use of L.S.T. or laser honing, typically achieves the same end result (i.e. reduced
friction and an equivalent surface roughness) but with the added bonus of also being
influential on load support. As opposed to plateau honing, the nature of the laser honing
distribution is usually well defined and bounded. This has the effect of allowing a pressure
differential to build up within the textures [13]. A laser honed sample is shown below in
Figure 2.4.
Figure 2.4 A laser honed steel sample
200 µm200 µm
1000µm1000µm
Aswad Shiraz Manzoor Chapter 2 – Hydrodynamic Study-A Literature Review
33
2.2.2 A Theoretical Approach
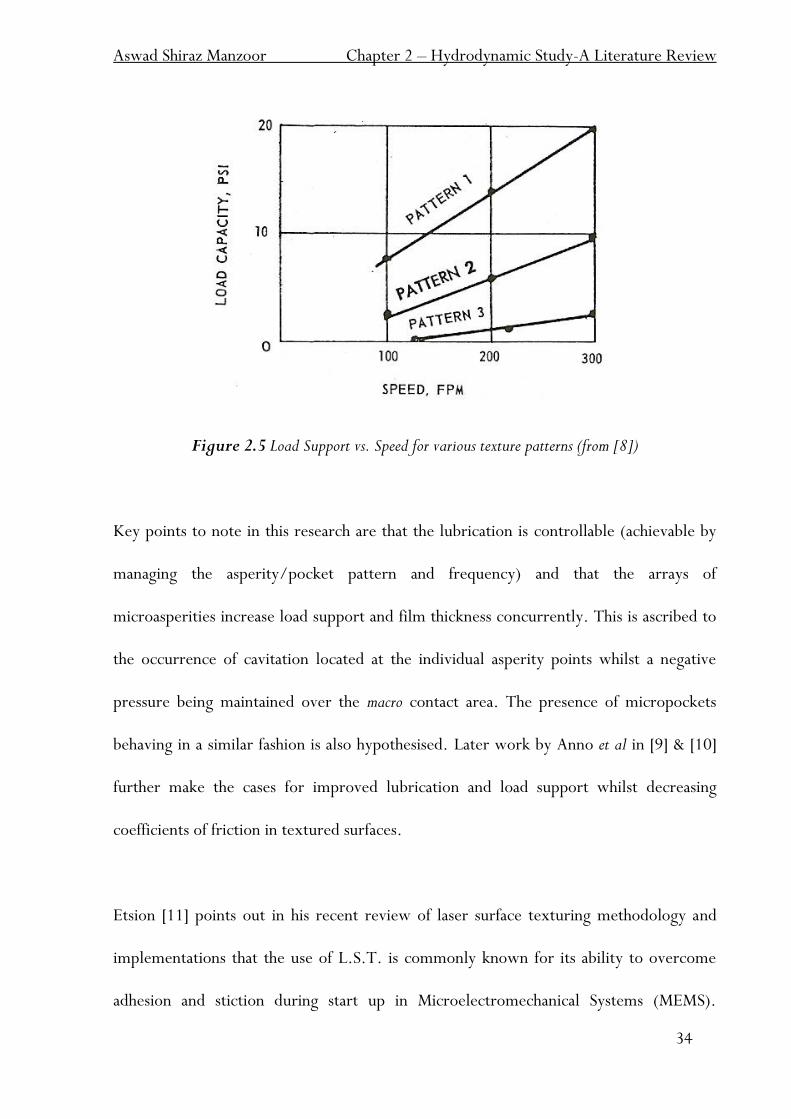
It was shown in the mid 1960‟s that textured surfaces had an advantageous impact on
friction between moving surfaces, e.g. Hamilton et al [8] who described the mechanisms
based on surface „micro-irregularities‟ (asperities and depressions) and subsequent film
cavities present within a rotor-stator set-up. They concentrated efforts upon face seals
containing micro-asperities. The primary explanation given for the advantages is by the
„anti-symmetric pressure distribution which would normally occur about these
irregularities is modified by film cavitation, which appears to permit the high film
pressures required to overbalance the low film pressures which results in a significant
load capacity capability‟. As the cavitation streamers appeared to originate and terminate
where the irregularities were situated, it was hypothesised that the surface roughness was
an influence on cavitation. It was further shown that depressions (pockets) located on the
surface had a similar effect as the asperities. Cavities were shown to be formed at the
leading edge while high pressures were generated above the trailing edge. It was
concluded that the predicted cavity size interactions, with pressure distribution arising
from the asperities and pockets, were in agreement with experimental findings. There
was some difference in the load support predicted by the theory and the values achieved
experimentally, ranging from 2 to 5 times the prediction. A typical load support versus
disc speed correlation for three different texture patterns they obtained is shown by
Figure 2.5.
Aswad Shiraz Manzoor Chapter 2 – Hydrodynamic Study-A Literature Review
34
Figure 2.5 Load Support vs. Speed for various texture patterns (from [8])
Key points to note in this research are that the lubrication is controllable (achievable by
managing the asperity/pocket pattern and frequency) and that the arrays of
microasperities increase load support and film thickness concurrently. This is ascribed to
the occurrence of cavitation located at the individual asperity points whilst a negative
pressure being maintained over the macro contact area. The presence of micropockets
behaving in a similar fashion is also hypothesised. Later work by Anno et al in [9] & [10]
further make the cases for improved lubrication and load support whilst decreasing
coefficients of friction in textured surfaces.
Etsion [11] points out in his recent review of laser surface texturing methodology and
implementations that the use of L.S.T. is commonly known for its ability to overcome
adhesion and stiction during start up in Microelectromechanical Systems (MEMS).
Aswad Shiraz Manzoor Chapter 2 – Hydrodynamic Study-A Literature Review
35
Modern day magnetic storage devices often have their surfaces textured for these reasons.
There have been many contributions from Etsion‟s research group with regards to
microtextured analysis over the past decade or so. Varying kinds of bearing geometries
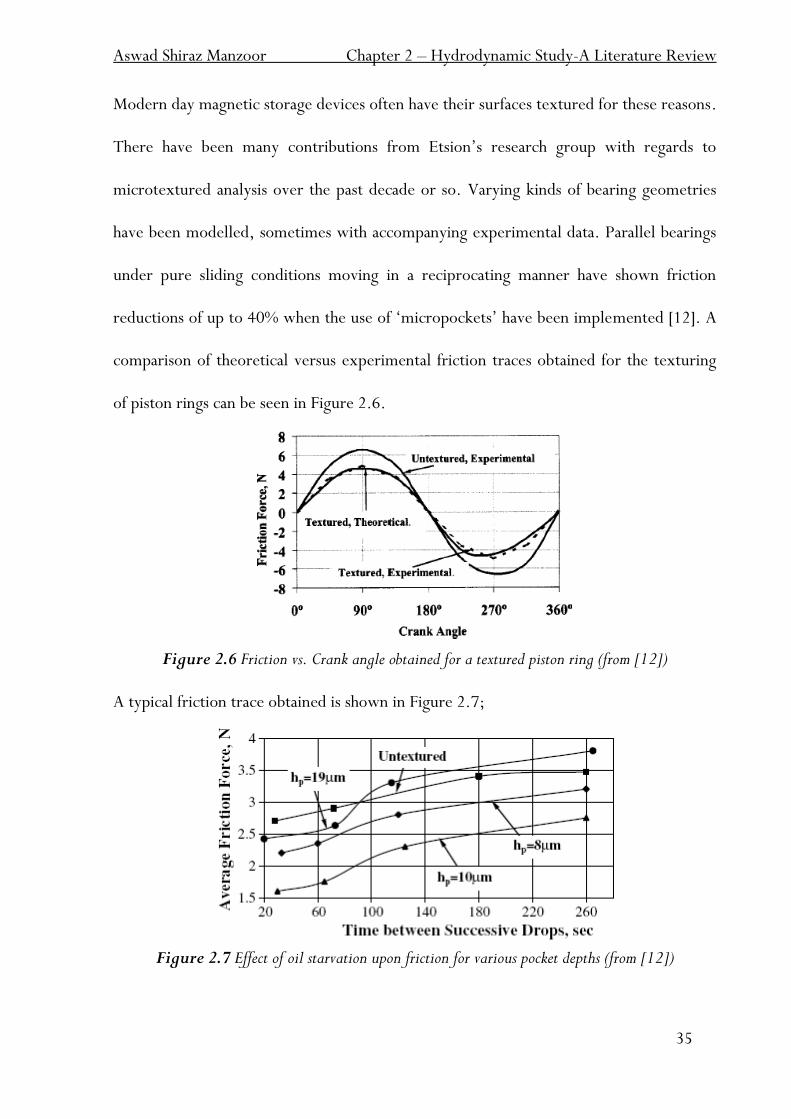
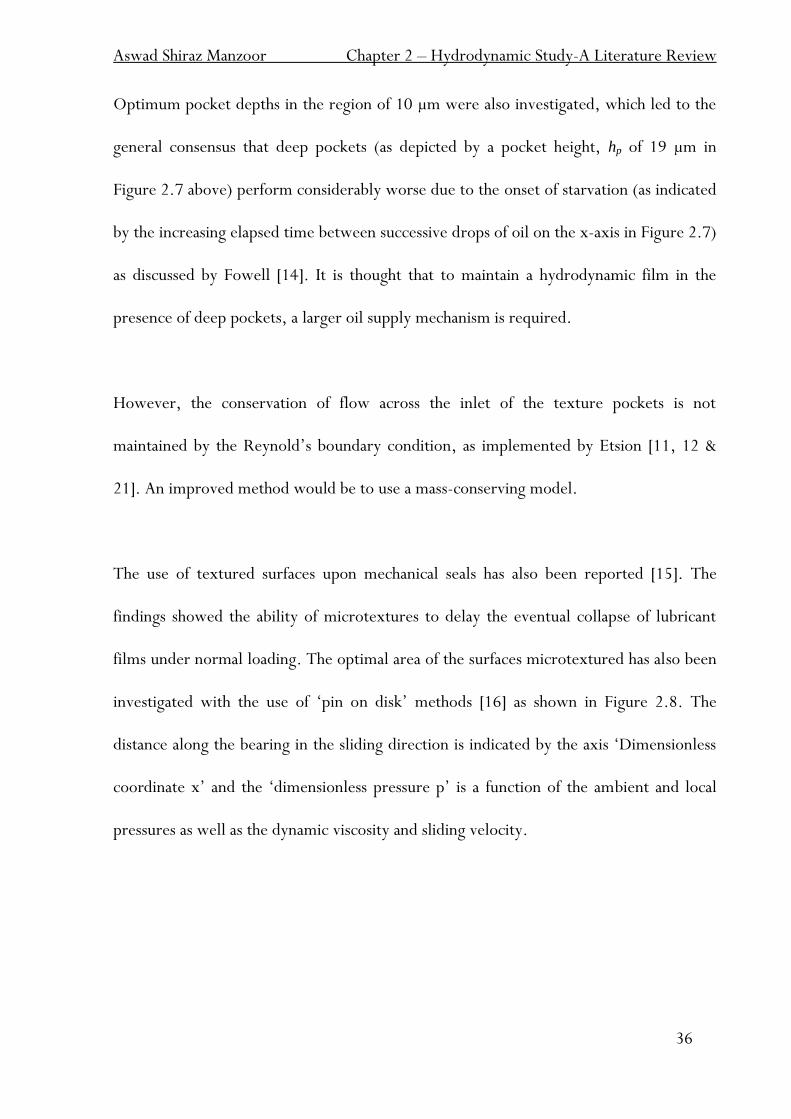
have been modelled, sometimes with accompanying experimental data. Parallel bearings
under pure sliding conditions moving in a reciprocating manner have shown friction
reductions of up to 40% when the use of „micropockets‟ have been implemented [12]. A
comparison of theoretical versus experimental friction traces obtained for the texturing
of piston rings can be seen in Figure 2.6.
Figure 2.6 Friction vs. Crank angle obtained for a textured piston ring (from [12])
A typical friction trace obtained is shown in Figure 2.7;
Figure 2.7 Effect of oil starvation upon friction for various pocket depths (from [12])
Aswad Shiraz Manzoor Chapter 2 – Hydrodynamic Study-A Literature Review
36
Optimum pocket depths in the region of 10 µm were also investigated, which led to the
general consensus that deep pockets (as depicted by a pocket height, hp of 19 µm in
Figure 2.7 above) perform considerably worse due to the onset of starvation (as indicated
by the increasing elapsed time between successive drops of oil on the x-axis in Figure 2.7)
as discussed by Fowell [14]. It is thought that to maintain a hydrodynamic film in the
presence of deep pockets, a larger oil supply mechanism is required.
However, the conservation of flow across the inlet of the texture pockets is not
maintained by the Reynold‟s boundary condition, as implemented by Etsion [11, 12 &
21]. An improved method would be to use a mass-conserving model.
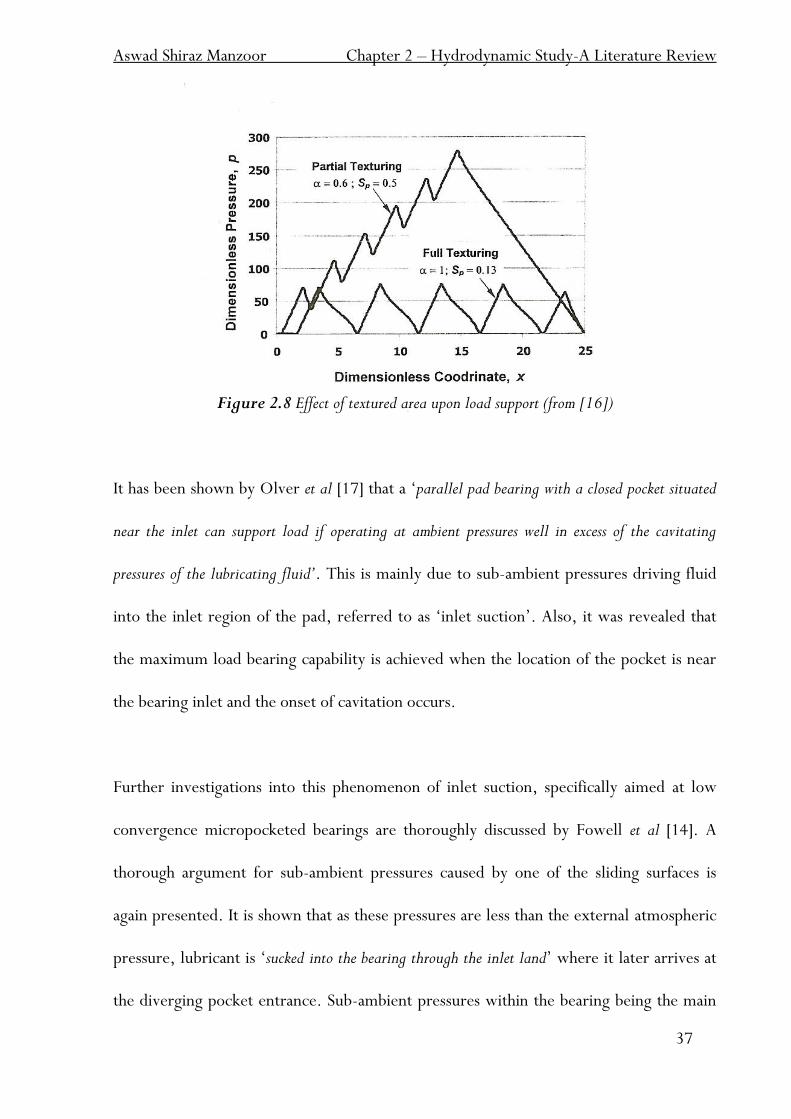
The use of textured surfaces upon mechanical seals has also been reported [15]. The
findings showed the ability of microtextures to delay the eventual collapse of lubricant
films under normal loading. The optimal area of the surfaces microtextured has also been
investigated with the use of „pin on disk‟ methods [16] as shown in Figure 2.8. The
distance along the bearing in the sliding direction is indicated by the axis „Dimensionless
coordinate x‟ and the „dimensionless pressure p‟ is a function of the ambient and local
pressures as well as the dynamic viscosity and sliding velocity.
Aswad Shiraz Manzoor Chapter 2 – Hydrodynamic Study-A Literature Review
37
Figure 2.8 Effect of textured area upon load support (from [16])
It has been shown by Olver et al [17] that a „parallel pad bearing with a closed pocket situated
near the inlet can support load if operating at ambient pressures well in excess of the cavitating
pressures of the lubricating fluid’. This is mainly due to sub-ambient pressures driving fluid
into the inlet region of the pad, referred to as „inlet suction‟. Also, it was revealed that
the maximum load bearing capability is achieved when the location of the pocket is near
the bearing inlet and the onset of cavitation occurs.
Further investigations into this phenomenon of inlet suction, specifically aimed at low
convergence micropocketed bearings are thoroughly discussed by Fowell et al [14]. A
thorough argument for sub-ambient pressures caused by one of the sliding surfaces is
again presented. It is shown that as these pressures are less than the external atmospheric
pressure, lubricant is „sucked into the bearing through the inlet land‟ where it later arrives at
the diverging pocket entrance. Sub-ambient pressures within the bearing being the main
Aswad Shiraz Manzoor Chapter 2 – Hydrodynamic Study-A Literature Review
38
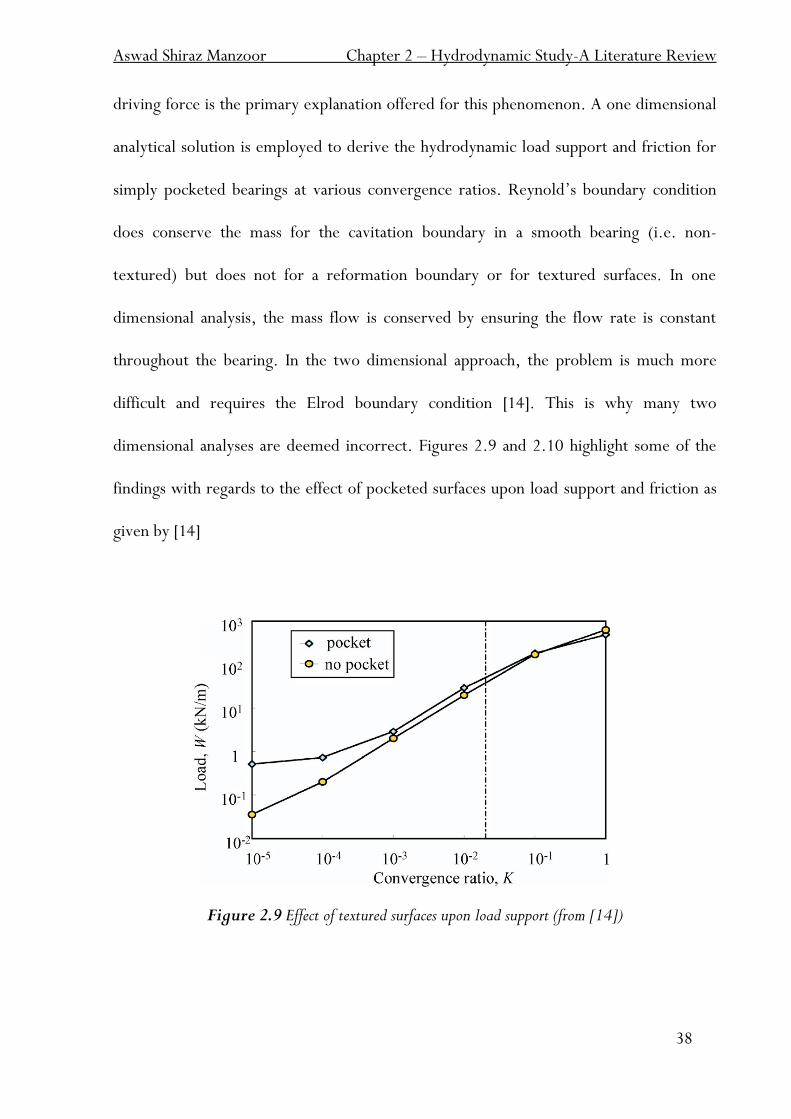
driving force is the primary explanation offered for this phenomenon. A one dimensional
analytical solution is employed to derive the hydrodynamic load support and friction for
simply pocketed bearings at various convergence ratios. Reynold‟s boundary condition
does conserve the mass for the cavitation boundary in a smooth bearing (i.e. non-
textured) but does not for a reformation boundary or for textured surfaces. In one
dimensional analysis, the mass flow is conserved by ensuring the flow rate is constant
throughout the bearing. In the two dimensional approach, the problem is much more
difficult and requires the Elrod boundary condition [14]. This is why many two
dimensional analyses are deemed incorrect. Figures 2.9 and 2.10 highlight some of the
findings with regards to the effect of pocketed surfaces upon load support and friction as
given by [14]
Figure 2.9 Effect of textured surfaces upon load support (from [14])
Aswad Shiraz Manzoor Chapter 2 – Hydrodynamic Study-A Literature Review
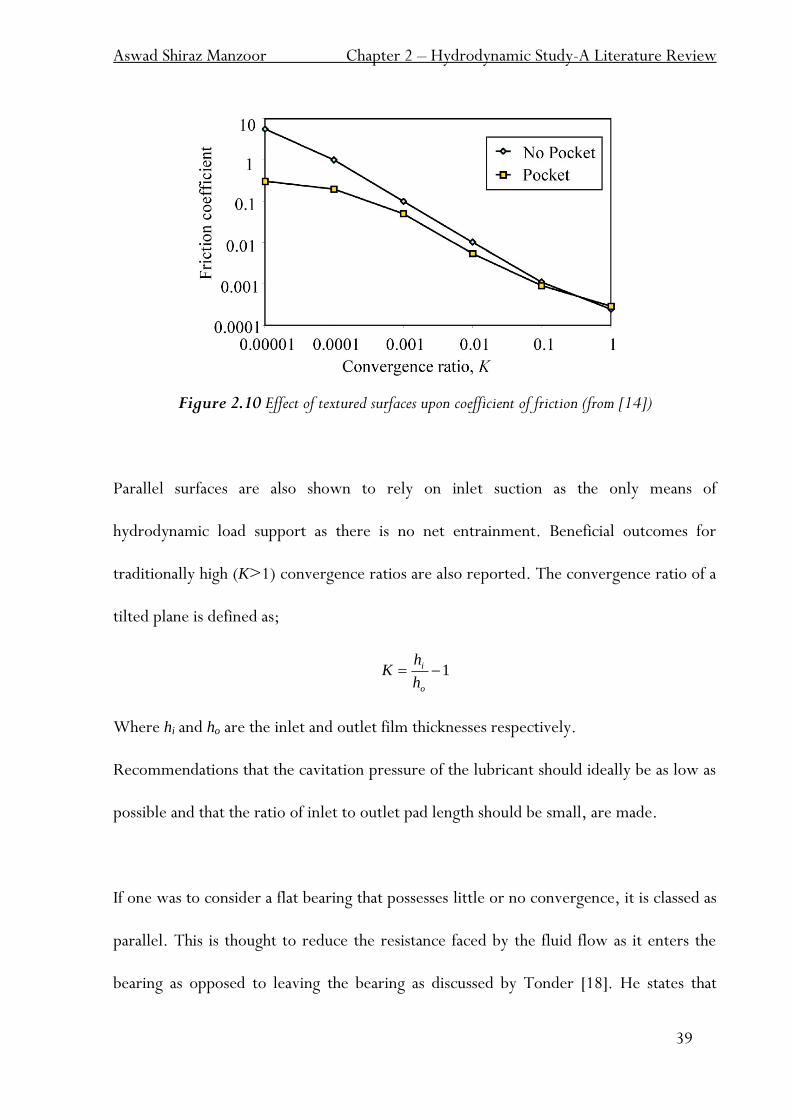
39
Figure 2.10 Effect of textured surfaces upon coefficient of friction (from [14])
Parallel surfaces are also shown to rely on inlet suction as the only means of
hydrodynamic load support as there is no net entrainment. Beneficial outcomes for
traditionally high (K>1) convergence ratios are also reported. The convergence ratio of a
tilted plane is defined as;
1o
i
h
hK
Where hi and ho are the inlet and outlet film thicknesses respectively.
Recommendations that the cavitation pressure of the lubricant should ideally be as low as
possible and that the ratio of inlet to outlet pad length should be small, are made.
If one was to consider a flat bearing that possesses little or no convergence, it is classed as
parallel. This is thought to reduce the resistance faced by the fluid flow as it enters the
bearing as opposed to leaving the bearing as discussed by Tonder [18]. He states that
Aswad Shiraz Manzoor Chapter 2 – Hydrodynamic Study-A Literature Review
40
small features located within the bearing negate the effects of lubrication as opposed to
the larger structure of the bearing itself; in other words the „micro-geometry controls the
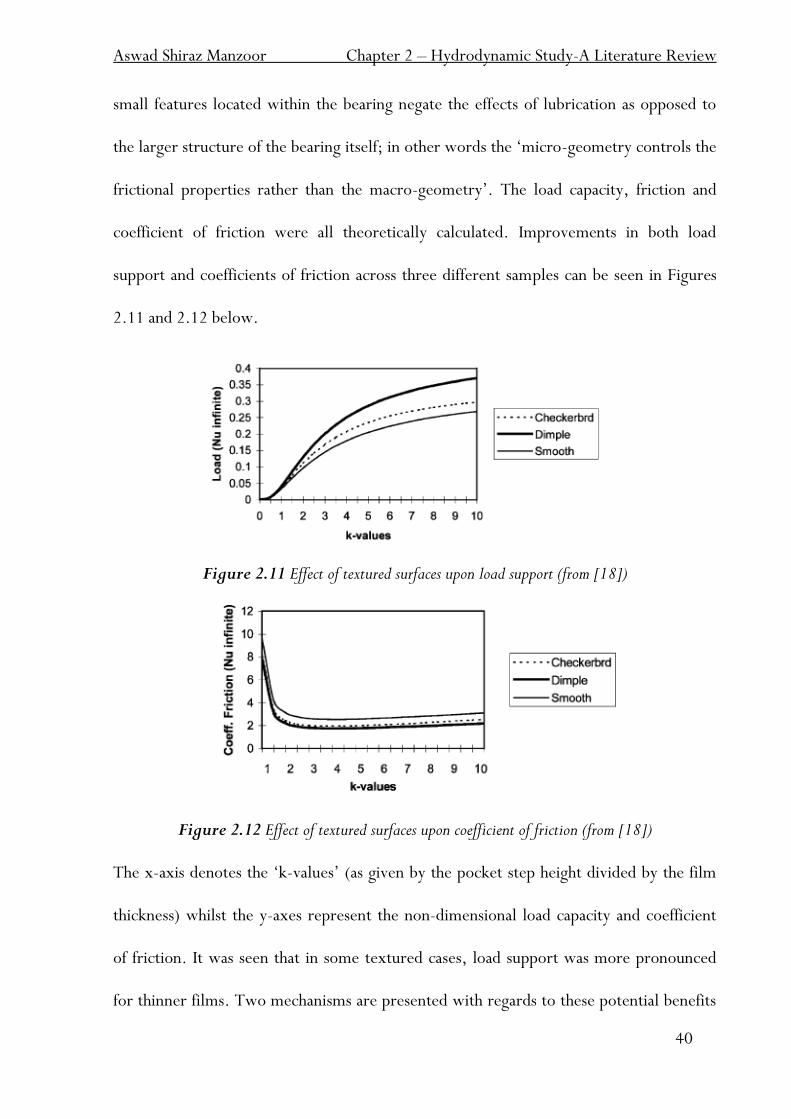
frictional properties rather than the macro-geometry‟. The load capacity, friction and
coefficient of friction were all theoretically calculated. Improvements in both load
support and coefficients of friction across three different samples can be seen in Figures
2.11 and 2.12 below.
Figure 2.11 Effect of textured surfaces upon load support (from [18])
Figure 2.12 Effect of textured surfaces upon coefficient of friction (from [18])
The x-axis denotes the „k-values‟ (as given by the pocket step height divided by the film
thickness) whilst the y-axes represent the non-dimensional load capacity and coefficient
of friction. It was seen that in some textured cases, load support was more pronounced
for thinner films. Two mechanisms are presented with regards to these potential benefits
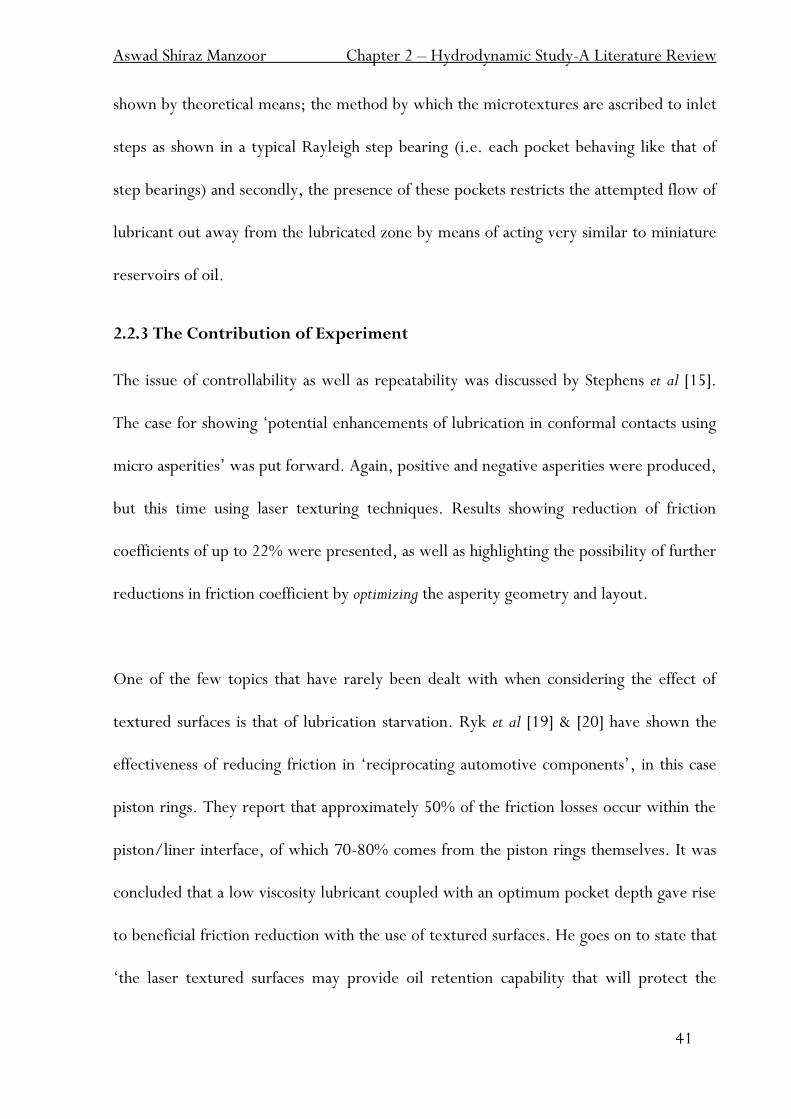
Aswad Shiraz Manzoor Chapter 2 – Hydrodynamic Study-A Literature Review
41
shown by theoretical means; the method by which the microtextures are ascribed to inlet
steps as shown in a typical Rayleigh step bearing (i.e. each pocket behaving like that of
step bearings) and secondly, the presence of these pockets restricts the attempted flow of
lubricant out away from the lubricated zone by means of acting very similar to miniature
reservoirs of oil.
2.2.3 The Contribution of Experiment
The issue of controllability as well as repeatability was discussed by Stephens et al [15].
The case for showing „potential enhancements of lubrication in conformal contacts using
micro asperities‟ was put forward. Again, positive and negative asperities were produced,
but this time using laser texturing techniques. Results showing reduction of friction
coefficients of up to 22% were presented, as well as highlighting the possibility of further
reductions in friction coefficient by optimizing the asperity geometry and layout.
One of the few topics that have rarely been dealt with when considering the effect of
textured surfaces is that of lubrication starvation. Ryk et al [19] & [20] have shown the
effectiveness of reducing friction in „reciprocating automotive components‟, in this case
piston rings. They report that approximately 50% of the friction losses occur within the
piston/liner interface, of which 70-80% comes from the piston rings themselves. It was
concluded that a low viscosity lubricant coupled with an optimum pocket depth gave rise
to beneficial friction reduction with the use of textured surfaces. He goes on to state that
„the laser textured surfaces may provide oil retention capability that will protect the
Aswad Shiraz Manzoor Chapter 2 – Hydrodynamic Study-A Literature Review
42
sliding surfaces against seizure‟. His experiments show that optimum dimple depths
coupled with low viscosity lubricants were beneficial over a wide range of flow rates,
whilst texturing with deeper pockets and/or high viscosity lubricants was often
„detrimental under certain operating conditions‟. Extensive work has also been carried
out on piston ring samples by the same author. Reciprocating test rig experiments have
shown friction reductions of up to 30% [21] and examples of surface texturing
implemented into the piston-liner mechanism have given reductions in fuel consumptions
of up to 4%. It is stated that the mechanism by which the friction reduction occurs is the
„collective effect of the dimples that provide an equivalent converging clearance between
nominally parallel mating surfaces‟. Similarities to work conducted by Tonder [22]
carried out earlier are mentioned.
Work carried out by Tateishi [23] also claims reductions in fuel consumption by „several‟
percent, and also improvements in wear rates and scuffing of the piston rings. He
attributes this to several factors that do not involve the use of surface texturing; reduction
of piston ring tension, using two ring set-ups instead of the typical three rings and finally,
using surface composite plating techniques.
Experimental texture work was carried out on internal combustion engines is described
by Rahnejat et al [24]. A single cylinder engine with a laser-etched textured liner was
used. Torque improvements of approximately 4.5% were shown to exist when using the
textured liner when compared to the standard plain liner configuration throughout the
Aswad Shiraz Manzoor Chapter 2 – Hydrodynamic Study-A Literature Review
43
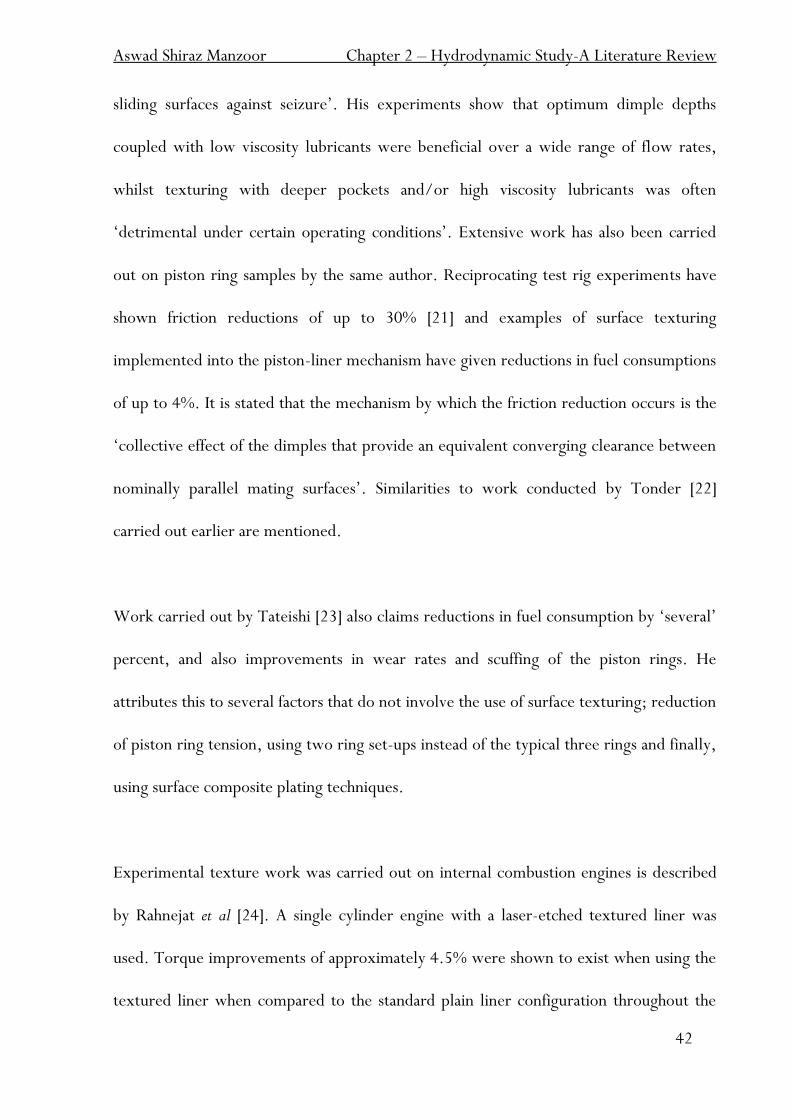
engine speed range. This improvement is accredited to „lubricant retention in the laser
etched grooves‟. The percentage torque gains can be seen clearly in Figure 2.13, plotted
against engine speed;
Figure 2.13 Effect of texturing upon friction torque for a laser-etched liner (from [24])
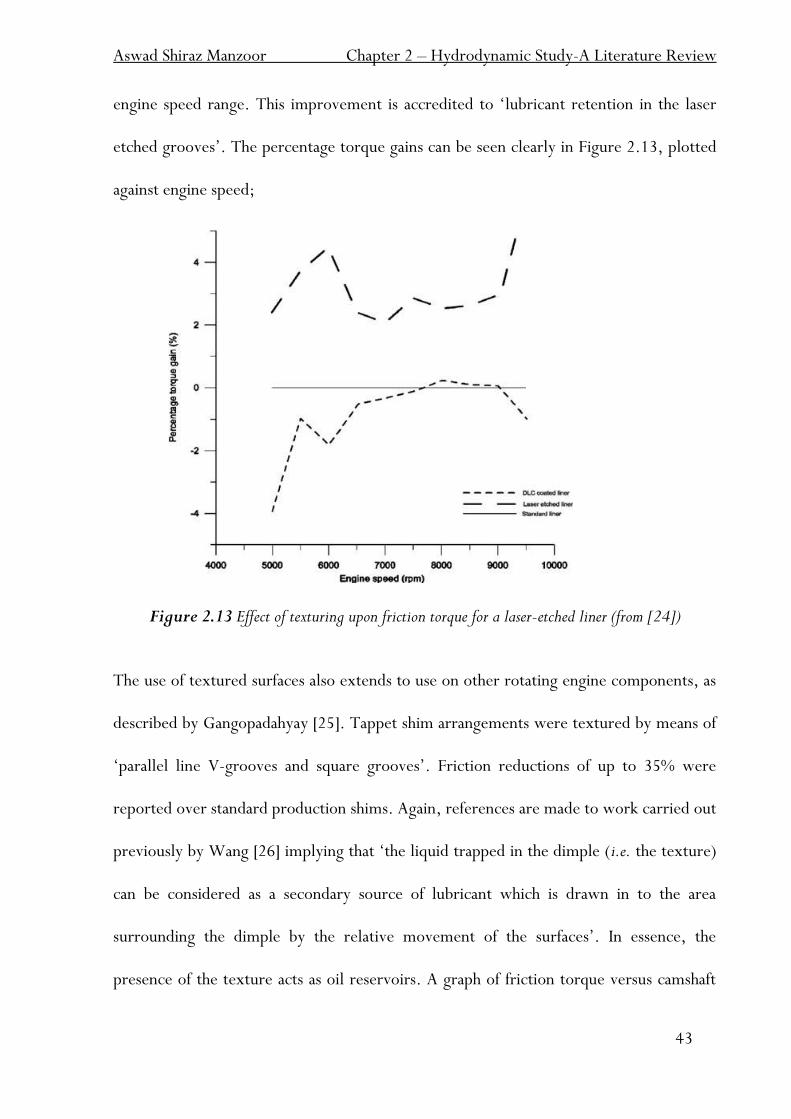
The use of textured surfaces also extends to use on other rotating engine components, as
described by Gangopadahyay [25]. Tappet shim arrangements were textured by means of
„parallel line V-grooves and square grooves‟. Friction reductions of up to 35% were
reported over standard production shims. Again, references are made to work carried out
previously by Wang [26] implying that „the liquid trapped in the dimple (i.e. the texture)
can be considered as a secondary source of lubricant which is drawn in to the area
surrounding the dimple by the relative movement of the surfaces‟. In essence, the
presence of the texture acts as oil reservoirs. A graph of friction torque versus camshaft
Aswad Shiraz Manzoor Chapter 2 – Hydrodynamic Study-A Literature Review
44
speed for both a V-groove and parallel square groove tappet shim is presented in Figure
2.14;
Figure 2.14 Effect of textured surfaces upon friction torque for V-grooved and parallel grooved tappet shims (from [25])
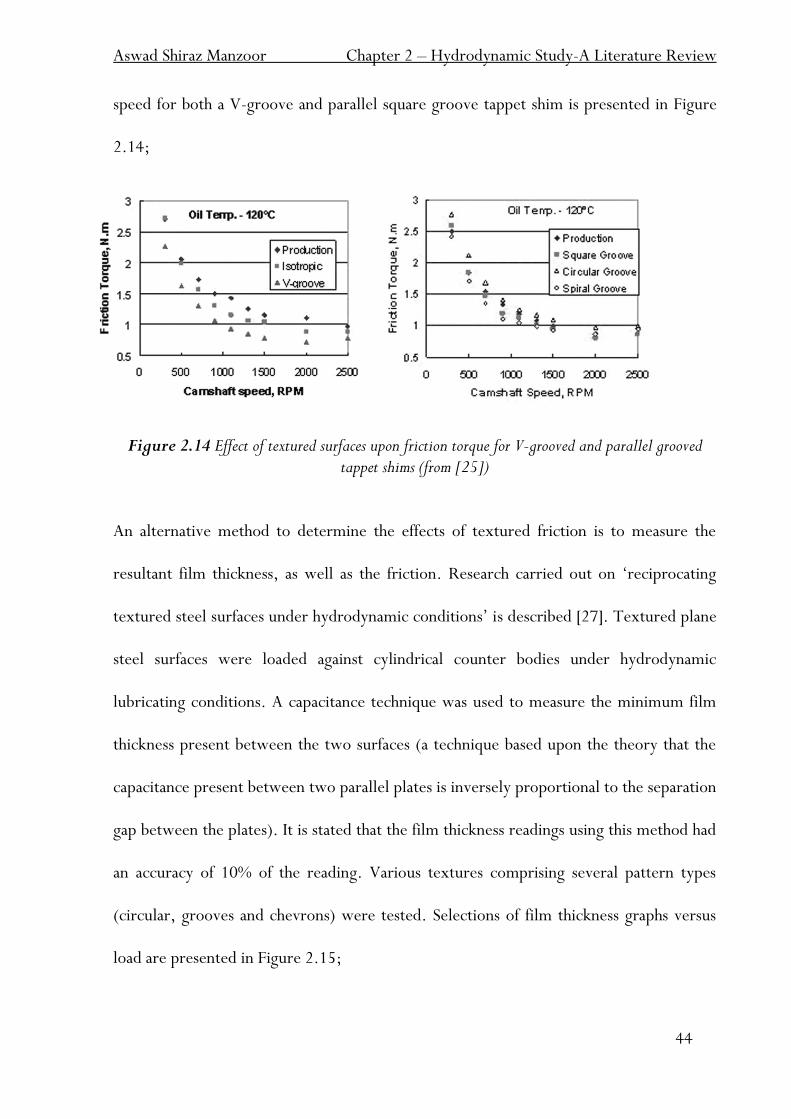
An alternative method to determine the effects of textured friction is to measure the
resultant film thickness, as well as the friction. Research carried out on „reciprocating
textured steel surfaces under hydrodynamic conditions‟ is described [27]. Textured plane
steel surfaces were loaded against cylindrical counter bodies under hydrodynamic
lubricating conditions. A capacitance technique was used to measure the minimum film
thickness present between the two surfaces (a technique based upon the theory that the
capacitance present between two parallel plates is inversely proportional to the separation
gap between the plates). It is stated that the film thickness readings using this method had
an accuracy of 10% of the reading. Various textures comprising several pattern types
(circular, grooves and chevrons) were tested. Selections of film thickness graphs versus
load are presented in Figure 2.15;
Aswad Shiraz Manzoor Chapter 2 – Hydrodynamic Study-A Literature Review
45
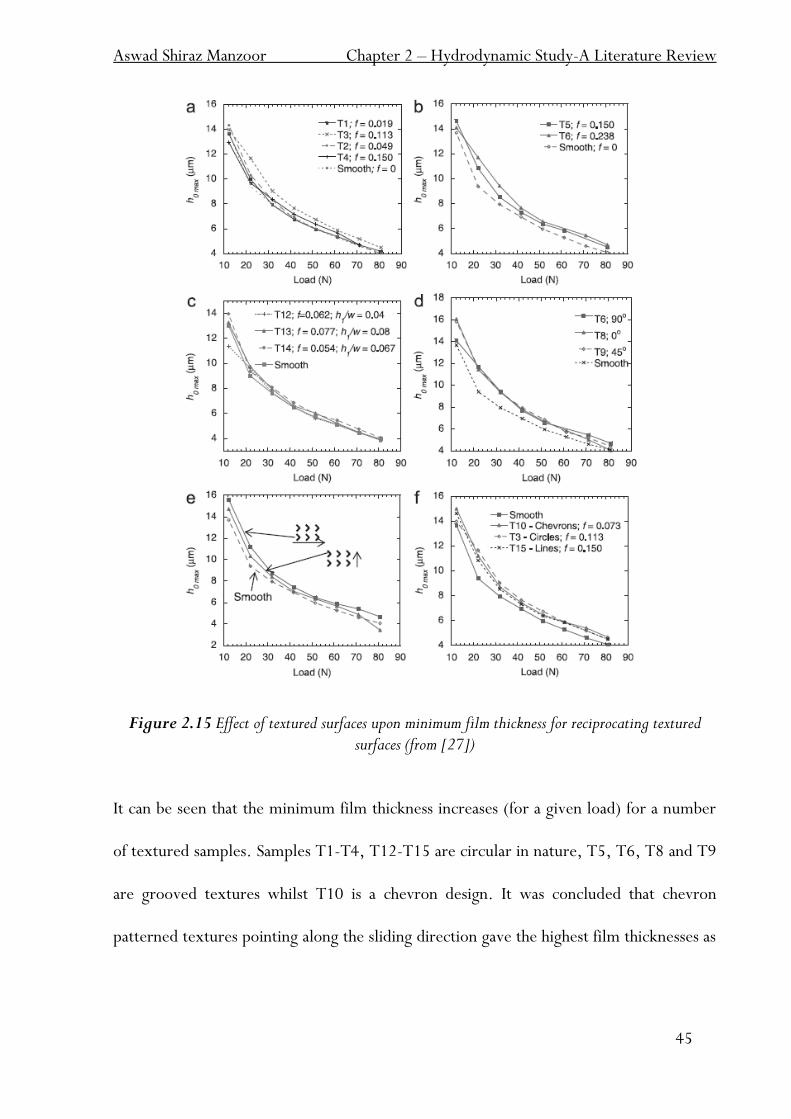
Figure 2.15 Effect of textured surfaces upon minimum film thickness for reciprocating textured
surfaces (from [27])
It can be seen that the minimum film thickness increases (for a given load) for a number
of textured samples. Samples T1-T4, T12-T15 are circular in nature, T5, T6, T8 and T9
are grooved textures whilst T10 is a chevron design. It was concluded that chevron
patterned textures pointing along the sliding direction gave the highest film thicknesses as
Aswad Shiraz Manzoor Chapter 2 – Hydrodynamic Study-A Literature Review
46
opposed to those pointing across, and that grooved textures were the least effective when
considering the fluid film thickness.
It can be noted that the majority of the research reviewed above is primarily in the low
film thickness regime (mixed lubrication) generally with high loads. The current research
aims to extend the current lack of knowledge in the fully flooded hydrodynamic fluid film
regime by exploring low load contacts.
2.3 Film Thickness Measurements
The various techniques used to measure film thickness in fluid film lubrication are
described. The progression from laboratory experiments to engine measurements is
introduced.
2.3.1 Classical methods – Optical Interferometry
It has been discussed by Cameron and Gohar [28] that earlier work regarding white light
optical interference carried out by Kirk [29] was not suitable due to inadequate loading
conditions upon a weak Perspex-on-Perspex contact, the combined effect of which was
insufficient test parameters to „permit the onset of true elastohydrodynamic lubrication‟
which presupposes a large increase of oil viscosity with pressure (i.e. piezo-viscous ehd
could not be achieved). Cameron and Gohar then proceeded to employ flint glass with a
higher refractive index and a steel ball to give detailed contact area mapping and oil film
thickness, the results of which are presented in [30] and [28]
Aswad Shiraz Manzoor Chapter 2 – Hydrodynamic Study-A Literature Review
47
The work of Hardy [31] using „interference colours to measure lubricating films on glass‟
has been acknowledged by Wedeven [32] in his research involving optical measurements
in elastohydrodynamic rolling contact bearings. He stated that the use of light was
favoured considerably as the wavelength of light is a „convenient unit of measure‟ when
one considers the scale of the film to be measured. The fact that an interferometry image
highlights more sensitivity in the direction of depth, when comparing it to the direction
of extent, was a great advantage, as is the case when considering EHL film mapping. The
method of interferometry works on the principle of „divisions of amplitude‟ of the
incident light source wave, and the relative position of the partial reflected light source
wave from the semi-reflective coating layer on the bottom of the glass surface.
Interference fringes arise from the phase difference between the incident and refractive
light rays, and this depends upon the „optical path difference between the two rays‟. The
Fringe order, Kf, is related to the optical path difference, and is an integer starting from
zero. Wedeven went on to state that the use of a duo-chromatic light source was far
more beneficial than either that of a white light or monochromatic system. These focused
primarily upon the area of fringes. The issue of fringe visibility, spacing, sensitivity and
fringe order were discussed in detail. Compromises were made in each case, but the
eventual case for a Red-Green duo-chromatic light source was put forward [32].
It was originally envisaged that the use of optical interferometry in this current work
would be employed for the determination of the convergence angle of the linear pad
bearing set-up. As some test cases call for a near parallel surface set-up, one may argue
Aswad Shiraz Manzoor Chapter 2 – Hydrodynamic Study-A Literature Review
48
that the only viable solution is to use this technique of „fringe counting‟ as this can
measure very thin films to an unprecedented level (accurate to 1 nm). However, certain
difficulties encountered called for a change of approach, which will be discussed in
Chapter 3.
2.3.2 Laser Induced Fluorescence Methods
Laser Induced Fluorescence (L.I.F) is a term coined in the 1970‟s when it was observed
[33] that some oils exhibited a „natural fluorescence‟ phenomenon when light of a certain
wavelength was imposed upon them. It was shown that a range of oil film thicknesses
could be measured using calibration plots of known film depths and comparing them
quantitatively against observed images and output signal traces.
When light of a certain wavelength is shone onto a fluorescent oil (or dye), the quantum
energy level of the individual dye molecules momentarily increases and the molecules are
elevated to a higher energy state. As soon as this occurs, energy (in the form of light that
is of a higher wavelength than the incoming light wavelength) is expelled instantaneously
from the molecules in their elevated state and the quantum energy level immediately
drops to that of its original „resting‟ state. This process continually occurs very rapidly
across the entire film/dye thickness.
Aswad Shiraz Manzoor Chapter 2 – Hydrodynamic Study-A Literature Review
49
Thin films will produce low levels of fluoresced light (i.e. light intensity) and vice versa.
This can be used to measure the thickness of a fluorescing fluid film by calibrating known
film thicknesses against varying levels of light intensity. The controlling factors of the
fluorescence process include the concentration of dye mixed in with the fluid film (if the
fluid film has no natural fluorescence) as well as the intensity and wavelength of the
incoming (exciter) light source.
The types of experiment which involve L.I.F. can be approximately categorised into two
groups; those experiments which measure film thickness in engine components (i.e.
piston/liner mechanisms, piston skirt region and various engine bearings) and those
which do not.
One of the pioneers of the L.I.F. technique [33] discussed the advantages of using a blue
laser system as an exciter light source for use in doped oil fluorescence. These included
better stability and power output at blue wavelengths, the use of ordinary optical glass
rather than quartz due to the absorbance of UV in a glass medium and the ability to
physically being able to see the blue beam of light as opposed to the „invisible‟ UV rays. A
Photomultiplier tube (P.M.T.) coupled with a digital voltmeter would provide the
necessary output signal required for a signal trace, a direct relation to the measured film
profile as shown in Figure 2.16.
Aswad Shiraz Manzoor Chapter 2 – Hydrodynamic Study-A Literature Review
50
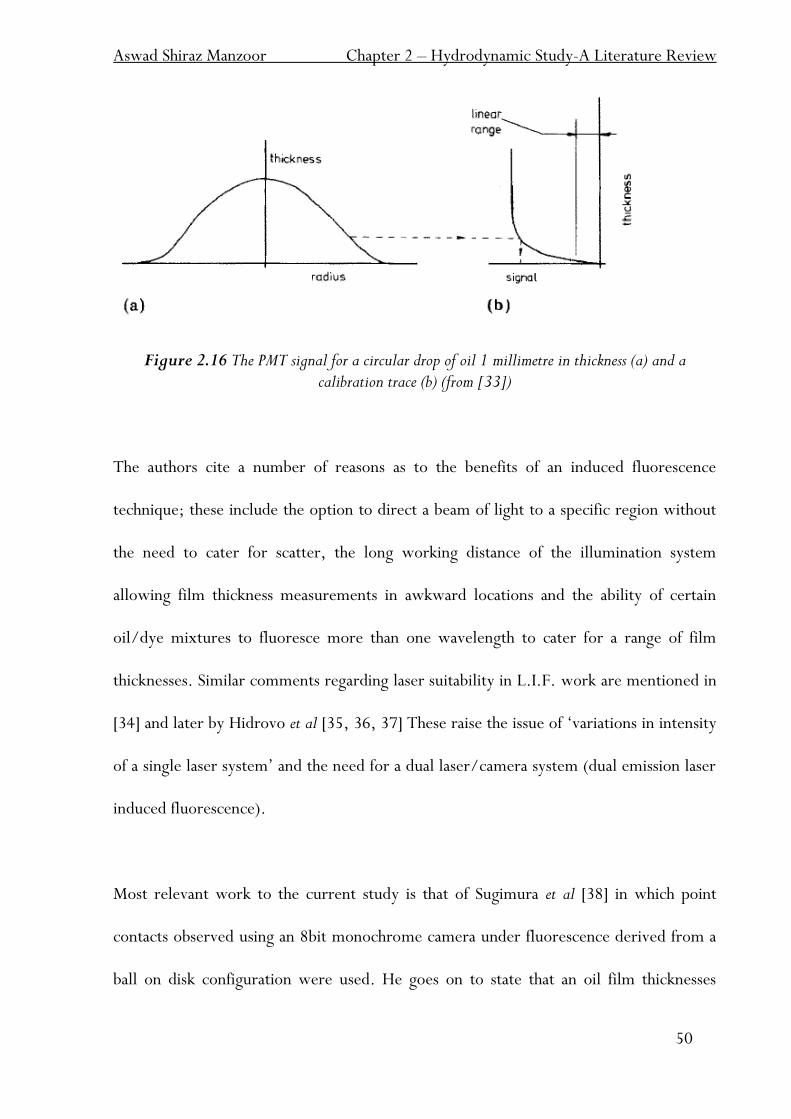
Figure 2.16 The PMT signal for a circular drop of oil 1 millimetre in thickness (a) and a calibration trace (b) (from [33])
The authors cite a number of reasons as to the benefits of an induced fluorescence
technique; these include the option to direct a beam of light to a specific region without
the need to cater for scatter, the long working distance of the illumination system
allowing film thickness measurements in awkward locations and the ability of certain
oil/dye mixtures to fluoresce more than one wavelength to cater for a range of film
thicknesses. Similar comments regarding laser suitability in L.I.F. work are mentioned in
[34] and later by Hidrovo et al [35, 36, 37] These raise the issue of „variations in intensity
of a single laser system‟ and the need for a dual laser/camera system (dual emission laser
induced fluorescence).
Most relevant work to the current study is that of Sugimura et al [38] in which point
contacts observed using an 8bit monochrome camera under fluorescence derived from a
ball on disk configuration were used. He goes on to state that an oil film thicknesses
Aswad Shiraz Manzoor Chapter 2 – Hydrodynamic Study-A Literature Review
51
down to 30 nm was detectable, albeit with two consistent problems; the „light
interference within thin films and the abundant background effect caused by cavities
formed at the film exit‟. Special mention is made to the ability of fluorescent imaging to
capture cavities present at the contact exit due to no film being present within a cavity
and thus a dark region results. Camera sensitivity is also commented upon; „A camera
with ten times higher sensitivity would provide film thickness data at a resolution
comparable with ultra thin film interferometry‟ as postulated by Johnston et al [39].
Varying the fluorescent intensity of a specific oil/dye is carried out generally by varying
the concentration of dye added to the lubricant film. Concentrations ranging from 0.01-
2% of total fluid mass are common in this field [40, 41 and 42]
The use of L.I.F. methods to determine the oil film thicknesses present within the
piston/liner mechanism within an IC engine was a natural progression for the technique.
Again, many systems use Lasers (Helium-Cadmium or Argon-Ion) as the light source [43,
44, 45 and 46]. Combinations of both high sensitive cameras and photomultiplier tubes
connected to the engine block by means of fibre optics are discussed. These works are
primarily concerned with reciprocating surfaces where the associated film thickness are
typically low (in the region of 10 µm and lower at times [44, 45]). The use of a high
powered laser coupled to a sensitive photomultiplier by means of fibre optics allows for
the adequate detection of thin films.
Aswad Shiraz Manzoor Chapter 2 – Hydrodynamic Study-A Literature Review
52
Calibrations from 30 to 80 µm were carried out by Hoult et al [43]. This consisted of
placing varying thin shims between optically flat microscope slides and taking P.M.T.
traces of the subsequent thickness film. They then extrapolate calibration coefficients to
complete the calibration response for thinner films. A film thickness deviation of 5% was
found to exist when larger films (approximately 120 µm) were encountered.
Richardson and Borman [44] reported a highly linear response when referring to the
fluorescent signal versus film thickness calibration. They take advantage of the natural
fluorescence phenomena of oils. However, they also state that the repeatability in their
calibration coefficients varied by as much as 10%. They attribute this to the „laser power
supply fluctuations‟ ultimately causing output variations. They make the case for an in-
situ calibration to be carried out prior to each test and also suggest doping the oil with a
fluorescent dye (on the condition that temperature fluctuations do not affect the
fluorescent intensity signal).
It has been possible to calibrate to a much thicker film thickness using the above
methodology; oil film calibrations of up to 500 µm were presented by Arcoumanis et al
[45] by means of an „enhanced resolution‟ micrometer. The optical fibre was mounted
flush with on the micrometers anvil and the oil film thickness continuously varied.
Aswad Shiraz Manzoor Chapter 2 – Hydrodynamic Study-A Literature Review
53
The use of thickness gauges (i.e. feeler gauges) and surface plating was implemented by
Nakayama et al [46]. Film thicknesses from 0 to 100 µm were calibrated „arbitrarily‟,
although the film thicknesses present during testing were in the region of 10-30 µm.
2.4 Cavitation
The precise nature of which form of cavitation that occurs within plain bearings and its
role in lubrication has been dealt with in detail only by a select few in the past. The two
types of cavitation that are widely accepted in lubricating film scenarios are „Gaseous‟ and
„Vapour‟. However, the former is of great interest at present due to theories of increased
load support and inlet suction. There has been research conducted ranging from looking
at bearing lubrication cavitation in numerical analysis [47, 48 and 49] to cavitation effects
in oils under operating conditions [50] and finally the issue of cavitation occurring in
elastohydrodynamic contacts [38].
The majority of studies have explored the implication of cavitation in reciprocating
contacts. Findings from Priest et al [49] conclude that „Reynolds boundary condition and
fluid film reformation may be applicable at high piston ring loads whilst fluid film
separation may be applicable at low loads. It is stated that the cavity pressure is equated
to the saturation pressure, which is in turn approximated to the atmospheric pressure.
Findings regarding cavitation are made by Broman [47] in which the presence of sub-
atmospheric pressure within spiral groove bearings is analysed. It is suggested that sub-
Aswad Shiraz Manzoor Chapter 2 – Hydrodynamic Study-A Literature Review
54
atmospheric pressures are not necessarily required for lubricant to enter the bearing and
that cavitation may not occur for flat spiral groove thrust bearings. This is postulated for a
proposed „modified‟ bearing design. This is further concluded by remarking that „the
velocity of the rotating bearing surface‟ would ensure adequate lubrication of fluid film
into the pressurised region effectively increasing the performance of the bearing.
Experimental contributions in reciprocating piston ring assemblies have been made from
Arcoumanis et al [51 and 52]. The onset and development of cavitation in the lubricant
film were visualised by means of a charge coupled device (CCD) imaging system
illuminated by means of a flash lamp. Coupled to this, the film thickness was measured
using a capacitance technique. Later work by the same authors [52] implemented the use
of L.I.F. techniques to determine the film thickness. The presence of cavitation in the
ring-liner pairing in the diverging region was documented. However, efforts were
concentrated upon the evolution of the cavitation into „ferns, fissures, strings and
bubbles‟.
There is an apparent lack of experimental investigation to aid analytical solutions when
examining cavitation. It is something that has always been regarded as a phenomenon that
is present in lubricated contacts, but has only ever been considered at the exit plane of
most contacts. The current research considers the reported effects of cavitation near the
bearing inlet.

Aswad Shiraz Manzoor Chapter 2 – Hydrodynamic Study-A Literature Review
55
2.5 Summary of review
An overview of the current state of knowledge of textured hydrodynamic bearings has
been presented. Mechanisms of fluid film formation, postulated texture theories, film
thickness developments and the implication of cavitation have all been introduced and a
brief overview of each given.
However, it appears that there is still a lack of experimental research within textured
bearings that attempts to explore the relationship between film thickness measurements
and friction simultaneously, in both textured and non-textured bearings. In addition to
this, very little work has been carried out with regards to optical (i.e. visual) film
thickness measurements in the hope of advancing the precise role of cavitation in
hydrodynamic bearings.
The current contribution is needed in order to see whether the observed differences in
friction are indeed due to the hydrodynamic action of the modified topography (or due to
other explanations such as starvation or in-situ oil reservoirs).

Chapter 3
Experimental Development
Aswad Shiraz Manzoor Chapter 3 – Experimental Development
57
3.1 Introduction
The current work focuses upon lubricant films present in a convergent pad loaded against
a flat surface (a flat surface was chosen for ease with regards to setting the pad attitude).
The pad in this case, can be thought of as a stationary surface with microtextured pockets
on one side, and this will be loaded against a rotating glass disc, which represents the flat
surface. The primary objective that was kept in mind when designing the experimental
rig was the ability of the apparatus to accurately measure and record the film thickness,
friction and possibly cavitation, all in situ and all simultaneously.
To date, there have been no published works on the experimental findings of the
simultaneous study of friction, cavitation and film thickness in textured hydrodynamic
bearings, primarily because such studies are difficult. Potential problems included the
dynamic stability of the overall system (especially as the bearing surfaces tend towards
near parallel), the large range of film thicknesses encountered and the need for surface
features of accurately known dimensions to be located on the bearing surfaces.
3.2 The Design and Commissioning of the Test Rig
The proceeding section deals with the three main systems and the methodology in which
they were originally conceptualised.

Aswad Shiraz Manzoor Chapter 3 – Experimental Development
58
3.3 The Hydrodynamic Test Rig – General Outline
The rig incorporates three main areas of interest; The L.I.F. System, the Load Arm
Mechanism and the Friction Analysis System. The following criteria were kept in mind
when originally designing the test rig;
The rig would measure light intensity fluctuations in the lubricant film containing a
dissolved fluorescent dye. The film will be illuminated with a corresponding light source,
matched to the fluorescent dye, causing the dye to fluoresce. This will give information
with regards to the film thickness, as there is a relationship between excitation light
intensity and film thickness.
It will also provide measurements of friction between the two bearing surfaces. This will
be achieved by accurately recording the small displacements of a load arm attached to one
of the surfaces in contact. A displacement sensor located directly next to the load arm
will be employed for this. The stiffness of the arm will be of a known value, and the
displacement of the arm can be translated into a friction reading. The main loading arm
concept and friction analysis system of the rig was designed by Dr Simon Medina of
Imperial College, who supervised initial experiments conducted. An outline of these can
be seen in Figure 3.1.
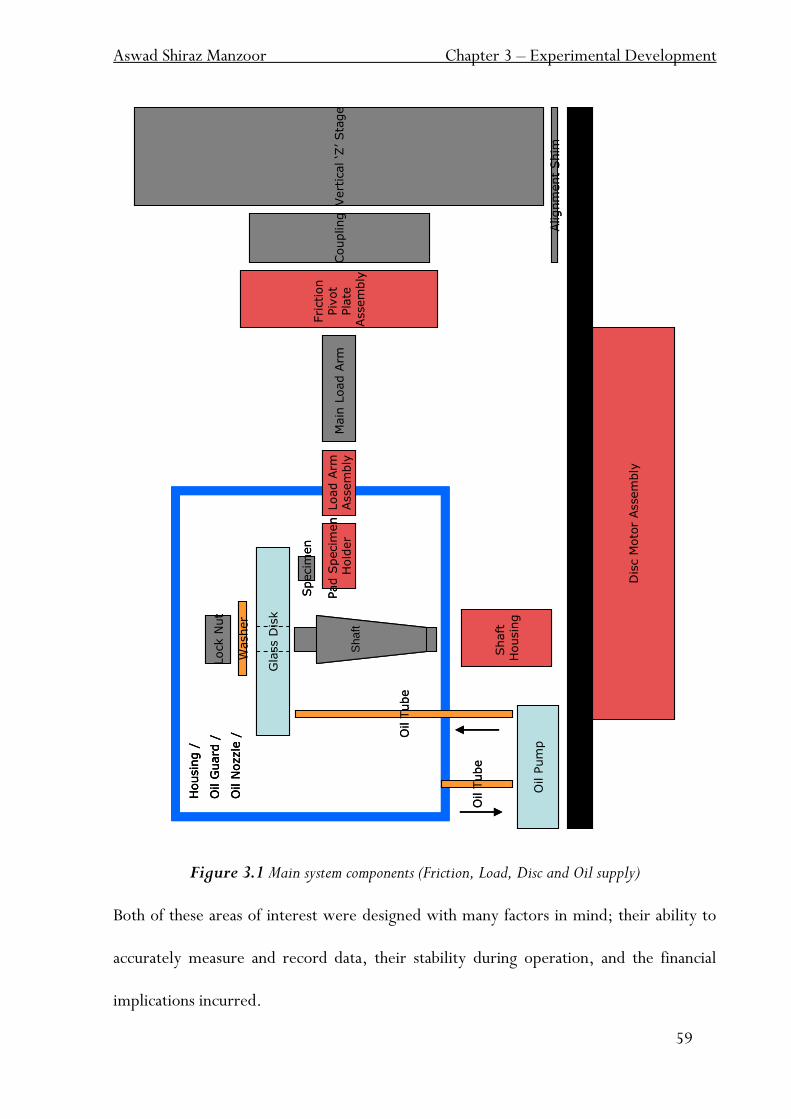
Aswad Shiraz Manzoor Chapter 3 – Experimental Development
59
Figure 3.1 Main system components (Friction, Load, Disc and Oil supply)
Both of these areas of interest were designed with many factors in mind; their ability to
accurately measure and record data, their stability during operation, and the financial
implications incurred.
Housin
g /
Oil G
uard
/
Oil N
ozzle
/
Dis
c M
oto
r Assem
bly
Washer
Shaft
H
ousin
g
Gla
ss D
isk
Lock N
ut
Vert
ical ‘Z
’Sta
ge
Coupling
Friction
Piv
ot
Pla
te
Assem
bly
Main
Load A
rm
Load A
rmAssem
bly
Alignm
ent
Shim
Pad S
pecim
en
Hold
er
Specim
en
Oil T
ube
Oil T
ube
Oil P
um
p
Shaft
Housin
g /
Oil G
uard
/
Oil N
ozzle
/
Housin
g /
Oil G
uard
/
Oil N
ozzle
/
Dis
c M
oto
r Assem
bly
Washer
Shaft
H
ousin
g
Gla
ss D
isk
Lock N
ut
Vert
ical ‘Z
’Sta
ge
Coupling
Friction
Piv
ot
Pla
te
Assem
bly
Main
Load A
rm
Load A
rmAssem
bly
Alignm
ent
Shim
Pad S
pecim
en
Hold
er
Specim
en
Oil T
ube
Oil T
ube
Oil P
um
p
Shaft
Aswad Shiraz Manzoor Chapter 3 – Experimental Development
60
3.3.1 Film Thickness Measurements – L.I.F. System
The specific L.I.F system relevant to this research was chosen for a number of reasons.
These include the low costs of implementing such a system, the reliability of equipment
used and the overall non-intrusive technique that it entails. The basic outline of any L.I.F
set-up comprises three main areas;
Light Source
Microscope
Camera
The general consensus of a Laser having to be used as a light source is a wide
misconception. Many L.I.F systems use an ordinary lamp/bulb configuration which emits
light at the desired wavelength, most commonly Ultraviolet (U.V) or Blue light. These
types of light sources include Black Light-Blue bulbs, U.V lamps and Mercury-Xenon
bulbs. All of these various light sources emit a strong U.V wavelength spectrum. This is
ideal for many hydrocarbon oils which exhibit a natural fluorescence phenomenon. Lasers
tend to be used due to their precisely known wavelength and very high intensity.
However, financial implications associated with lasers ruled them out.
The microscope set-up contains one of the most crucial aspects of the rig, the beam
splitter, which contains the „fluorescent cube‟. This allows the incoming light to be
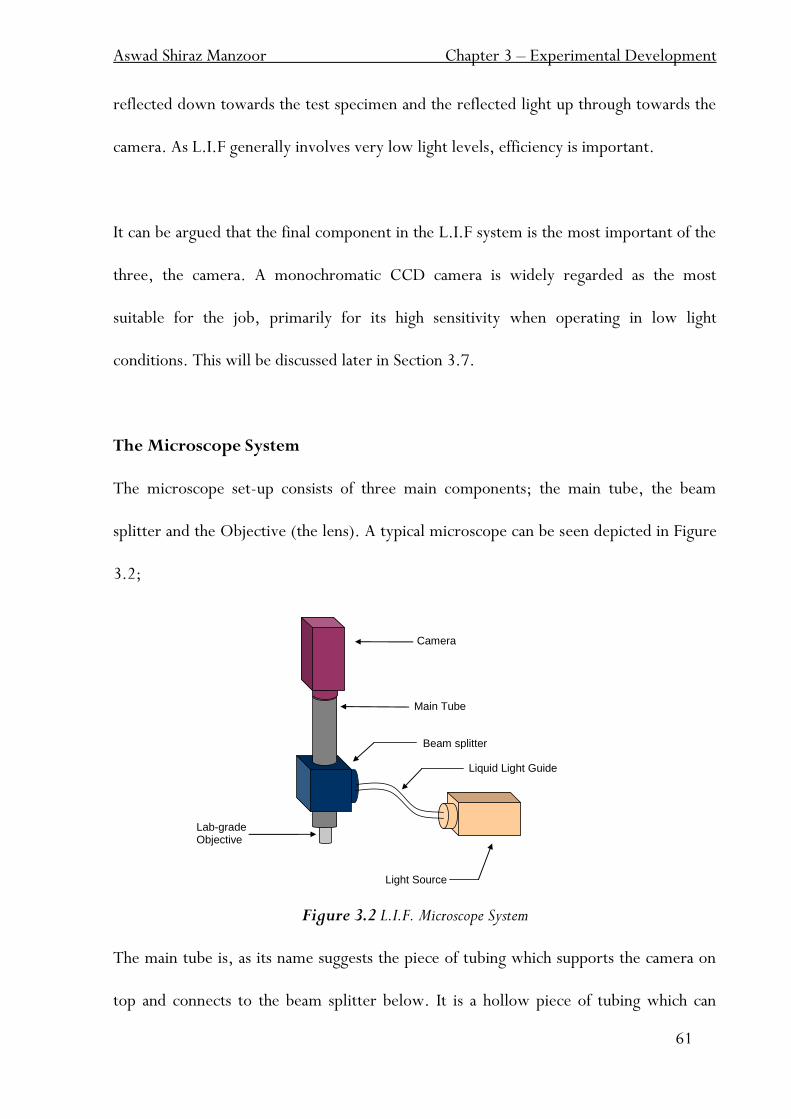
Aswad Shiraz Manzoor Chapter 3 – Experimental Development
61
Camera
Main Tube
Beam splitter
Liquid Light Guide
Light Source
Lab-grade Objective
reflected down towards the test specimen and the reflected light up through towards the
camera. As L.I.F generally involves very low light levels, efficiency is important.
It can be argued that the final component in the L.I.F system is the most important of the
three, the camera. A monochromatic CCD camera is widely regarded as the most
suitable for the job, primarily for its high sensitivity when operating in low light
conditions. This will be discussed later in Section 3.7.
The Microscope System
The microscope set-up consists of three main components; the main tube, the beam
splitter and the Objective (the lens). A typical microscope can be seen depicted in Figure
3.2;
Figure 3.2 L.I.F. Microscope System
The main tube is, as its name suggests the piece of tubing which supports the camera on
top and connects to the beam splitter below. It is a hollow piece of tubing which can
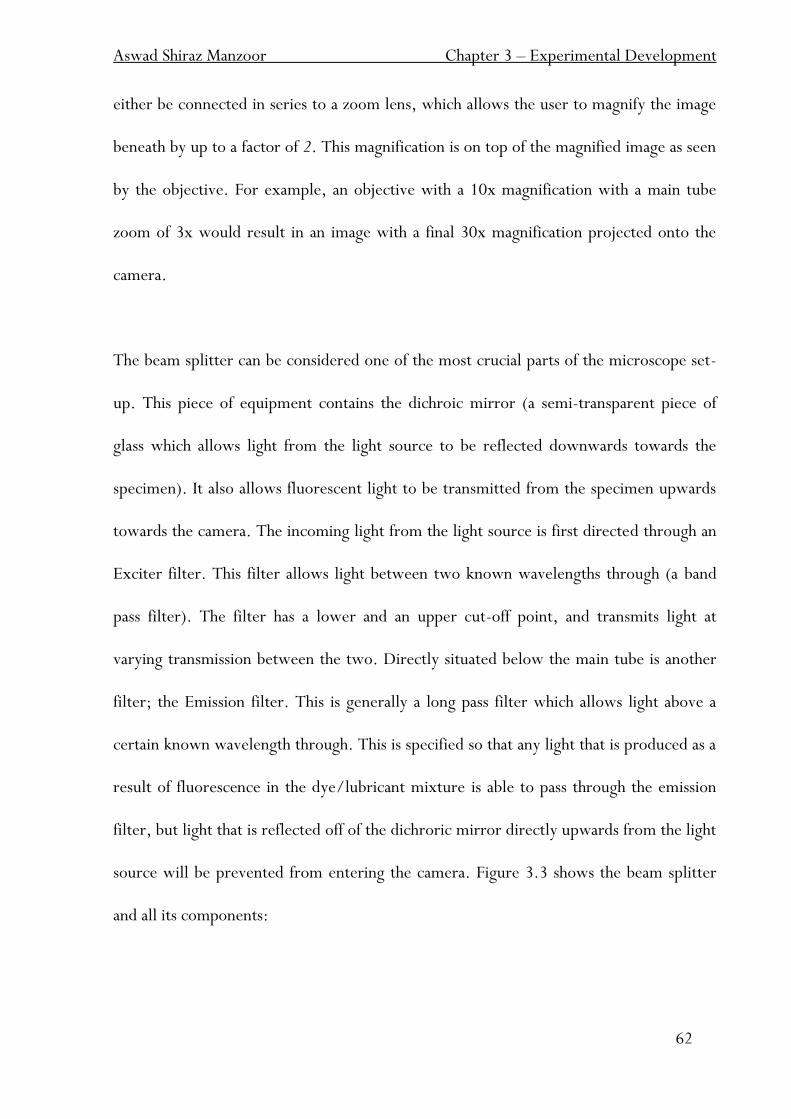
Aswad Shiraz Manzoor Chapter 3 – Experimental Development
62
either be connected in series to a zoom lens, which allows the user to magnify the image
beneath by up to a factor of 2. This magnification is on top of the magnified image as seen
by the objective. For example, an objective with a 10x magnification with a main tube
zoom of 3x would result in an image with a final 30x magnification projected onto the
camera.
The beam splitter can be considered one of the most crucial parts of the microscope set-
up. This piece of equipment contains the dichroic mirror (a semi-transparent piece of
glass which allows light from the light source to be reflected downwards towards the
specimen). It also allows fluorescent light to be transmitted from the specimen upwards
towards the camera. The incoming light from the light source is first directed through an
Exciter filter. This filter allows light between two known wavelengths through (a band
pass filter). The filter has a lower and an upper cut-off point, and transmits light at
varying transmission between the two. Directly situated below the main tube is another
filter; the Emission filter. This is generally a long pass filter which allows light above a
certain known wavelength through. This is specified so that any light that is produced as a
result of fluorescence in the dye/lubricant mixture is able to pass through the emission
filter, but light that is reflected off of the dichroric mirror directly upwards from the light
source will be prevented from entering the camera. Figure 3.3 shows the beam splitter
and all its components:
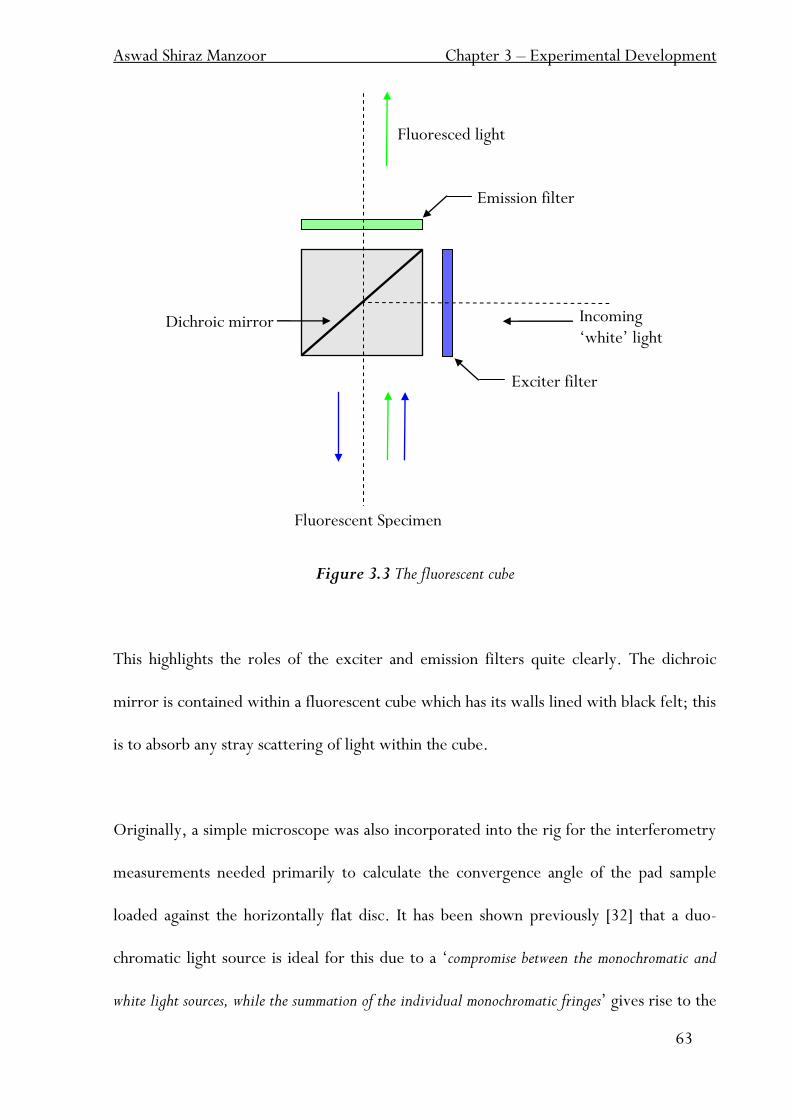
Aswad Shiraz Manzoor Chapter 3 – Experimental Development
63
Figure 3.3 The fluorescent cube
This highlights the roles of the exciter and emission filters quite clearly. The dichroic
mirror is contained within a fluorescent cube which has its walls lined with black felt; this
is to absorb any stray scattering of light within the cube.
Originally, a simple microscope was also incorporated into the rig for the interferometry
measurements needed primarily to calculate the convergence angle of the pad sample
loaded against the horizontally flat disc. It has been shown previously [32] that a duo-
chromatic light source is ideal for this due to a „compromise between the monochromatic and
white light sources, while the summation of the individual monochromatic fringes‟ gives rise to the
Fluoresced light
Exciter filter
Emission filter
Incoming „white‟ light
Fluorescent Specimen
Dichroic mirror
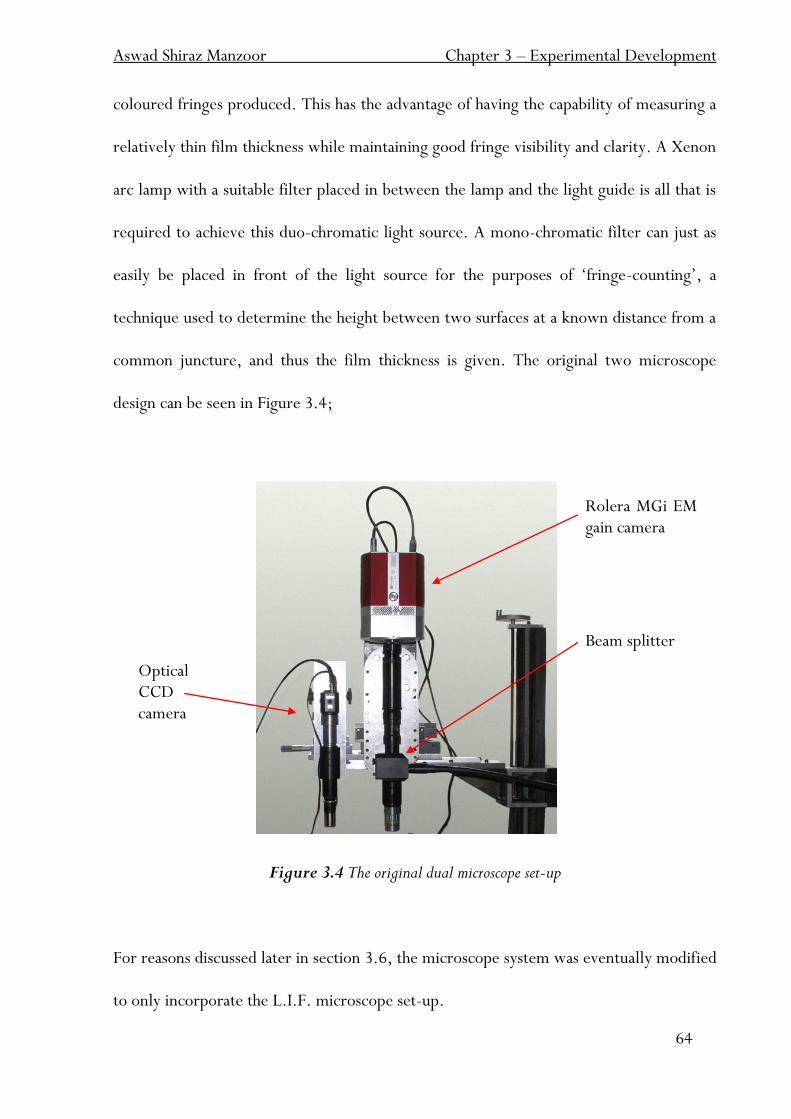
Aswad Shiraz Manzoor Chapter 3 – Experimental Development
64
coloured fringes produced. This has the advantage of having the capability of measuring a
relatively thin film thickness while maintaining good fringe visibility and clarity. A Xenon
arc lamp with a suitable filter placed in between the lamp and the light guide is all that is
required to achieve this duo-chromatic light source. A mono-chromatic filter can just as
easily be placed in front of the light source for the purposes of „fringe-counting‟, a
technique used to determine the height between two surfaces at a known distance from a
common juncture, and thus the film thickness is given. The original two microscope
design can be seen in Figure 3.4;
Figure 3.4 The original dual microscope set-up
For reasons discussed later in section 3.6, the microscope system was eventually modified
to only incorporate the L.I.F. microscope set-up.
200mm
Rolera MGi EM gain camera
Optical CCD camera
Beam splitter
Aswad Shiraz Manzoor Chapter 3 – Experimental Development
65
Light Source and Fluorescent Dye
It was decided that a range of light sources would be considered when designing the LIF
system. As earlier work [33, 40 and 34] all involved using a high pressure Mercury lamp
of some kind, these were investigated first. They tend to produce relatively high output
intensity coupled with low costs. Filters must be employed however, to specifically
target and match the excitation wavelength of the fluorescent dyes. The use of lasers was
ruled out at this early stage even though they are generally considered to be the optimal
technique in producing intense beams (and at a single known wavelength) of light. The
beam of light is non-divergent and thus has the advantage of easy focussing on the
specimen [34]. Financial constraints as well as numerous health and safety restrictions
meant that lasers could not be considered for the current research.
Examples of high pressure gas discharge lamps include Mercury lamps, Xenon lamps,
Mercury-Xenon lamps, Sodium lamps and Black light Blue bulbs. These types of bulbs
usually consist of either a filament coil encased within a small glass envelope or two
electrodes separated by a small gap (this forms the „arc‟) and this envelope is located
within a larger bulb. The atmosphere surrounding the two bulbs and the envelope itself is
filled with a high pressure gas, dependent on the type of bulb. These types of lamps
require large amounts of start-up voltages to ignite the arc, referred to as the „burner‟.
These lamps do suffer from the drawback of limited service life, and consequently the
efficiency losses associated with this must be considered.
Aswad Shiraz Manzoor Chapter 3 – Experimental Development
66
One of the most versatile fluorescent dyes used in fluorescent applications today is
Pyrene. The advantages attached to this dye are that it „dissolves well in oil and is readily
available‟ as discussed by Sugimura et al [38]. It was originally decided for these reasons
that it would be employed as the fluorescent dye for the current tests. This dye has an
absorption peak of 336 nm and an emission peak of 480 nm at high solute concentrations
according to the Handbook of Fluorescence [53]. High concentrations are generally those
which involve a dye concentration of 1% mass and above. The emission and exciter filters
as well as the dichroic mirror, as shown in Figure 3.4 were chosen to match these figures
accordingly. Mercury lamps are a very common light source paired to Pyrene for use in
fluorescence work, and thus it was decided that the use of a black light blue high pressure
mercury lamp would suit. However, trials of a lab manufactured light source proved to
be unsuccessful due to the inability of being able to focus the majority of the light onto
the liquid light guide (10mm across in diameter). It was for this reason that a Hamamatsu
UV Spot Light Source LIGHTNINGCURE L8222 was later purchased for use as a
suitably powerful source of UV light. It contains a 150 watt Mercury-Xenon arc lamp and
has an electronically controllable shutter. Coupled with this, the use of Pyrene has been
demonstrated successfully previously, but in relatively low volumes. Due to the sheer
volumes of oil being considered in this research (in the region of 1 litre per test), it was
deemed best not to pursue the use of Pyrene due to high costs. A commercially available
oil tracer dye, „Dye-Lite‟ was selected. It is a blend of two separate component dyes
(Perylene and Napthalimide) each with their own characteristic absorption profiles and is
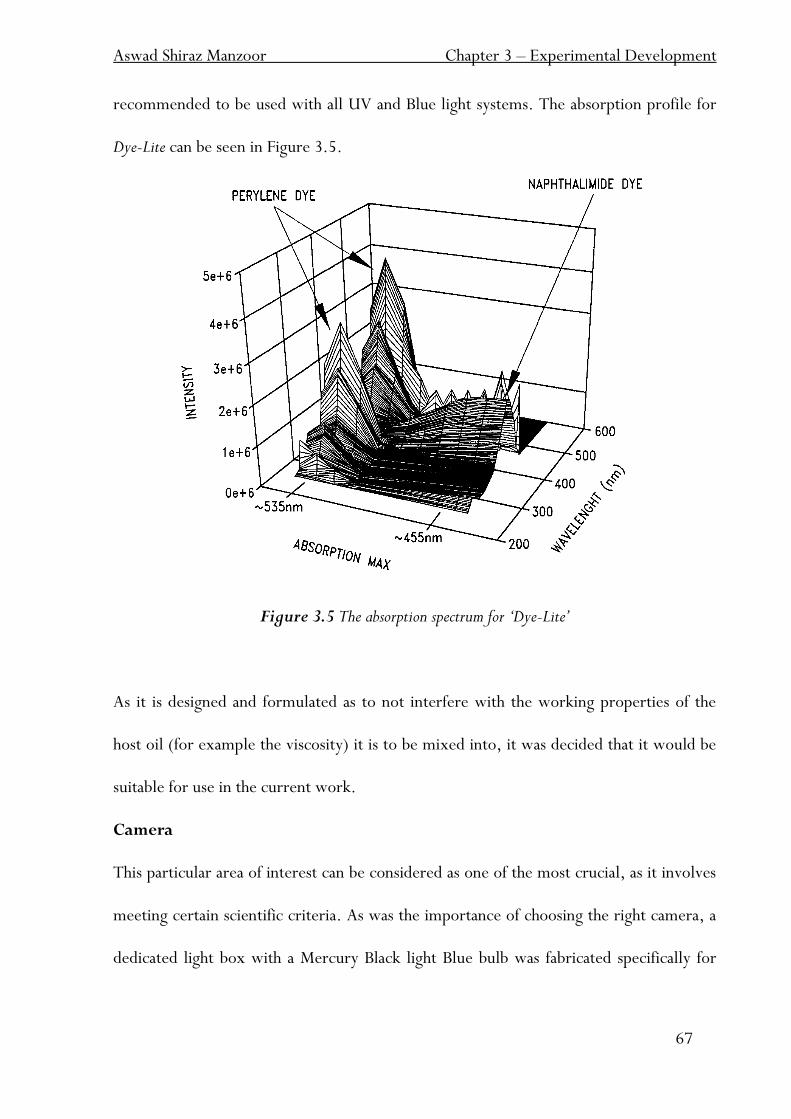
Aswad Shiraz Manzoor Chapter 3 – Experimental Development
67
recommended to be used with all UV and Blue light systems. The absorption profile for
Dye-Lite can be seen in Figure 3.5.
Figure 3.5 The absorption spectrum for ‘Dye-Lite’
As it is designed and formulated as to not interfere with the working properties of the
host oil (for example the viscosity) it is to be mixed into, it was decided that it would be
suitable for use in the current work.
Camera
This particular area of interest can be considered as one of the most crucial, as it involves
meeting certain scientific criteria. As was the importance of choosing the right camera, a
dedicated light box with a Mercury Black light Blue bulb was fabricated specifically for
Aswad Shiraz Manzoor Chapter 3 – Experimental Development
68
the purpose of selecting a suitable camera as the Hamamatsu light source had not yet been
purchased at this stage.
The specification required by the primary work objectives must all be adhered to, as they
are often inter-dependent. Such points include;
Dynamic Range – The ability of the camera to simultaneously detect low and high
light intensities at one instance in time.
Sensitivity – The minimum level of light that the cameras sensor can detect at any
given time.
Shutter Speed – The shortest amount of time the cameras shutter is open, crucial
when trying to snap very small features.
Cooling – Cooler sensors induce a lower noise level, which is recommended for
high sensitivity applications such as L.I.F.
Electron Multiplying (EM) Gain – A specific type of CCD which amplifies the
stored charge before the „read-out‟ stage. This has the advantage of signal
amplification minus noise amplification. Again, this is fundamental in a high
sensitivity (i.e. low light) setup.
High sensitivity cameras (EM gain cameras in particular) use some of the most advanced
CCD technology available and are as such, expensive.
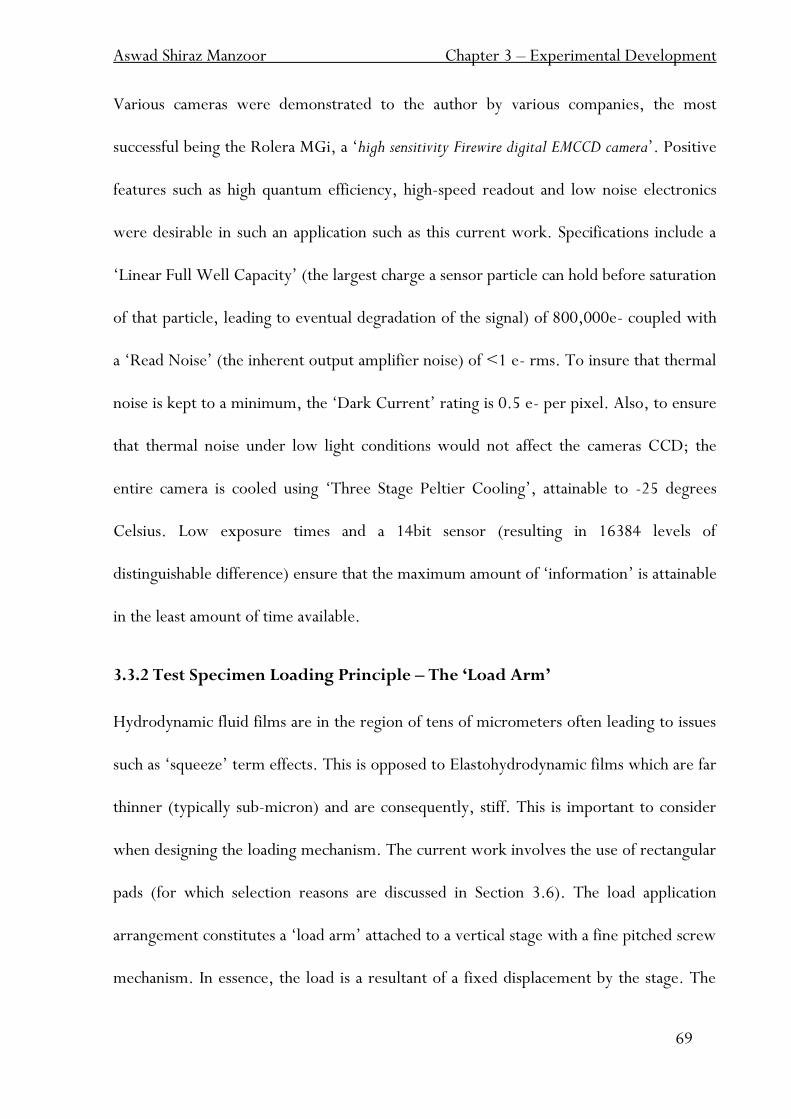
Aswad Shiraz Manzoor Chapter 3 – Experimental Development
69
Various cameras were demonstrated to the author by various companies, the most
successful being the Rolera MGi, a „high sensitivity Firewire digital EMCCD camera‟. Positive
features such as high quantum efficiency, high-speed readout and low noise electronics
were desirable in such an application such as this current work. Specifications include a
„Linear Full Well Capacity‟ (the largest charge a sensor particle can hold before saturation
of that particle, leading to eventual degradation of the signal) of 800,000e- coupled with
a „Read Noise‟ (the inherent output amplifier noise) of <1 e- rms. To insure that thermal
noise is kept to a minimum, the „Dark Current‟ rating is 0.5 e- per pixel. Also, to ensure
that thermal noise under low light conditions would not affect the cameras CCD; the
entire camera is cooled using „Three Stage Peltier Cooling‟, attainable to -25 degrees
Celsius. Low exposure times and a 14bit sensor (resulting in 16384 levels of
distinguishable difference) ensure that the maximum amount of „information‟ is attainable
in the least amount of time available.
3.3.2 Test Specimen Loading Principle – The ‘Load Arm’
Hydrodynamic fluid films are in the region of tens of micrometers often leading to issues
such as „squeeze‟ term effects. This is opposed to Elastohydrodynamic films which are far
thinner (typically sub-micron) and are consequently, stiff. This is important to consider
when designing the loading mechanism. The current work involves the use of rectangular
pads (for which selection reasons are discussed in Section 3.6). The load application
arrangement constitutes a „load arm‟ attached to a vertical stage with a fine pitched screw
mechanism. In essence, the load is a resultant of a fixed displacement by the stage. The
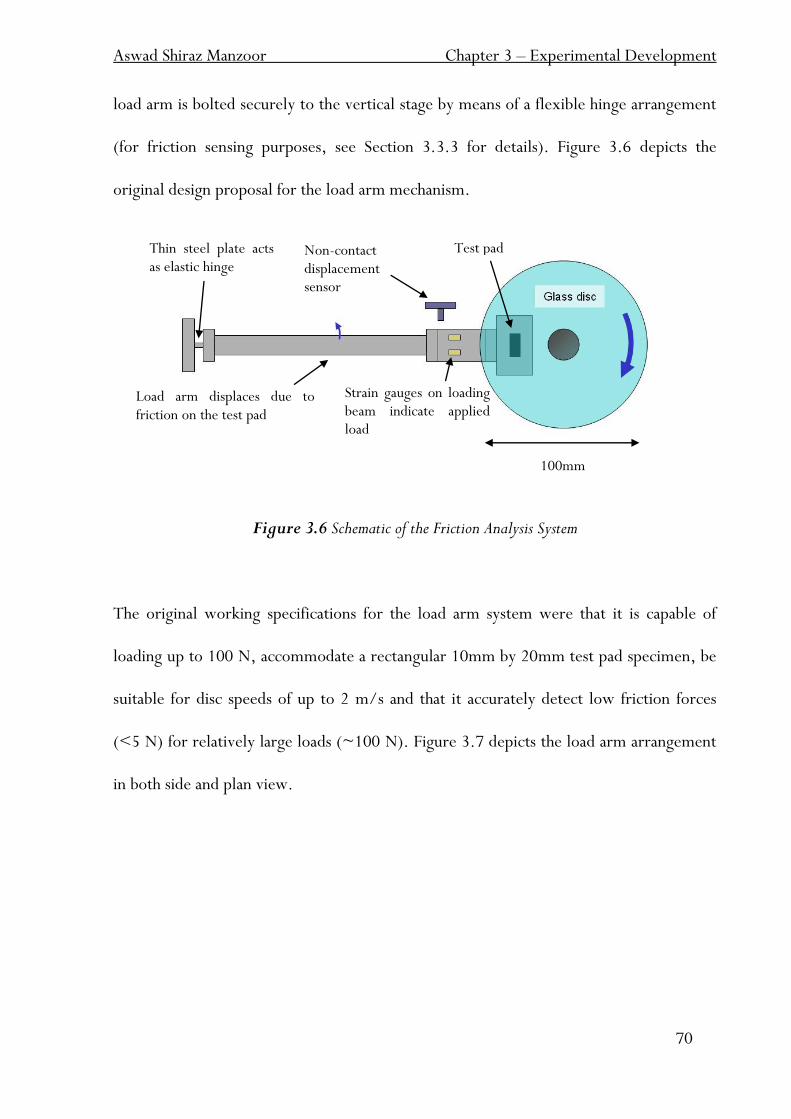
Aswad Shiraz Manzoor Chapter 3 – Experimental Development
70
load arm is bolted securely to the vertical stage by means of a flexible hinge arrangement
(for friction sensing purposes, see Section 3.3.3 for details). Figure 3.6 depicts the
original design proposal for the load arm mechanism.
Figure 3.6 Schematic of the Friction Analysis System
The original working specifications for the load arm system were that it is capable of
loading up to 100 N, accommodate a rectangular 10mm by 20mm test pad specimen, be
suitable for disc speeds of up to 2 m/s and that it accurately detect low friction forces
(<5 N) for relatively large loads (~100 N). Figure 3.7 depicts the load arm arrangement
in both side and plan view.
Thin steel plate acts as elastic hinge
Non-contact displacement sensor
Load arm displaces due to friction on the test pad
Test pad
Strain gauges on loading beam indicate applied load
100mm
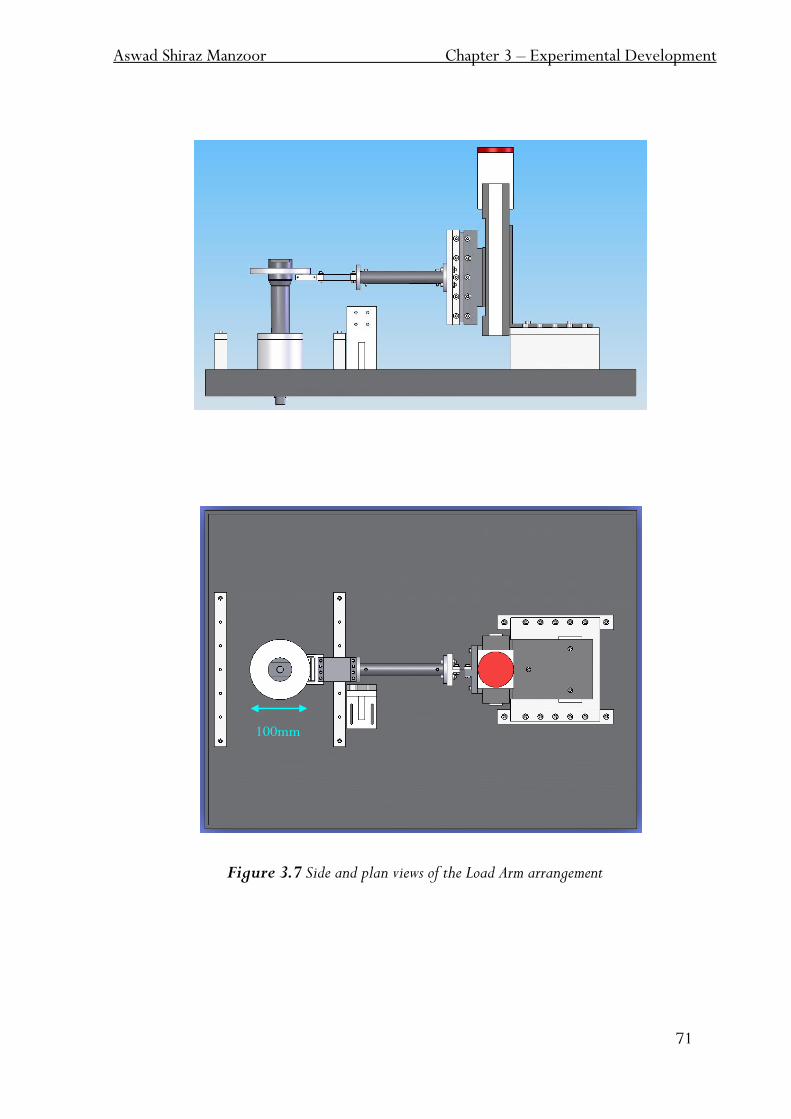
Aswad Shiraz Manzoor Chapter 3 – Experimental Development
71
Figure 3.7 Side and plan views of the Load Arm arrangement
100mm
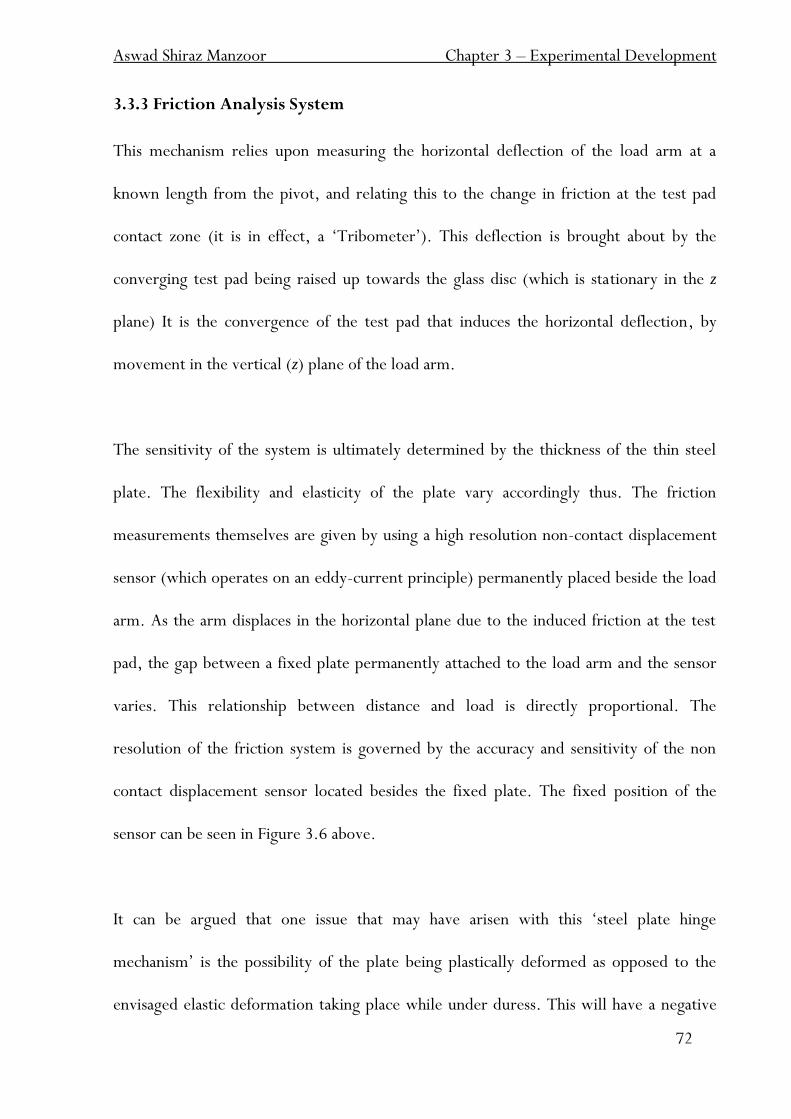
Aswad Shiraz Manzoor Chapter 3 – Experimental Development
72
3.3.3 Friction Analysis System
This mechanism relies upon measuring the horizontal deflection of the load arm at a
known length from the pivot, and relating this to the change in friction at the test pad
contact zone (it is in effect, a „Tribometer‟). This deflection is brought about by the
converging test pad being raised up towards the glass disc (which is stationary in the z
plane) It is the convergence of the test pad that induces the horizontal deflection, by
movement in the vertical (z) plane of the load arm.
The sensitivity of the system is ultimately determined by the thickness of the thin steel
plate. The flexibility and elasticity of the plate vary accordingly thus. The friction
measurements themselves are given by using a high resolution non-contact displacement
sensor (which operates on an eddy-current principle) permanently placed beside the load
arm. As the arm displaces in the horizontal plane due to the induced friction at the test
pad, the gap between a fixed plate permanently attached to the load arm and the sensor
varies. This relationship between distance and load is directly proportional. The
resolution of the friction system is governed by the accuracy and sensitivity of the non
contact displacement sensor located besides the fixed plate. The fixed position of the
sensor can be seen in Figure 3.6 above.
It can be argued that one issue that may have arisen with this „steel plate hinge
mechanism‟ is the possibility of the plate being plastically deformed as opposed to the
envisaged elastic deformation taking place while under duress. This will have a negative
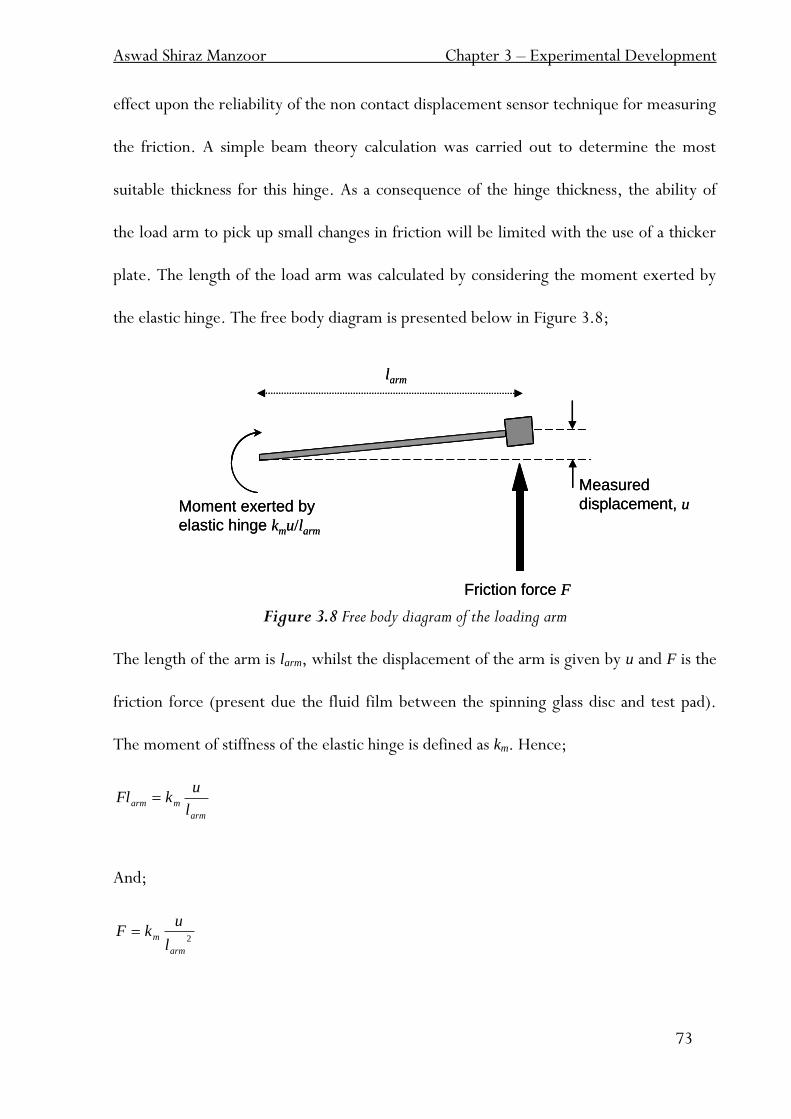
Aswad Shiraz Manzoor Chapter 3 – Experimental Development
73
effect upon the reliability of the non contact displacement sensor technique for measuring
the friction. A simple beam theory calculation was carried out to determine the most
suitable thickness for this hinge. As a consequence of the hinge thickness, the ability of
the load arm to pick up small changes in friction will be limited with the use of a thicker
plate. The length of the load arm was calculated by considering the moment exerted by
the elastic hinge. The free body diagram is presented below in Figure 3.8;
Figure 3.8 Free body diagram of the loading arm
The length of the arm is larm, whilst the displacement of the arm is given by u and F is the
friction force (present due the fluid film between the spinning glass disc and test pad).
The moment of stiffness of the elastic hinge is defined as km. Hence;
arm
marml
ukFl
And;
2
arm
ml
ukF
Moment exerted by
elastic hinge kmu/larm
larm
Measured
displacement, u
Friction force F
Moment exerted by
elastic hinge kmu/larm
larm
Measured
displacement, u
Friction force F
Aswad Shiraz Manzoor Chapter 3 – Experimental Development
74
Where km is defined as;
l
EIkm
3
Where I is the moment of inertia of the shim (of length bs and thickness ds) as given by;
12
3
ss dbI
And E is Young‟s modulus of the steel shim
3.4 Peripheral Lubrication – Oil Supply
EHL test rigs consist of a circular stainless steel oil bath, in which the entire ball holder
can either be partially or fully submerged into the oil filled bath. This eliminates the need
for a recirculation type of set up as the oil is continually being dragged in to the contact
by means of entrainment. However, due to the nature of the current design, this was not
possible. A polypropylene oil bath was designed and constructed. All interfaces were
sealed with a suitable liquid gasket type sealer. An automotive oil pump was attached to
an electronically variable speed motor, coupled by a toothed belt. The original design
incorporated a diverging nozzle pointing up towards the bottom of the oil disc near the
pad inlet area. Initial preliminary tests highlighted a couple of serious flaws in this design,
the most serious of which being the spread of oil film was not adequate enough to cover
the entire area of the pad inlet.
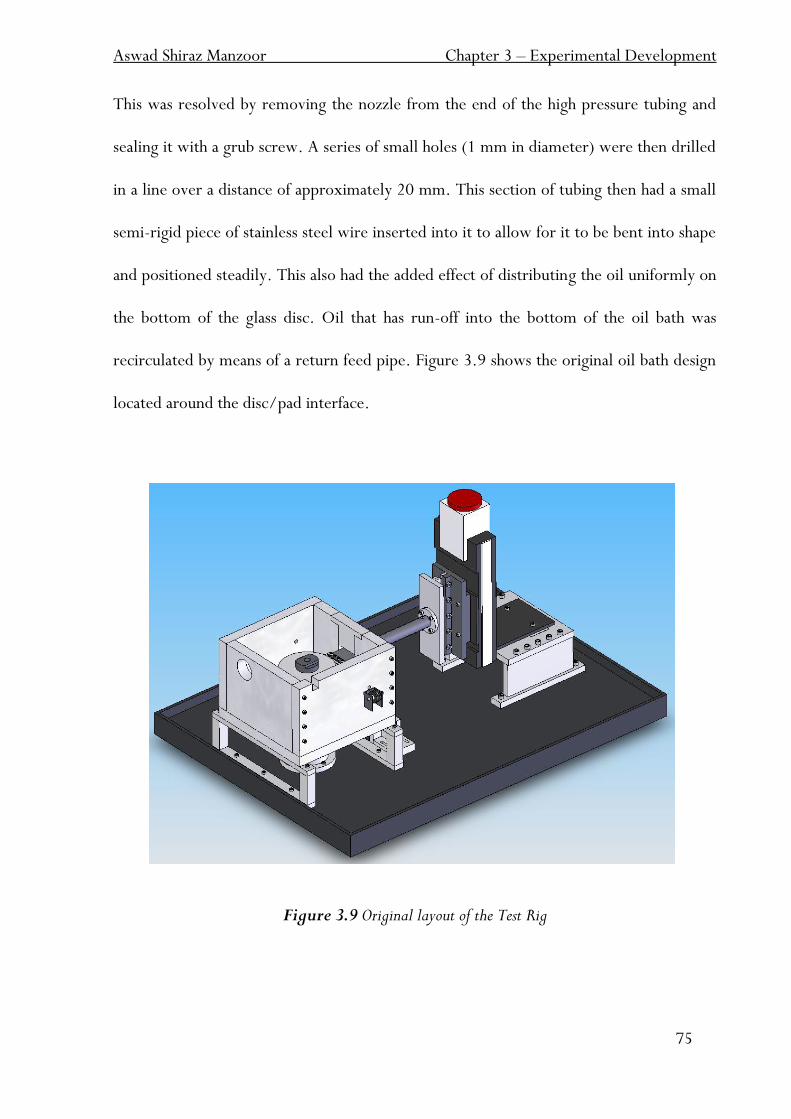
Aswad Shiraz Manzoor Chapter 3 – Experimental Development
75
This was resolved by removing the nozzle from the end of the high pressure tubing and
sealing it with a grub screw. A series of small holes (1 mm in diameter) were then drilled
in a line over a distance of approximately 20 mm. This section of tubing then had a small
semi-rigid piece of stainless steel wire inserted into it to allow for it to be bent into shape
and positioned steadily. This also had the added effect of distributing the oil uniformly on
the bottom of the glass disc. Oil that has run-off into the bottom of the oil bath was
recirculated by means of a return feed pipe. Figure 3.9 shows the original oil bath design
located around the disc/pad interface.
Figure 3.9 Original layout of the Test Rig
Aswad Shiraz Manzoor Chapter 3 – Experimental Development
76
3.5 Rotating Disc – The Drive Train Mechanism
As shown in the overall schematic of the system (see earlier, Figure 3.1) the glass disc is
bolted down to the main shaft by a single lock nut arrangement. This shaft is held in the
test rig platform by two ball bearings. The bottom of the main shaft is coupled to a twin
V-pulley by means of a simple locating keyway. This pulley is attached to a second V-
pulley via two V-belts. This second pulley is driven by a high torque electric motor,
controlled by means of control loop feedback system. With regards to the disc speed, it
was envisaged that in accordance with previous computational research that velocities of
up to 2 metres per second would be attained. This was later changed to a maximum disc
speed of 1 metre per second for reasons relating to the spread and fling of the oil at
higher speeds.
3.6 The Test Pad Specimen
The current research involves the use of a 10 mm by 20 mm rectangular pad. Previous
theoretical work undertaken within Imperial College has typically modelled pads with an
l/b ratio of 0.5 (where l is the length of the bearing and b is the breadth)
Several laser honed steel samples had been supplied externally via the industrial sponsor,
a typical example which can be seen in Figure 3.10;
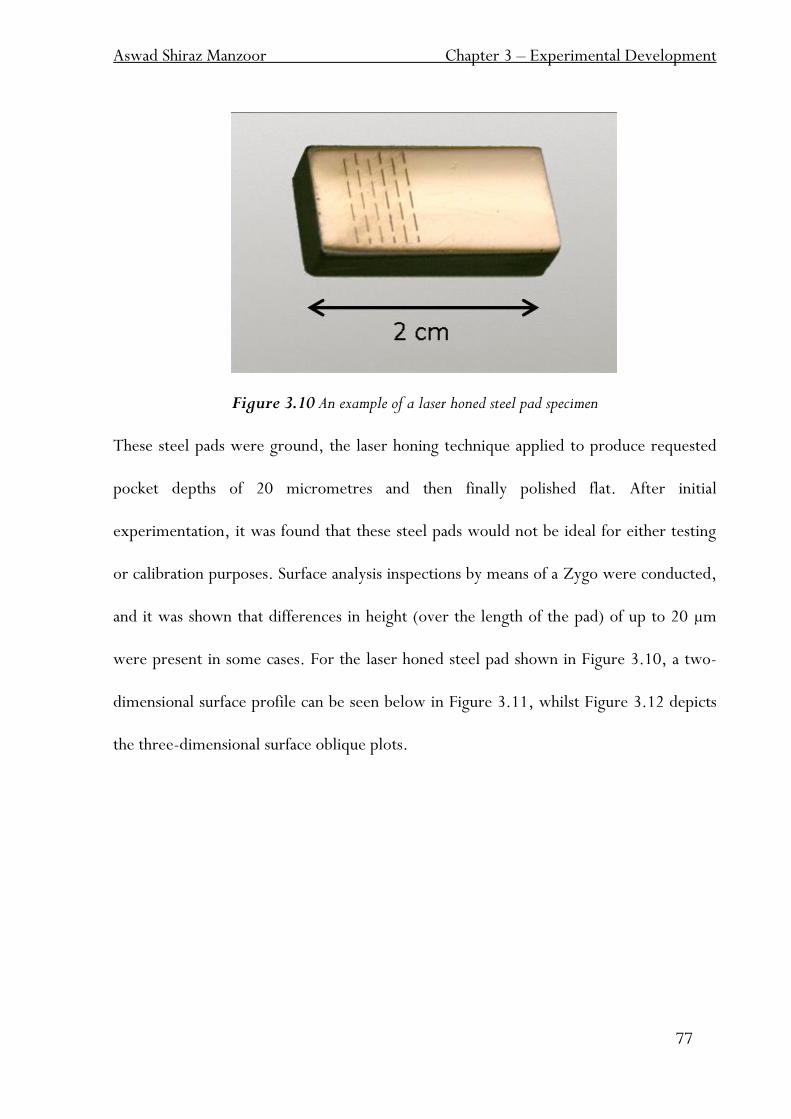
Aswad Shiraz Manzoor Chapter 3 – Experimental Development
77
Figure 3.10 An example of a laser honed steel pad specimen
These steel pads were ground, the laser honing technique applied to produce requested
pocket depths of 20 micrometres and then finally polished flat. After initial
experimentation, it was found that these steel pads would not be ideal for either testing
or calibration purposes. Surface analysis inspections by means of a Zygo were conducted,
and it was shown that differences in height (over the length of the pad) of up to 20 µm
were present in some cases. For the laser honed steel pad shown in Figure 3.10, a two-
dimensional surface profile can be seen below in Figure 3.11, whilst Figure 3.12 depicts
the three-dimensional surface oblique plots.
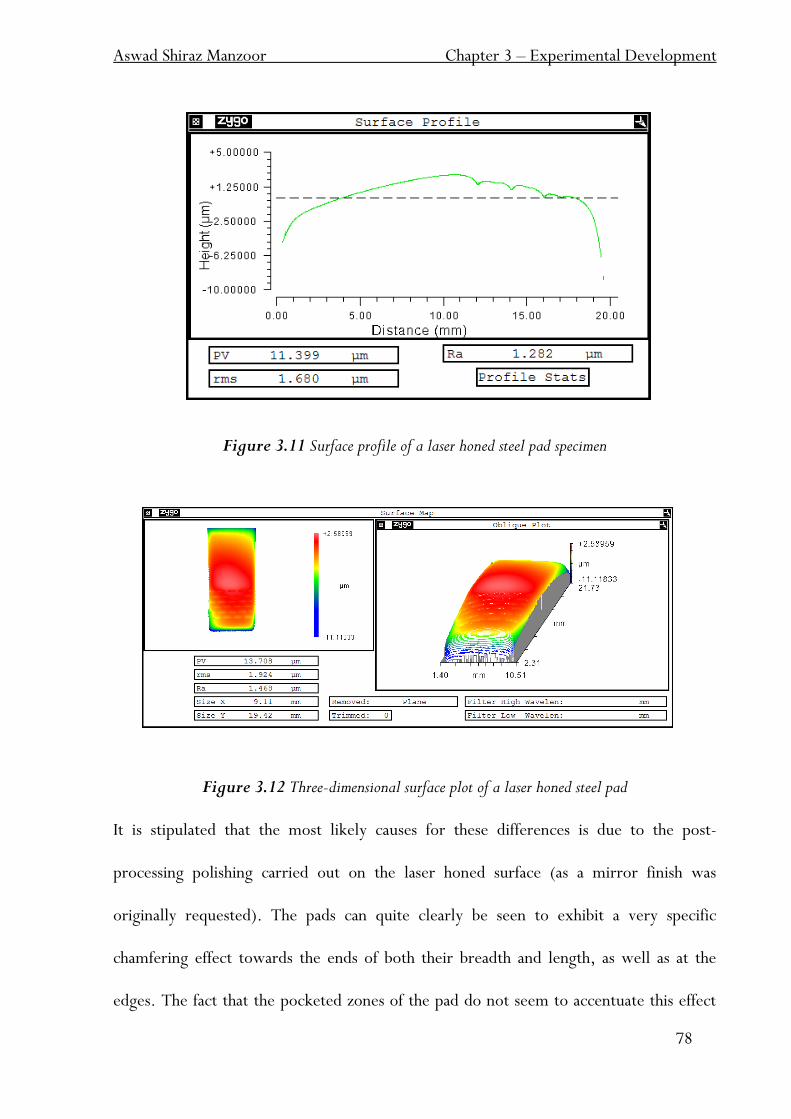
Aswad Shiraz Manzoor Chapter 3 – Experimental Development
78
Figure 3.11 Surface profile of a laser honed steel pad specimen
Figure 3.12 Three-dimensional surface plot of a laser honed steel pad
It is stipulated that the most likely causes for these differences is due to the post-
processing polishing carried out on the laser honed surface (as a mirror finish was
originally requested). The pads can quite clearly be seen to exhibit a very specific
chamfering effect towards the ends of both their breadth and length, as well as at the
edges. The fact that the pocketed zones of the pad do not seem to accentuate this effect
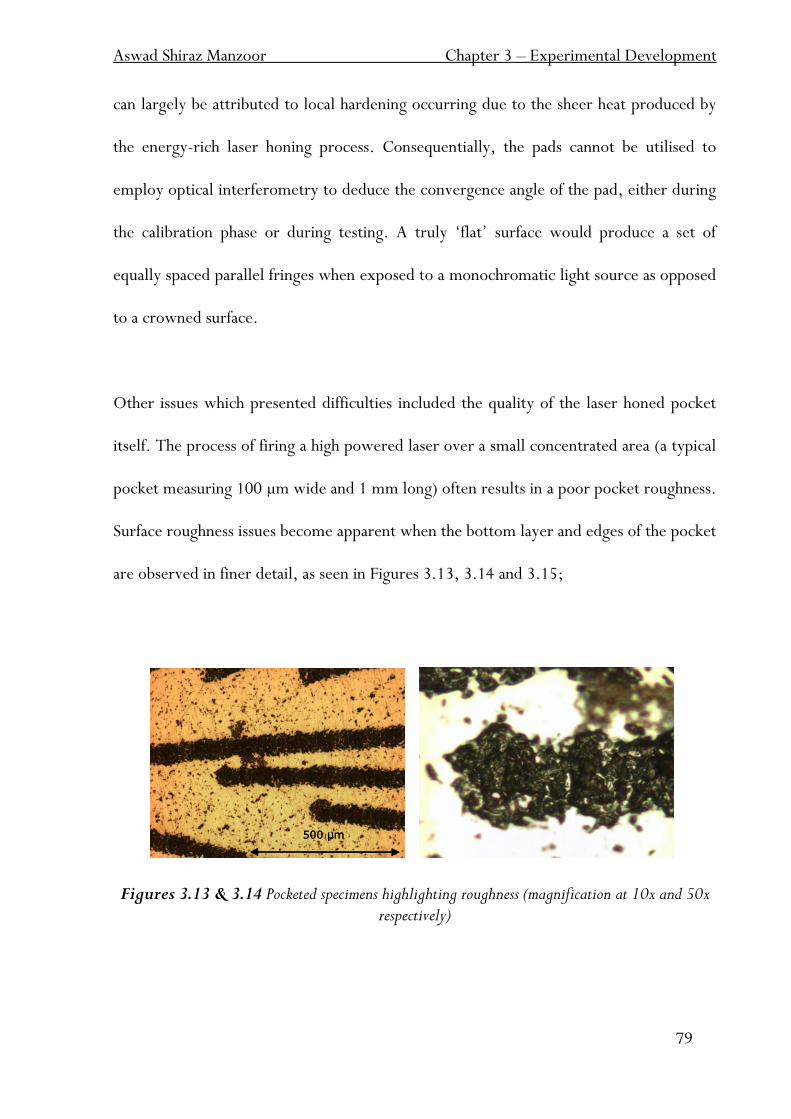
Aswad Shiraz Manzoor Chapter 3 – Experimental Development
79
can largely be attributed to local hardening occurring due to the sheer heat produced by
the energy-rich laser honing process. Consequentially, the pads cannot be utilised to
employ optical interferometry to deduce the convergence angle of the pad, either during
the calibration phase or during testing. A truly „flat‟ surface would produce a set of
equally spaced parallel fringes when exposed to a monochromatic light source as opposed
to a crowned surface.
Other issues which presented difficulties included the quality of the laser honed pocket
itself. The process of firing a high powered laser over a small concentrated area (a typical
pocket measuring 100 µm wide and 1 mm long) often results in a poor pocket roughness.
Surface roughness issues become apparent when the bottom layer and edges of the pocket
are observed in finer detail, as seen in Figures 3.13, 3.14 and 3.15;
Figures 3.13 & 3.14 Pocketed specimens highlighting roughness (magnification at 10x and 50x
respectively)
500 µm500 µm
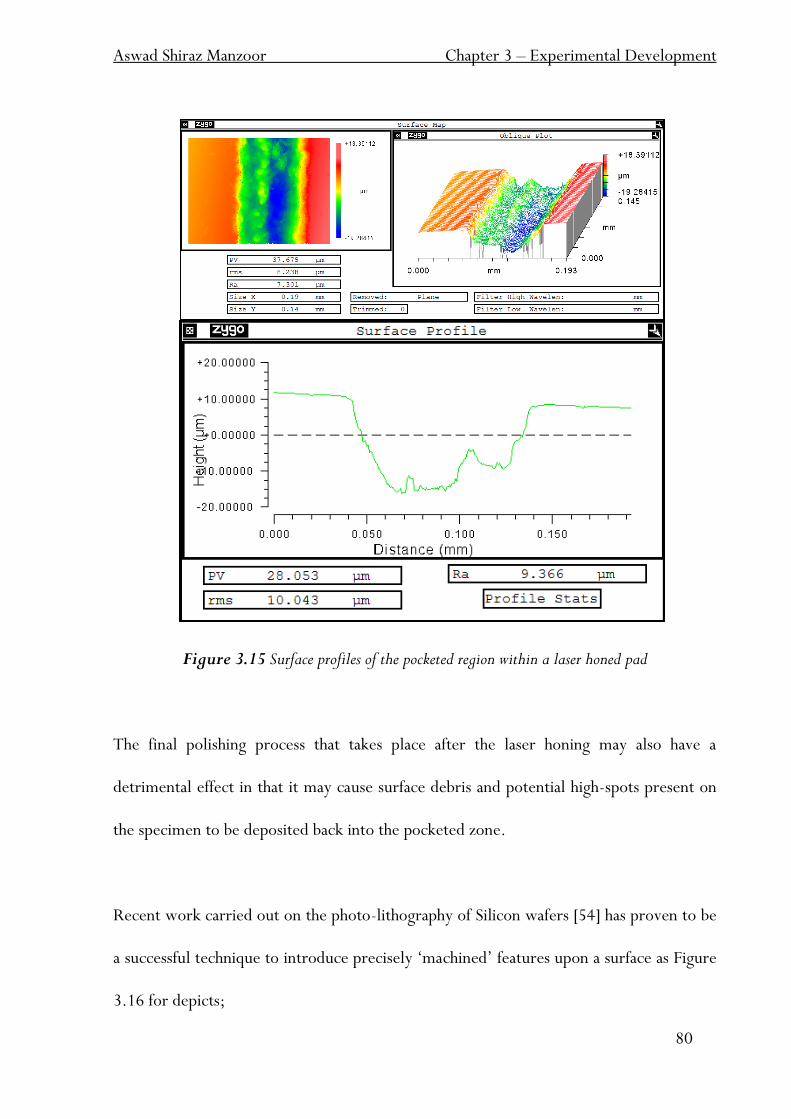
Aswad Shiraz Manzoor Chapter 3 – Experimental Development
80
Figure 3.15 Surface profiles of the pocketed region within a laser honed pad
The final polishing process that takes place after the laser honing may also have a
detrimental effect in that it may cause surface debris and potential high-spots present on
the specimen to be deposited back into the pocketed zone.
Recent work carried out on the photo-lithography of Silicon wafers [54] has proven to be
a successful technique to introduce precisely „machined‟ features upon a surface as Figure
3.16 for depicts;
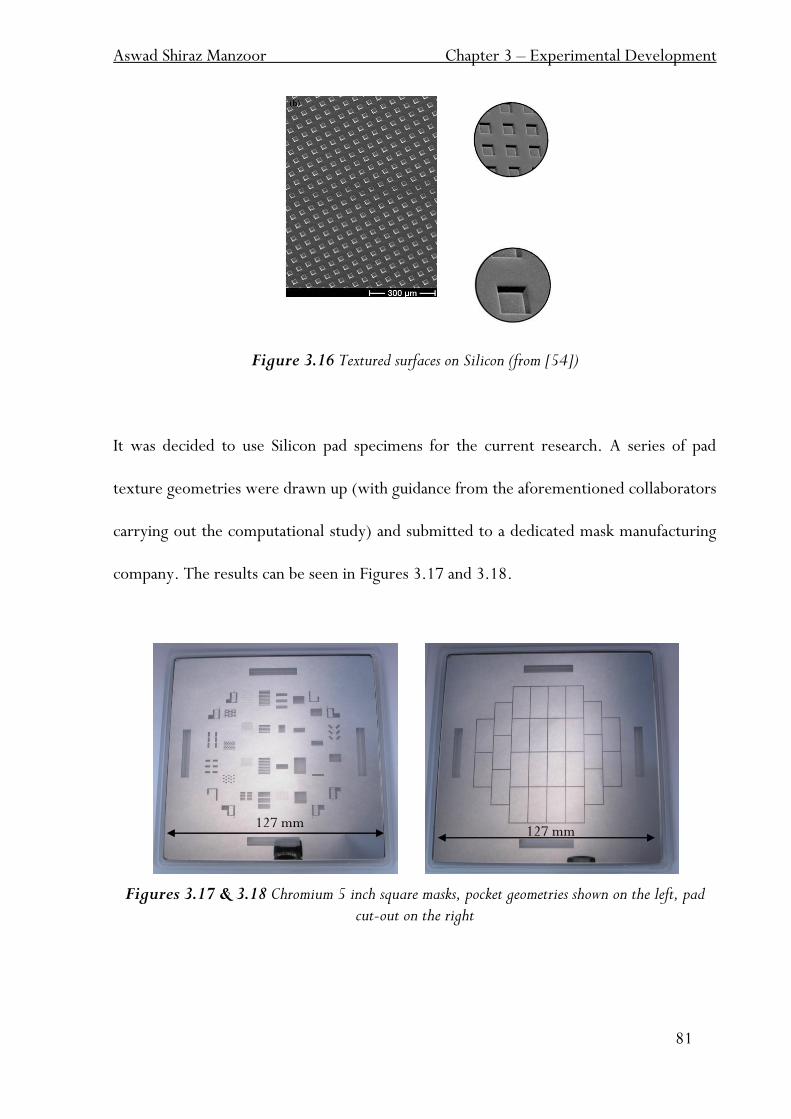
Aswad Shiraz Manzoor Chapter 3 – Experimental Development
81
Figure 3.16 Textured surfaces on Silicon (from [54])
It was decided to use Silicon pad specimens for the current research. A series of pad
texture geometries were drawn up (with guidance from the aforementioned collaborators
carrying out the computational study) and submitted to a dedicated mask manufacturing
company. The results can be seen in Figures 3.17 and 3.18.
Figures 3.17 & 3.18 Chromium 5 inch square masks, pocket geometries shown on the left, pad
cut-out on the right
127 mm 127 mm
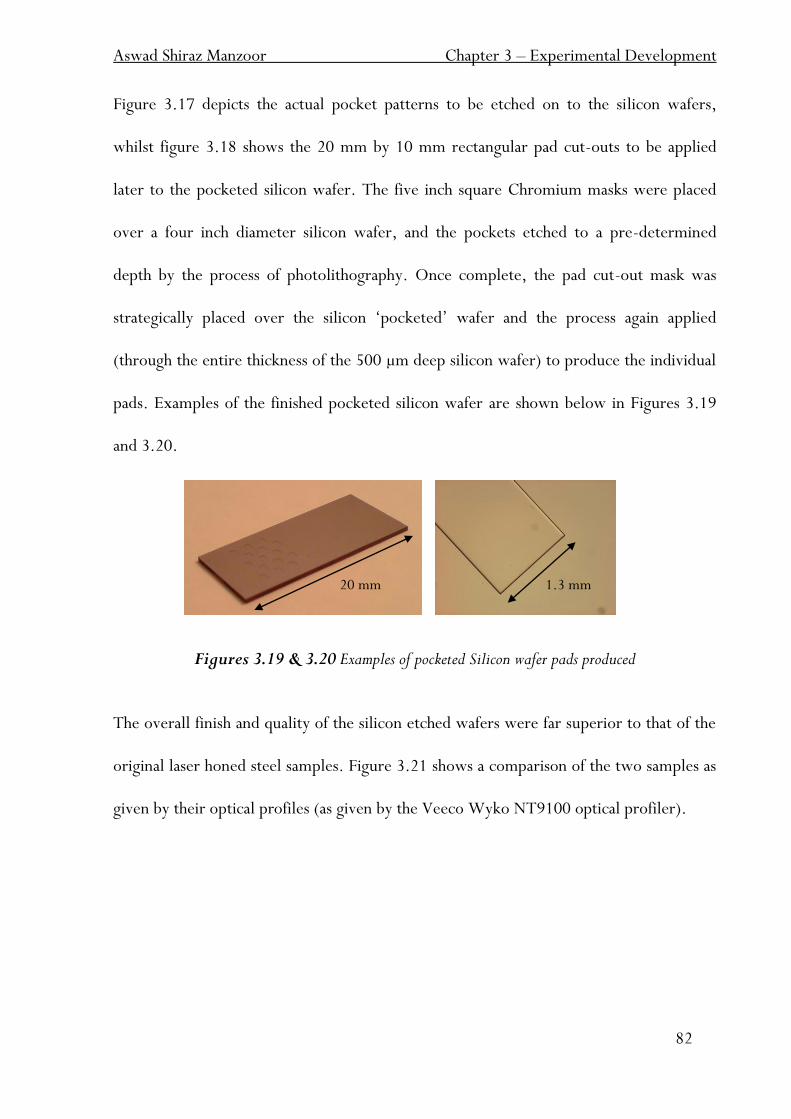
Aswad Shiraz Manzoor Chapter 3 – Experimental Development
82
Figure 3.17 depicts the actual pocket patterns to be etched on to the silicon wafers,
whilst figure 3.18 shows the 20 mm by 10 mm rectangular pad cut-outs to be applied
later to the pocketed silicon wafer. The five inch square Chromium masks were placed
over a four inch diameter silicon wafer, and the pockets etched to a pre-determined
depth by the process of photolithography. Once complete, the pad cut-out mask was
strategically placed over the silicon „pocketed‟ wafer and the process again applied
(through the entire thickness of the 500 µm deep silicon wafer) to produce the individual
pads. Examples of the finished pocketed silicon wafer are shown below in Figures 3.19
and 3.20.
Figures 3.19 & 3.20 Examples of pocketed Silicon wafer pads produced
The overall finish and quality of the silicon etched wafers were far superior to that of the
original laser honed steel samples. Figure 3.21 shows a comparison of the two samples as
given by their optical profiles (as given by the Veeco Wyko NT9100 optical profiler).
20 mm 1.3 mm
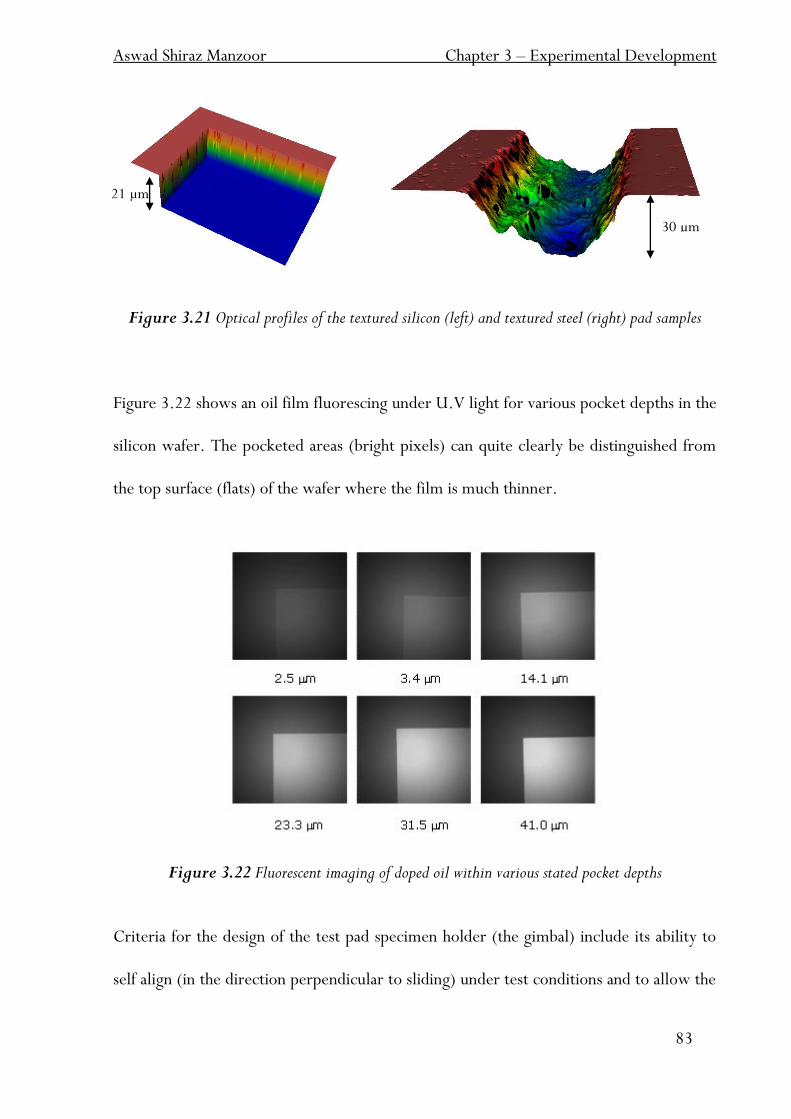
Aswad Shiraz Manzoor Chapter 3 – Experimental Development
83
Figure 3.21 Optical profiles of the textured silicon (left) and textured steel (right) pad samples
Figure 3.22 shows an oil film fluorescing under U.V light for various pocket depths in the
silicon wafer. The pocketed areas (bright pixels) can quite clearly be distinguished from
the top surface (flats) of the wafer where the film is much thinner.
Figure 3.22 Fluorescent imaging of doped oil within various stated pocket depths
Criteria for the design of the test pad specimen holder (the gimbal) include its ability to
self align (in the direction perpendicular to sliding) under test conditions and to allow the
21 µm
30 µm
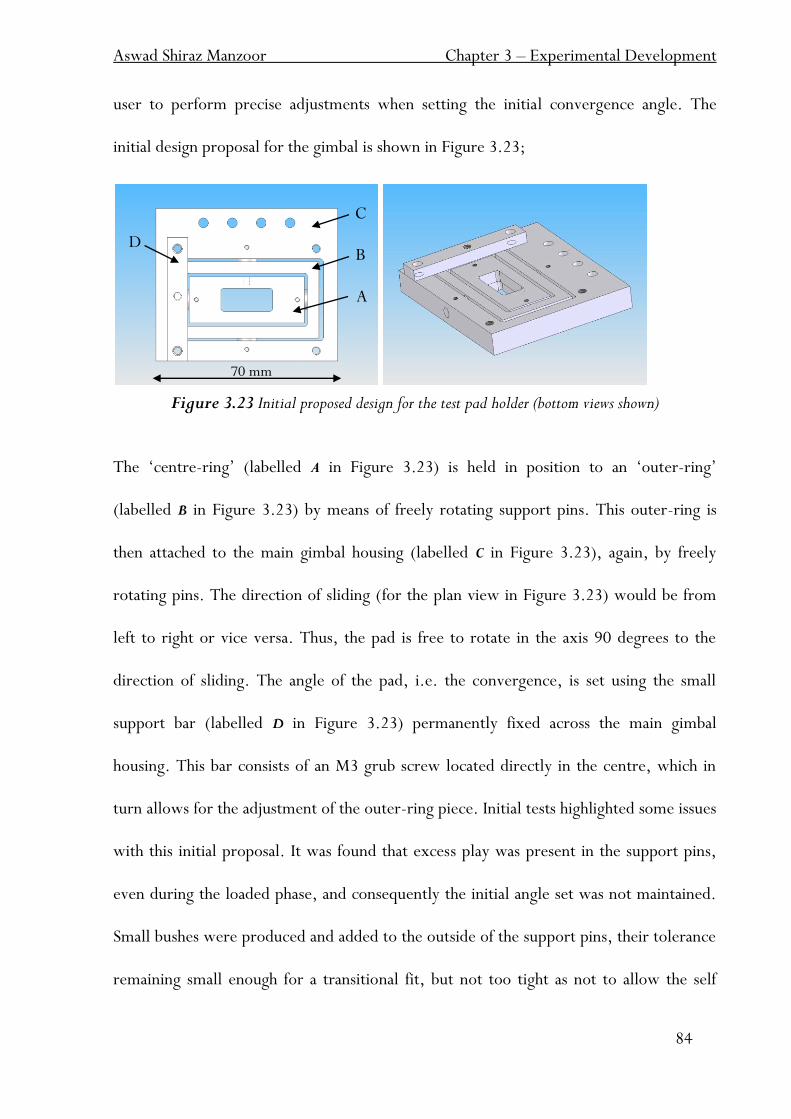
Aswad Shiraz Manzoor Chapter 3 – Experimental Development
84
user to perform precise adjustments when setting the initial convergence angle. The
initial design proposal for the gimbal is shown in Figure 3.23;
Figure 3.23 Initial proposed design for the test pad holder (bottom views shown)
The „centre-ring‟ (labelled A in Figure 3.23) is held in position to an „outer-ring‟
(labelled B in Figure 3.23) by means of freely rotating support pins. This outer-ring is
then attached to the main gimbal housing (labelled C in Figure 3.23), again, by freely
rotating pins. The direction of sliding (for the plan view in Figure 3.23) would be from
left to right or vice versa. Thus, the pad is free to rotate in the axis 90 degrees to the
direction of sliding. The angle of the pad, i.e. the convergence, is set using the small
support bar (labelled D in Figure 3.23) permanently fixed across the main gimbal
housing. This bar consists of an M3 grub screw located directly in the centre, which in
turn allows for the adjustment of the outer-ring piece. Initial tests highlighted some issues
with this initial proposal. It was found that excess play was present in the support pins,
even during the loaded phase, and consequently the initial angle set was not maintained.
Small bushes were produced and added to the outside of the support pins, their tolerance
remaining small enough for a transitional fit, but not too tight as not to allow the self
C
B
A
D
70 mm
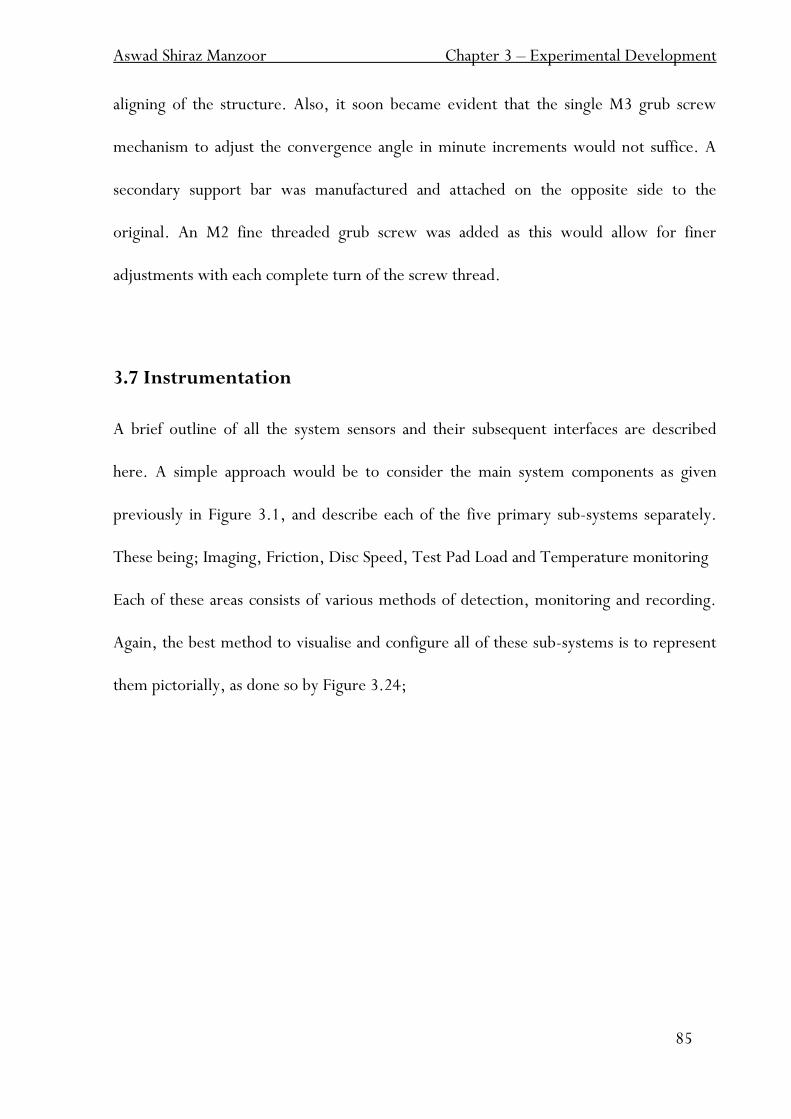
Aswad Shiraz Manzoor Chapter 3 – Experimental Development
85
aligning of the structure. Also, it soon became evident that the single M3 grub screw
mechanism to adjust the convergence angle in minute increments would not suffice. A
secondary support bar was manufactured and attached on the opposite side to the
original. An M2 fine threaded grub screw was added as this would allow for finer
adjustments with each complete turn of the screw thread.
3.7 Instrumentation
A brief outline of all the system sensors and their subsequent interfaces are described
here. A simple approach would be to consider the main system components as given
previously in Figure 3.1, and describe each of the five primary sub-systems separately.
These being; Imaging, Friction, Disc Speed, Test Pad Load and Temperature monitoring
Each of these areas consists of various methods of detection, monitoring and recording.
Again, the best method to visualise and configure all of these sub-systems is to represent
them pictorially, as done so by Figure 3.24;
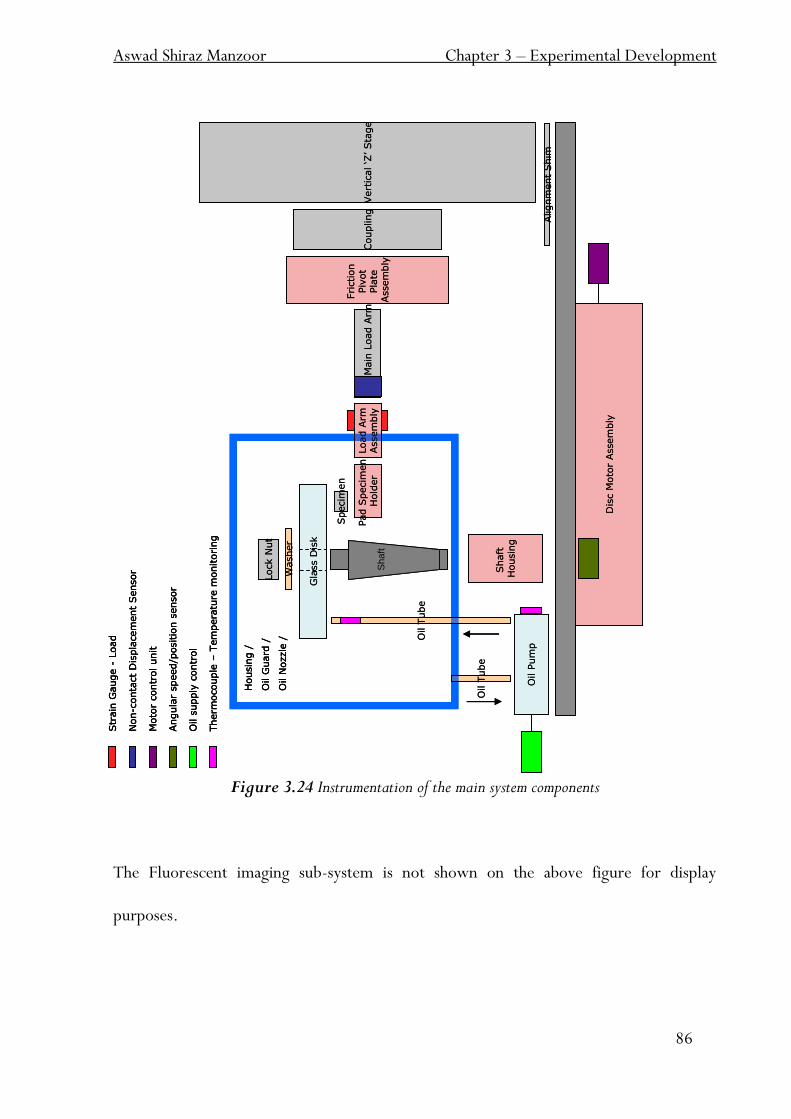
Aswad Shiraz Manzoor Chapter 3 – Experimental Development
86
Figure 3.24 Instrumentation of the main system components
The Fluorescent imaging sub-system is not shown on the above figure for display
purposes.
Str
ain
Gauge -
Load
Non-c
onta
ct
Dis
pla
cem
ent
Sensor
Moto
r contr
ol unit
Angula
r speed/p
ositio
n s
ensor
Housin
g /
Oil G
uard
/
Oil N
ozzle
/
Dis
c M
oto
r Assem
bly
Washer
Shaft
H
ousin
g
Gla
ss D
isk
Lock N
ut
Vert
ical ‘Z
’Sta
ge
Coupling
Friction
Piv
ot
Pla
te
Assem
bly
Main
Load A
rm
Load A
rmAssem
bly
Alignm
ent
Shim
Pad S
pecim
en
Hold
er
Specim
en
Oil T
ube
Oil T
ube
Oil P
um
p
Oil s
upply
contr
ol
Shaft
Therm
ocouple
–Tem
pera
ture
monitoring
Str
ain
Gauge -
Load
Str
ain
Gauge -
Load
Non-c
onta
ct
Dis
pla
cem
ent
Sensor
Non-c
onta
ct
Dis
pla
cem
ent
Sensor
Moto
r contr
ol unit
Moto
r contr
ol unit
Angula
r speed/p
ositio
n s
ensor
Angula
r speed/p
ositio
n s
ensor
Housin
g /
Oil G
uard
/
Oil N
ozzle
/
Housin
g /
Oil G
uard
/
Oil N
ozzle
/
Dis
c M
oto
r Assem
bly
Washer
Shaft
H
ousin
g
Gla
ss D
isk
Lock N
ut
Vert
ical ‘Z
’Sta
ge
Coupling
Friction
Piv
ot
Pla
te
Assem
bly
Main
Load A
rm
Load A
rmAssem
bly
Alignm
ent
Shim
Pad S
pecim
en
Hold
er
Specim
en
Oil T
ube
Oil T
ube
Oil P
um
p
Oil s
upply
contr
ol
Oil s
upply
contr
ol
Shaft
Therm
ocouple
–Tem
pera
ture
monitoring
Therm
ocouple
–Tem
pera
ture
monitoring
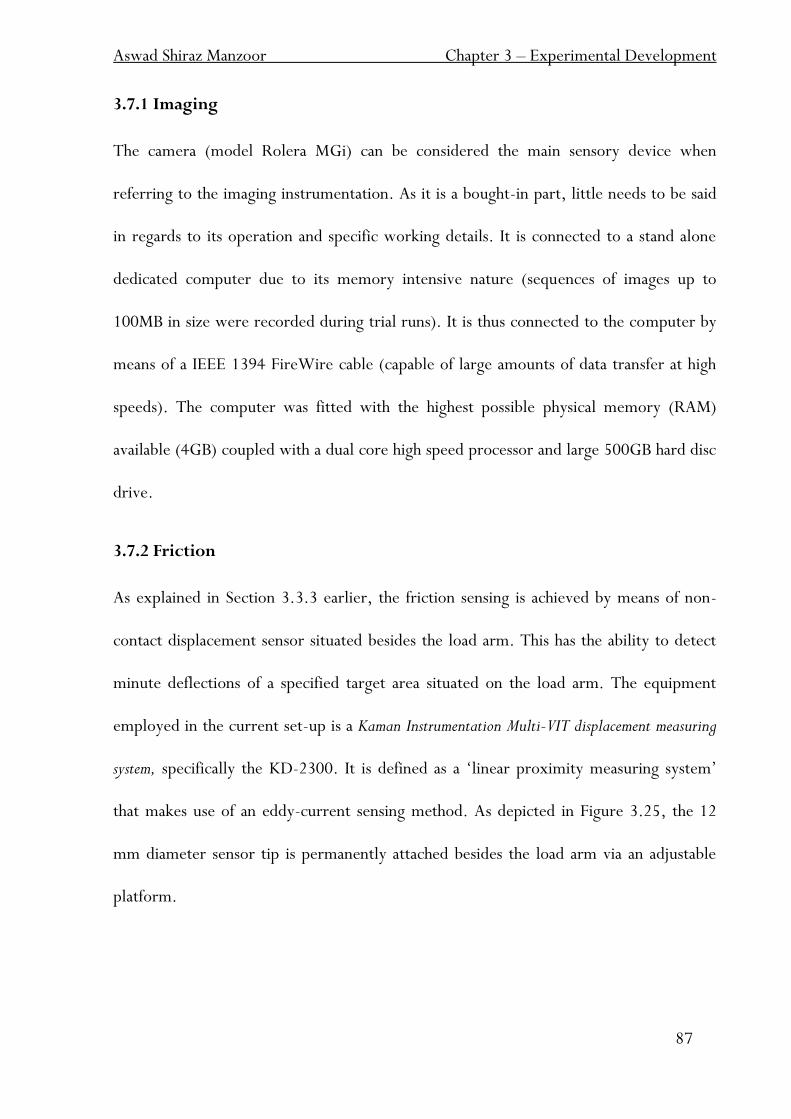
Aswad Shiraz Manzoor Chapter 3 – Experimental Development
87
3.7.1 Imaging
The camera (model Rolera MGi) can be considered the main sensory device when
referring to the imaging instrumentation. As it is a bought-in part, little needs to be said
in regards to its operation and specific working details. It is connected to a stand alone
dedicated computer due to its memory intensive nature (sequences of images up to
100MB in size were recorded during trial runs). It is thus connected to the computer by
means of a IEEE 1394 FireWire cable (capable of large amounts of data transfer at high
speeds). The computer was fitted with the highest possible physical memory (RAM)
available (4GB) coupled with a dual core high speed processor and large 500GB hard disc
drive.
3.7.2 Friction
As explained in Section 3.3.3 earlier, the friction sensing is achieved by means of non-
contact displacement sensor situated besides the load arm. This has the ability to detect
minute deflections of a specified target area situated on the load arm. The equipment
employed in the current set-up is a Kaman Instrumentation Multi-VIT displacement measuring
system, specifically the KD-2300. It is defined as a „linear proximity measuring system‟
that makes use of an eddy-current sensing method. As depicted in Figure 3.25, the 12
mm diameter sensor tip is permanently attached besides the load arm via an adjustable
platform.
Aswad Shiraz Manzoor Chapter 3 – Experimental Development
88
Figure 3.25 The non-contact displacement sensor and the strain gauge installation
This is strategically aimed at a bracket that is attached to the load arm. As the load arm
moves away (or towards) from the sensor, a voltage differential is the result. The output
voltage is proportional to the distance between the target material (aluminium in this
case) and the sensor face. A resolution of 0.3 µm over a measuring distance of 2.5 mm is
the specification given. The unit is simply connected to a data acquisition unit (the DAQ,
explained later in Section 3.8).
3.7.3 Disc Speed
An 8 bit rotary position encoder (giving a 1.41 degree resolution) fixed securely to the
bottom of the main shaft pulley, was used to determine the angular position of the
disc/shaft coupling as well as the angular velocity (later translated to give the relative
speed at the disc/pad interface). This converts the encoder pulse to an analogue speed
voltage which is fed into the DAQ (a high-speed data acquisition device). The DAQ then
70 mm
Strain gauges
Aluminium Target area
12 mm diameter Sensor tip
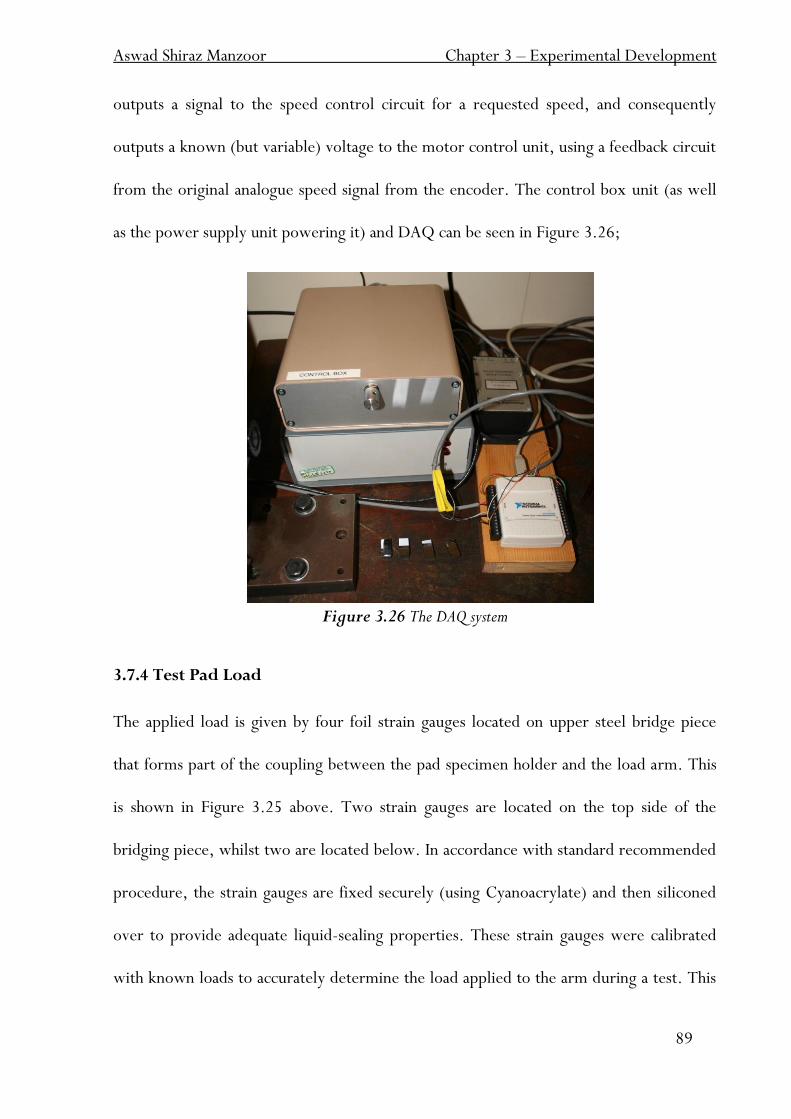
Aswad Shiraz Manzoor Chapter 3 – Experimental Development
89
outputs a signal to the speed control circuit for a requested speed, and consequently
outputs a known (but variable) voltage to the motor control unit, using a feedback circuit
from the original analogue speed signal from the encoder. The control box unit (as well
as the power supply unit powering it) and DAQ can be seen in Figure 3.26;
Figure 3.26 The DAQ system
3.7.4 Test Pad Load
The applied load is given by four foil strain gauges located on upper steel bridge piece
that forms part of the coupling between the pad specimen holder and the load arm. This
is shown in Figure 3.25 above. Two strain gauges are located on the top side of the
bridging piece, whilst two are located below. In accordance with standard recommended
procedure, the strain gauges are fixed securely (using Cyanoacrylate) and then siliconed
over to provide adequate liquid-sealing properties. These strain gauges were calibrated
with known loads to accurately determine the load applied to the arm during a test. This
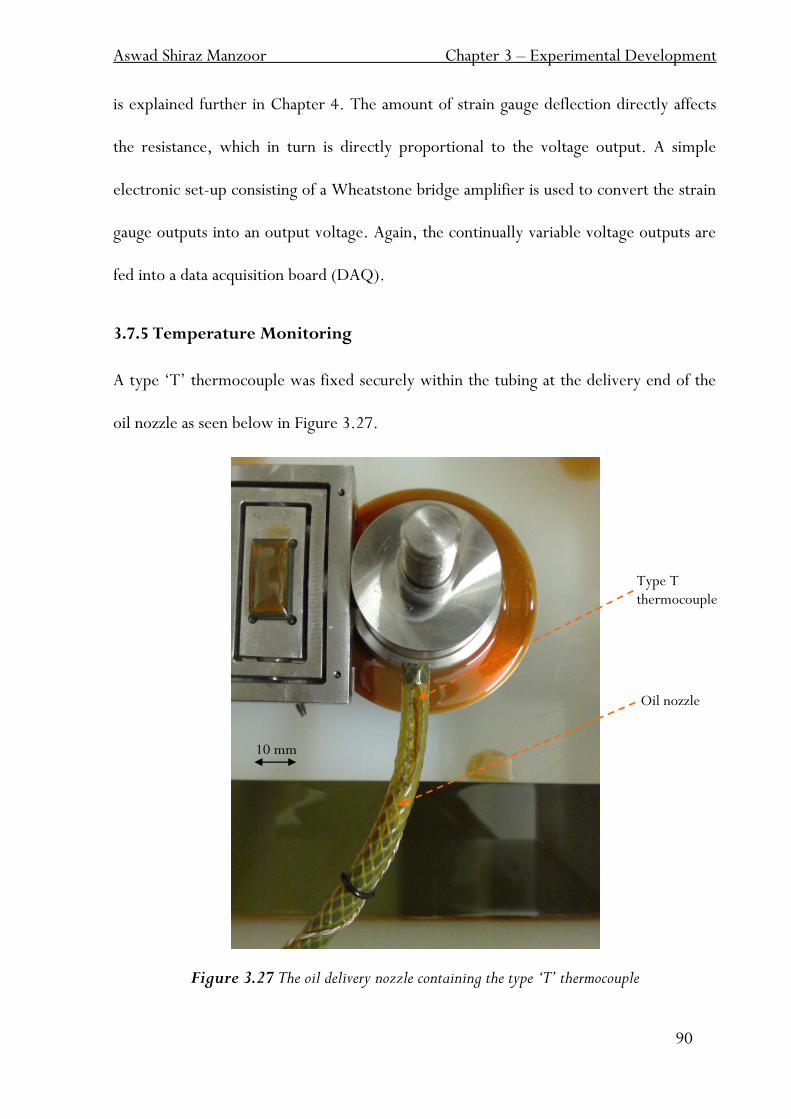
Aswad Shiraz Manzoor Chapter 3 – Experimental Development
90
is explained further in Chapter 4. The amount of strain gauge deflection directly affects
the resistance, which in turn is directly proportional to the voltage output. A simple
electronic set-up consisting of a Wheatstone bridge amplifier is used to convert the strain
gauge outputs into an output voltage. Again, the continually variable voltage outputs are
fed into a data acquisition board (DAQ).
3.7.5 Temperature Monitoring
A type „T‟ thermocouple was fixed securely within the tubing at the delivery end of the
oil nozzle as seen below in Figure 3.27.
Figure 3.27 The oil delivery nozzle containing the type ‘T’ thermocouple
10 mm
Type T thermocouple
Oil nozzle
Aswad Shiraz Manzoor Chapter 3 – Experimental Development
91
The thermocouple was bought in as part of a unit (TME MM200), specifically chosen due
to the type „T‟ thermocouple that it uses. Type „K‟ thermocouples generally have a
greater temperature range but at the cost of resolution and accuracy. Type „T‟
thermocouples have a reduced measuring range (up to 400°C) but a significantly
improved accuracy and resolution to suit. This specific model has an accuracy of ±0.15%
of the reading at 23°C (approximately translated to ±0.2°C at room temperature),
coupled with a resolution of 0.1°C over the entire temperature range. As no heating
equipment is used in the current set-up, it was originally envisaged that there would be
little or no temperature increases during testing. A handheld RS instruments „Mini Infra-
red thermometer‟ was used to monitor the temperature of the oil pump as well as the
motor driving the oil pump. The accuracy and resolution of this unit were significantly of
a lower specification than that of thermocouples used (±2.5°C at 0.1°C respectively).
3.8 Experimental Data Capture and Storage
As previously mentioned the friction, load and speed components all output data via a
fluctuating voltage signal coupled to a data acquisition board. For simplicity, a USB
powered „National Instruments USB-6008‟ 12bit analog input DAQ was purchased and
connected to a second computer. For ease of communication and control, LabVIEW was
the preferred choice of software due it being an easy to use graphical programming tool.
Interfaces relating to each of the inputs were constructed and saved collectively. Real-
time monitoring and data acquisition was the primary goal when designing the software
Aswad Shiraz Manzoor Chapter 3 – Experimental Development
92
package. For this reason, a one-click virtual record button was incorporated into the
software which allowed for mass data to be written in raw format (.txt file) to a specific
target location for any desired length of time. An external 500GB hard disc drive was
connected to this second computer to simultaneously record data as back-up to the main
drive of the computer.
The ability of the camera to accept an external trigger enabled the use of the software to
send a trigger signal (produced by manipulating data from the „sync-pulse‟ received from
the 8bit rotary encoder attached to the main shaft driving the disc) to the camera. The
triggering circuit supplies a TTL signal to the camera when the main shaft passes a set
position, controlled by an 8bit digital signal from the DAQ. The circuit is subsequently
triggered when this value matches the encoder output.
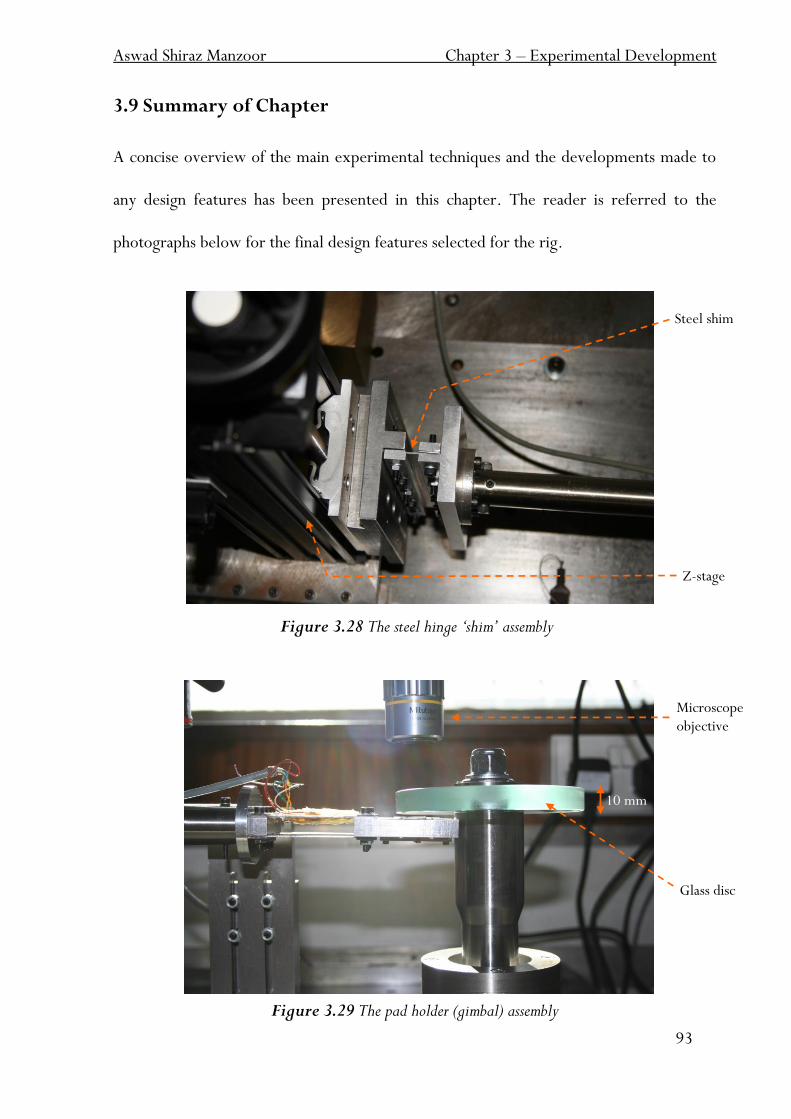
Aswad Shiraz Manzoor Chapter 3 – Experimental Development
93
3.9 Summary of Chapter
A concise overview of the main experimental techniques and the developments made to
any design features has been presented in this chapter. The reader is referred to the
photographs below for the final design features selected for the rig.
Figure 3.28 The steel hinge ‘shim’ assembly
Figure 3.29 The pad holder (gimbal) assembly
Steel shim
Z-stage
10 mm
Glass disc
Microscope objective
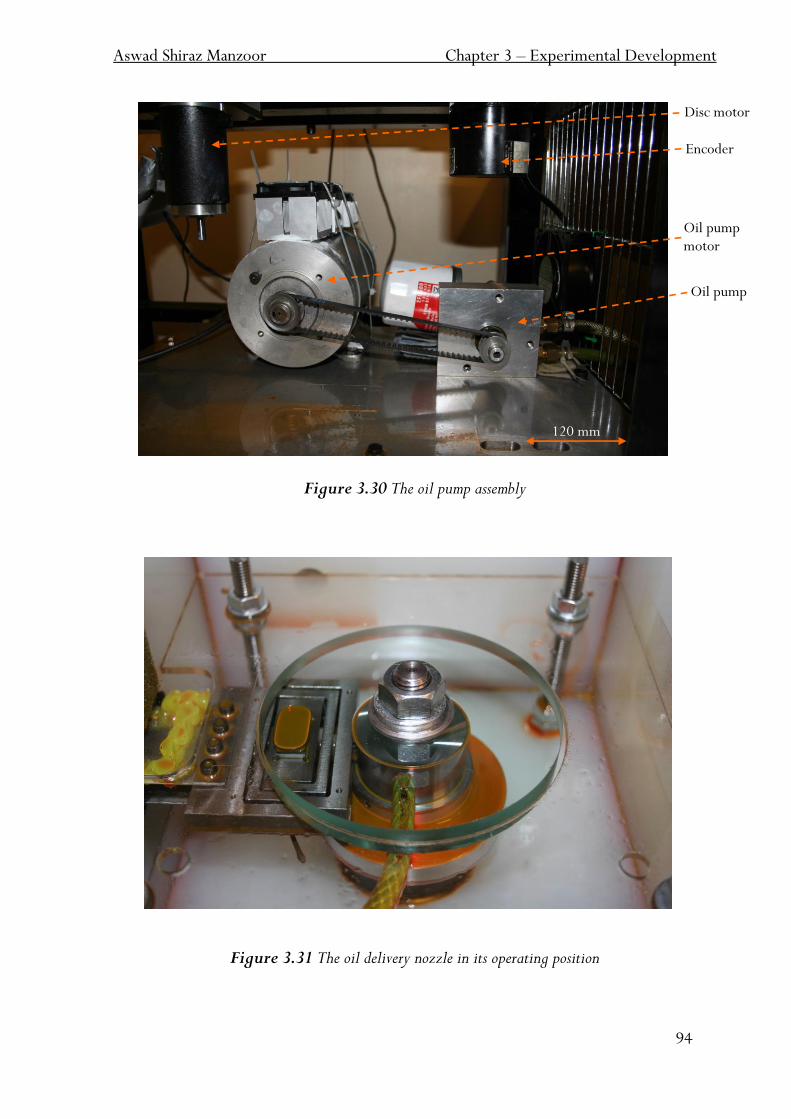
Aswad Shiraz Manzoor Chapter 3 – Experimental Development
94
Figure 3.30 The oil pump assembly
Figure 3.31 The oil delivery nozzle in its operating position
Disc motor
Encoder
Oil pump motor
Oil pump
120 mm
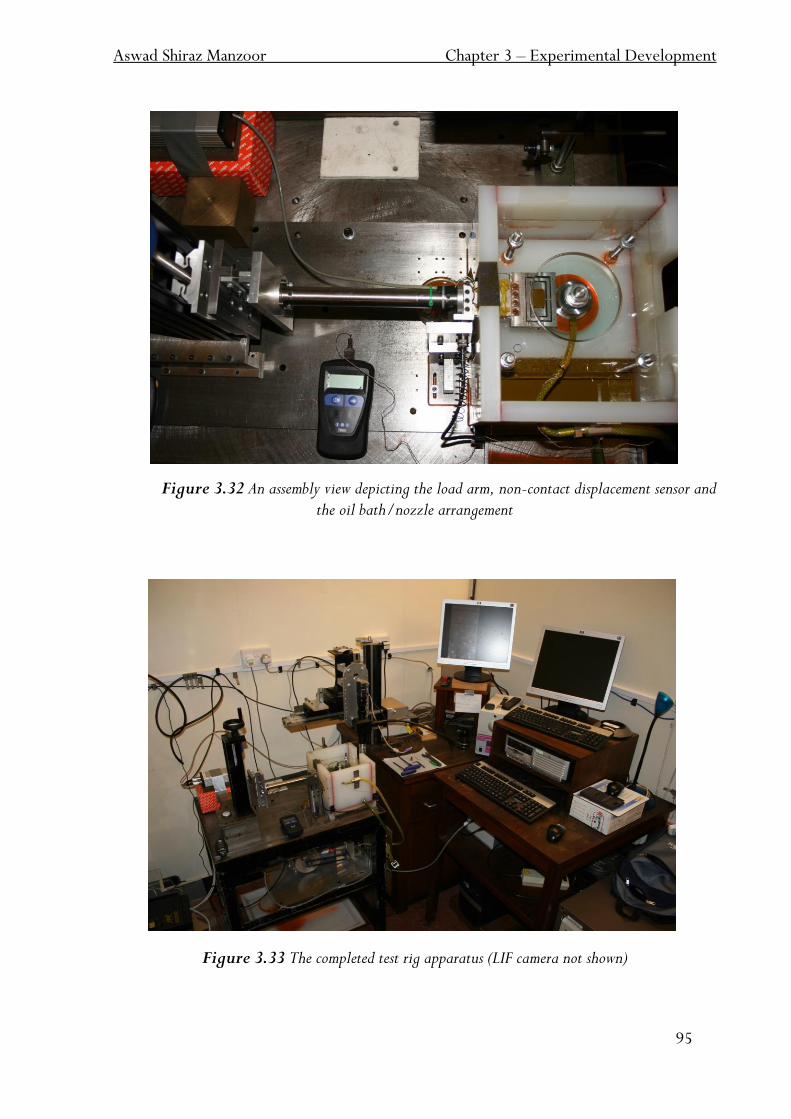
Aswad Shiraz Manzoor Chapter 3 – Experimental Development
95
Figure 3.32 An assembly view depicting the load arm, non-contact displacement sensor and the oil bath/nozzle arrangement
Figure 3.33 The completed test rig apparatus (LIF camera not shown)

Chapter 4
Experimental Method
Aswad Shiraz Manzoor Chapter 4 – Experimental Method
97
4.1 Introduction
This chapter describes the techniques and methods used to calibrate each of the specific
areas of the test rig. These are dealt with thoroughly and suitable justifications and
reasoning given where necessary. The final test procedure used to produce data from the
rig is then explained, outlining all the test variables and their respective controllability.
The primary focus that was kept in mind when designing the experimental rig was the
ability of the rig to accurately measure and record the film thickness, the friction/load
conditions and possibly cavitation, all in-situ and all simultaneously.
4.2 System Calibration
The literature has placed caution on the repeatable achievement of accurate calibrations
of both the L.I.F. and friction measurements. The three crucial areas of focus in the
proceeding section deals with the L.I.F. and camera system, the friction and load
calibrations.
4.2.1 L.I.F. Calibration
A certain degree of emphasis can be placed upon the importance of the L.I.F. calibration
as the L.I.F. images taken during the experimental phase were to be compared directly to
calibration images taken immediately before testing. Historically, this has been the most
accurate method of determining each individual film thickness [44]. The first procedure
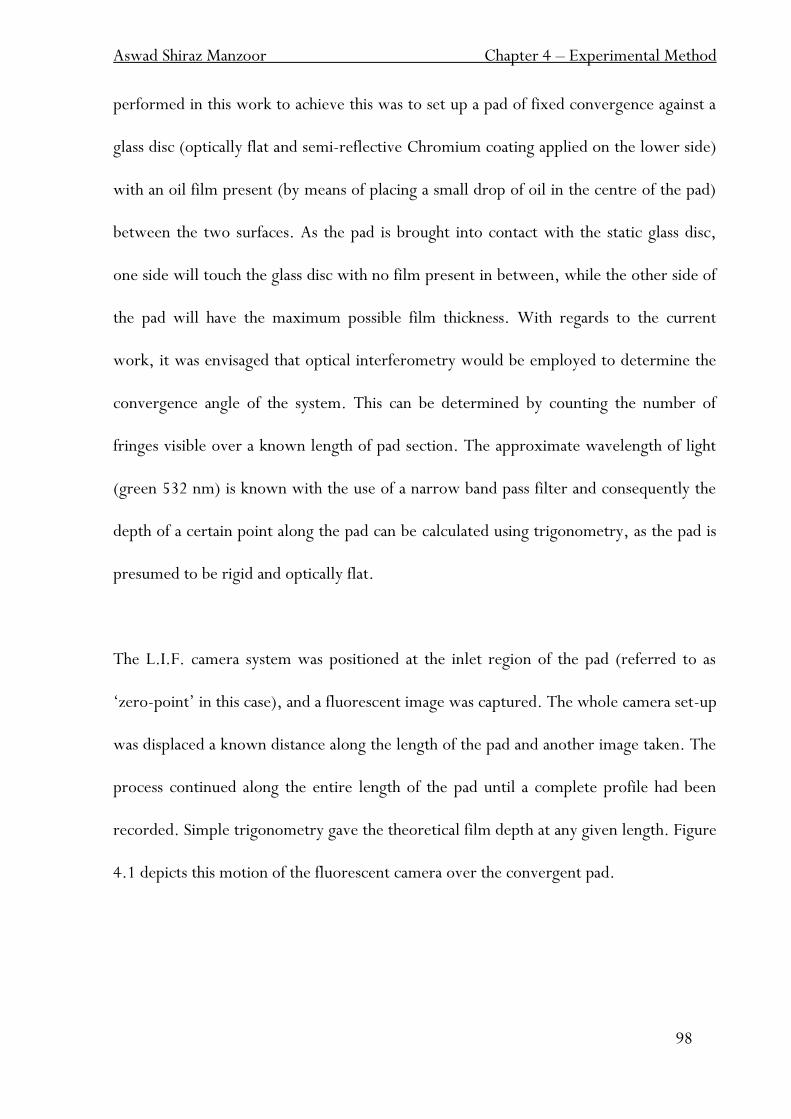
Aswad Shiraz Manzoor Chapter 4 – Experimental Method
98
performed in this work to achieve this was to set up a pad of fixed convergence against a
glass disc (optically flat and semi-reflective Chromium coating applied on the lower side)
with an oil film present (by means of placing a small drop of oil in the centre of the pad)
between the two surfaces. As the pad is brought into contact with the static glass disc,
one side will touch the glass disc with no film present in between, while the other side of
the pad will have the maximum possible film thickness. With regards to the current
work, it was envisaged that optical interferometry would be employed to determine the
convergence angle of the system. This can be determined by counting the number of
fringes visible over a known length of pad section. The approximate wavelength of light
(green 532 nm) is known with the use of a narrow band pass filter and consequently the
depth of a certain point along the pad can be calculated using trigonometry, as the pad is
presumed to be rigid and optically flat.
The L.I.F. camera system was positioned at the inlet region of the pad (referred to as
„zero-point‟ in this case), and a fluorescent image was captured. The whole camera set-up
was displaced a known distance along the length of the pad and another image taken. The
process continued along the entire length of the pad until a complete profile had been
recorded. Simple trigonometry gave the theoretical film depth at any given length. Figure
4.1 depicts this motion of the fluorescent camera over the convergent pad.
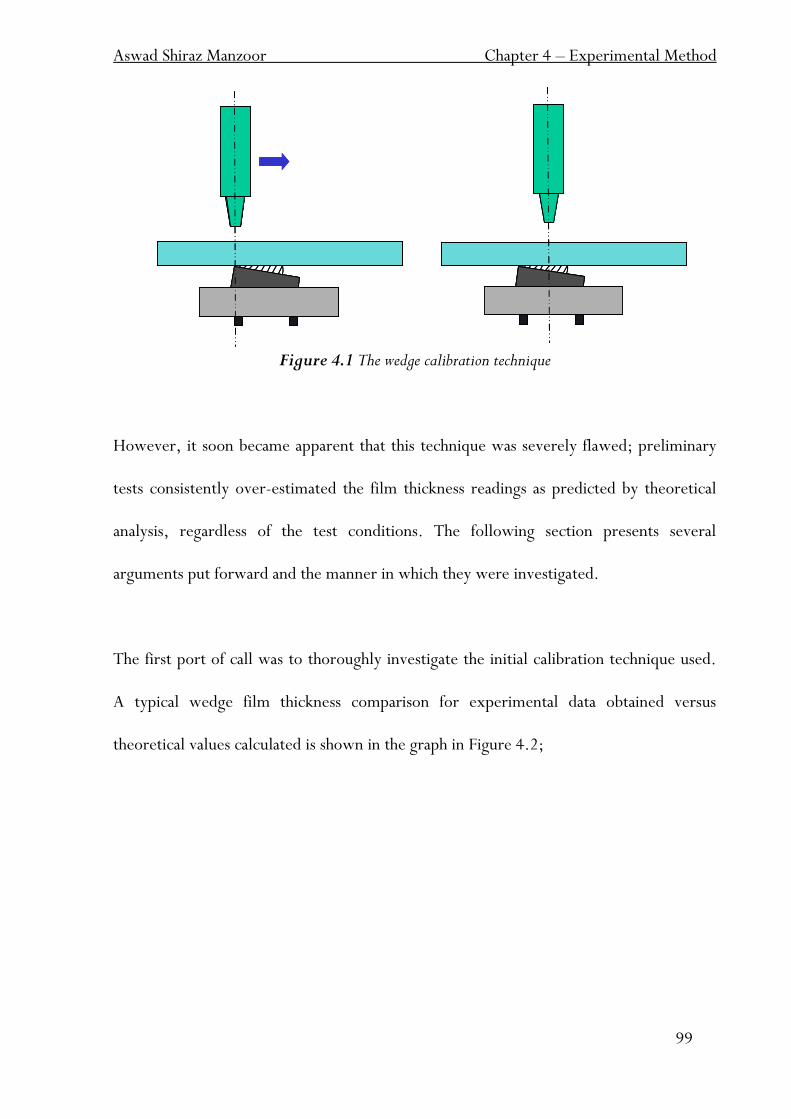
Aswad Shiraz Manzoor Chapter 4 – Experimental Method
99
Figure 4.1 The wedge calibration technique
However, it soon became apparent that this technique was severely flawed; preliminary
tests consistently over-estimated the film thickness readings as predicted by theoretical
analysis, regardless of the test conditions. The following section presents several
arguments put forward and the manner in which they were investigated.
The first port of call was to thoroughly investigate the initial calibration technique used.
A typical wedge film thickness comparison for experimental data obtained versus
theoretical values calculated is shown in the graph in Figure 4.2;
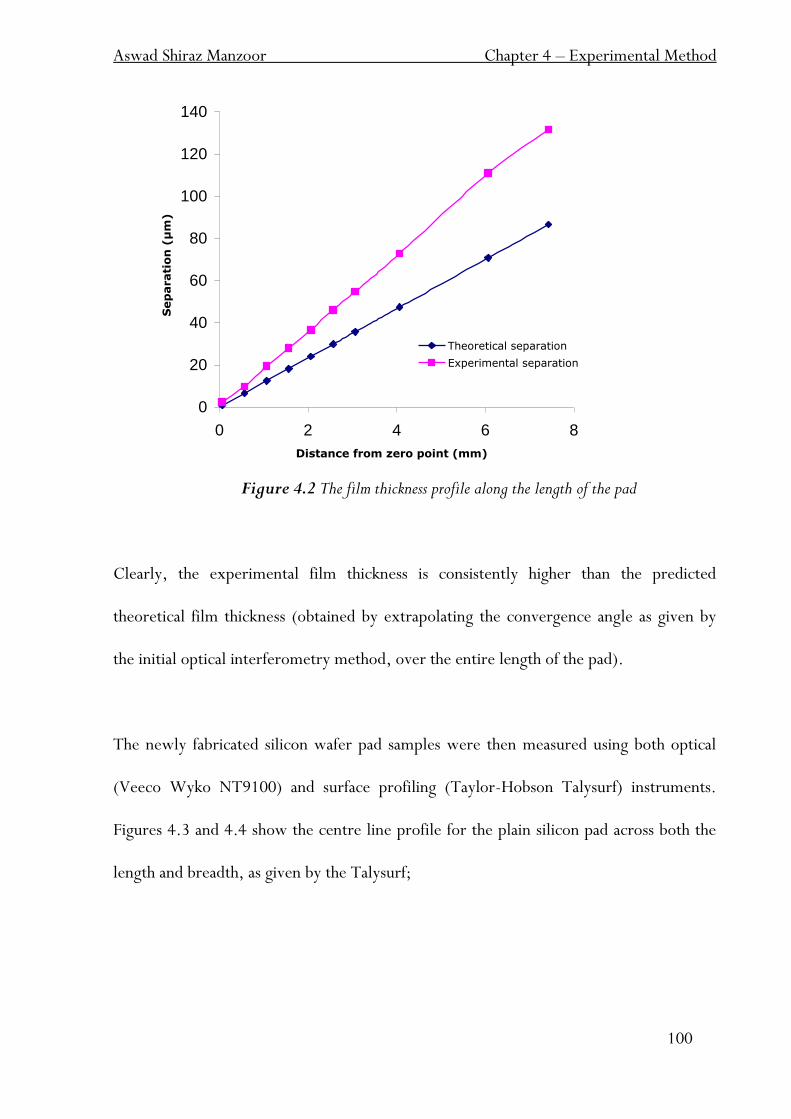
Aswad Shiraz Manzoor Chapter 4 – Experimental Method
100
0
20
40
60
80
100
120
140
0 2 4 6 8
Distance from zero point (mm)
Sep
arati
on
(µ
m)
Theoretical separation
Experimental separation
Figure 4.2 The film thickness profile along the length of the pad
Clearly, the experimental film thickness is consistently higher than the predicted
theoretical film thickness (obtained by extrapolating the convergence angle as given by
the initial optical interferometry method, over the entire length of the pad).
The newly fabricated silicon wafer pad samples were then measured using both optical
(Veeco Wyko NT9100) and surface profiling (Taylor-Hobson Talysurf) instruments.
Figures 4.3 and 4.4 show the centre line profile for the plain silicon pad across both the
length and breadth, as given by the Talysurf;
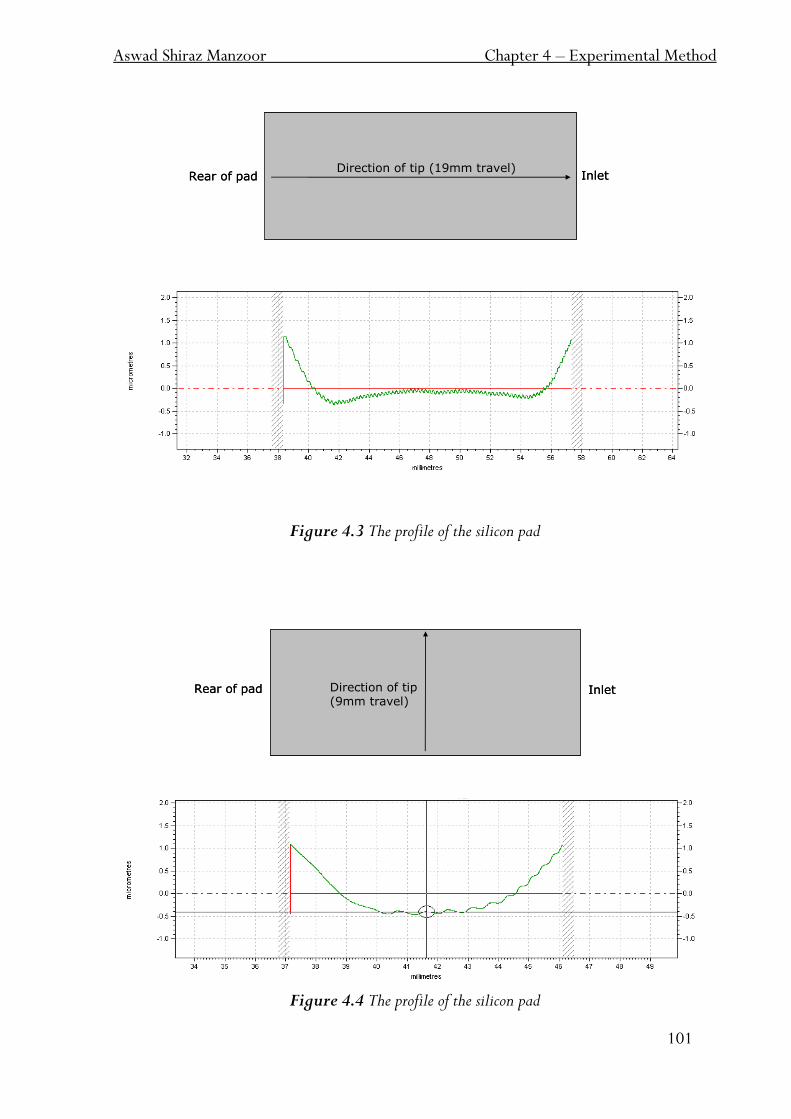
Aswad Shiraz Manzoor Chapter 4 – Experimental Method
101
Figure 4.3 The profile of the silicon pad
Figure 4.4 The profile of the silicon pad
Rear of pad InletDirection of tip (19mm travel)
Rear of pad InletDirection of tip (19mm travel)
Rear of pad InletDirection of tip (9mm travel)
Rear of pad InletDirection of tip (9mm travel)
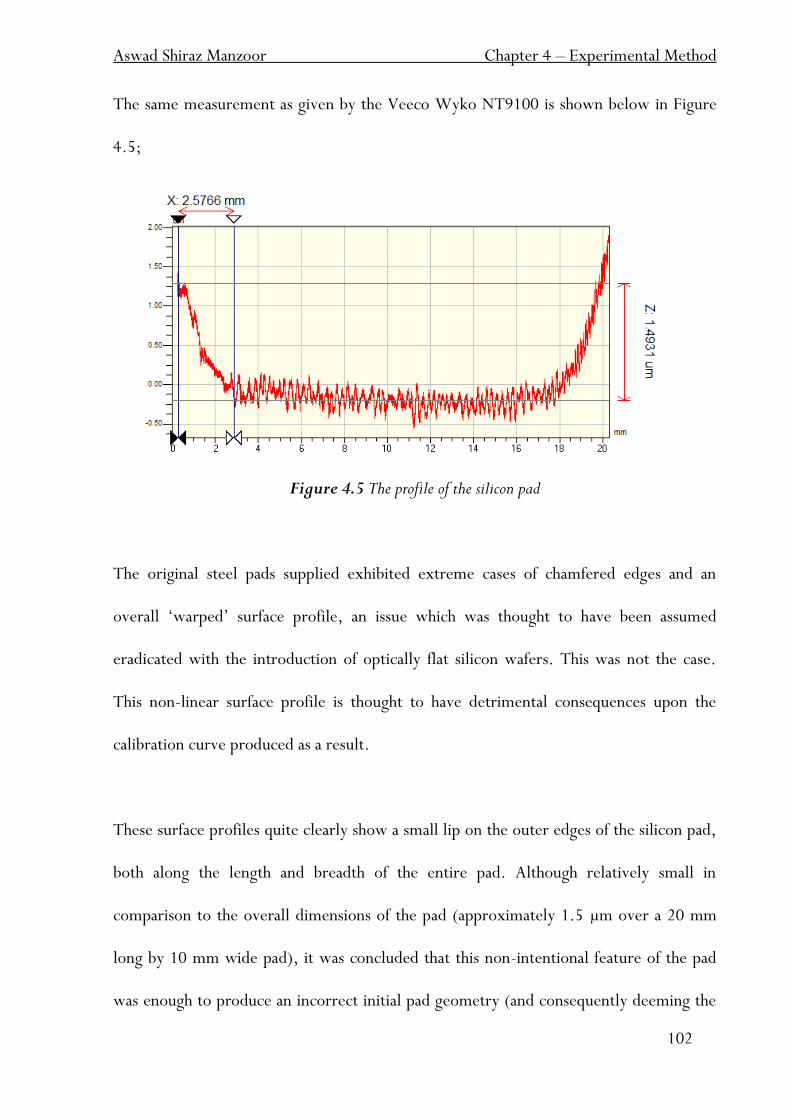
Aswad Shiraz Manzoor Chapter 4 – Experimental Method
102
The same measurement as given by the Veeco Wyko NT9100 is shown below in Figure
4.5;
Figure 4.5 The profile of the silicon pad
The original steel pads supplied exhibited extreme cases of chamfered edges and an
overall „warped‟ surface profile, an issue which was thought to have been assumed
eradicated with the introduction of optically flat silicon wafers. This was not the case.
This non-linear surface profile is thought to have detrimental consequences upon the
calibration curve produced as a result.
These surface profiles quite clearly show a small lip on the outer edges of the silicon pad,
both along the length and breadth of the entire pad. Although relatively small in
comparison to the overall dimensions of the pad (approximately 1.5 µm over a 20 mm
long by 10 mm wide pad), it was concluded that this non-intentional feature of the pad
was enough to produce an incorrect initial pad geometry (and consequently deeming the
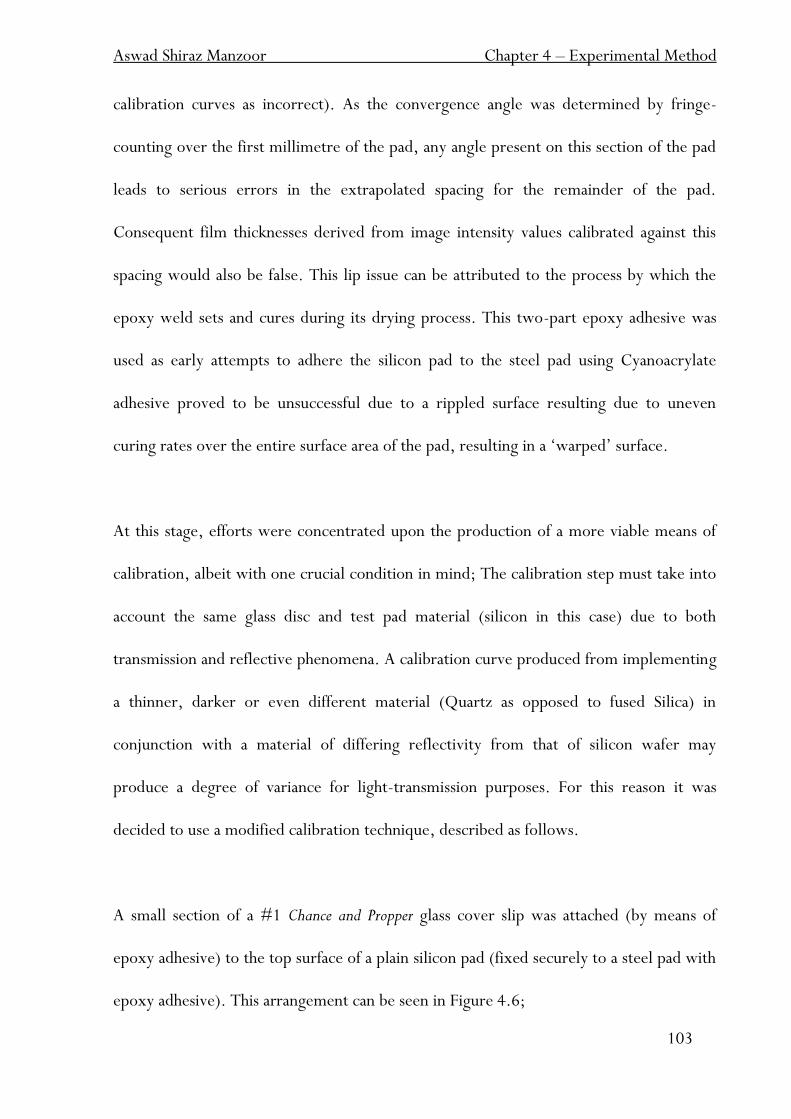
Aswad Shiraz Manzoor Chapter 4 – Experimental Method
103
calibration curves as incorrect). As the convergence angle was determined by fringe-
counting over the first millimetre of the pad, any angle present on this section of the pad
leads to serious errors in the extrapolated spacing for the remainder of the pad.
Consequent film thicknesses derived from image intensity values calibrated against this
spacing would also be false. This lip issue can be attributed to the process by which the
epoxy weld sets and cures during its drying process. This two-part epoxy adhesive was
used as early attempts to adhere the silicon pad to the steel pad using Cyanoacrylate
adhesive proved to be unsuccessful due to a rippled surface resulting due to uneven
curing rates over the entire surface area of the pad, resulting in a „warped‟ surface.
At this stage, efforts were concentrated upon the production of a more viable means of
calibration, albeit with one crucial condition in mind; The calibration step must take into
account the same glass disc and test pad material (silicon in this case) due to both
transmission and reflective phenomena. A calibration curve produced from implementing
a thinner, darker or even different material (Quartz as opposed to fused Silica) in
conjunction with a material of differing reflectivity from that of silicon wafer may
produce a degree of variance for light-transmission purposes. For this reason it was
decided to use a modified calibration technique, described as follows.
A small section of a #1 Chance and Propper glass cover slip was attached (by means of
epoxy adhesive) to the top surface of a plain silicon pad (fixed securely to a steel pad with
epoxy adhesive). This arrangement can be seen in Figure 4.6;
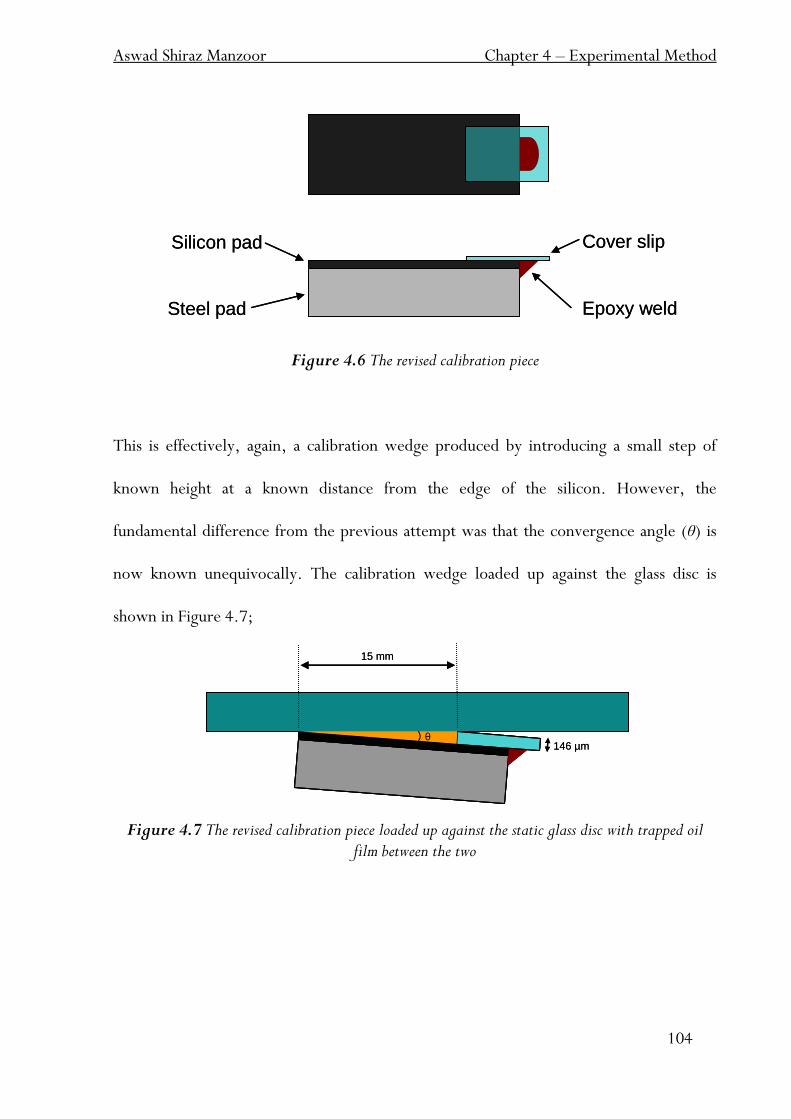
Aswad Shiraz Manzoor Chapter 4 – Experimental Method
104
Figure 4.6 The revised calibration piece
This is effectively, again, a calibration wedge produced by introducing a small step of
known height at a known distance from the edge of the silicon. However, the
fundamental difference from the previous attempt was that the convergence angle (θ) is
now known unequivocally. The calibration wedge loaded up against the glass disc is
shown in Figure 4.7;
Figure 4.7 The revised calibration piece loaded up against the static glass disc with trapped oil film between the two
Silicon pad
Steel pad
Cover slip
Epoxy weld
Silicon pad
Steel pad
Cover slip
Epoxy weld
θ
15 mm
146 µmθ
15 mm
146 µm
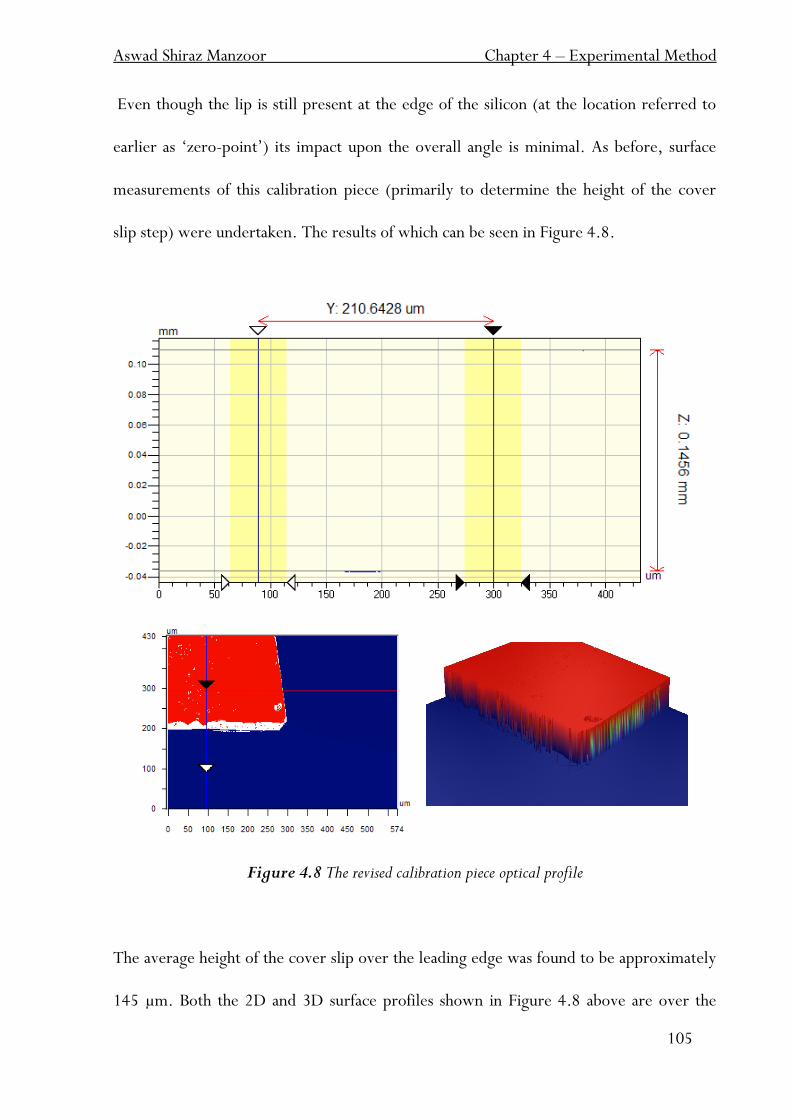
Aswad Shiraz Manzoor Chapter 4 – Experimental Method
105
Even though the lip is still present at the edge of the silicon (at the location referred to
earlier as „zero-point‟) its impact upon the overall angle is minimal. As before, surface
measurements of this calibration piece (primarily to determine the height of the cover
slip step) were undertaken. The results of which can be seen in Figure 4.8.
Figure 4.8 The revised calibration piece optical profile
The average height of the cover slip over the leading edge was found to be approximately
145 µm. Both the 2D and 3D surface profiles shown in Figure 4.8 above are over the
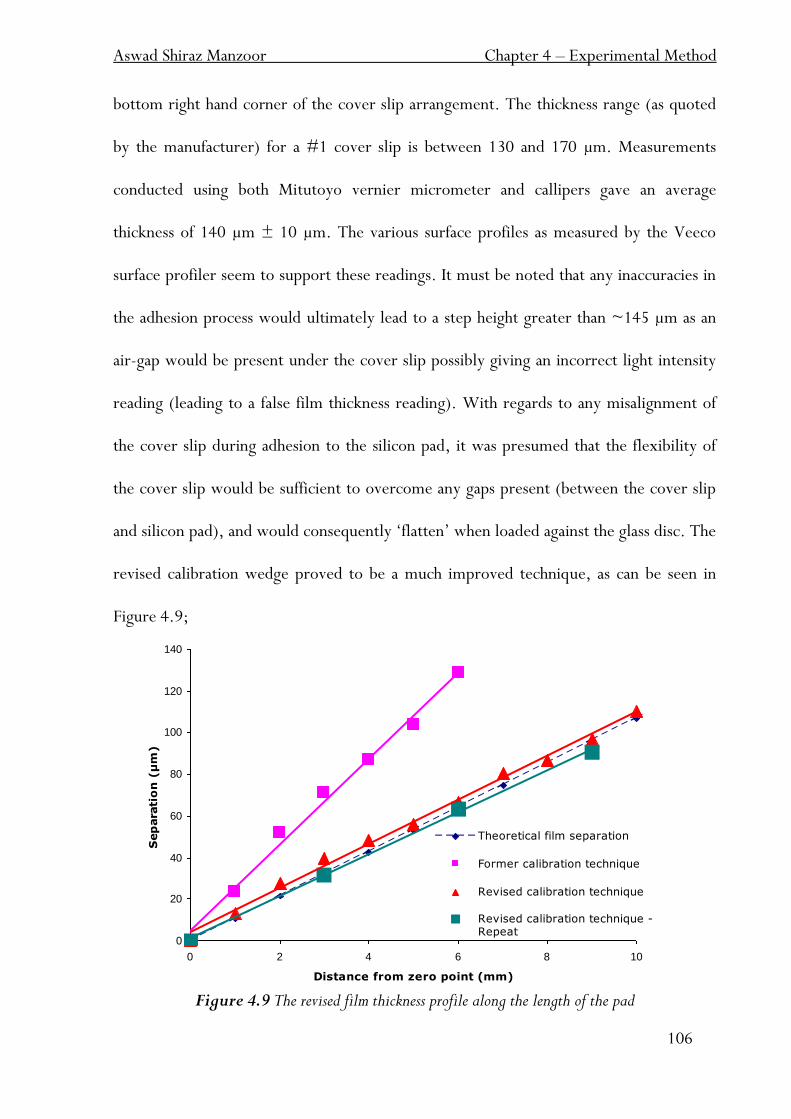
Aswad Shiraz Manzoor Chapter 4 – Experimental Method
106
bottom right hand corner of the cover slip arrangement. The thickness range (as quoted
by the manufacturer) for a #1 cover slip is between 130 and 170 µm. Measurements
conducted using both Mitutoyo vernier micrometer and callipers gave an average
thickness of 140 µm ± 10 µm. The various surface profiles as measured by the Veeco
surface profiler seem to support these readings. It must be noted that any inaccuracies in
the adhesion process would ultimately lead to a step height greater than ~145 µm as an
air-gap would be present under the cover slip possibly giving an incorrect light intensity
reading (leading to a false film thickness reading). With regards to any misalignment of
the cover slip during adhesion to the silicon pad, it was presumed that the flexibility of
the cover slip would be sufficient to overcome any gaps present (between the cover slip
and silicon pad), and would consequently „flatten‟ when loaded against the glass disc. The
revised calibration wedge proved to be a much improved technique, as can be seen in
Figure 4.9;
Figure 4.9 The revised film thickness profile along the length of the pad
0
20
40
60
80
100
120
140
0 2 4 6 8 10
Distance from zero point (mm)
Sep
ara
tio
n (
µm
)
Theoretical film separation
Former calibration technique
Revised calibration technique
Revised calibration technique -Repeat
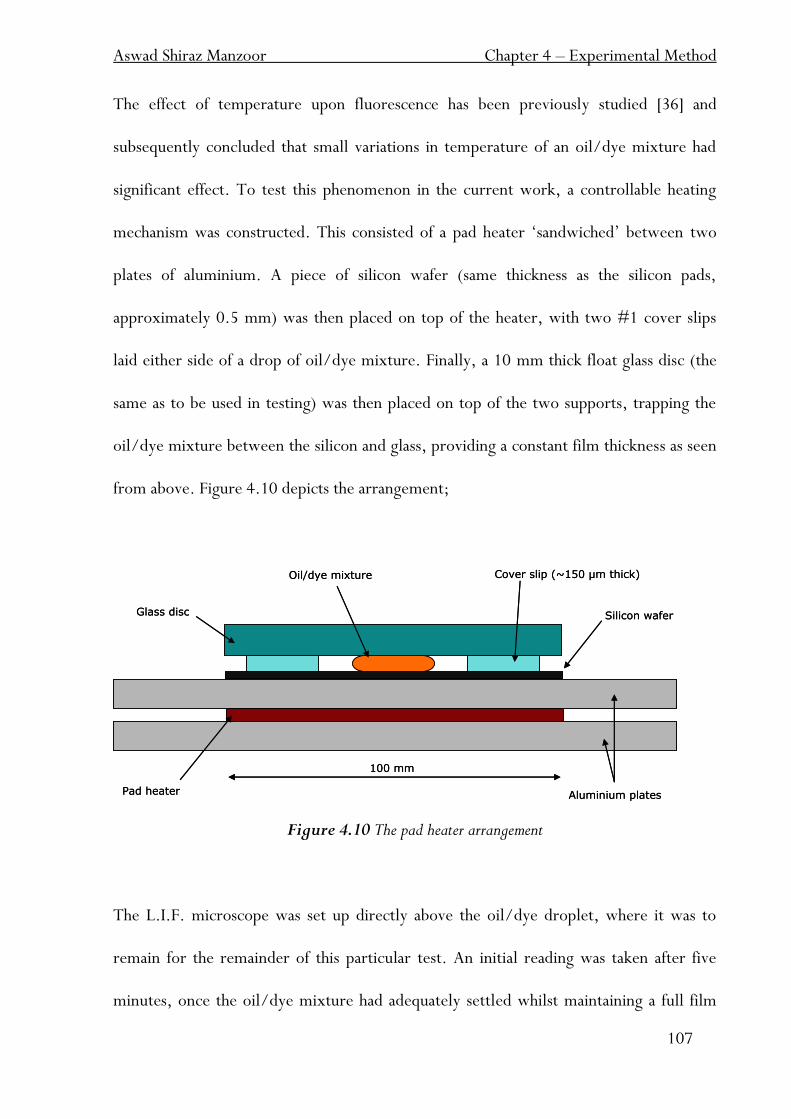
Aswad Shiraz Manzoor Chapter 4 – Experimental Method
107
The effect of temperature upon fluorescence has been previously studied [36] and
subsequently concluded that small variations in temperature of an oil/dye mixture had
significant effect. To test this phenomenon in the current work, a controllable heating
mechanism was constructed. This consisted of a pad heater „sandwiched‟ between two
plates of aluminium. A piece of silicon wafer (same thickness as the silicon pads,
approximately 0.5 mm) was then placed on top of the heater, with two #1 cover slips
laid either side of a drop of oil/dye mixture. Finally, a 10 mm thick float glass disc (the
same as to be used in testing) was then placed on top of the two supports, trapping the
oil/dye mixture between the silicon and glass, providing a constant film thickness as seen
from above. Figure 4.10 depicts the arrangement;
Figure 4.10 The pad heater arrangement
The L.I.F. microscope was set up directly above the oil/dye droplet, where it was to
remain for the remainder of this particular test. An initial reading was taken after five
minutes, once the oil/dye mixture had adequately settled whilst maintaining a full film
Glass disc
Pad heater
Cover slip (~150 µm thick)Oil/dye mixture
Aluminium plates
Silicon wafer
100 mm
Glass disc
Pad heater
Cover slip (~150 µm thick)Oil/dye mixture
Aluminium plates
Silicon wafer
100 mm
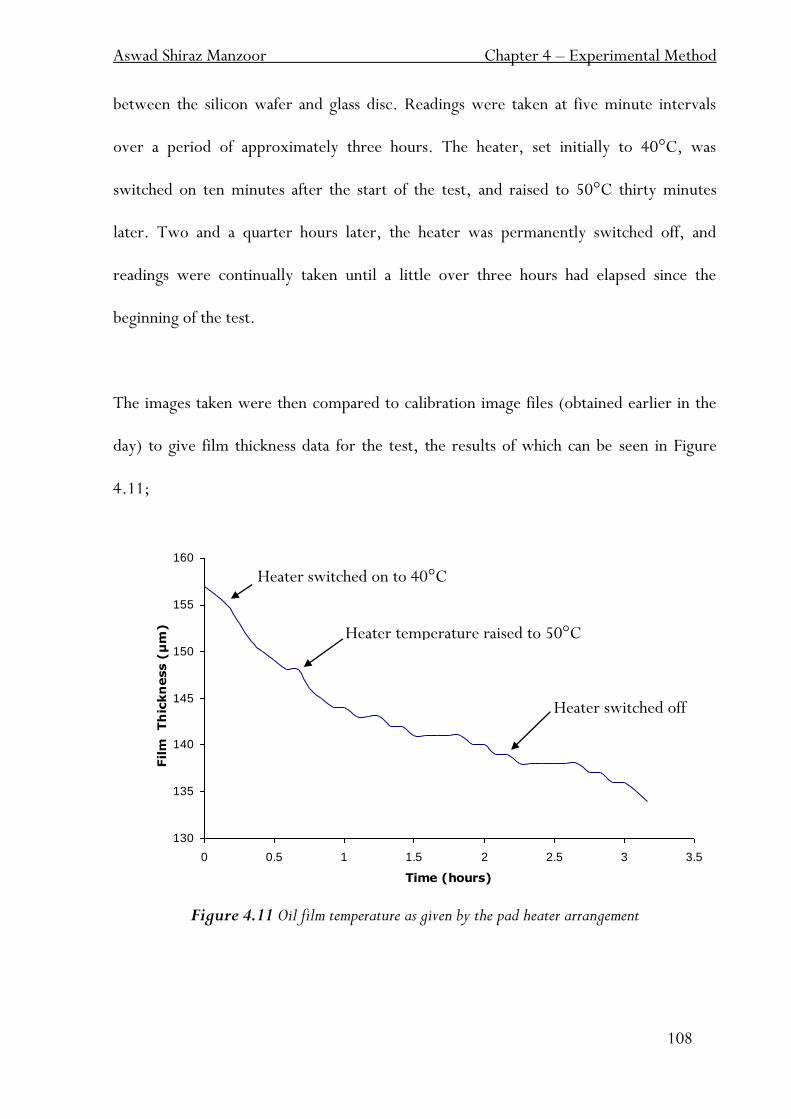
Aswad Shiraz Manzoor Chapter 4 – Experimental Method
108
between the silicon wafer and glass disc. Readings were taken at five minute intervals
over a period of approximately three hours. The heater, set initially to 40°C, was
switched on ten minutes after the start of the test, and raised to 50°C thirty minutes
later. Two and a quarter hours later, the heater was permanently switched off, and
readings were continually taken until a little over three hours had elapsed since the
beginning of the test.
The images taken were then compared to calibration image files (obtained earlier in the
day) to give film thickness data for the test, the results of which can be seen in Figure
4.11;
Figure 4.11 Oil film temperature as given by the pad heater arrangement
130
135
140
145
150
155
160
0 0.5 1 1.5 2 2.5 3 3.5
Time (hours)
Film
Th
ickn
ess (
µm
)
Heater switched on to 40°C
Heater temperature raised to 50°C
Heater switched off
Aswad Shiraz Manzoor Chapter 4 – Experimental Method
109
At no point during the above test did the film thickness increase due to a temperature
increase. It was therefore concluded that the fluorescent intensity of this specific dye does
not increase with a rise in temperature. The fluorescent intensity (and consequently the
film thickness) starts to decrease from the very beginning of the test, a result typical of
the effects of photobleaching. If a dye is continually or over-exposed to a light source
(typically matched to its excitation wavelength) it eventually degrades the fluorescent
component present within the dye.
During the test explained above, the oil/dye mixture was only exposed to the light
source at the instant the image was taken by controlling the shutter built into the light
source; over 40 images were taken over the entirety of the test. With each image taking
approximately ten seconds to complete, it is estimated that the mixture was exposed to
the light source for seven minutes. The light source was operated with a completely open
shutter mechanism, and thus the oil/dye mixture was exposed to an intense source of
U.V long enough to degrade the fluorescent component. As expected, any subsequent
images taken showed marginal differences in pixel intensity from an image taken
previously. Repeats conducted of the above test with the shutter left continually open and
the heater switched off throughout, exhibited the same photobleaching phenomenon
occurring at a much faster rate. The effects of photobleaching were determined to be of
the utmost importance when considering image intensity data, and the issue of
controlling the shutter time during the calibration process was duly noted (i.e. kept at a
minimum at all times).
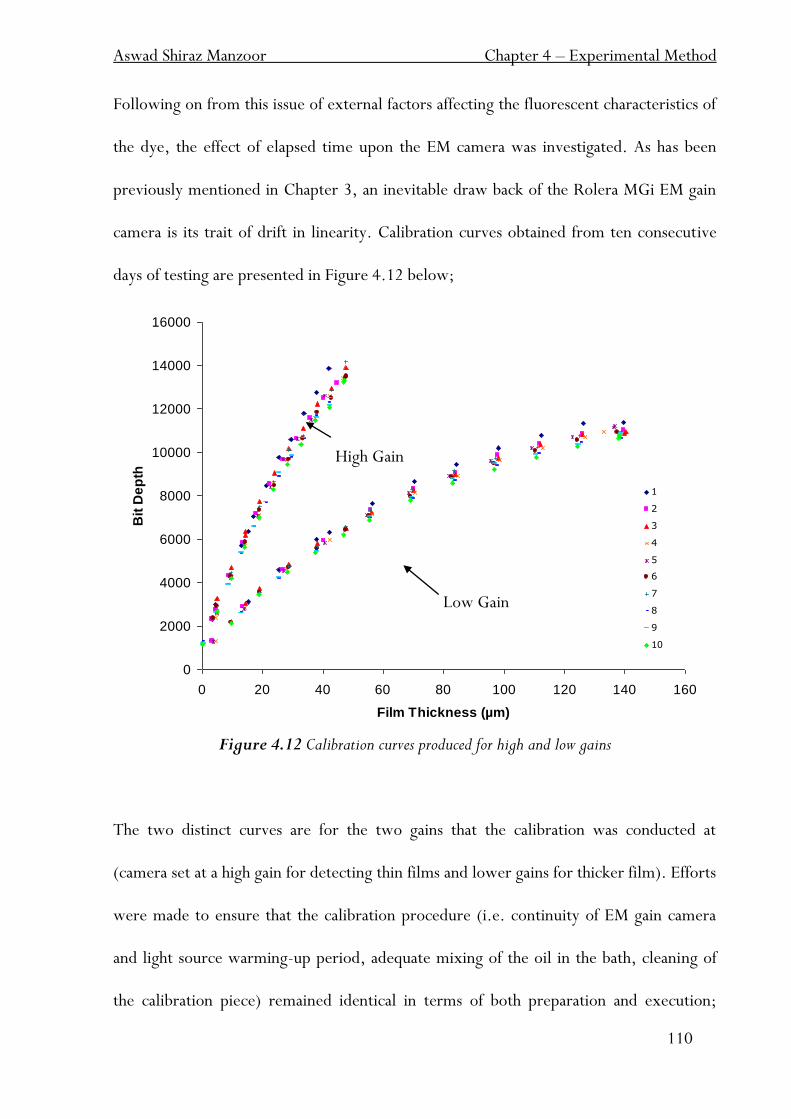
Aswad Shiraz Manzoor Chapter 4 – Experimental Method
110
0
2000
4000
6000
8000
10000
12000
14000
16000
0 20 40 60 80 100 120 140 160
Film Thickness (µm)
Bit
De
pth
1
2
3
4
5
6
7
8
9
10
Following on from this issue of external factors affecting the fluorescent characteristics of
the dye, the effect of elapsed time upon the EM camera was investigated. As has been
previously mentioned in Chapter 3, an inevitable draw back of the Rolera MGi EM gain
camera is its trait of drift in linearity. Calibration curves obtained from ten consecutive
days of testing are presented in Figure 4.12 below;
Figure 4.12 Calibration curves produced for high and low gains
The two distinct curves are for the two gains that the calibration was conducted at
(camera set at a high gain for detecting thin films and lower gains for thicker film). Efforts
were made to ensure that the calibration procedure (i.e. continuity of EM gain camera
and light source warming-up period, adequate mixing of the oil in the bath, cleaning of
the calibration piece) remained identical in terms of both preparation and execution;
High Gain
Low Gain
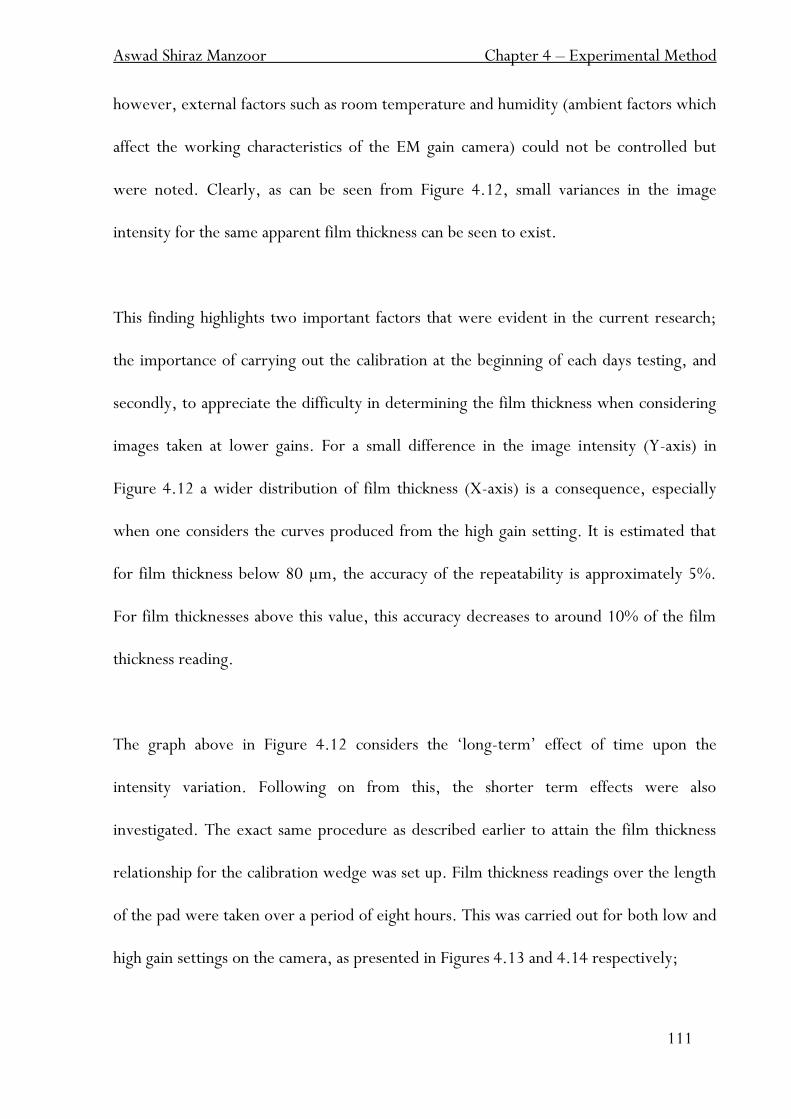
Aswad Shiraz Manzoor Chapter 4 – Experimental Method
111
however, external factors such as room temperature and humidity (ambient factors which
affect the working characteristics of the EM gain camera) could not be controlled but
were noted. Clearly, as can be seen from Figure 4.12, small variances in the image
intensity for the same apparent film thickness can be seen to exist.
This finding highlights two important factors that were evident in the current research;
the importance of carrying out the calibration at the beginning of each days testing, and
secondly, to appreciate the difficulty in determining the film thickness when considering
images taken at lower gains. For a small difference in the image intensity (Y-axis) in
Figure 4.12 a wider distribution of film thickness (X-axis) is a consequence, especially
when one considers the curves produced from the high gain setting. It is estimated that
for film thickness below 80 µm, the accuracy of the repeatability is approximately 5%.
For film thicknesses above this value, this accuracy decreases to around 10% of the film
thickness reading.
The graph above in Figure 4.12 considers the „long-term‟ effect of time upon the
intensity variation. Following on from this, the shorter term effects were also
investigated. The exact same procedure as described earlier to attain the film thickness
relationship for the calibration wedge was set up. Film thickness readings over the length
of the pad were taken over a period of eight hours. This was carried out for both low and
high gain settings on the camera, as presented in Figures 4.13 and 4.14 respectively;
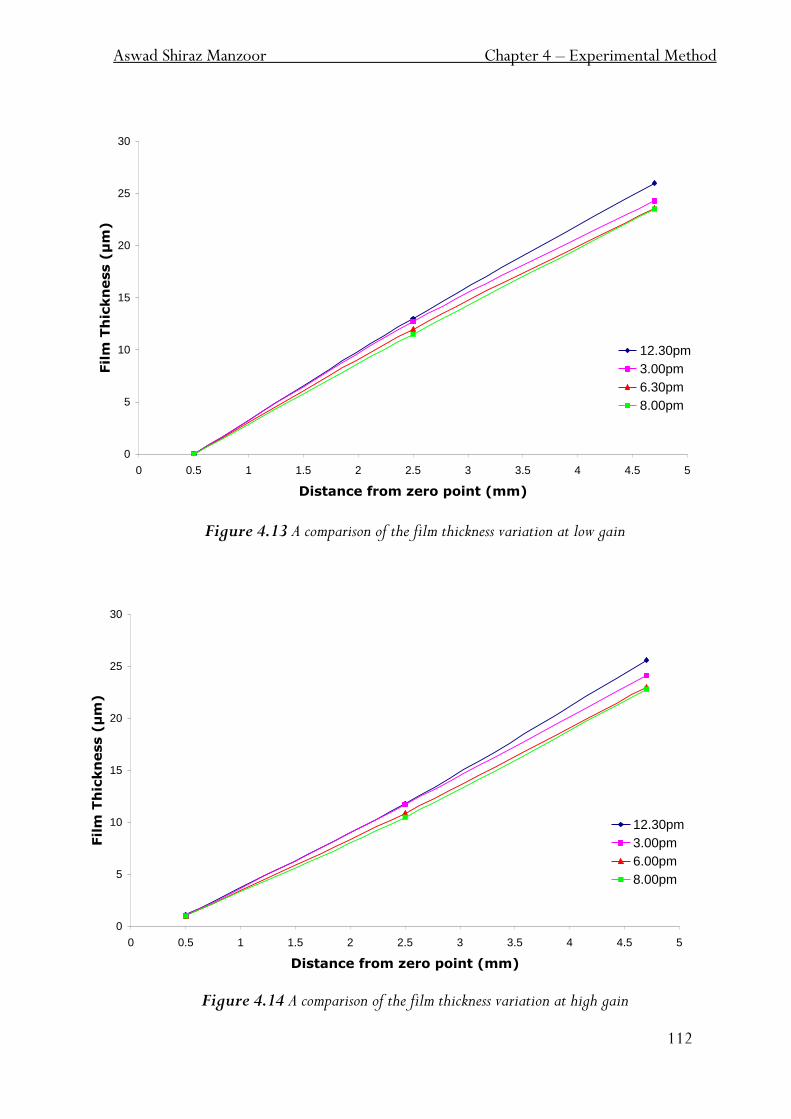
Aswad Shiraz Manzoor Chapter 4 – Experimental Method
112
0
5
10
15
20
25
30
0 0.5 1 1.5 2 2.5 3 3.5 4 4.5 5
Distance from zero point (mm)
Fil
m T
hic
kn
ess (
µm
)
12.30pm
3.00pm
6.30pm
8.00pm
0
5
10
15
20
25
30
0 0.5 1 1.5 2 2.5 3 3.5 4 4.5 5
Distance from zero point (mm)
Fil
m T
hic
kn
ess (
µm
)
12.30pm
3.00pm
6.00pm
8.00pm
Figure 4.13 A comparison of the film thickness variation at low gain
Figure 4.14 A comparison of the film thickness variation at high gain
Aswad Shiraz Manzoor Chapter 4 – Experimental Method
113
An obvious differences present in both graphs is the gradual decrease of perceived film
thickness, regardless of the absolutes film thickness value and the gain at which the
imaging was undertaken. This effect is more pronounced as the film thickness increases.
Interestingly, the film thickness at the lowest distance from zero point (0.5 mm) as given
by the low gain setting is perceived as near zero. At the high gain setting, the film is in the
region of 1 µm. Consider the two curves as presented in Figure 4.12; small fluctuations
in the image intensity are easily detectable by the camera at the higher gain setting, and
accordingly there is a narrower range of possible film thickness to suit. As well as the
possibility of photobleaching, it appeared that there was a tendency of the cameras EM
gain property to drift over time.
An un-expected issue that presented itself in the midst of the above tests was that of
focussing. Every camera system has a certain depth of focus within its optics, and the
current work is no exception. This is often defined as the vertical range that the
microscope objective lens can focus to within the target area at any one time, the
optimum being when the target is in perfect focus during imaging (determined by the
sharpness of the image). Consider a film of thickness h deposited between a glass disc and
silicon surface as depicted in Figure 4.15.
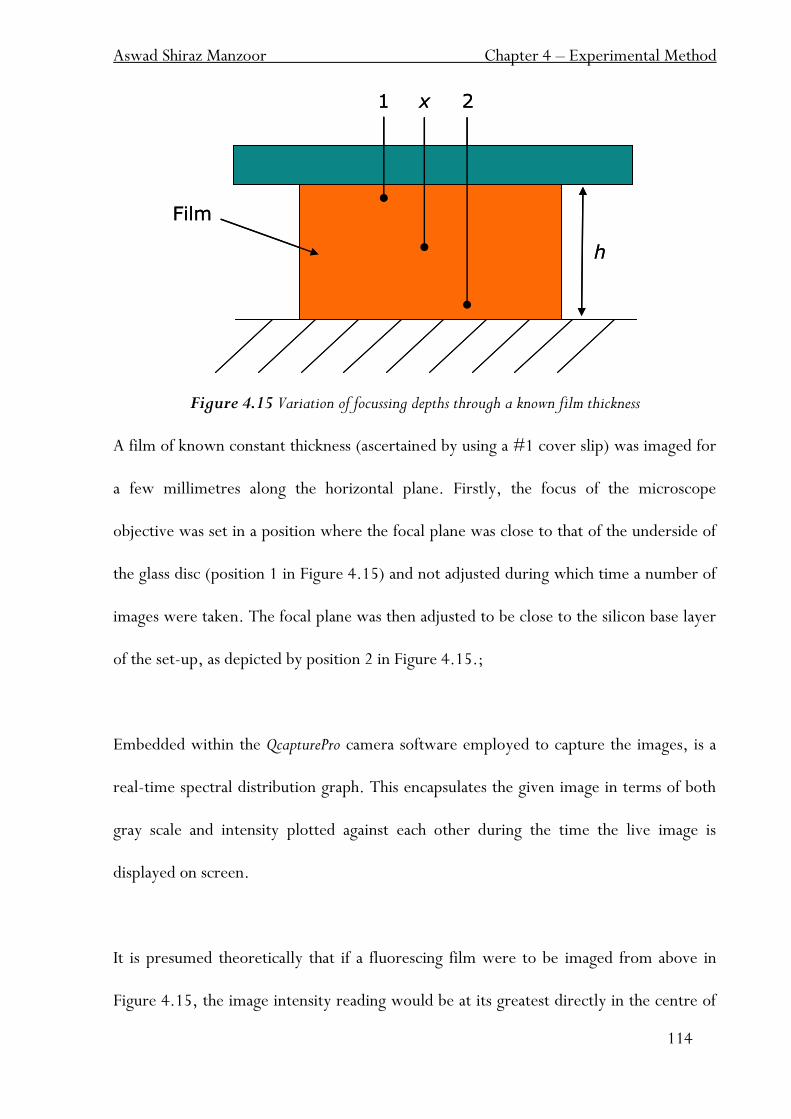
Aswad Shiraz Manzoor Chapter 4 – Experimental Method
114
Figure 4.15 Variation of focussing depths through a known film thickness
A film of known constant thickness (ascertained by using a #1 cover slip) was imaged for
a few millimetres along the horizontal plane. Firstly, the focus of the microscope
objective was set in a position where the focal plane was close to that of the underside of
the glass disc (position 1 in Figure 4.15) and not adjusted during which time a number of
images were taken. The focal plane was then adjusted to be close to the silicon base layer
of the set-up, as depicted by position 2 in Figure 4.15.;
Embedded within the QcapturePro camera software employed to capture the images, is a
real-time spectral distribution graph. This encapsulates the given image in terms of both
gray scale and intensity plotted against each other during the time the live image is
displayed on screen.
It is presumed theoretically that if a fluorescing film were to be imaged from above in
Figure 4.15, the image intensity reading would be at its greatest directly in the centre of
1 x 2
h
Film
1 x 2
h
Film
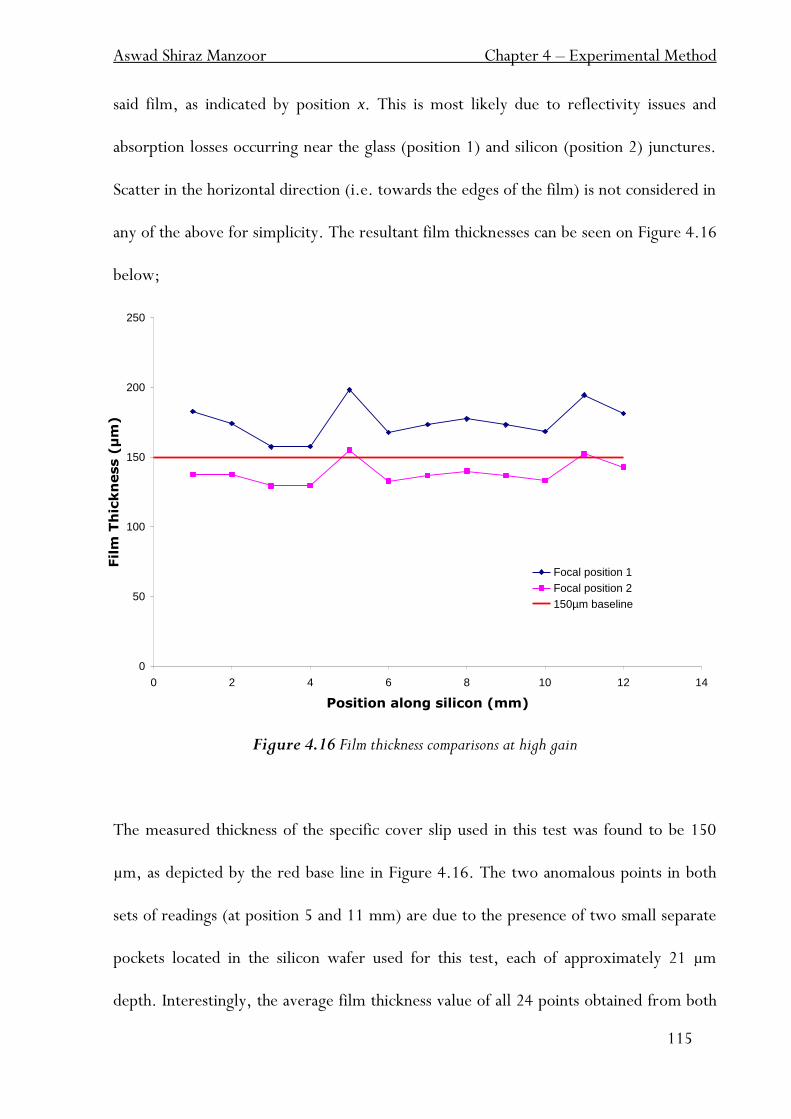
Aswad Shiraz Manzoor Chapter 4 – Experimental Method
115
0
50
100
150
200
250
0 2 4 6 8 10 12 14
Position along silicon (mm)
Fil
m T
hic
kn
ess (
µm
)
Focal position 1
Focal position 2
150µm baseline
said film, as indicated by position x. This is most likely due to reflectivity issues and
absorption losses occurring near the glass (position 1) and silicon (position 2) junctures.
Scatter in the horizontal direction (i.e. towards the edges of the film) is not considered in
any of the above for simplicity. The resultant film thicknesses can be seen on Figure 4.16
below;
Figure 4.16 Film thickness comparisons at high gain
The measured thickness of the specific cover slip used in this test was found to be 150
µm, as depicted by the red base line in Figure 4.16. The two anomalous points in both
sets of readings (at position 5 and 11 mm) are due to the presence of two small separate
pockets located in the silicon wafer used for this test, each of approximately 21 µm
depth. Interestingly, the average film thickness value of all 24 points obtained from both
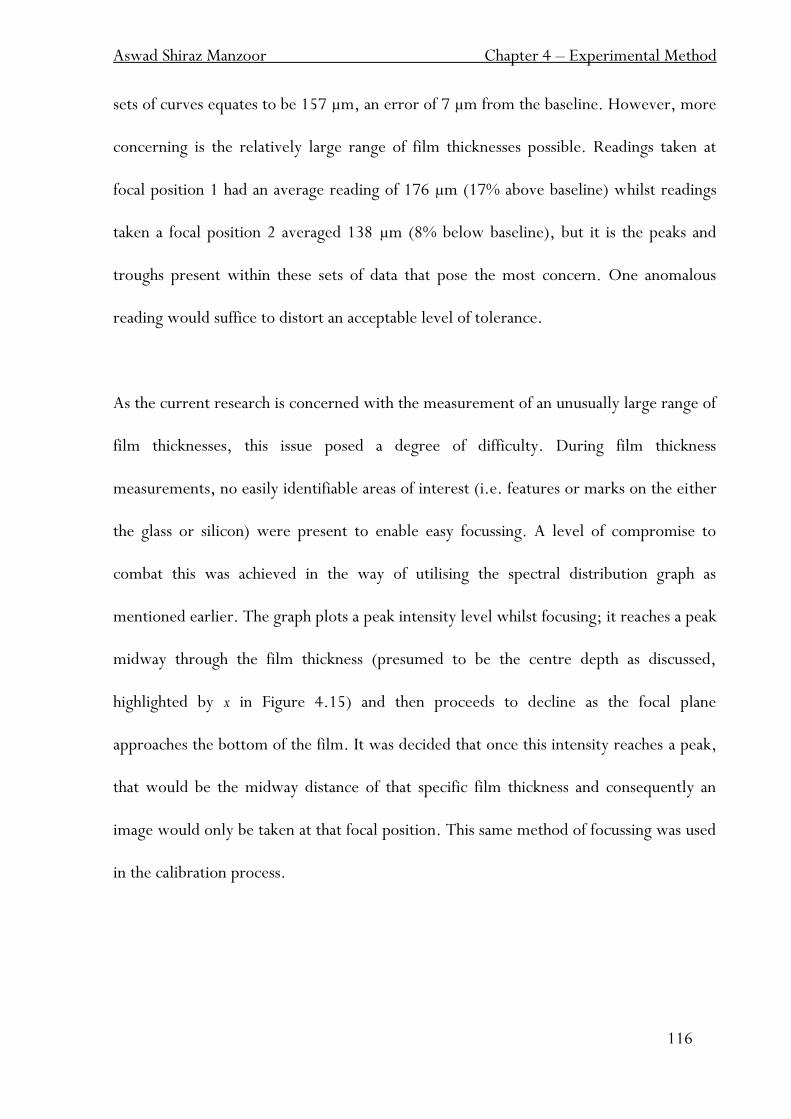
Aswad Shiraz Manzoor Chapter 4 – Experimental Method
116
sets of curves equates to be 157 µm, an error of 7 µm from the baseline. However, more
concerning is the relatively large range of film thicknesses possible. Readings taken at
focal position 1 had an average reading of 176 µm (17% above baseline) whilst readings
taken a focal position 2 averaged 138 µm (8% below baseline), but it is the peaks and
troughs present within these sets of data that pose the most concern. One anomalous
reading would suffice to distort an acceptable level of tolerance.
As the current research is concerned with the measurement of an unusually large range of
film thicknesses, this issue posed a degree of difficulty. During film thickness
measurements, no easily identifiable areas of interest (i.e. features or marks on the either
the glass or silicon) were present to enable easy focussing. A level of compromise to
combat this was achieved in the way of utilising the spectral distribution graph as
mentioned earlier. The graph plots a peak intensity level whilst focusing; it reaches a peak
midway through the film thickness (presumed to be the centre depth as discussed,
highlighted by x in Figure 4.15) and then proceeds to decline as the focal plane
approaches the bottom of the film. It was decided that once this intensity reaches a peak,
that would be the midway distance of that specific film thickness and consequently an
image would only be taken at that focal position. This same method of focussing was used
in the calibration process.
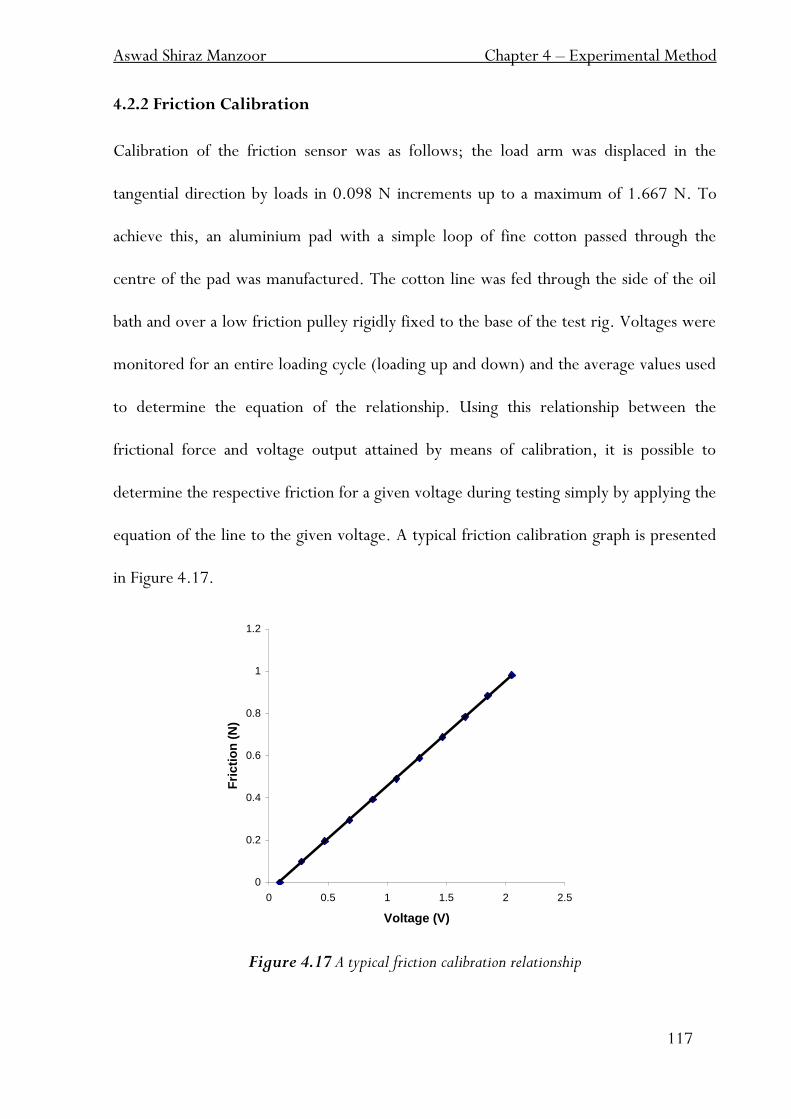
Aswad Shiraz Manzoor Chapter 4 – Experimental Method
117
0
0.2
0.4
0.6
0.8
1
1.2
0 0.5 1 1.5 2 2.5
Voltage (V)
Fri
cti
on
(N
)
4.2.2 Friction Calibration
Calibration of the friction sensor was as follows; the load arm was displaced in the
tangential direction by loads in 0.098 N increments up to a maximum of 1.667 N. To
achieve this, an aluminium pad with a simple loop of fine cotton passed through the
centre of the pad was manufactured. The cotton line was fed through the side of the oil
bath and over a low friction pulley rigidly fixed to the base of the test rig. Voltages were
monitored for an entire loading cycle (loading up and down) and the average values used
to determine the equation of the relationship. Using this relationship between the
frictional force and voltage output attained by means of calibration, it is possible to
determine the respective friction for a given voltage during testing simply by applying the
equation of the line to the given voltage. A typical friction calibration graph is presented
in Figure 4.17.
Figure 4.17 A typical friction calibration relationship
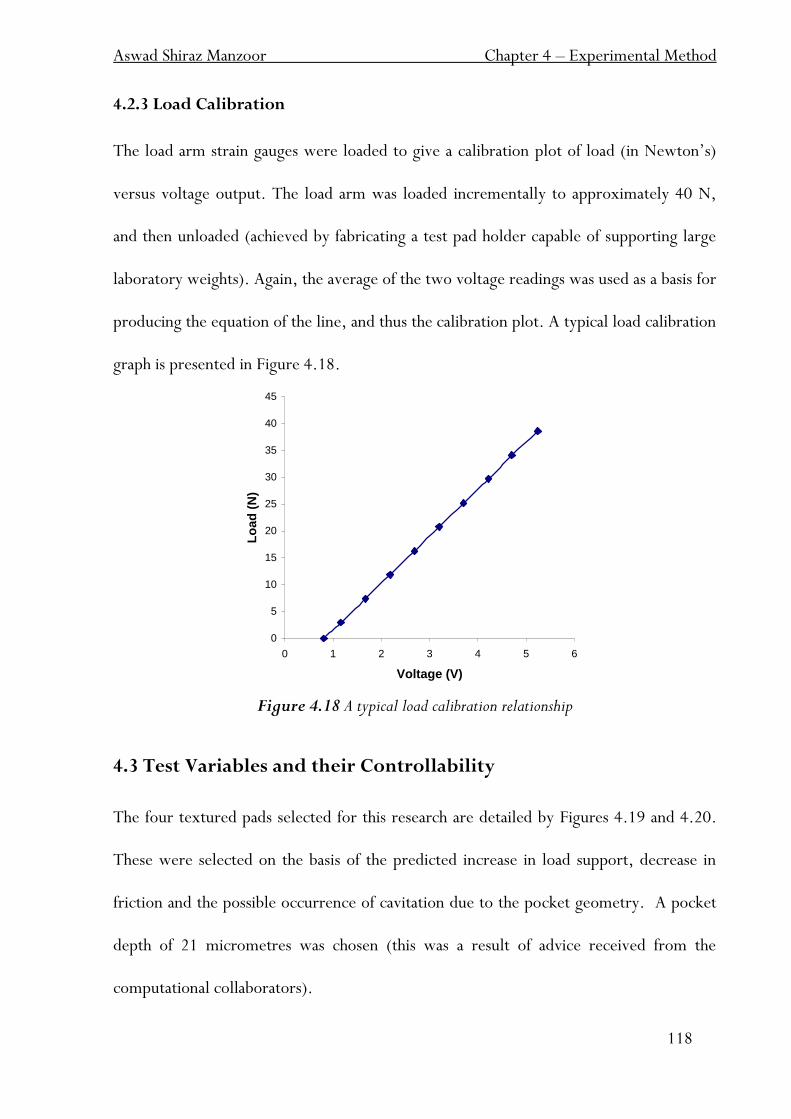
Aswad Shiraz Manzoor Chapter 4 – Experimental Method
118
4.2.3 Load Calibration
The load arm strain gauges were loaded to give a calibration plot of load (in Newton‟s)
versus voltage output. The load arm was loaded incrementally to approximately 40 N,
and then unloaded (achieved by fabricating a test pad holder capable of supporting large
laboratory weights). Again, the average of the two voltage readings was used as a basis for
producing the equation of the line, and thus the calibration plot. A typical load calibration
graph is presented in Figure 4.18.
Figure 4.18 A typical load calibration relationship
4.3 Test Variables and their Controllability
The four textured pads selected for this research are detailed by Figures 4.19 and 4.20.
These were selected on the basis of the predicted increase in load support, decrease in
friction and the possible occurrence of cavitation due to the pocket geometry. A pocket
depth of 21 micrometres was chosen (this was a result of advice received from the
computational collaborators).
0
5
10
15
20
25
30
35
40
45
0 1 2 3 4 5 6
Voltage (V)
Lo
ad
(N
)
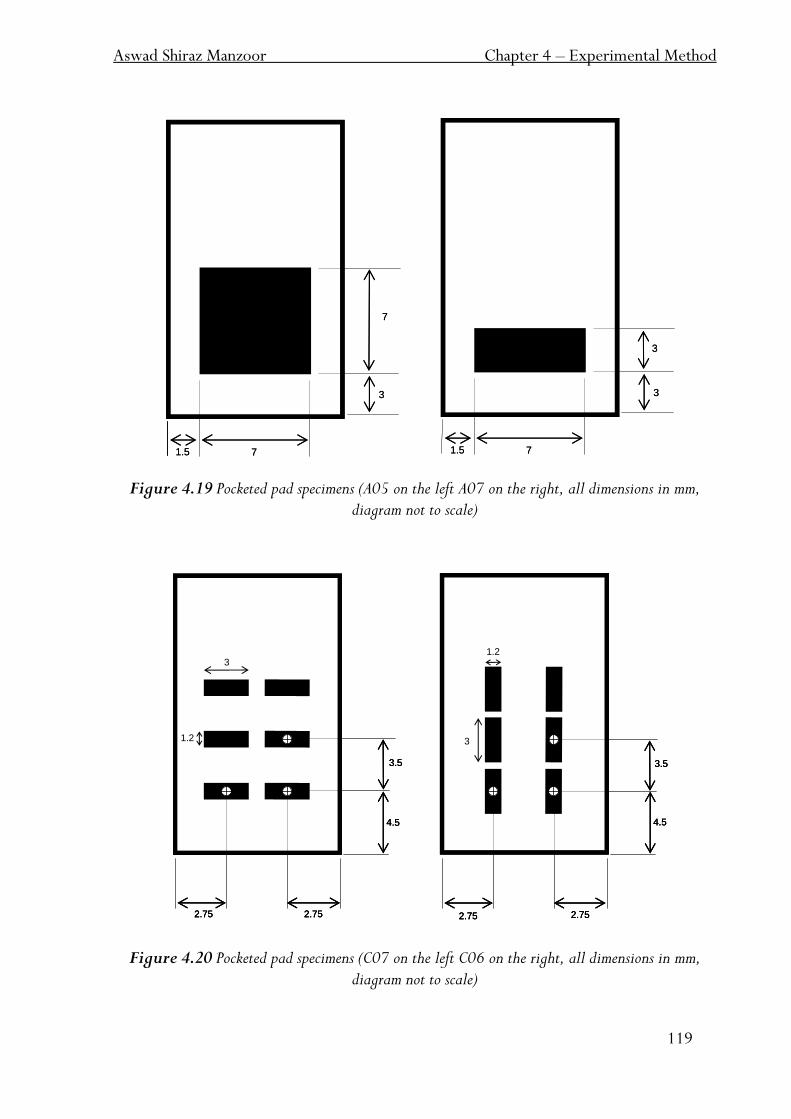
Aswad Shiraz Manzoor Chapter 4 – Experimental Method
119
3
7
71.5
3
3
71.5
3
7
71.5
3
3
71.5
Figure 4.19 Pocketed pad specimens (A05 on the left A07 on the right, all dimensions in mm, diagram not to scale)
Figure 4.20 Pocketed pad specimens (C07 on the left C06 on the right, all dimensions in mm,
diagram not to scale)
1.2
3
3.5
4.5
2.75 2.75
3.5
4.5
2.752.75
3
1.2
1.2
3
3.5
4.5
2.75 2.75
1.2
3
3.5
4.5
2.75 2.75
3.5
4.5
2.752.75
3
1.2
3.5
4.5
2.752.75
3
1.2
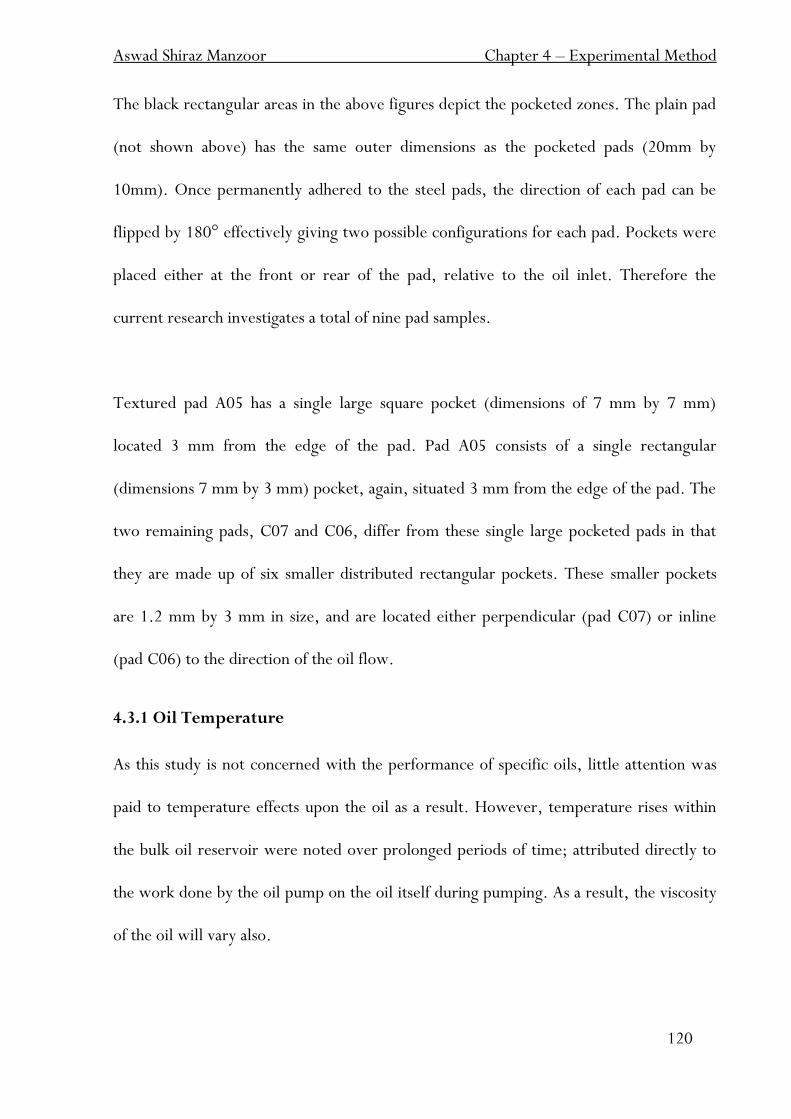
Aswad Shiraz Manzoor Chapter 4 – Experimental Method
120
The black rectangular areas in the above figures depict the pocketed zones. The plain pad
(not shown above) has the same outer dimensions as the pocketed pads (20mm by
10mm). Once permanently adhered to the steel pads, the direction of each pad can be
flipped by 180° effectively giving two possible configurations for each pad. Pockets were
placed either at the front or rear of the pad, relative to the oil inlet. Therefore the
current research investigates a total of nine pad samples.
Textured pad A05 has a single large square pocket (dimensions of 7 mm by 7 mm)
located 3 mm from the edge of the pad. Pad A05 consists of a single rectangular
(dimensions 7 mm by 3 mm) pocket, again, situated 3 mm from the edge of the pad. The
two remaining pads, C07 and C06, differ from these single large pocketed pads in that
they are made up of six smaller distributed rectangular pockets. These smaller pockets
are 1.2 mm by 3 mm in size, and are located either perpendicular (pad C07) or inline
(pad C06) to the direction of the oil flow.
4.3.1 Oil Temperature
As this study is not concerned with the performance of specific oils, little attention was
paid to temperature effects upon the oil as a result. However, temperature rises within
the bulk oil reservoir were noted over prolonged periods of time; attributed directly to
the work done by the oil pump on the oil itself during pumping. As a result, the viscosity
of the oil will vary also.
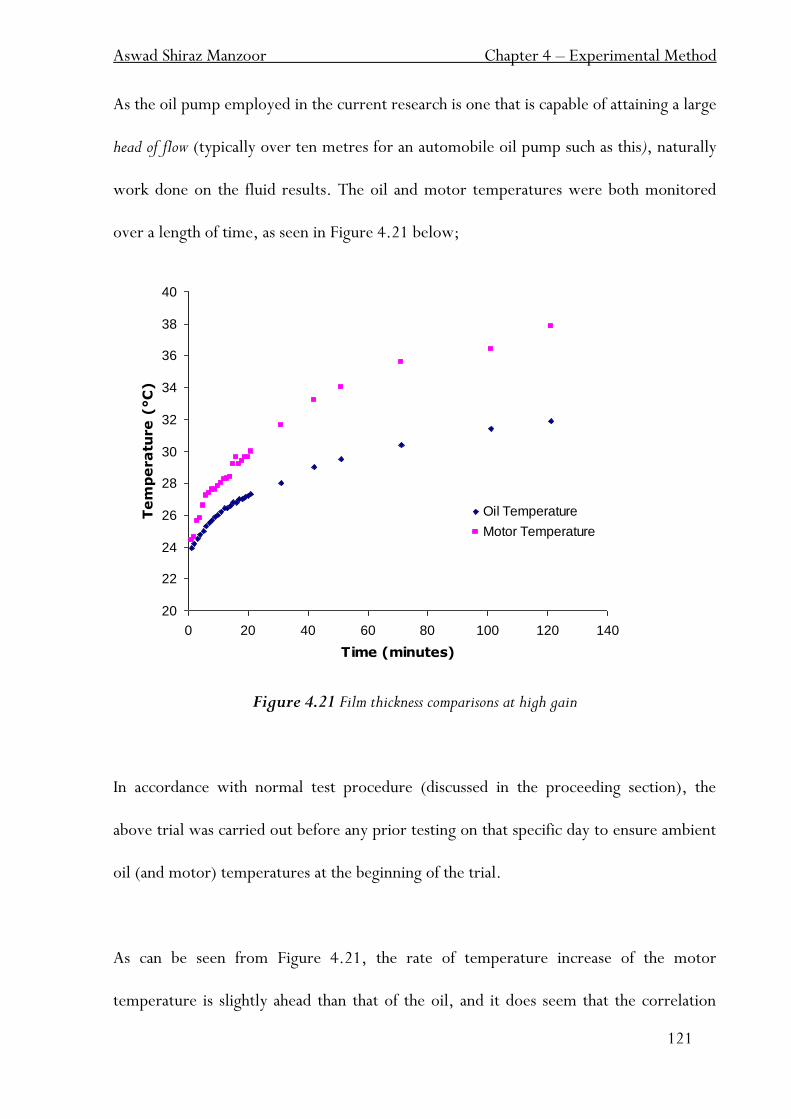
Aswad Shiraz Manzoor Chapter 4 – Experimental Method
121
20
22
24
26
28
30
32
34
36
38
40
0 20 40 60 80 100 120 140
Time (minutes)
Te
mp
era
ture
(°C
)
Oil Temperature
Motor Temperature
As the oil pump employed in the current research is one that is capable of attaining a large
head of flow (typically over ten metres for an automobile oil pump such as this), naturally
work done on the fluid results. The oil and motor temperatures were both monitored
over a length of time, as seen in Figure 4.21 below;
Figure 4.21 Film thickness comparisons at high gain
In accordance with normal test procedure (discussed in the proceeding section), the
above trial was carried out before any prior testing on that specific day to ensure ambient
oil (and motor) temperatures at the beginning of the trial.
As can be seen from Figure 4.21, the rate of temperature increase of the motor
temperature is slightly ahead than that of the oil, and it does seem that the correlation
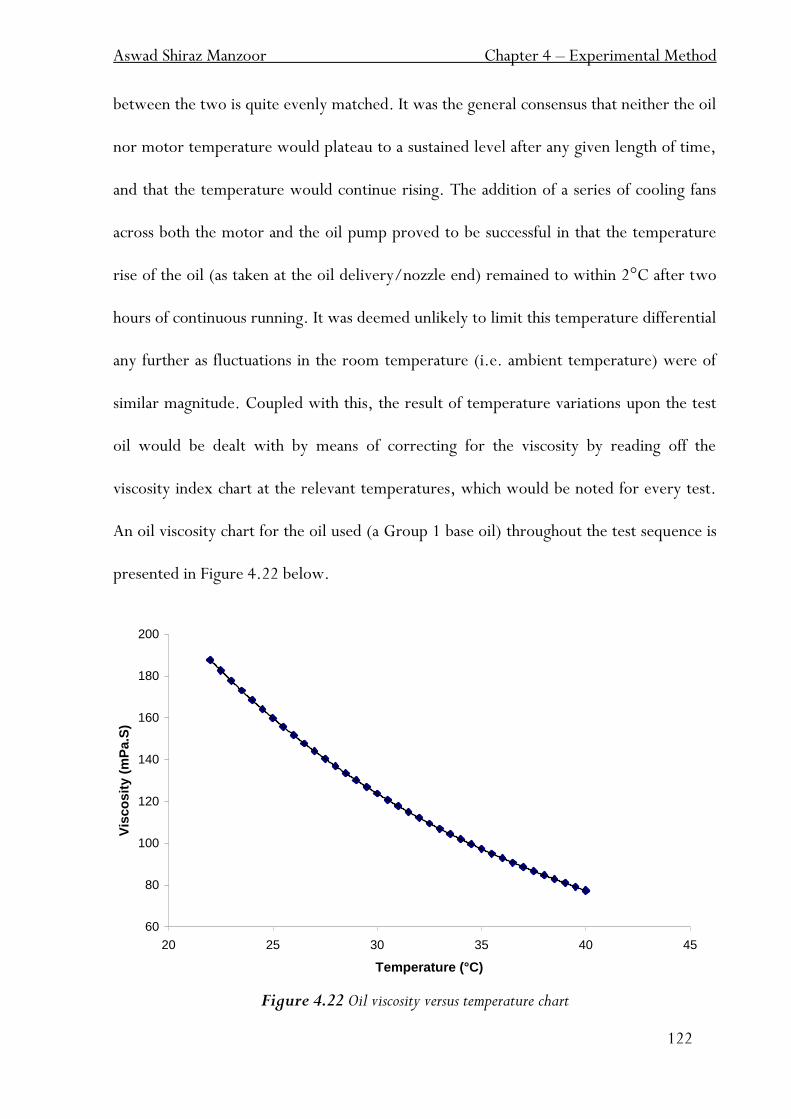
Aswad Shiraz Manzoor Chapter 4 – Experimental Method
122
60
80
100
120
140
160
180
200
20 25 30 35 40 45
Temperature (°C)
Vis
co
sit
y (
mP
a.S
)
between the two is quite evenly matched. It was the general consensus that neither the oil
nor motor temperature would plateau to a sustained level after any given length of time,
and that the temperature would continue rising. The addition of a series of cooling fans
across both the motor and the oil pump proved to be successful in that the temperature
rise of the oil (as taken at the oil delivery/nozzle end) remained to within 2°C after two
hours of continuous running. It was deemed unlikely to limit this temperature differential
any further as fluctuations in the room temperature (i.e. ambient temperature) were of
similar magnitude. Coupled with this, the result of temperature variations upon the test
oil would be dealt with by means of correcting for the viscosity by reading off the
viscosity index chart at the relevant temperatures, which would be noted for every test.
An oil viscosity chart for the oil used (a Group 1 base oil) throughout the test sequence is
presented in Figure 4.22 below.
Figure 4.22 Oil viscosity versus temperature chart
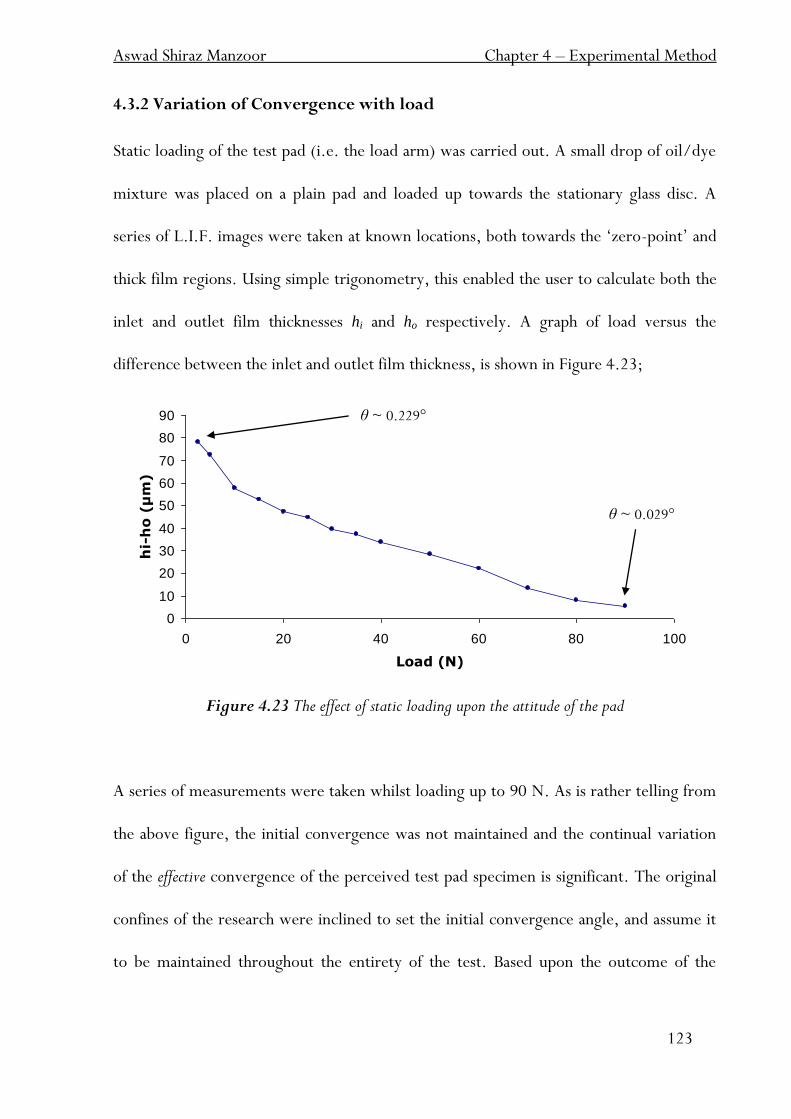
Aswad Shiraz Manzoor Chapter 4 – Experimental Method
123
0
10
20
30
40
50
60
70
80
90
0 20 40 60 80 100
Load (N)
hi-
ho (
µm
)
4.3.2 Variation of Convergence with load
Static loading of the test pad (i.e. the load arm) was carried out. A small drop of oil/dye
mixture was placed on a plain pad and loaded up towards the stationary glass disc. A
series of L.I.F. images were taken at known locations, both towards the „zero-point‟ and
thick film regions. Using simple trigonometry, this enabled the user to calculate both the
inlet and outlet film thicknesses hi and ho respectively. A graph of load versus the
difference between the inlet and outlet film thickness, is shown in Figure 4.23;
Figure 4.23 The effect of static loading upon the attitude of the pad
A series of measurements were taken whilst loading up to 90 N. As is rather telling from
the above figure, the initial convergence was not maintained and the continual variation
of the effective convergence of the perceived test pad specimen is significant. The original
confines of the research were inclined to set the initial convergence angle, and assume it
to be maintained throughout the entirety of the test. Based upon the outcome of the
θ ~ 0.229°
θ ~ 0.029°
Aswad Shiraz Manzoor Chapter 4 – Experimental Method
124
above trial, this was concluded not to be the case, and amendments were made
accordingly;
Initially, the original loading stipulations were such that the test pad specimen was
envisaged to be loaded up to 100 N in 10 N increments. This was changed to a maximum
of 20 N; with three loading steps of 5, 10 and 20 N. The vertical z-Stage used to displace
the load arm was turned until the desired load was achieved (as shown on screen by
LabVIEW)
Secondly, the convergence of the pad specimen was calculated during the actual test
procedure. It was clear that the initial inclination of the test pad is not maintained as the
load is changed, most likely as a result of elastic displacements of the suspension system.
However, since the film thickness was measured at several locations within the bearing
primarily for other reasons (see Chapter 5), the actual inclination (and the consequent
convergence ratio) was determined explicitly for each experimental condition examined.
4.3.3 Disc Speed
As mentioned, the disc speed was controlled by adjustment of the request voltage within
LabVIEW. The required speed would typically be attained after a few seconds, due to the
type of feedback employed. The two disc speeds used in this current work are 0.5 and
1.0 metres per second.
Aswad Shiraz Manzoor Chapter 4 – Experimental Method
125
4.4 The Test Procedure
A brief description of the actual test procedure used is now presented. Prior to testing,
calibrations of load, friction and L.I.F. sub-systems were all carried out. As described
previously, a series of masses (gradually increasing in total mass) were placed in a
specialized pad carrier located at the end of the load arm. The relationship constants were
then substituted into LabVIEW. This process was repeated for the friction calibration, a
technique of hanging a small series of known masses from the end of the load arm to
precisely determine the relationship between the distance moved by the load arm and the
equivalent friction. Again, constants in LabVIEW were adjusted to suit. Calibrations of the
three systems were carried out prior to the start of testing.
For consistency, the camera and light source were switched on for a period of no less
than thirty minutes before the start of any testing. This fulfilled two important criteria;
the camera reaching its peak performance operating temperature by cooling the CCD
sensor below ambient (stated as -25 degrees Celsius) and that the Mercury-Xenon lamp
used in the light source had adequately reached its optimum steady light output.
As well as the above criteria, the cleaning of the test samples and pad specimens were also
carried out. Normal procedure to ensure a satisfactory cleanliness was achieved by rinsing
the sample in toluene first, and then in acetone to ensure effective removal of any solvent
residue. The sample is then left to dry naturally. This entire process was performed upon
the glass disc, the calibration wedge sample and the test pad specimen itself.
Aswad Shiraz Manzoor Chapter 4 – Experimental Method
126
The L.I.F. calibration wedge piece was placed in the load arm gimbal, and both
adjustment grub screws were set in the fully open positions, enabling maximum
uninhibited movement of the pad with regards to its convergence angle, so that once
loaded up against the glass disc, the calibration piece would find its natural convergence
angle (always a constant), as determined by the position and height of the cover slip
(described in detail in Section 4.2). After application of a drop of oil/dye mixture onto
the centre of calibration wedge, the load arm was loaded up towards the bottom of the
glass disc to approximately 2 N, a load not likely to unnecessarily cause any elastic
deformation of either the glass disc, the edge of the silicon pad or the thin glass cover slip.
A series of images were taken in accordance with the calibration procedure described in
detail in the previous chapter.
Following a successful calibration, the calibration wedge piece was replaced with the test
pad specimen to be used (either plain or textured). The convergence adjustment grub
screws were consequently tightened to exhibit a small degree of convergence on the test
pad specimen (this was initially set by eye, and then later adjusted if necessary by placing
a few drops of the oil/dye mixture on to the test pad, loading to low loads and shining a
hand-held U.V. light source over the glass disc on to the contact film).
To ensure a thorough circulation of the oil/dye mixture, the oil pump motor was left to
run for approximately ten minutes at a predetermined speed, after which the oil pump
cooling fans were switched on. This had two consequences; to minimise any 'settling'
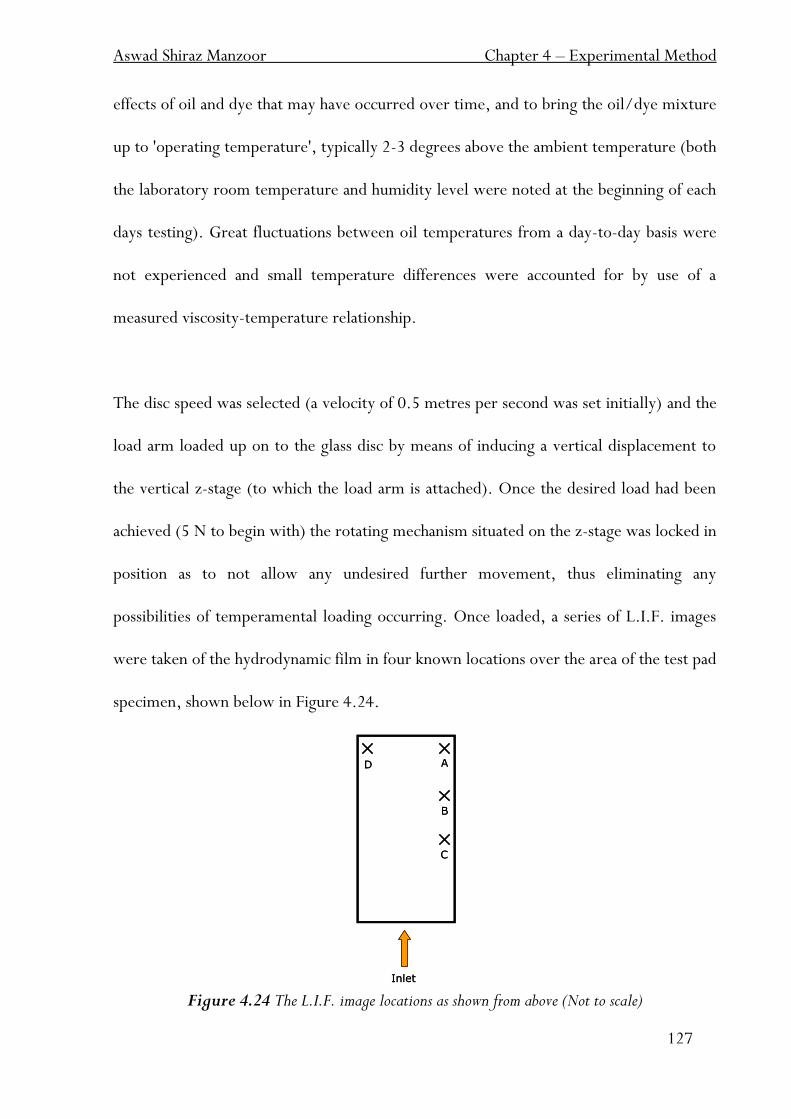
Aswad Shiraz Manzoor Chapter 4 – Experimental Method
127
effects of oil and dye that may have occurred over time, and to bring the oil/dye mixture
up to 'operating temperature', typically 2-3 degrees above the ambient temperature (both
the laboratory room temperature and humidity level were noted at the beginning of each
days testing). Great fluctuations between oil temperatures from a day-to-day basis were
not experienced and small temperature differences were accounted for by use of a
measured viscosity-temperature relationship.
The disc speed was selected (a velocity of 0.5 metres per second was set initially) and the
load arm loaded up on to the glass disc by means of inducing a vertical displacement to
the vertical z-stage (to which the load arm is attached). Once the desired load had been
achieved (5 N to begin with) the rotating mechanism situated on the z-stage was locked in
position as to not allow any undesired further movement, thus eliminating any
possibilities of temperamental loading occurring. Once loaded, a series of L.I.F. images
were taken of the hydrodynamic film in four known locations over the area of the test pad
specimen, shown below in Figure 4.24.
Figure 4.24 The L.I.F. image locations as shown from above (Not to scale)
A
B
C
D
Inlet
A
B
C
D
Inlet
Aswad Shiraz Manzoor Chapter 4 – Experimental Method
128
Positions A, B and C are situated on the right hand side of the pad 0.8 mm from the edge
of the pad, whilst position D is situated 0.8 mm from the left hand edge, as depicted by
the plan view in Figure 4.24 above. The two points A and D were chosen to be 1.0 mm
from the top edge of the pad (i.e. the outlet of the pad). The distance between positions
A and B and between B and C were known during testing by noting the position of the
micrometer vernier attached to the L.I.F. camera platform stage. A sequence of twenty
images were taken at each location, each image being triggered by the position encoder as
discussed. The higher gain setting on the camera was used for when taking images at low
film thicknesses (typically at positions A and D) whilst the lower gain employed for the
larger film thicknesses (positions B and C).
Upon completion of the imaging, the friction present between the pad and spinning glass
disc was recorded for a ten second burst. A feature within LabVIEW allows real-time data
capture for specified periods of time. A ten second burst of data was recorded onto a
specified destination, during which time the temperature of the oil/dye mixture at the
nozzle end was noted, and embedded in the file name of the friction file. It was at this
stage that the entire hydrodynamic film (i.e. covering the whole pad area) was monitored
for any signs of cavitation present.
The load arm was then loaded to the next progressive step, 10 N in this case, and the
imaging and friction-monitoring procedure repeated. Once data for a final load of 20 N
had also been captured, the load arm was completely unloaded away from the bottom of

Aswad Shiraz Manzoor Chapter 4 – Experimental Method
129
the glass disc. The speed of the glass disc was increased to 1.0 metre per second, and the
loading procedure repeated allowing for image and friction capture.
Following completion of two disc speeds, both the glass disc motor and oil pump motor
were shut down for a brief period to allow for the convergence angle of the pad to be
altered. Normal testing procedure would typically begin with relatively high
convergences, which were progressively lowered throughout the days testing. At times, a
very low convergence would subsequently prove to be too low as upon loading of the test
pad up towards the spinning disc, the initial convergent angle on the pad would deviate to
a divergent angle. Support of any load would ultimately prove to be to great a burden
upon the film and triggered the collapse of said film. A number of repeats for various
convergence angles were conducted throughout any given day of testing. Whilst the
absolute convergence value would not be known until image analysis, if by chance two
similar convergences were set for any two or more tests, this was judged to be a good
indicator of the repeatability of the rig if applicable.
The entire test procedure was repeated for the four textured pad samples, both with the
pockets orientated towards the front of the pad inlet (A05, A07, C07 and C06) and
situated at the rear of the pad inlet (A05r, A07r, C07r and C06r).

Aswad Shiraz Manzoor Chapter 4 – Experimental Method
130
4.5 Summary
This chapter has not only described the techniques used to calibrate the three main sub-
systems employed on the rig, but also documented the developments of the method.
Most notably, the L.I.F. calibration has been reported. The possibilities of certain
reported factors affecting fluorescence intensity have been investigated and eliminated or
accounted for. The resultant novel technique to determine the film thickness (and
subsequently the convergence ratio) of a test pad specimen during testing, has also been
described. Finally, the four unique textured and one plain test pad specimens examined
within this study have been introduced and the manner in which they have been tested has
been presented.

Chapter 5
Hydrodynamic Test Rig Results
Aswad Shiraz Manzoor Chapter 5 – Hydrodynamic Test Rig Results
132
5.1 Introduction
Corresponding film thickness and friction data for all eight textured configurations and
one plain pad sample is presented in this chapter. The results are graphically depicted
together with data obtained from analysing a plain pad arrangement theoretically, an
approach that utilises Reynolds equations. Alongside this, the percentage difference in
friction between the theoretically derived plain pad analysis and the experimentally
derived data is shown. The relationship between the theoretically derived load support
(W*) versus convergence (K) for all test pad cases is also introduced, where W* is defined
from [1];
WLBU
hW o
2
2
*
6
And K as;
o
oi
h
hhK
Finally, theoretical ho versus experimental ho values are compared.
5.2 Variation of Minimum Film Thickness, ho
Prior to the start of the main programme of testing, a plain pad specimen loaded up
towards the spinning glass test was set-up. This test incorporated all of the previous
criteria with regards to both calibration and procedure; however, the only fundamental
difference was the number and location of fluorescence images taken. Consider the plain
pad case depicted in Figure 5.1;
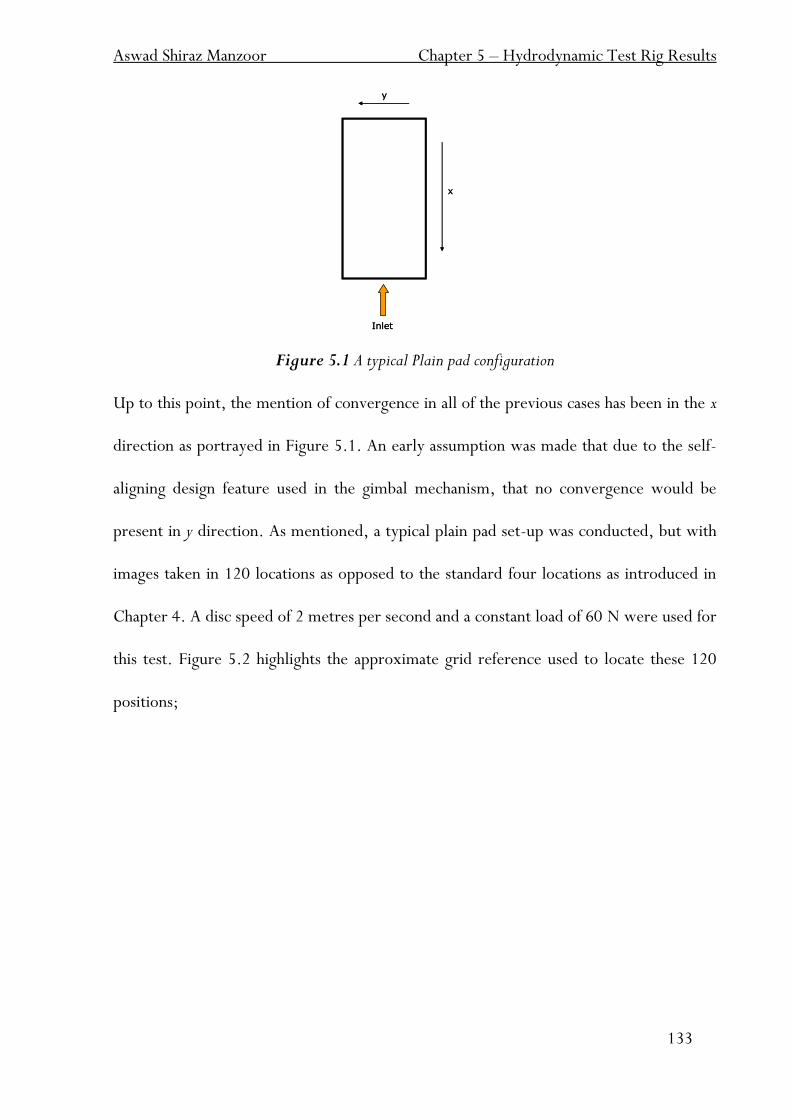
Aswad Shiraz Manzoor Chapter 5 – Hydrodynamic Test Rig Results
133
Figure 5.1 A typical Plain pad configuration
Up to this point, the mention of convergence in all of the previous cases has been in the x
direction as portrayed in Figure 5.1. An early assumption was made that due to the self-
aligning design feature used in the gimbal mechanism, that no convergence would be
present in y direction. As mentioned, a typical plain pad set-up was conducted, but with
images taken in 120 locations as opposed to the standard four locations as introduced in
Chapter 4. A disc speed of 2 metres per second and a constant load of 60 N were used for
this test. Figure 5.2 highlights the approximate grid reference used to locate these 120
positions;
Inlet
x
y
Inlet
x
y
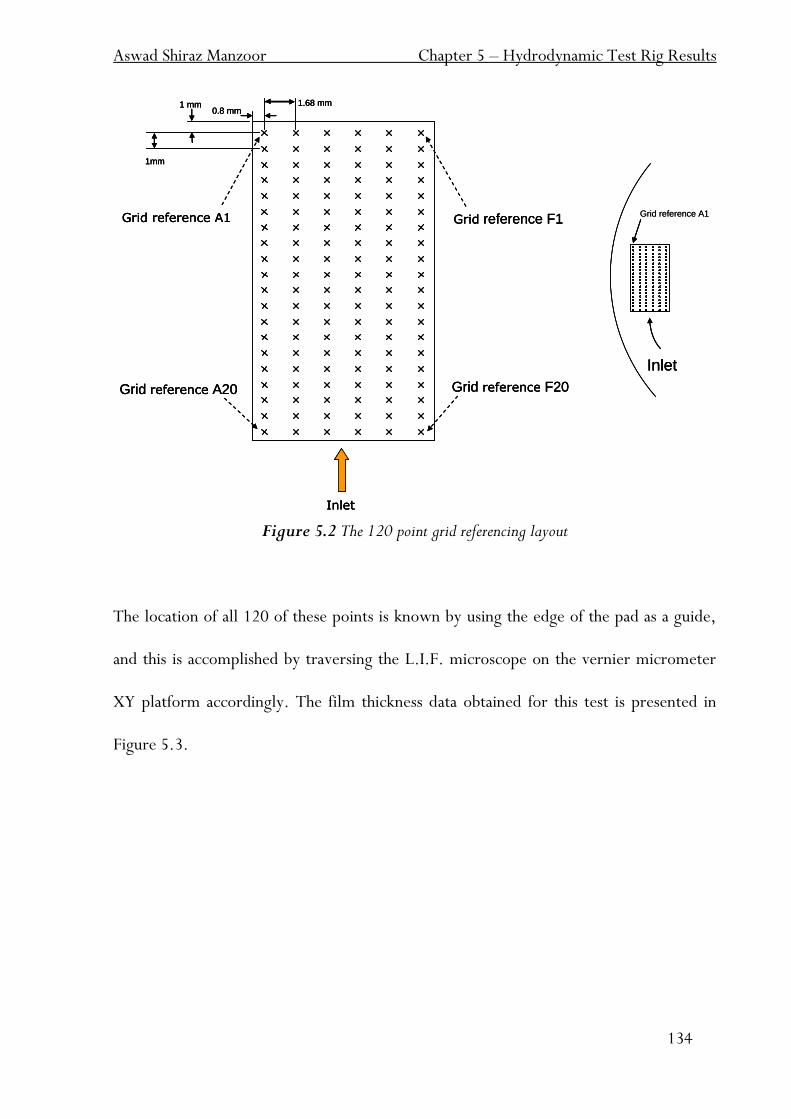
Aswad Shiraz Manzoor Chapter 5 – Hydrodynamic Test Rig Results
134
Figure 5.2 The 120 point grid referencing layout
The location of all 120 of these points is known by using the edge of the pad as a guide,
and this is accomplished by traversing the L.I.F. microscope on the vernier micrometer
XY platform accordingly. The film thickness data obtained for this test is presented in
Figure 5.3.
Grid reference A1
1 mm
1mm
0.8 mm1.68 mm
Grid reference A1
Grid reference A20
Grid reference F1
Grid reference F20
Inlet
Inlet
Grid reference A1
1 mm
1mm
0.8 mm1.68 mm
Grid reference A1
Grid reference A20
Grid reference F1
Grid reference F20
Inlet
Inlet
1 mm
1mm
0.8 mm1.68 mm
Grid reference A1
Grid reference A20
Grid reference F1
Grid reference F20
Inlet
Inlet
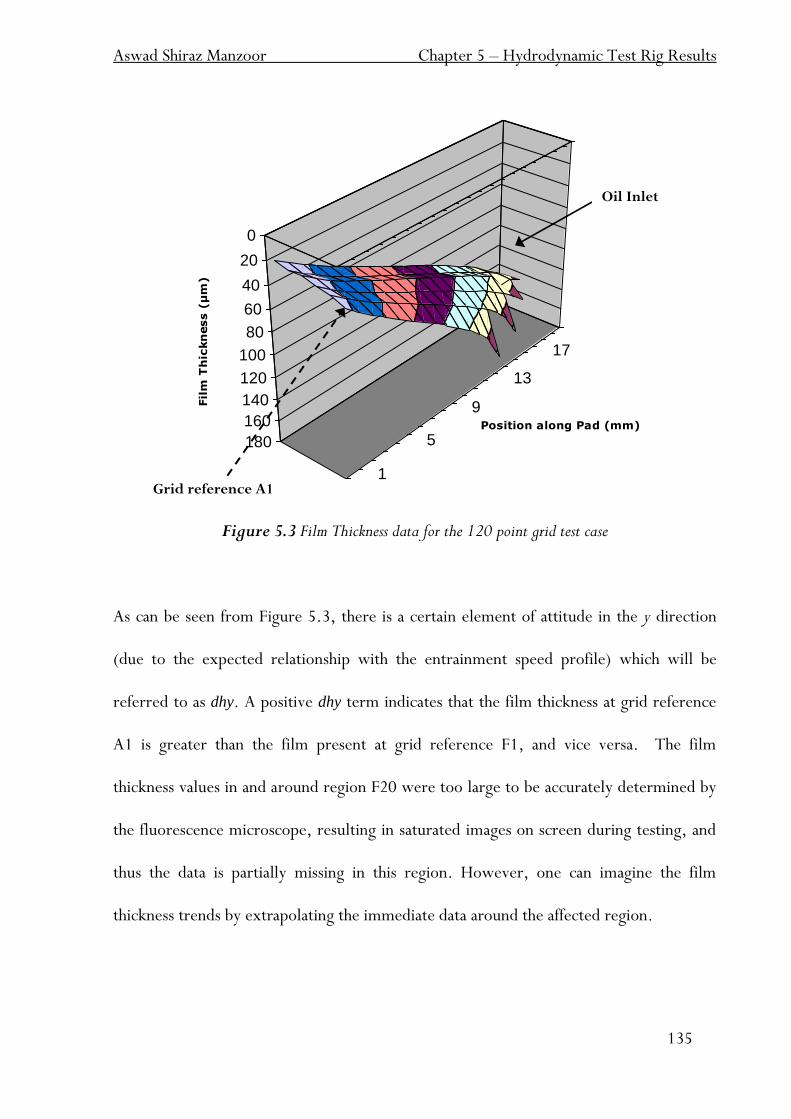
Aswad Shiraz Manzoor Chapter 5 – Hydrodynamic Test Rig Results
135
Figure 5.3 Film Thickness data for the 120 point grid test case
As can be seen from Figure 5.3, there is a certain element of attitude in the y direction
(due to the expected relationship with the entrainment speed profile) which will be
referred to as dhy. A positive dhy term indicates that the film thickness at grid reference
A1 is greater than the film present at grid reference F1, and vice versa. The film
thickness values in and around region F20 were too large to be accurately determined by
the fluorescence microscope, resulting in saturated images on screen during testing, and
thus the data is partially missing in this region. However, one can imagine the film
thickness trends by extrapolating the immediate data around the affected region.
1
5
9
13
17
0
20
40
60
80
100
120
140
160
180
Fil
m T
hic
kn
ess (
µm
)
Position along Pad (mm)
Oil Inlet
Grid reference A1
Aswad Shiraz Manzoor Chapter 5 – Hydrodynamic Test Rig Results
136
During experimental testing, fluorescent images were taken at two locations near the
rear (outlet) of the pad. Consider the pad configuration as given in Figure 5.2; an image
was taken at grid reference A1. This film thickness shall be labelled as hoL. A second
image was taken at grid reference F1, which shall be referred to as hoR. The average value
of these two values would theoretically provide the film thickness at the central point
along the length of the test pad. This film thickness shall be nominated hoCtr and is the
primary reading used to give the minimum film thickness, ho in the following section.
5.3 Minimum film thickness and Friction versus Load for all
Convergences
The graphs presented within this section depict the relationships between the minimum
film thickness at the outlet (ho) versus the applied load and the actual friction readings
versus applied load for all experimental pad configurations (i.e. pad convergence, load
and speed accounted for).
A comparison of all the plain pad experimental data against the theoretical plain pad
model (as given by two-dimensional Reynolds) is presented in Figure 5.4. Both minimum
film thickness and friction obtained during testing are plotted against the actual load, for
all convergences.
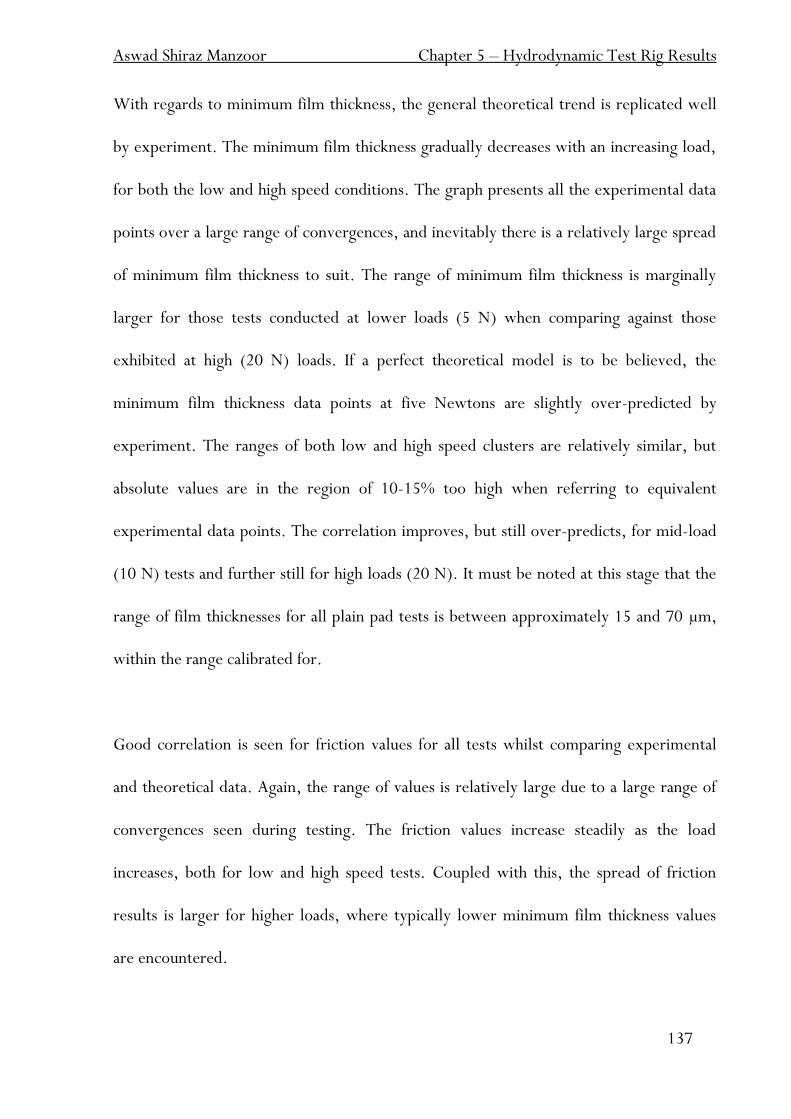
Aswad Shiraz Manzoor Chapter 5 – Hydrodynamic Test Rig Results
137
With regards to minimum film thickness, the general theoretical trend is replicated well
by experiment. The minimum film thickness gradually decreases with an increasing load,
for both the low and high speed conditions. The graph presents all the experimental data
points over a large range of convergences, and inevitably there is a relatively large spread
of minimum film thickness to suit. The range of minimum film thickness is marginally
larger for those tests conducted at lower loads (5 N) when comparing against those
exhibited at high (20 N) loads. If a perfect theoretical model is to be believed, the
minimum film thickness data points at five Newtons are slightly over-predicted by
experiment. The ranges of both low and high speed clusters are relatively similar, but
absolute values are in the region of 10-15% too high when referring to equivalent
experimental data points. The correlation improves, but still over-predicts, for mid-load
(10 N) tests and further still for high loads (20 N). It must be noted at this stage that the
range of film thicknesses for all plain pad tests is between approximately 15 and 70 µm,
within the range calibrated for.
Good correlation is seen for friction values for all tests whilst comparing experimental
and theoretical data. Again, the range of values is relatively large due to a large range of
convergences seen during testing. The friction values increase steadily as the load
increases, both for low and high speed tests. Coupled with this, the spread of friction
results is larger for higher loads, where typically lower minimum film thickness values
are encountered.
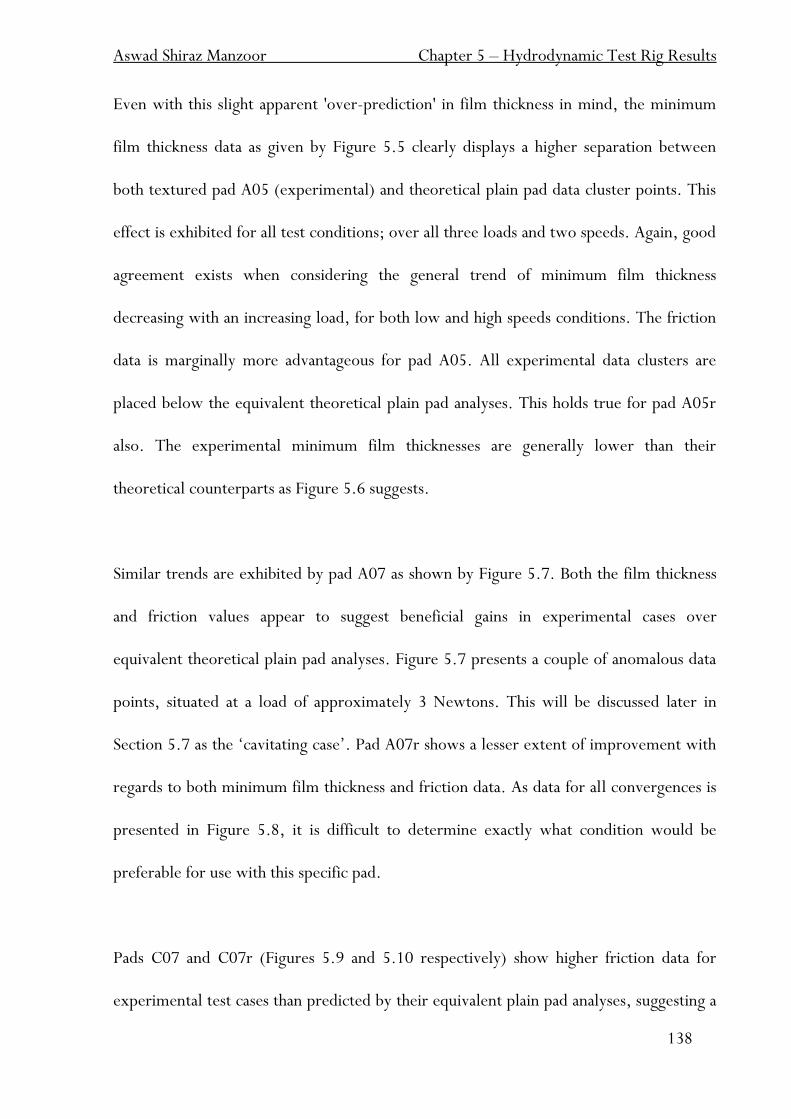
Aswad Shiraz Manzoor Chapter 5 – Hydrodynamic Test Rig Results
138
Even with this slight apparent 'over-prediction' in film thickness in mind, the minimum
film thickness data as given by Figure 5.5 clearly displays a higher separation between
both textured pad A05 (experimental) and theoretical plain pad data cluster points. This
effect is exhibited for all test conditions; over all three loads and two speeds. Again, good
agreement exists when considering the general trend of minimum film thickness
decreasing with an increasing load, for both low and high speeds conditions. The friction
data is marginally more advantageous for pad A05. All experimental data clusters are
placed below the equivalent theoretical plain pad analyses. This holds true for pad A05r
also. The experimental minimum film thicknesses are generally lower than their
theoretical counterparts as Figure 5.6 suggests.
Similar trends are exhibited by pad A07 as shown by Figure 5.7. Both the film thickness
and friction values appear to suggest beneficial gains in experimental cases over
equivalent theoretical plain pad analyses. Figure 5.7 presents a couple of anomalous data
points, situated at a load of approximately 3 Newtons. This will be discussed later in
Section 5.7 as the „cavitating case‟. Pad A07r shows a lesser extent of improvement with
regards to both minimum film thickness and friction data. As data for all convergences is
presented in Figure 5.8, it is difficult to determine exactly what condition would be
preferable for use with this specific pad.
Pads C07 and C07r (Figures 5.9 and 5.10 respectively) show higher friction data for
experimental test cases than predicted by their equivalent plain pad analyses, suggesting a
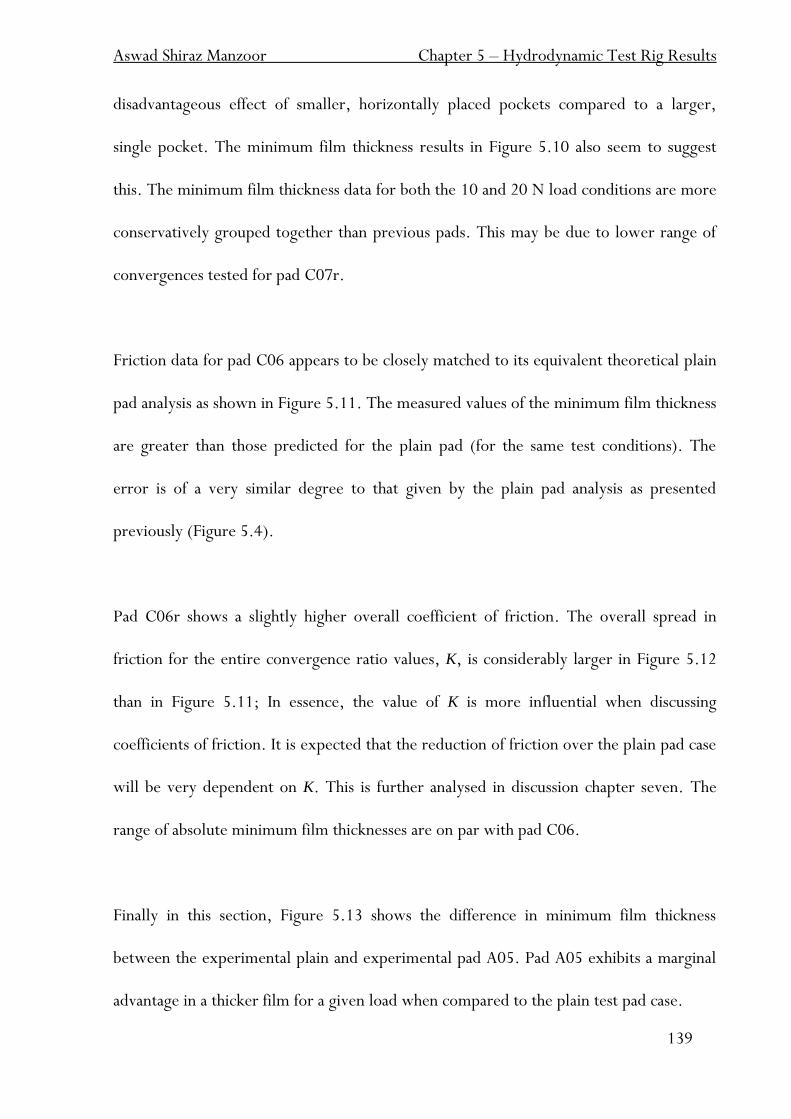
Aswad Shiraz Manzoor Chapter 5 – Hydrodynamic Test Rig Results
139
disadvantageous effect of smaller, horizontally placed pockets compared to a larger,
single pocket. The minimum film thickness results in Figure 5.10 also seem to suggest
this. The minimum film thickness data for both the 10 and 20 N load conditions are more
conservatively grouped together than previous pads. This may be due to lower range of
convergences tested for pad C07r.
Friction data for pad C06 appears to be closely matched to its equivalent theoretical plain
pad analysis as shown in Figure 5.11. The measured values of the minimum film thickness
are greater than those predicted for the plain pad (for the same test conditions). The
error is of a very similar degree to that given by the plain pad analysis as presented
previously (Figure 5.4).
Pad C06r shows a slightly higher overall coefficient of friction. The overall spread in
friction for the entire convergence ratio values, K, is considerably larger in Figure 5.12
than in Figure 5.11; In essence, the value of K is more influential when discussing
coefficients of friction. It is expected that the reduction of friction over the plain pad case
will be very dependent on K. This is further analysed in discussion chapter seven. The
range of absolute minimum film thicknesses are on par with pad C06.
Finally in this section, Figure 5.13 shows the difference in minimum film thickness
between the experimental plain and experimental pad A05. Pad A05 exhibits a marginal
advantage in a thicker film for a given load when compared to the plain test pad case.
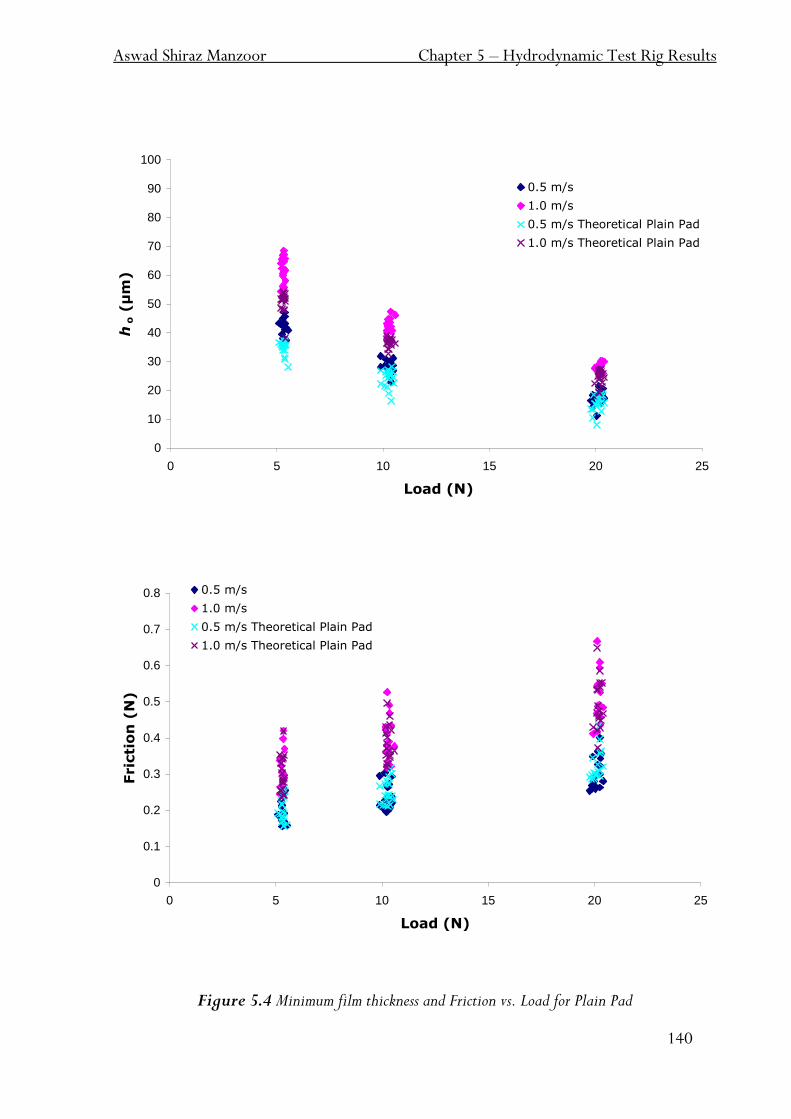
Aswad Shiraz Manzoor Chapter 5 – Hydrodynamic Test Rig Results
140
0
10
20
30
40
50
60
70
80
90
100
0 5 10 15 20 25
Load (N)
ho (
µm
)
0.5 m/s
1.0 m/s
0.5 m/s Theoretical Plain Pad
1.0 m/s Theoretical Plain Pad
0
0.1
0.2
0.3
0.4
0.5
0.6
0.7
0.8
0 5 10 15 20 25
Load (N)
Fric
tio
n (
N)
0.5 m/s
1.0 m/s
0.5 m/s Theoretical Plain Pad
1.0 m/s Theoretical Plain Pad
Figure 5.4 Minimum film thickness and Friction vs. Load for Plain Pad
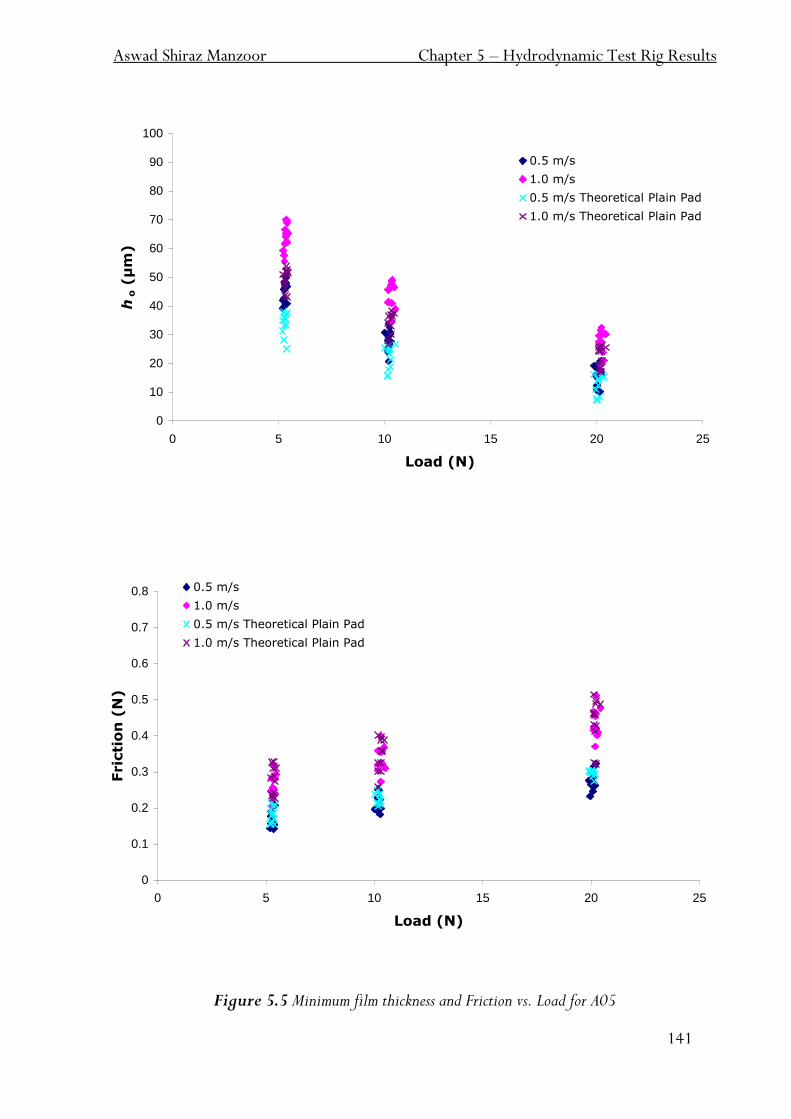
Aswad Shiraz Manzoor Chapter 5 – Hydrodynamic Test Rig Results
141
0
10
20
30
40
50
60
70
80
90
100
0 5 10 15 20 25
Load (N)
ho (
µm
)
0.5 m/s
1.0 m/s
0.5 m/s Theoretical Plain Pad
1.0 m/s Theoretical Plain Pad
0
0.1
0.2
0.3
0.4
0.5
0.6
0.7
0.8
0 5 10 15 20 25
Load (N)
Fric
tio
n (
N)
0.5 m/s
1.0 m/s
0.5 m/s Theoretical Plain Pad
1.0 m/s Theoretical Plain Pad
Figure 5.5 Minimum film thickness and Friction vs. Load for A05

Aswad Shiraz Manzoor Chapter 5 – Hydrodynamic Test Rig Results
142
0
10
20
30
40
50
60
70
80
90
100
0 5 10 15 20 25
Load (N)
ho (
µm
)
0.5 m/s
1.0 m/s
0.5 m/s Theoretical Plain Pad
1.0 m/s Theoretical Plain Pad
0
0.1
0.2
0.3
0.4
0.5
0.6
0.7
0.8
0 5 10 15 20 25
Load (N)
Fric
tio
n (
N)
0.5 m/s
1.0 m/s
0.5 m/s Theoretical Plain Pad
1.0 m/s Theoretical Plain Pad
Figure 5.6 Minimum film thickness and Friction vs. Load for A05r
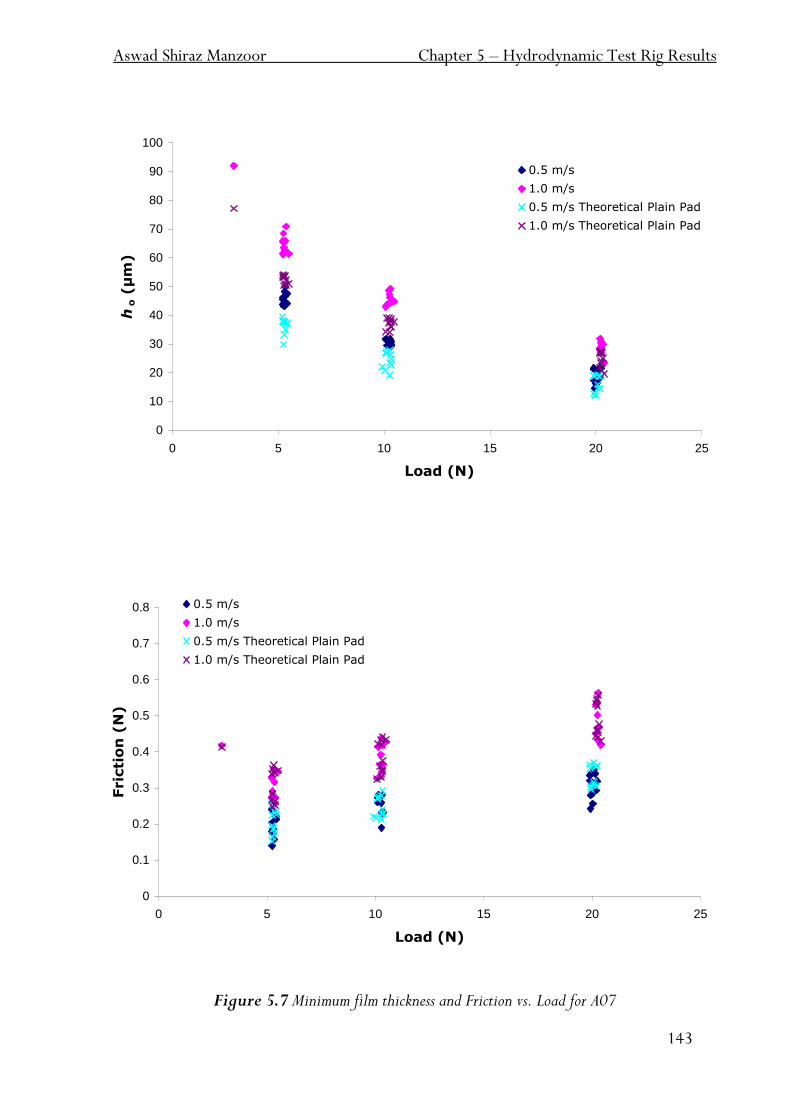
Aswad Shiraz Manzoor Chapter 5 – Hydrodynamic Test Rig Results
143
0
10
20
30
40
50
60
70
80
90
100
0 5 10 15 20 25
Load (N)
ho (
µm
)
0.5 m/s
1.0 m/s
0.5 m/s Theoretical Plain Pad
1.0 m/s Theoretical Plain Pad
0
0.1
0.2
0.3
0.4
0.5
0.6
0.7
0.8
0 5 10 15 20 25
Load (N)
Fric
tio
n (
N)
0.5 m/s
1.0 m/s
0.5 m/s Theoretical Plain Pad
1.0 m/s Theoretical Plain Pad
Figure 5.7 Minimum film thickness and Friction vs. Load for A07
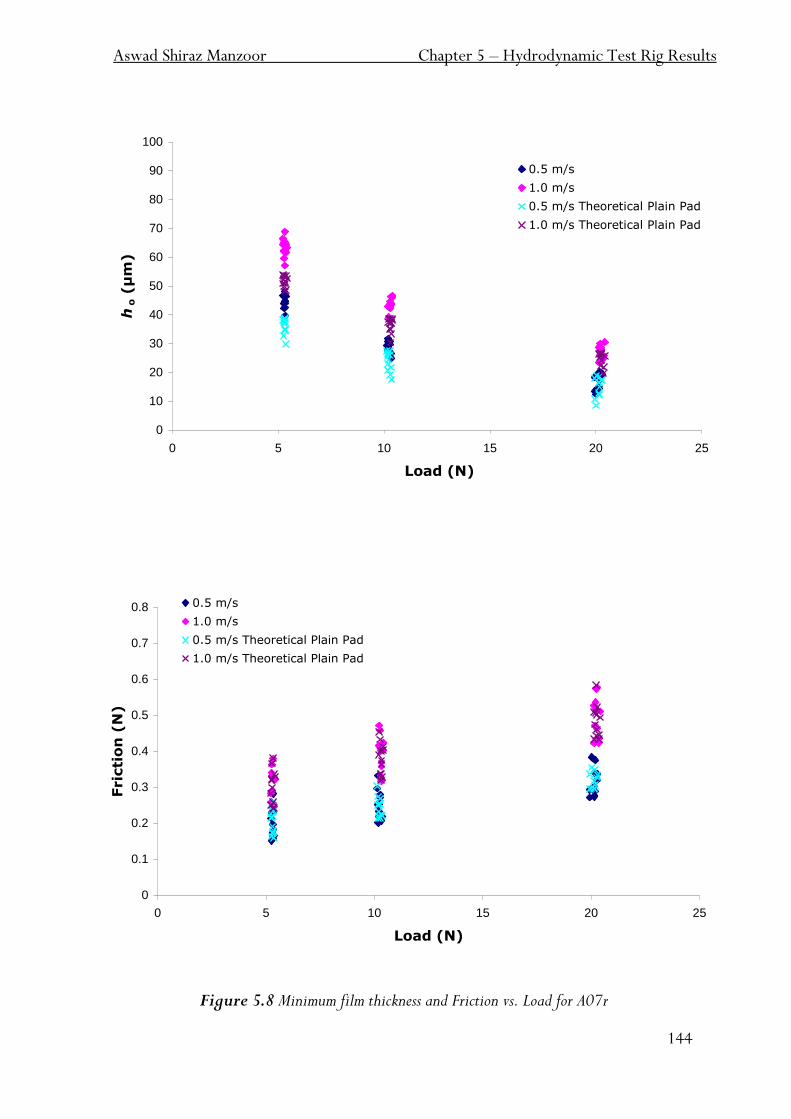
Aswad Shiraz Manzoor Chapter 5 – Hydrodynamic Test Rig Results
144
0
10
20
30
40
50
60
70
80
90
100
0 5 10 15 20 25
Load (N)
ho (
µm
)
0.5 m/s
1.0 m/s
0.5 m/s Theoretical Plain Pad
1.0 m/s Theoretical Plain Pad
0
0.1
0.2
0.3
0.4
0.5
0.6
0.7
0.8
0 5 10 15 20 25
Load (N)
Fric
tio
n (
N)
0.5 m/s
1.0 m/s
0.5 m/s Theoretical Plain Pad
1.0 m/s Theoretical Plain Pad
Figure 5.8 Minimum film thickness and Friction vs. Load for A07r
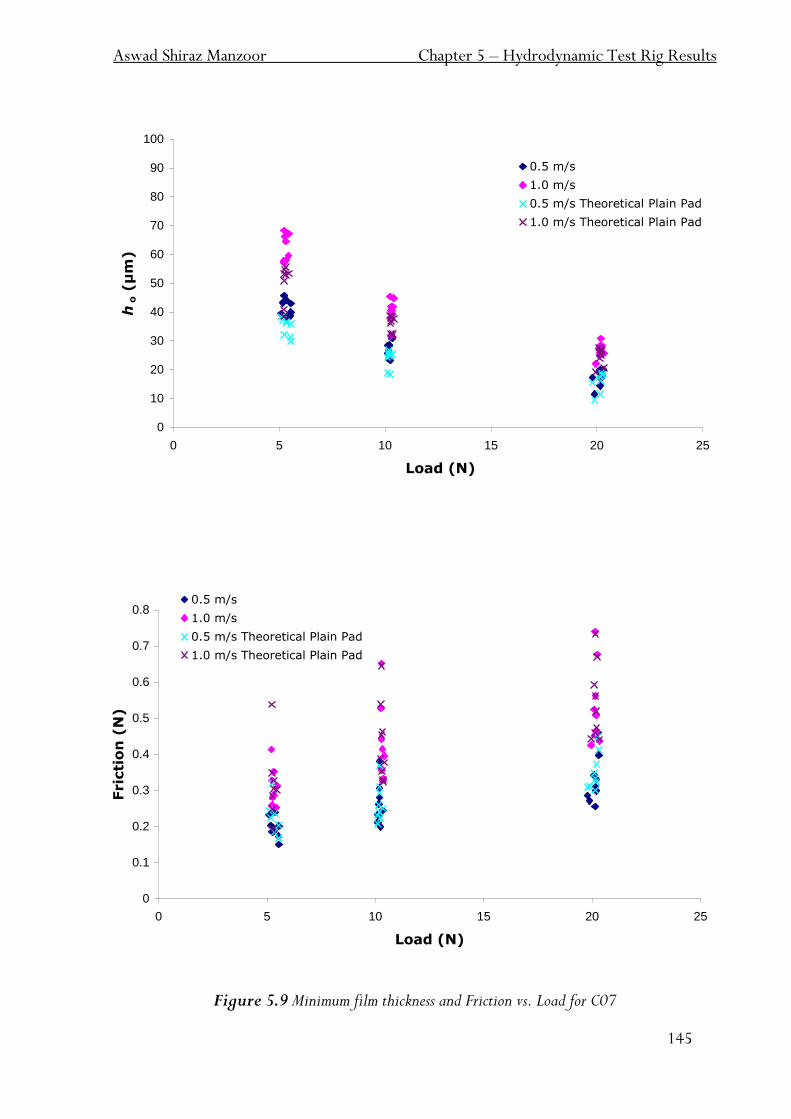
Aswad Shiraz Manzoor Chapter 5 – Hydrodynamic Test Rig Results
145
0
10
20
30
40
50
60
70
80
90
100
0 5 10 15 20 25
Load (N)
ho (
µm
)
0.5 m/s
1.0 m/s
0.5 m/s Theoretical Plain Pad
1.0 m/s Theoretical Plain Pad
0
0.1
0.2
0.3
0.4
0.5
0.6
0.7
0.8
0 5 10 15 20 25
Load (N)
Fric
tio
n (
N)
0.5 m/s
1.0 m/s
0.5 m/s Theoretical Plain Pad
1.0 m/s Theoretical Plain Pad
Figure 5.9 Minimum film thickness and Friction vs. Load for C07
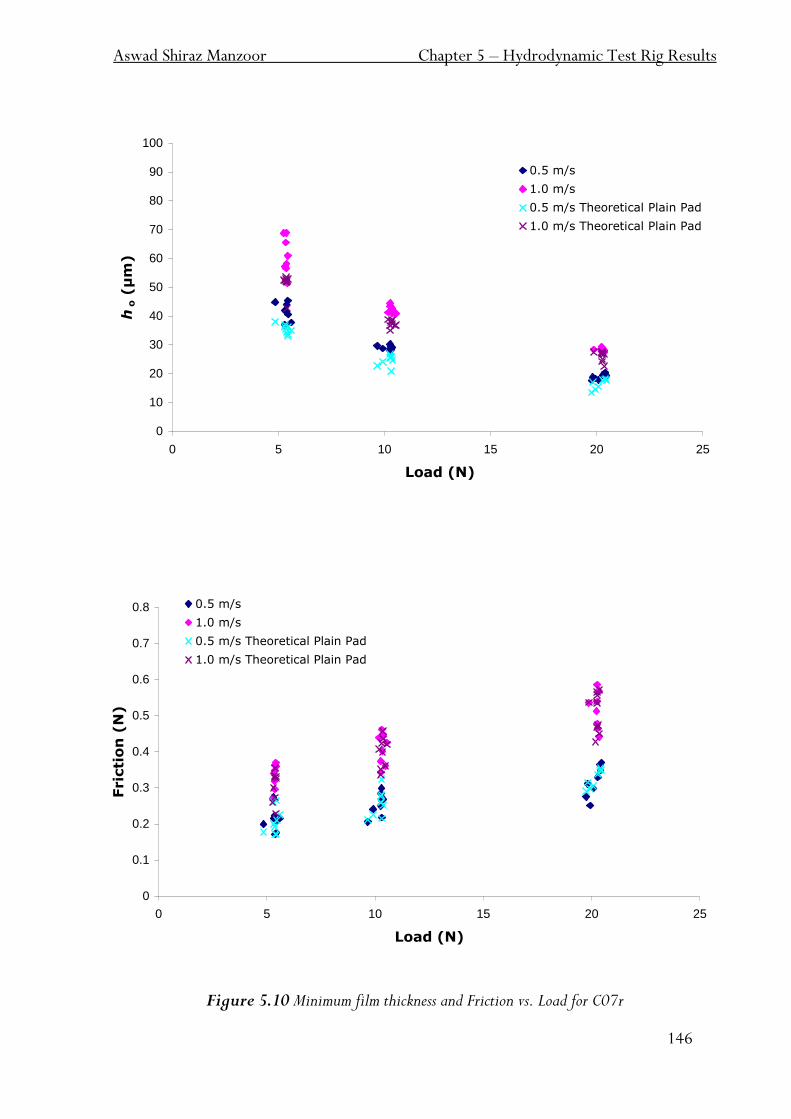
Aswad Shiraz Manzoor Chapter 5 – Hydrodynamic Test Rig Results
146
0
10
20
30
40
50
60
70
80
90
100
0 5 10 15 20 25
Load (N)
ho (
µm
)
0.5 m/s
1.0 m/s
0.5 m/s Theoretical Plain Pad
1.0 m/s Theoretical Plain Pad
0
0.1
0.2
0.3
0.4
0.5
0.6
0.7
0.8
0 5 10 15 20 25
Load (N)
Fric
tio
n (
N)
0.5 m/s
1.0 m/s
0.5 m/s Theoretical Plain Pad
1.0 m/s Theoretical Plain Pad
Figure 5.10 Minimum film thickness and Friction vs. Load for C07r
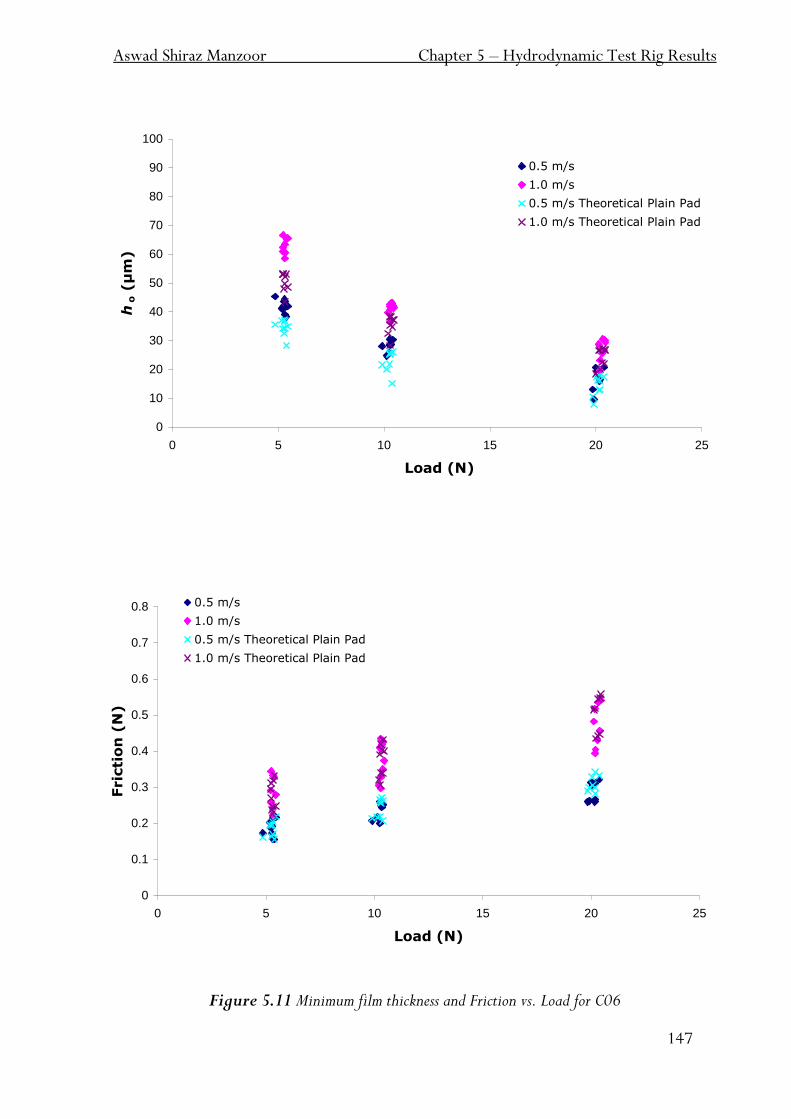
Aswad Shiraz Manzoor Chapter 5 – Hydrodynamic Test Rig Results
147
0
10
20
30
40
50
60
70
80
90
100
0 5 10 15 20 25
Load (N)
ho (
µm
)
0.5 m/s
1.0 m/s
0.5 m/s Theoretical Plain Pad
1.0 m/s Theoretical Plain Pad
0
0.1
0.2
0.3
0.4
0.5
0.6
0.7
0.8
0 5 10 15 20 25
Load (N)
Fric
tio
n (
N)
0.5 m/s
1.0 m/s
0.5 m/s Theoretical Plain Pad
1.0 m/s Theoretical Plain Pad
Figure 5.11 Minimum film thickness and Friction vs. Load for C06
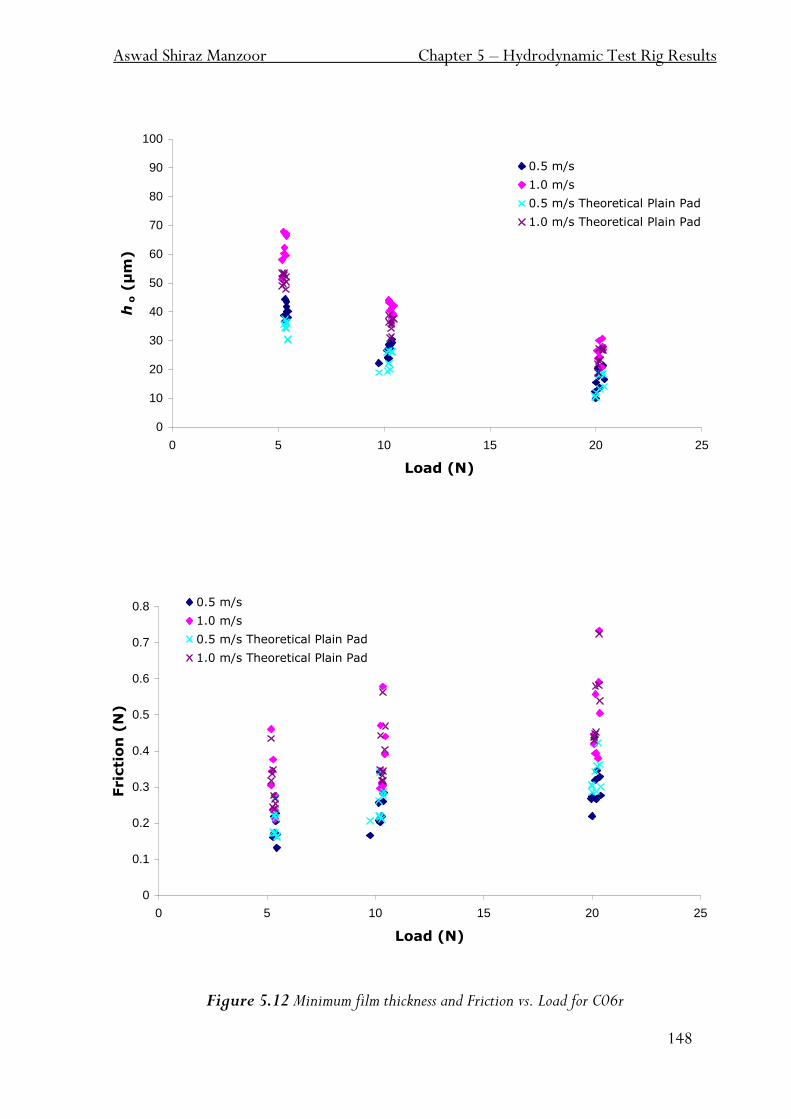
Aswad Shiraz Manzoor Chapter 5 – Hydrodynamic Test Rig Results
148
0
10
20
30
40
50
60
70
80
90
100
0 5 10 15 20 25
Load (N)
ho (
µm
)
0.5 m/s
1.0 m/s
0.5 m/s Theoretical Plain Pad
1.0 m/s Theoretical Plain Pad
0
0.1
0.2
0.3
0.4
0.5
0.6
0.7
0.8
0 5 10 15 20 25
Load (N)
Fric
tio
n (
N)
0.5 m/s
1.0 m/s
0.5 m/s Theoretical Plain Pad
1.0 m/s Theoretical Plain Pad
Figure 5.12 Minimum film thickness and Friction vs. Load for C06r
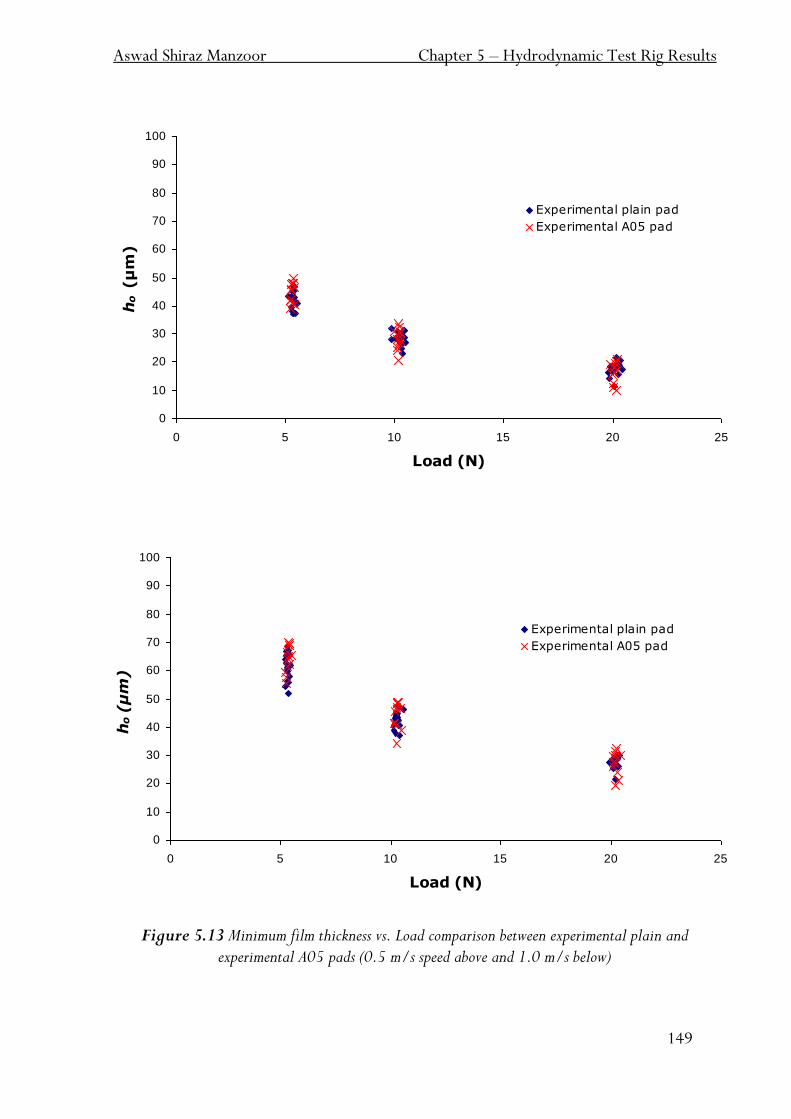
Aswad Shiraz Manzoor Chapter 5 – Hydrodynamic Test Rig Results
149
0
10
20
30
40
50
60
70
80
90
100
0 5 10 15 20 25
Load (N)
ho (µ
m)
Experimental plain pad
Experimental A05 pad
Figure 5.13 Minimum film thickness vs. Load comparison between experimental plain and
experimental A05 pads (0.5 m/s speed above and 1.0 m/s below)
0
10
20
30
40
50
60
70
80
90
100
0 5 10 15 20 25
Load (N)
ho (
µm
)
Experimental plain pad
Experimental A05 pad
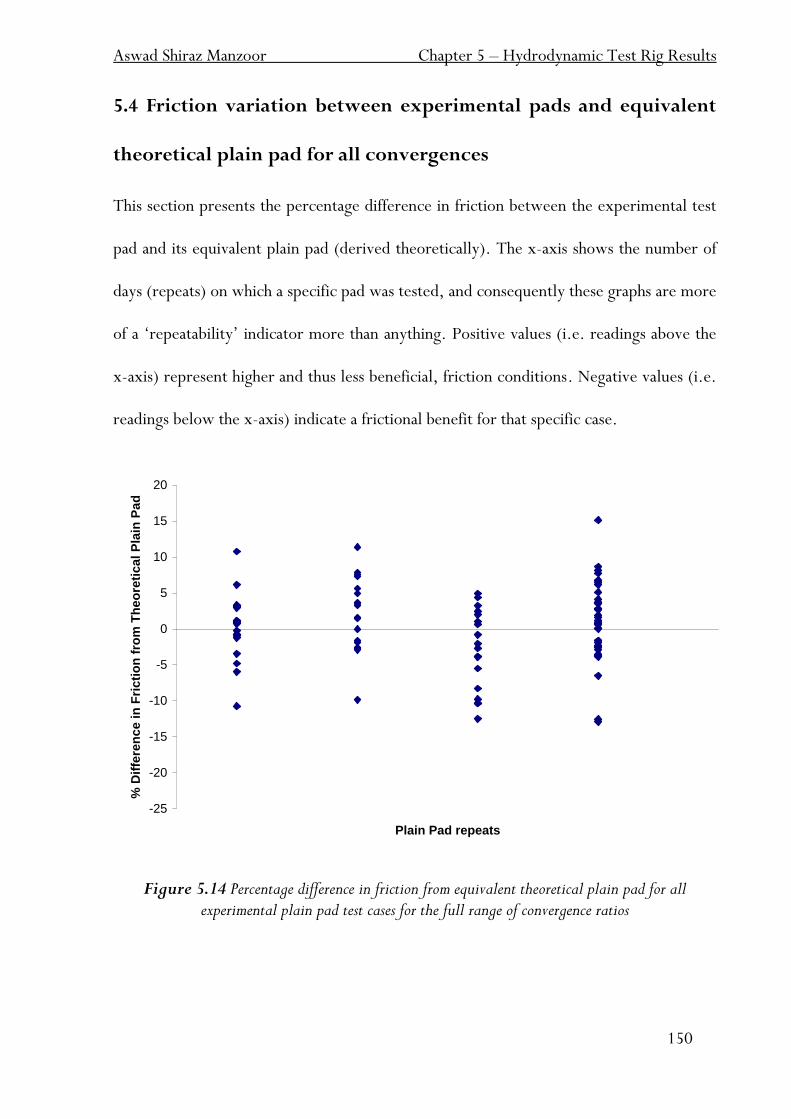
Aswad Shiraz Manzoor Chapter 5 – Hydrodynamic Test Rig Results
150
-25
-20
-15
-10
-5
0
5
10
15
20
Plain Pad repeats
% D
iffe
ren
ce in
Fri
cti
on
fro
m T
heo
reti
cal P
lain
Pa
d
5.4 Friction variation between experimental pads and equivalent
theoretical plain pad for all convergences
This section presents the percentage difference in friction between the experimental test
pad and its equivalent plain pad (derived theoretically). The x-axis shows the number of
days (repeats) on which a specific pad was tested, and consequently these graphs are more
of a „repeatability‟ indicator more than anything. Positive values (i.e. readings above the
x-axis) represent higher and thus less beneficial, friction conditions. Negative values (i.e.
readings below the x-axis) indicate a frictional benefit for that specific case.
Figure 5.14 Percentage difference in friction from equivalent theoretical plain pad for all experimental plain pad test cases for the full range of convergence ratios
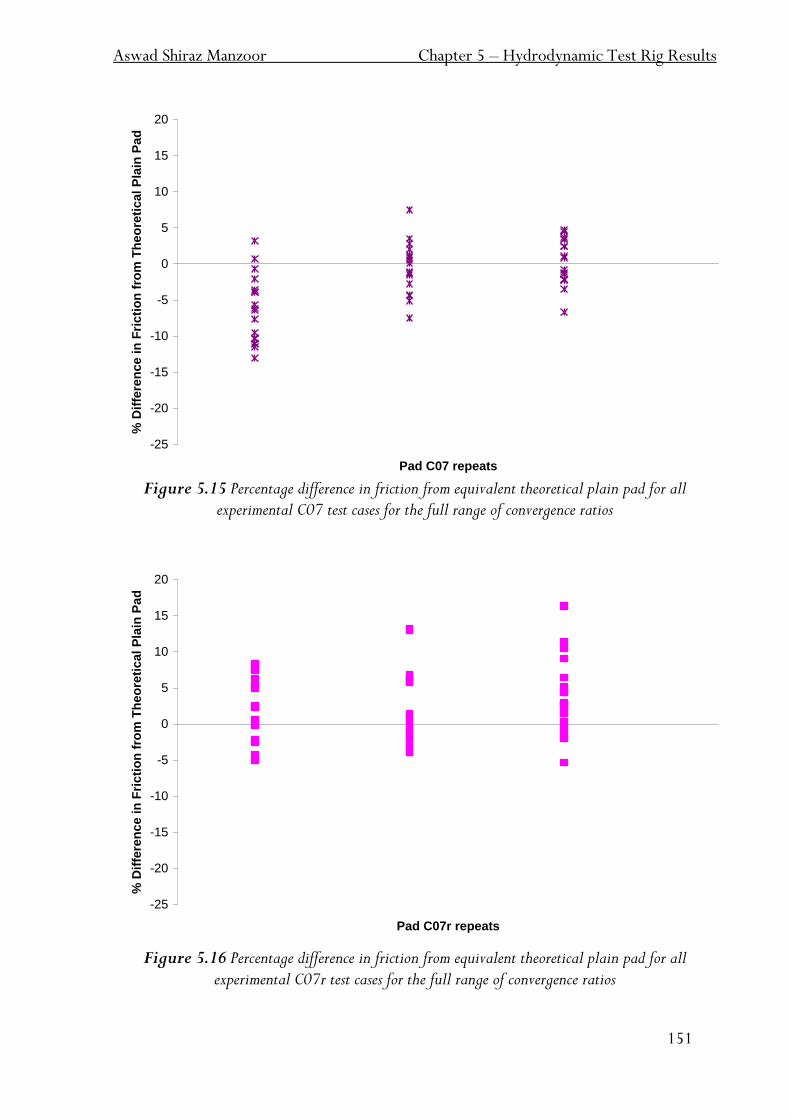
Aswad Shiraz Manzoor Chapter 5 – Hydrodynamic Test Rig Results
151
-25
-20
-15
-10
-5
0
5
10
15
20
Pad C07 repeats
% D
iffe
ren
ce in
Fri
cti
on
fro
m T
heo
reti
cal P
lain
Pa
d
-25
-20
-15
-10
-5
0
5
10
15
20
Pad C07r repeats
% D
iffe
ren
ce in
Fri
cti
on
fro
m T
heo
reti
cal P
lain
Pa
d
Figure 5.15 Percentage difference in friction from equivalent theoretical plain pad for all experimental C07 test cases for the full range of convergence ratios
Figure 5.16 Percentage difference in friction from equivalent theoretical plain pad for all experimental C07r test cases for the full range of convergence ratios
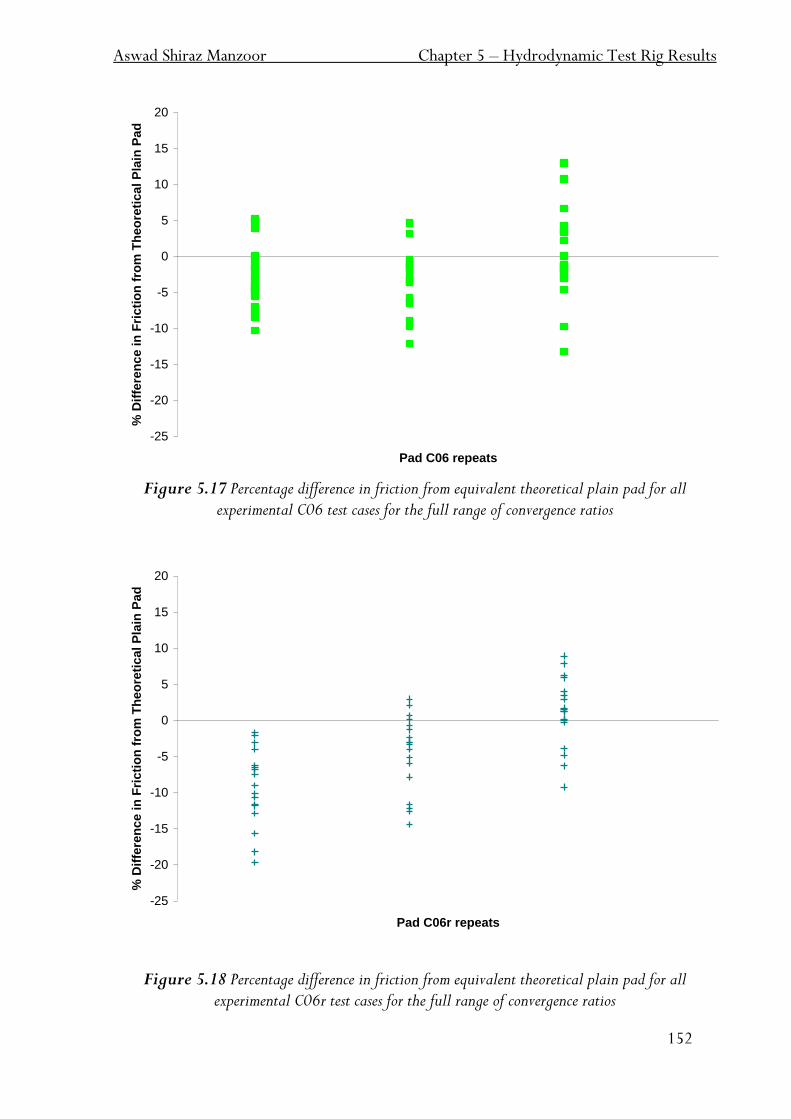
Aswad Shiraz Manzoor Chapter 5 – Hydrodynamic Test Rig Results
152
-25
-20
-15
-10
-5
0
5
10
15
20
Pad C06 repeats
% D
iffe
ren
ce in
Fri
cti
on
fro
m T
heo
reti
cal P
lain
Pa
d
-25
-20
-15
-10
-5
0
5
10
15
20
Pad C06r repeats
% D
iffe
ren
ce in
Fri
cti
on
fro
m T
heo
reti
cal P
lain
Pa
d
Figure 5.17 Percentage difference in friction from equivalent theoretical plain pad for all experimental C06 test cases for the full range of convergence ratios
Figure 5.18 Percentage difference in friction from equivalent theoretical plain pad for all
experimental C06r test cases for the full range of convergence ratios
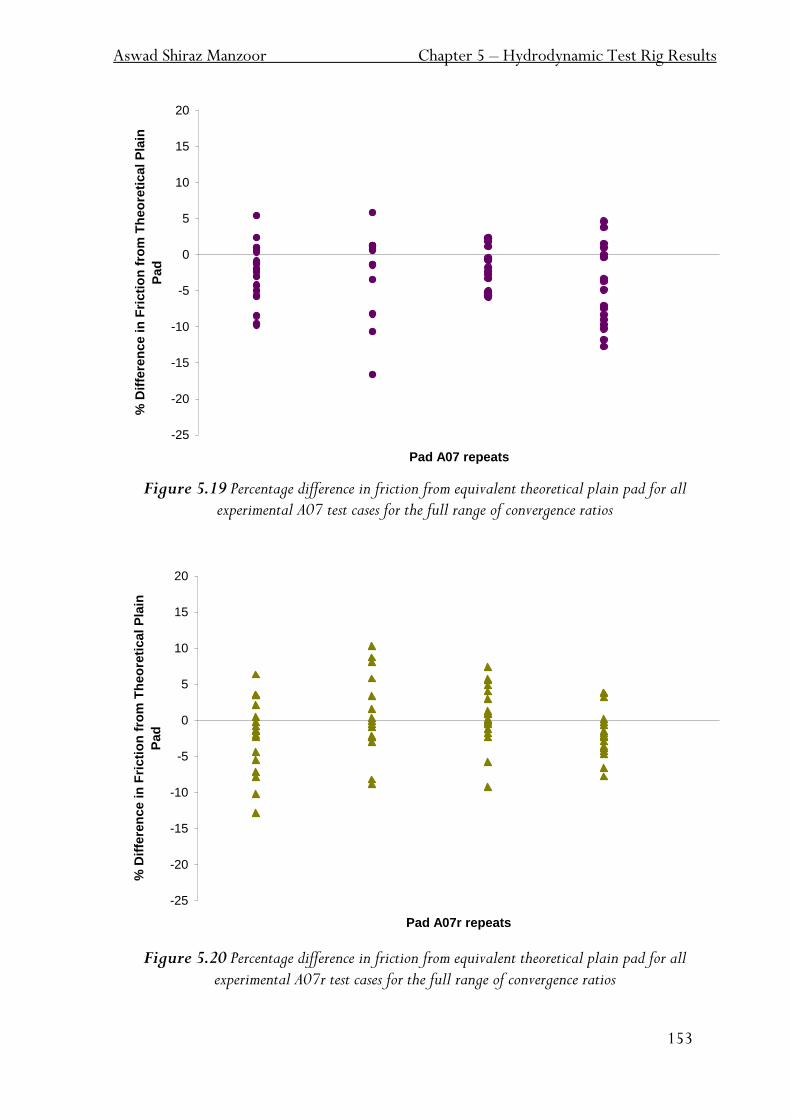
Aswad Shiraz Manzoor Chapter 5 – Hydrodynamic Test Rig Results
153
-25
-20
-15
-10
-5
0
5
10
15
20
Pad A07 repeats
% D
iffe
ren
ce
in
Fri
cti
on
fro
m T
he
ore
tic
al
Pla
in
Pa
d
-25
-20
-15
-10
-5
0
5
10
15
20
Pad A07r repeats
% D
iffe
ren
ce
in
Fri
cti
on
fro
m T
he
ore
tic
al
Pla
in
Pa
d
Figure 5.19 Percentage difference in friction from equivalent theoretical plain pad for all experimental A07 test cases for the full range of convergence ratios
Figure 5.20 Percentage difference in friction from equivalent theoretical plain pad for all experimental A07r test cases for the full range of convergence ratios
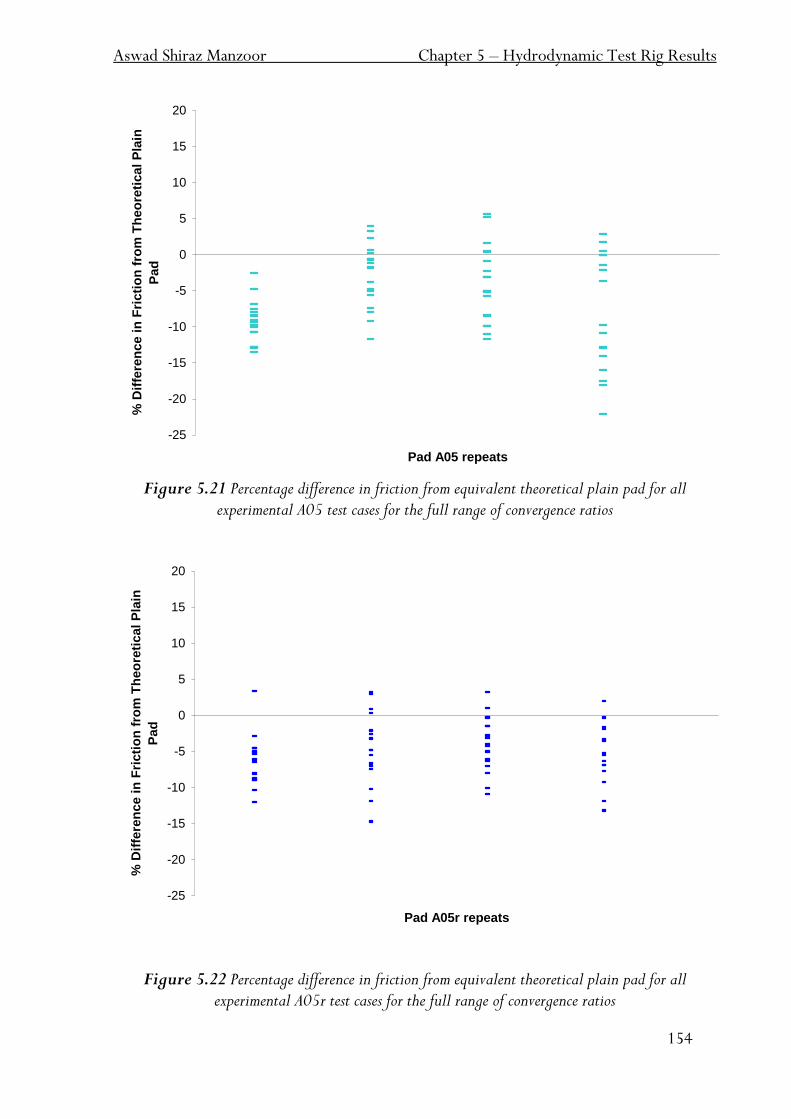
Aswad Shiraz Manzoor Chapter 5 – Hydrodynamic Test Rig Results
154
-25
-20
-15
-10
-5
0
5
10
15
20
Pad A05 repeats
% D
iffe
ren
ce
in
Fri
cti
on
fro
m T
he
ore
tic
al
Pla
in
Pa
d
-25
-20
-15
-10
-5
0
5
10
15
20
Pad A05r repeats
% D
iffe
ren
ce
in
Fri
cti
on
fro
m T
he
ore
tic
al
Pla
in
Pa
d
Figure 5.21 Percentage difference in friction from equivalent theoretical plain pad for all experimental A05 test cases for the full range of convergence ratios
Figure 5.22 Percentage difference in friction from equivalent theoretical plain pad for all
experimental A05r test cases for the full range of convergence ratios
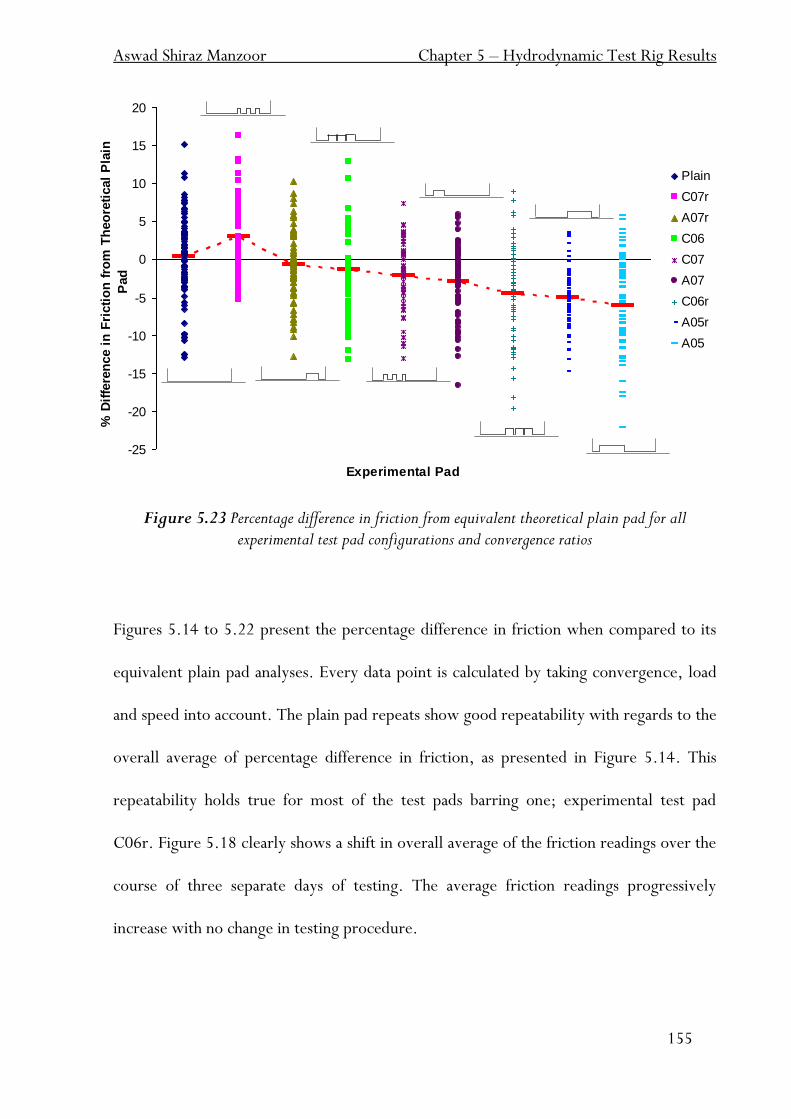
Aswad Shiraz Manzoor Chapter 5 – Hydrodynamic Test Rig Results
155
-25
-20
-15
-10
-5
0
5
10
15
20
Experimental Pad
% D
iffe
ren
ce i
n F
ricti
on
fro
m T
heo
reti
cal
Pla
in
Pad
Plain
C07r
A07r
C06
C07
A07
C06r
A05r
A05
Figure 5.23 Percentage difference in friction from equivalent theoretical plain pad for all experimental test pad configurations and convergence ratios
Figures 5.14 to 5.22 present the percentage difference in friction when compared to its
equivalent plain pad analyses. Every data point is calculated by taking convergence, load
and speed into account. The plain pad repeats show good repeatability with regards to the
overall average of percentage difference in friction, as presented in Figure 5.14. This
repeatability holds true for most of the test pads barring one; experimental test pad
C06r. Figure 5.18 clearly shows a shift in overall average of the friction readings over the
course of three separate days of testing. The average friction readings progressively
increase with no change in testing procedure.
Aswad Shiraz Manzoor Chapter 5 – Hydrodynamic Test Rig Results
156
Figure 5.23 is of all the test pad cases for percentage change in friction when compared to
equivalent theoretical plain pad cases. It shows that the average change in friction for the
experimental plain pad test cases is a near zero percent change, when compared to its
theoretical plain pad equivalent. Pad C07r has an overall increase in average friction of 3
percent, whilst pad A05 has an overall reduction in friction of approximately 6 percent.
5.5 Load Support versus Convergence for all pads
The following graphs present the dimensionless load support W* versus the convergence
ratio, K, for all the test pads.
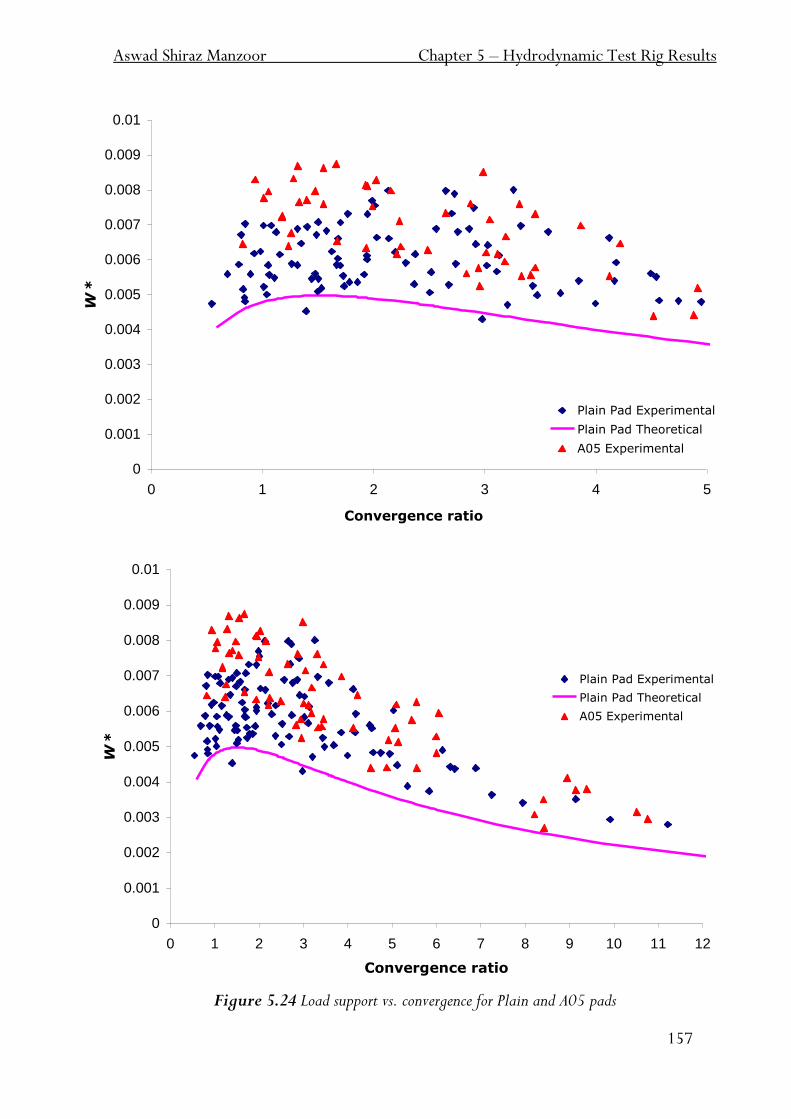
Aswad Shiraz Manzoor Chapter 5 – Hydrodynamic Test Rig Results
157
0
0.001
0.002
0.003
0.004
0.005
0.006
0.007
0.008
0.009
0.01
0 1 2 3 4 5
Convergence ratio
W*
Plain Pad Experimental
Plain Pad Theoretical
A05 Experimental
0
0.001
0.002
0.003
0.004
0.005
0.006
0.007
0.008
0.009
0.01
0 1 2 3 4 5 6 7 8 9 10 11 12
Convergence ratio
W*
Plain Pad Experimental
Plain Pad Theoretical
A05 Experimental
Figure 5.24 Load support vs. convergence for Plain and A05 pads
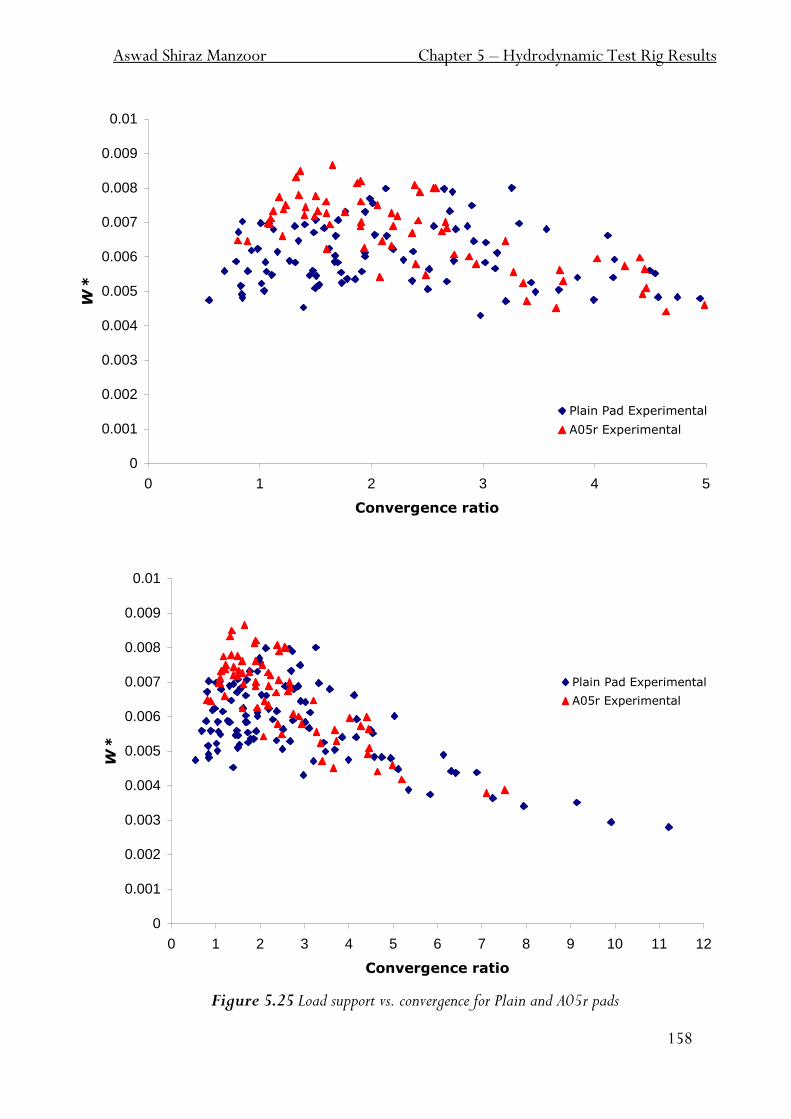
Aswad Shiraz Manzoor Chapter 5 – Hydrodynamic Test Rig Results
158
0
0.001
0.002
0.003
0.004
0.005
0.006
0.007
0.008
0.009
0.01
0 1 2 3 4 5
Convergence ratio
W*
Plain Pad Experimental
A05r Experimental
0
0.001
0.002
0.003
0.004
0.005
0.006
0.007
0.008
0.009
0.01
0 1 2 3 4 5 6 7 8 9 10 11 12
Convergence ratio
W*
Plain Pad Experimental
A05r Experimental
Figure 5.25 Load support vs. convergence for Plain and A05r pads
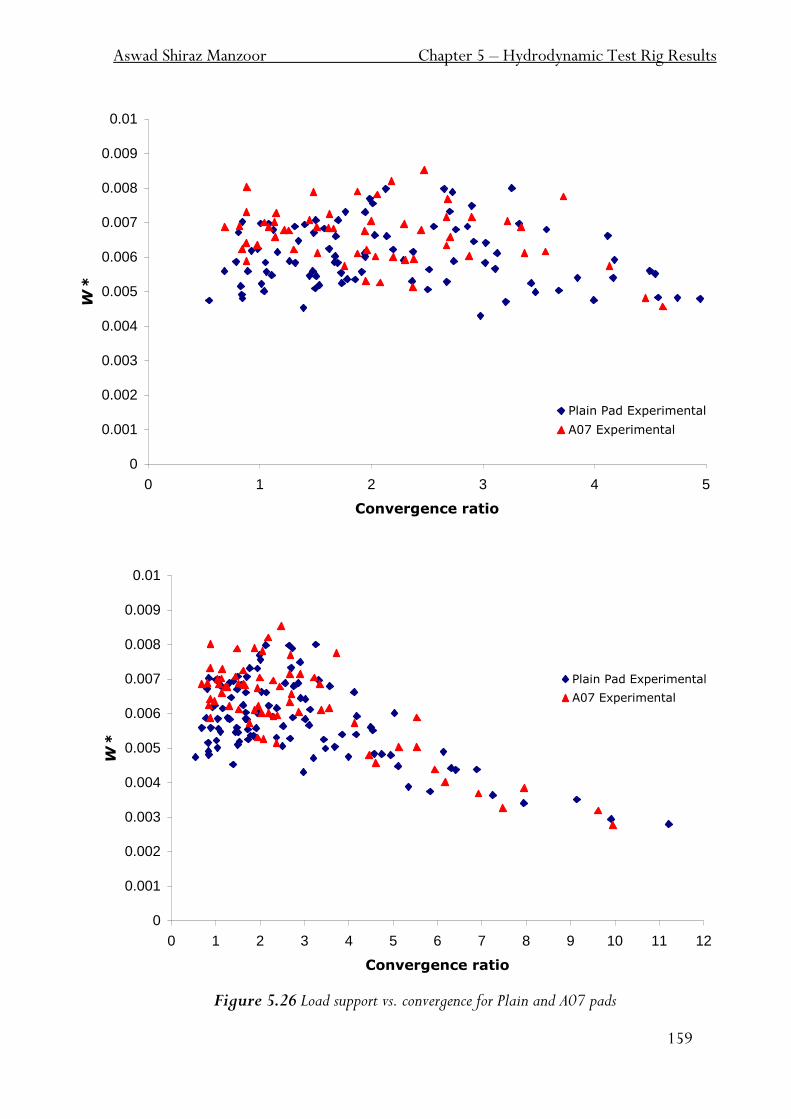
Aswad Shiraz Manzoor Chapter 5 – Hydrodynamic Test Rig Results
159
0
0.001
0.002
0.003
0.004
0.005
0.006
0.007
0.008
0.009
0.01
0 1 2 3 4 5
Convergence ratio
W*
Plain Pad Experimental
A07 Experimental
0
0.001
0.002
0.003
0.004
0.005
0.006
0.007
0.008
0.009
0.01
0 1 2 3 4 5 6 7 8 9 10 11 12
Convergence ratio
W*
Plain Pad Experimental
A07 Experimental
Figure 5.26 Load support vs. convergence for Plain and A07 pads
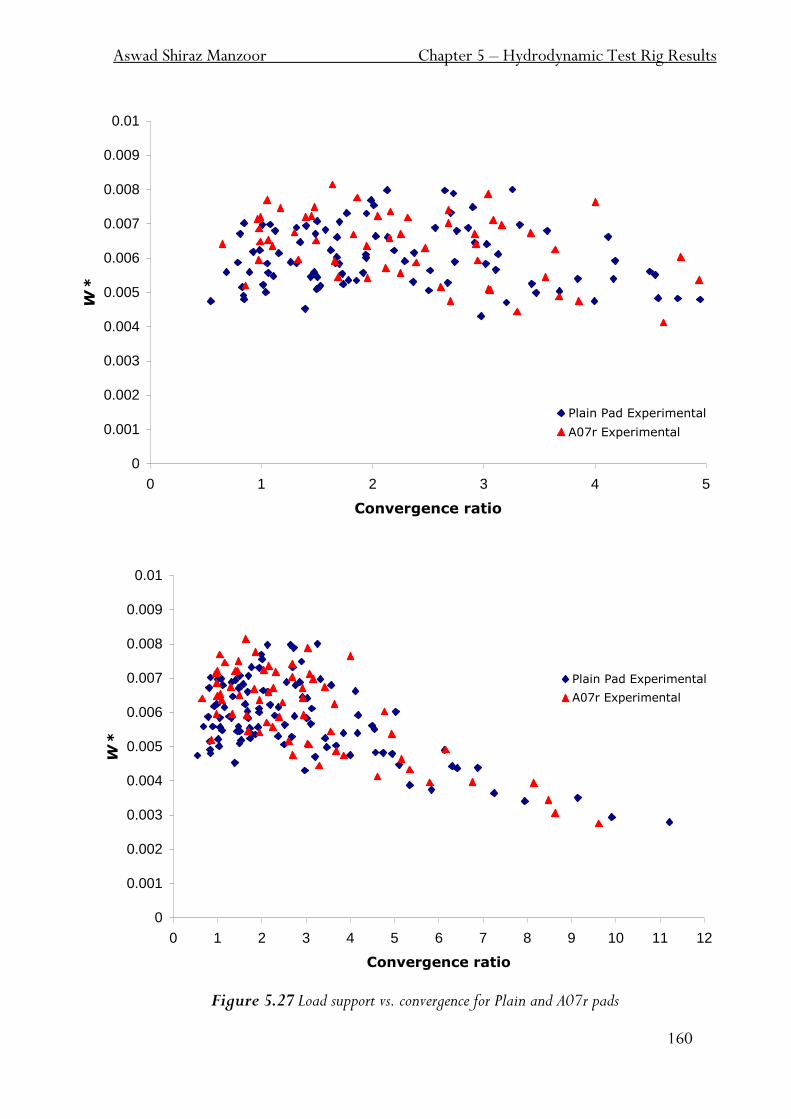
Aswad Shiraz Manzoor Chapter 5 – Hydrodynamic Test Rig Results
160
0
0.001
0.002
0.003
0.004
0.005
0.006
0.007
0.008
0.009
0.01
0 1 2 3 4 5
Convergence ratio
W*
Plain Pad Experimental
A07r Experimental
0
0.001
0.002
0.003
0.004
0.005
0.006
0.007
0.008
0.009
0.01
0 1 2 3 4 5 6 7 8 9 10 11 12
Convergence ratio
W*
Plain Pad Experimental
A07r Experimental
Figure 5.27 Load support vs. convergence for Plain and A07r pads

Aswad Shiraz Manzoor Chapter 5 – Hydrodynamic Test Rig Results
161
0
0.001
0.002
0.003
0.004
0.005
0.006
0.007
0.008
0.009
0.01
0 1 2 3 4 5
Convergence ratio
W*
Plain Pad Experimental
C07 Experimental
0
0.001
0.002
0.003
0.004
0.005
0.006
0.007
0.008
0.009
0.01
0 1 2 3 4 5 6 7 8 9 10 11 12
Convergence ratio
W*
Plain Pad Experimental
C07 Experimental
Figure 5.28 Load support vs. convergence for Plain and C07 pads
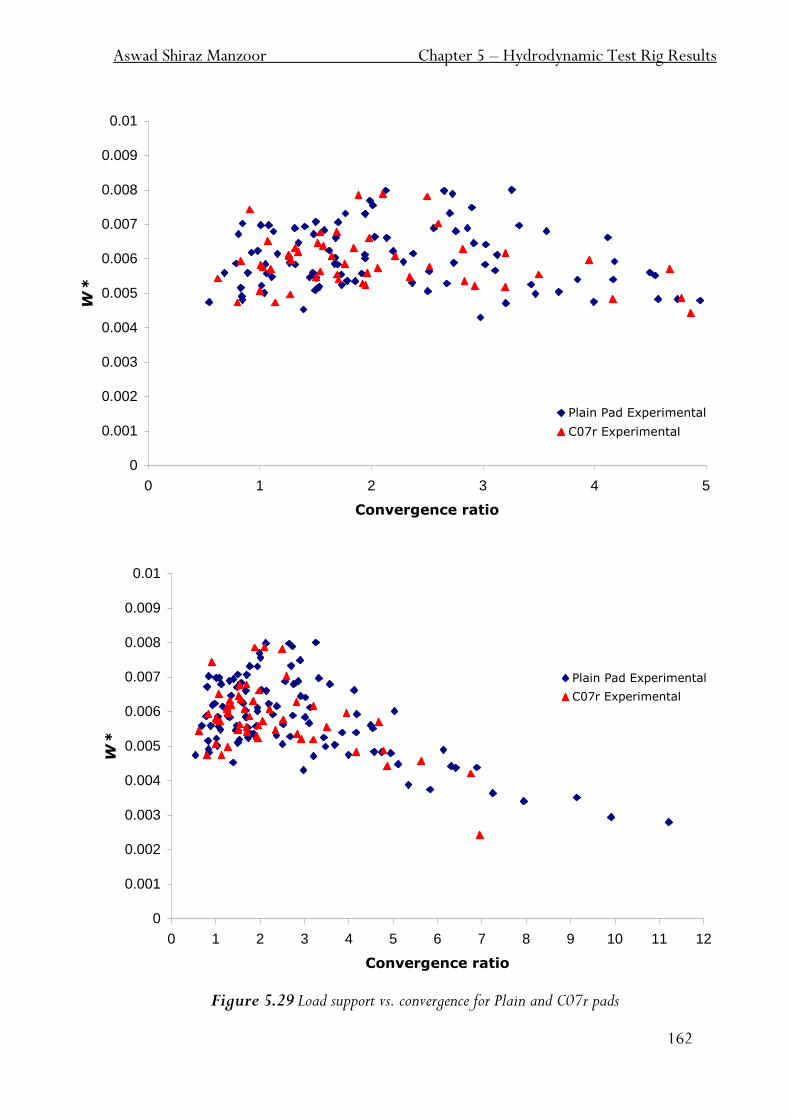
Aswad Shiraz Manzoor Chapter 5 – Hydrodynamic Test Rig Results
162
0
0.001
0.002
0.003
0.004
0.005
0.006
0.007
0.008
0.009
0.01
0 1 2 3 4 5
Convergence ratio
W*
Plain Pad Experimental
C07r Experimental
0
0.001
0.002
0.003
0.004
0.005
0.006
0.007
0.008
0.009
0.01
0 1 2 3 4 5 6 7 8 9 10 11 12
Convergence ratio
W*
Plain Pad Experimental
C07r Experimental
Figure 5.29 Load support vs. convergence for Plain and C07r pads
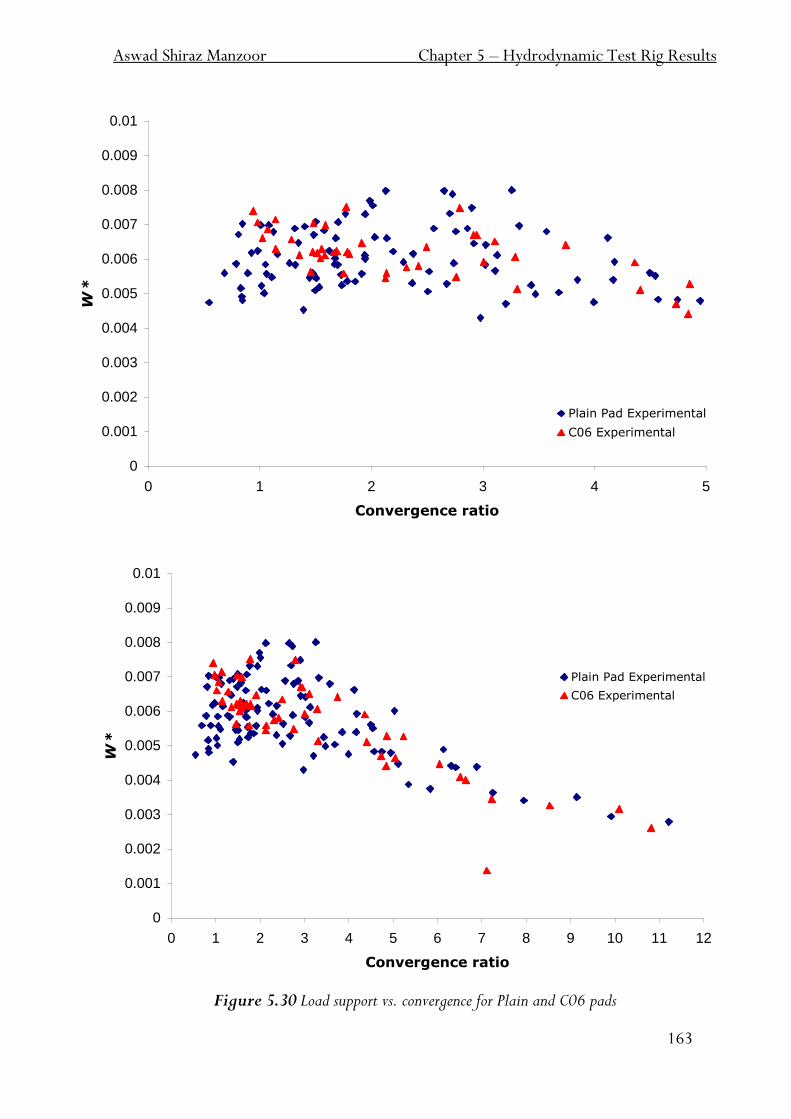
Aswad Shiraz Manzoor Chapter 5 – Hydrodynamic Test Rig Results
163
0
0.001
0.002
0.003
0.004
0.005
0.006
0.007
0.008
0.009
0.01
0 1 2 3 4 5
Convergence ratio
W*
Plain Pad Experimental
C06 Experimental
0
0.001
0.002
0.003
0.004
0.005
0.006
0.007
0.008
0.009
0.01
0 1 2 3 4 5 6 7 8 9 10 11 12
Convergence ratio
W*
Plain Pad Experimental
C06 Experimental
Figure 5.30 Load support vs. convergence for Plain and C06 pads
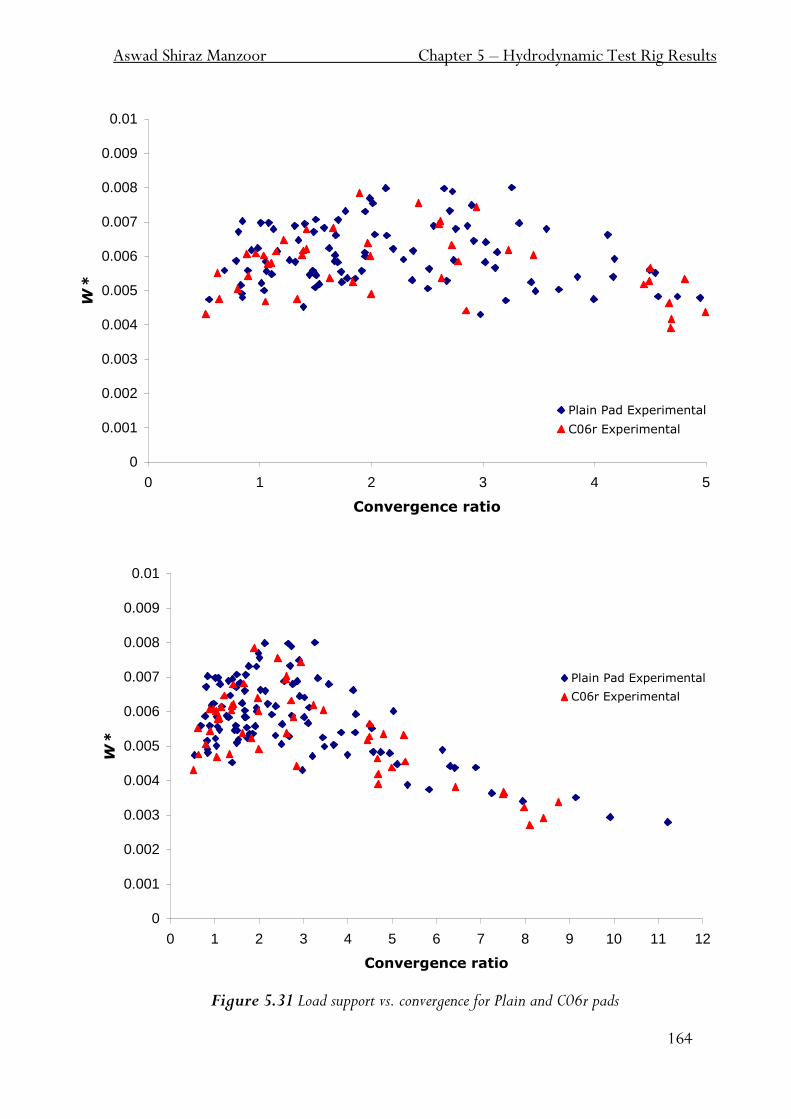
Aswad Shiraz Manzoor Chapter 5 – Hydrodynamic Test Rig Results
164
0
0.001
0.002
0.003
0.004
0.005
0.006
0.007
0.008
0.009
0.01
0 1 2 3 4 5
Convergence ratio
W*
Plain Pad Experimental
C06r Experimental
0
0.001
0.002
0.003
0.004
0.005
0.006
0.007
0.008
0.009
0.01
0 1 2 3 4 5 6 7 8 9 10 11 12
Convergence ratio
W*
Plain Pad Experimental
C06r Experimental
Figure 5.31 Load support vs. convergence for Plain and C06r pads
Aswad Shiraz Manzoor Chapter 5 – Hydrodynamic Test Rig Results
165
Figure 5.24 presents the load support versus convergence data for experimental pad A05
compared to the experimental plain pad. Also on these graphs, the plain pad theoretical
analyses are shown. There is obvious improvement in load support with pad A05 when
comparing with the plain pad data. This effect is more apparent in the lower
convergences, more specifically a convergence of 1.2 which is often deemed as the
optimum for hydrodynamic bearings. Again, there is an absolute difference when
comparing the experimental plain pad data to its theoretical equivalent as shown by the
solid pink line and blue diamond data points.
Similar results exist for pads A05r, A07 and A07r as given by Figures 5.25, 5.26 and
5.27. Again, most benefit in load support is witnessed around the 1.5 convergence ratio
area for these three test cases. The load support is fairly similar at all other convergence
ratios.
From the load support data given by Pad C07 in Figure 5.28, at first glance one may be
inclined to suggest that the textured pad load support is less beneficial that that offered by
a plain pad, taking into account similar conditions. Reductions of approximately 30-40
percent in load support are experienced at the „useful‟ convergence ratios. Similar load
support is evident in Figure 5.29 where data for pad C07r is presented; suggesting that
smaller pockets near the outlet of a hydrodynamic bearing may be of more benefit than
those located near the inlet.
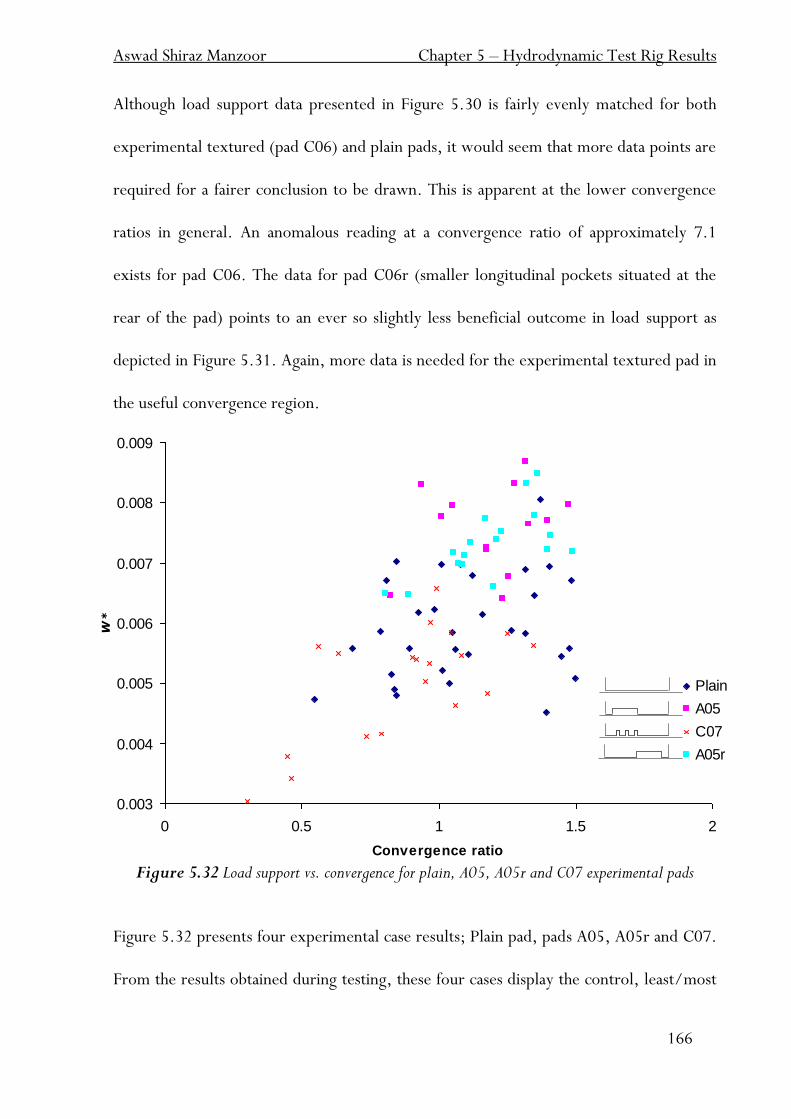
Aswad Shiraz Manzoor Chapter 5 – Hydrodynamic Test Rig Results
166
0.003
0.004
0.005
0.006
0.007
0.008
0.009
0 0.5 1 1.5 2
Convergence ratio
W*
Plain
A05
C07
A05r
Although load support data presented in Figure 5.30 is fairly evenly matched for both
experimental textured (pad C06) and plain pads, it would seem that more data points are
required for a fairer conclusion to be drawn. This is apparent at the lower convergence
ratios in general. An anomalous reading at a convergence ratio of approximately 7.1
exists for pad C06. The data for pad C06r (smaller longitudinal pockets situated at the
rear of the pad) points to an ever so slightly less beneficial outcome in load support as
depicted in Figure 5.31. Again, more data is needed for the experimental textured pad in
the useful convergence region.
Figure 5.32 Load support vs. convergence for plain, A05, A05r and C07 experimental pads
Figure 5.32 presents four experimental case results; Plain pad, pads A05, A05r and C07.
From the results obtained during testing, these four cases display the control, least/most
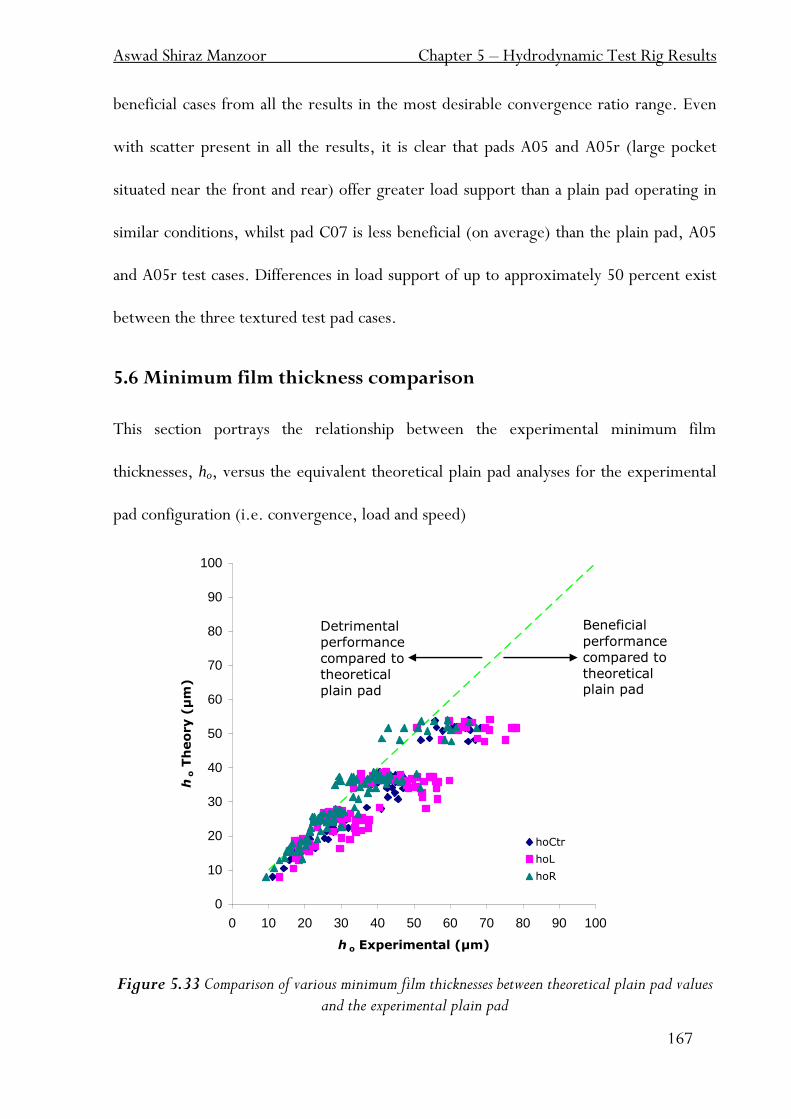
Aswad Shiraz Manzoor Chapter 5 – Hydrodynamic Test Rig Results
167
0
10
20
30
40
50
60
70
80
90
100
0 10 20 30 40 50 60 70 80 90 100
h o Experimental (µm)
ho T
heo
ry (
µm
)
hoCtr
hoL
hoR
beneficial cases from all the results in the most desirable convergence ratio range. Even
with scatter present in all the results, it is clear that pads A05 and A05r (large pocket
situated near the front and rear) offer greater load support than a plain pad operating in
similar conditions, whilst pad C07 is less beneficial (on average) than the plain pad, A05
and A05r test cases. Differences in load support of up to approximately 50 percent exist
between the three textured test pad cases.
5.6 Minimum film thickness comparison
This section portrays the relationship between the experimental minimum film
thicknesses, ho, versus the equivalent theoretical plain pad analyses for the experimental
pad configuration (i.e. convergence, load and speed)
Figure 5.33 Comparison of various minimum film thicknesses between theoretical plain pad values
and the experimental plain pad
Beneficial
performance
compared to
theoretical plain pad
Detrimental
performance
compared to
theoretical
plain pad
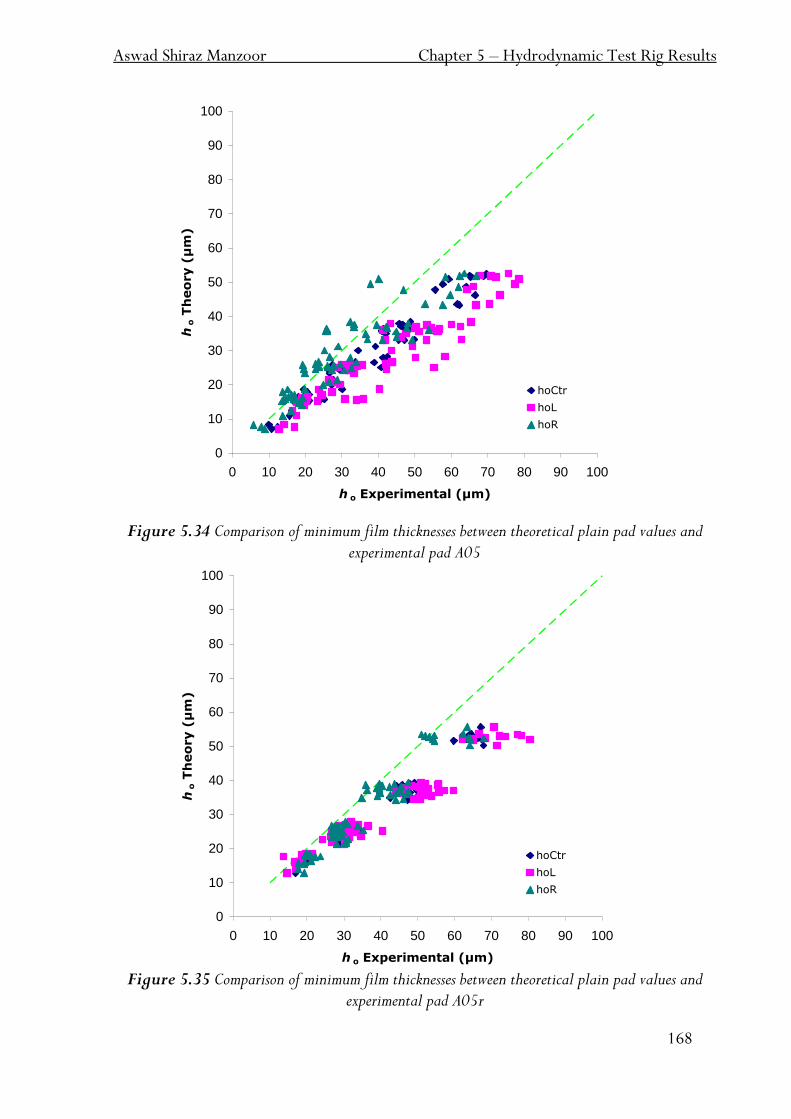
Aswad Shiraz Manzoor Chapter 5 – Hydrodynamic Test Rig Results
168
0
10
20
30
40
50
60
70
80
90
100
0 10 20 30 40 50 60 70 80 90 100
h o Experimental (µm)
ho T
heo
ry (
µm
)
hoCtr
hoL
hoR
0
10
20
30
40
50
60
70
80
90
100
0 10 20 30 40 50 60 70 80 90 100
h o Experimental (µm)
ho T
heo
ry (
µm
)
hoCtr
hoL
hoR
Figure 5.34 Comparison of minimum film thicknesses between theoretical plain pad values and experimental pad A05
Figure 5.35 Comparison of minimum film thicknesses between theoretical plain pad values and
experimental pad A05r
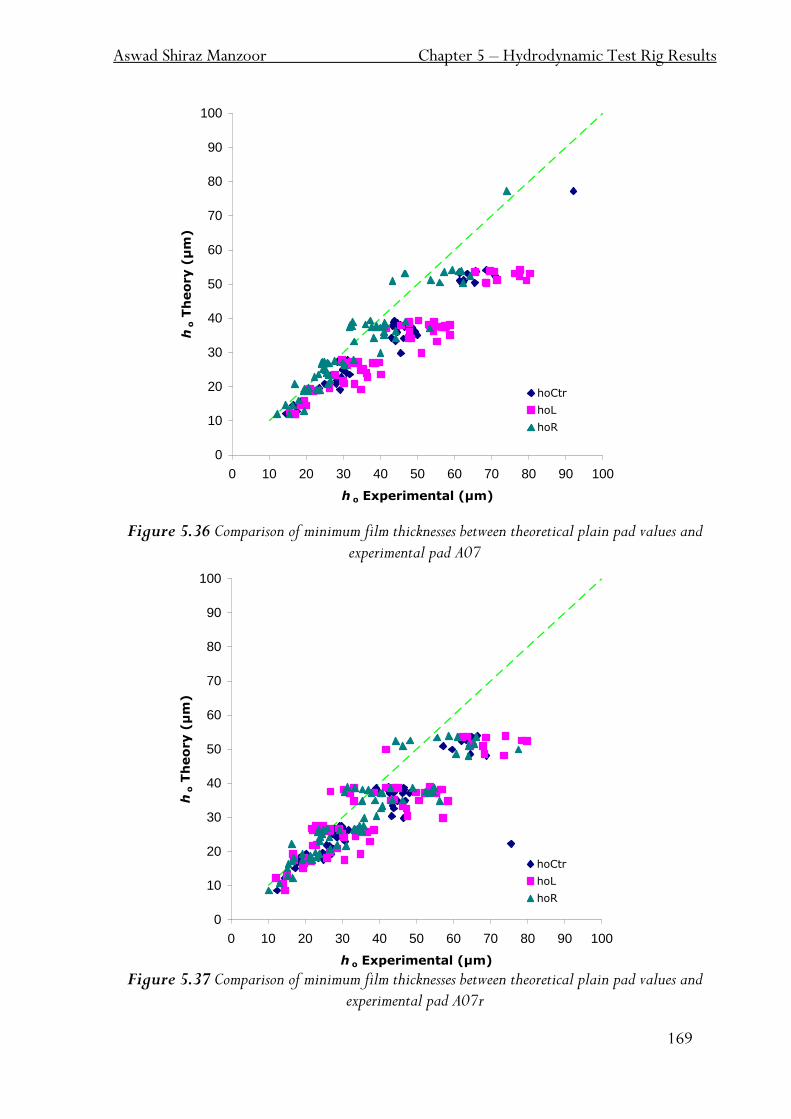
Aswad Shiraz Manzoor Chapter 5 – Hydrodynamic Test Rig Results
169
0
10
20
30
40
50
60
70
80
90
100
0 10 20 30 40 50 60 70 80 90 100
h o Experimental (µm)
ho T
heo
ry (
µm
)
hoCtr
hoL
hoR
0
10
20
30
40
50
60
70
80
90
100
0 10 20 30 40 50 60 70 80 90 100
h o Experimental (µm)
ho T
heo
ry (
µm
)
hoCtr
hoL
hoR
Figure 5.36 Comparison of minimum film thicknesses between theoretical plain pad values and experimental pad A07
Figure 5.37 Comparison of minimum film thicknesses between theoretical plain pad values and
experimental pad A07r
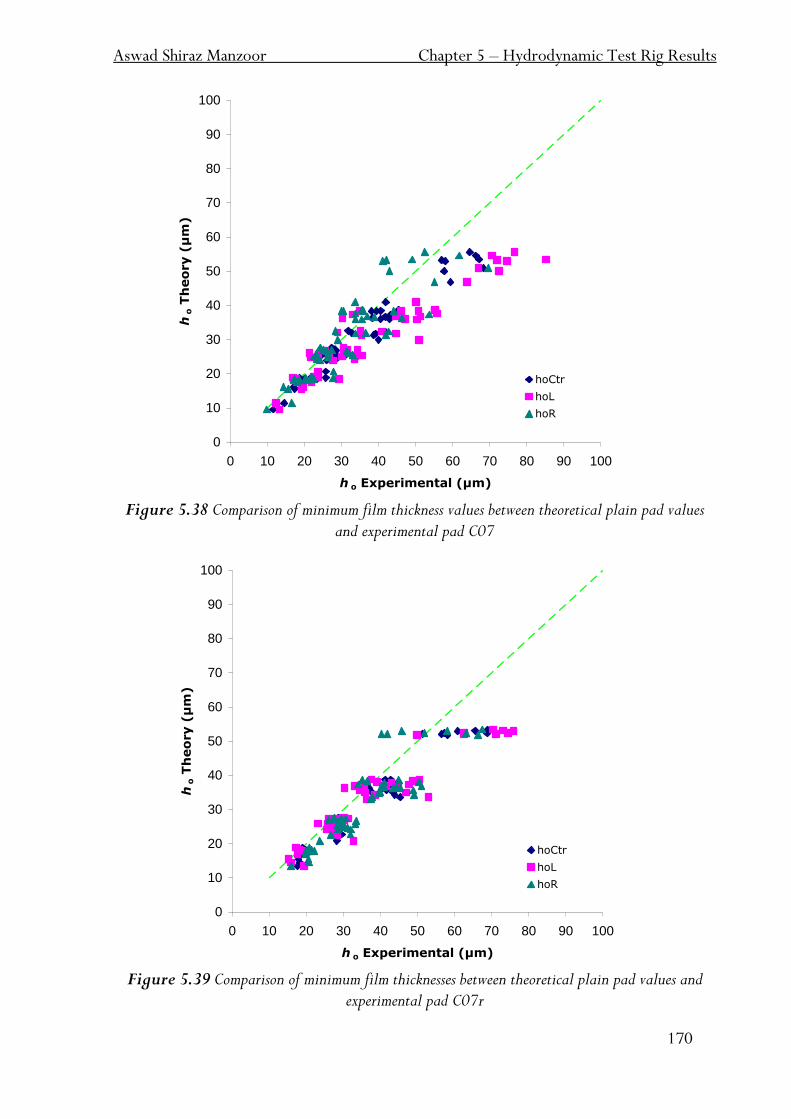
Aswad Shiraz Manzoor Chapter 5 – Hydrodynamic Test Rig Results
170
0
10
20
30
40
50
60
70
80
90
100
0 10 20 30 40 50 60 70 80 90 100
h o Experimental (µm)
ho T
heo
ry (
µm
)
hoCtr
hoL
hoR
0
10
20
30
40
50
60
70
80
90
100
0 10 20 30 40 50 60 70 80 90 100
h o Experimental (µm)
ho T
heo
ry (
µm
)
hoCtr
hoL
hoR
Figure 5.38 Comparison of minimum film thickness values between theoretical plain pad values
and experimental pad C07
Figure 5.39 Comparison of minimum film thicknesses between theoretical plain pad values and experimental pad C07r
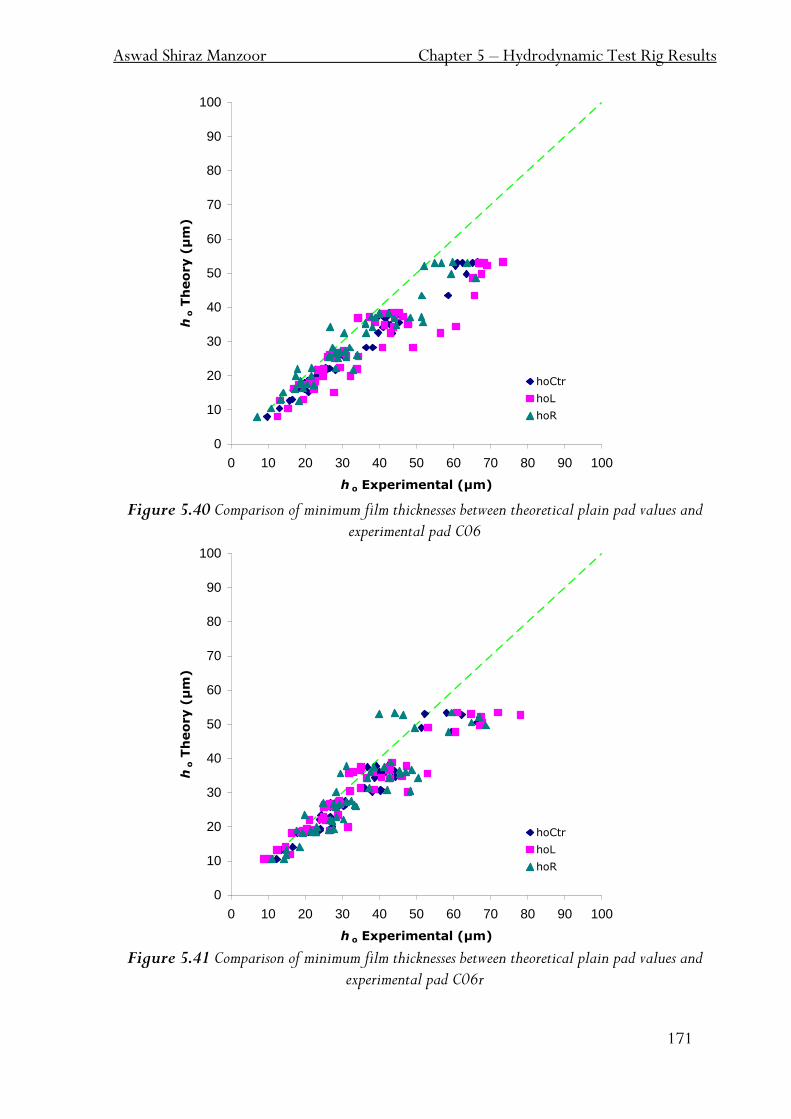
Aswad Shiraz Manzoor Chapter 5 – Hydrodynamic Test Rig Results
171
0
10
20
30
40
50
60
70
80
90
100
0 10 20 30 40 50 60 70 80 90 100
h o Experimental (µm)
ho T
heo
ry (
µm
)
hoCtr
hoL
hoR
0
10
20
30
40
50
60
70
80
90
100
0 10 20 30 40 50 60 70 80 90 100
h o Experimental (µm)
ho T
heo
ry (
µm
)
hoCtr
hoL
hoR
Figure 5.40 Comparison of minimum film thicknesses between theoretical plain pad values and
experimental pad C06
Figure 5.41 Comparison of minimum film thicknesses between theoretical plain pad values and
experimental pad C06r
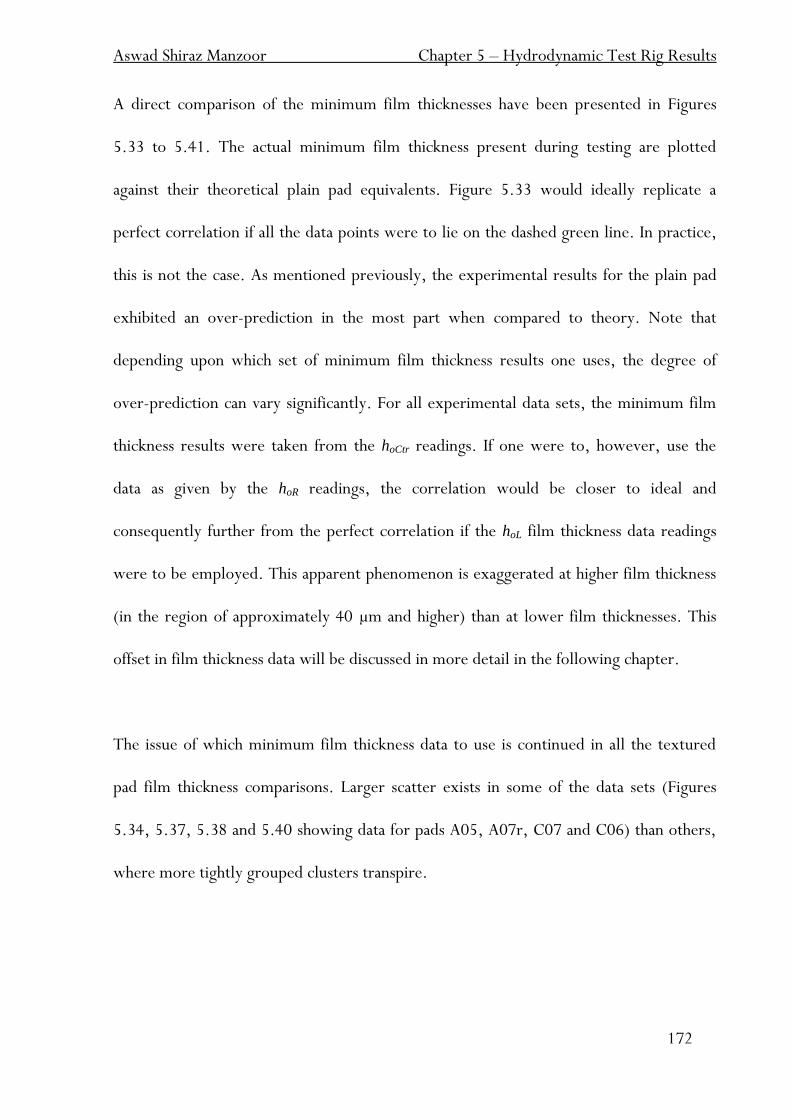
Aswad Shiraz Manzoor Chapter 5 – Hydrodynamic Test Rig Results
172
A direct comparison of the minimum film thicknesses have been presented in Figures
5.33 to 5.41. The actual minimum film thickness present during testing are plotted
against their theoretical plain pad equivalents. Figure 5.33 would ideally replicate a
perfect correlation if all the data points were to lie on the dashed green line. In practice,
this is not the case. As mentioned previously, the experimental results for the plain pad
exhibited an over-prediction in the most part when compared to theory. Note that
depending upon which set of minimum film thickness results one uses, the degree of
over-prediction can vary significantly. For all experimental data sets, the minimum film
thickness results were taken from the hoCtr readings. If one were to, however, use the
data as given by the hoR readings, the correlation would be closer to ideal and
consequently further from the perfect correlation if the hoL film thickness data readings
were to be employed. This apparent phenomenon is exaggerated at higher film thickness
(in the region of approximately 40 µm and higher) than at lower film thicknesses. This
offset in film thickness data will be discussed in more detail in the following chapter.
The issue of which minimum film thickness data to use is continued in all the textured
pad film thickness comparisons. Larger scatter exists in some of the data sets (Figures
5.34, 5.37, 5.38 and 5.40 showing data for pads A05, A07r, C07 and C06) than others,
where more tightly grouped clusters transpire.
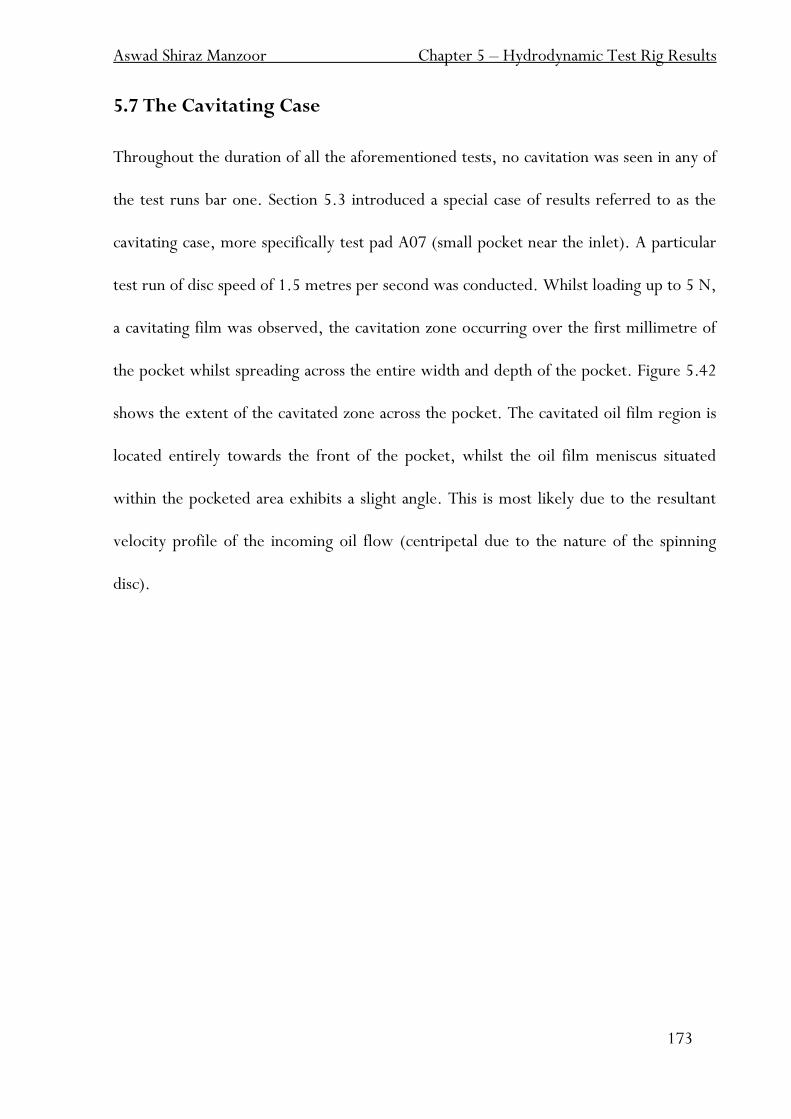
Aswad Shiraz Manzoor Chapter 5 – Hydrodynamic Test Rig Results
173
5.7 The Cavitating Case
Throughout the duration of all the aforementioned tests, no cavitation was seen in any of
the test runs bar one. Section 5.3 introduced a special case of results referred to as the
cavitating case, more specifically test pad A07 (small pocket near the inlet). A particular
test run of disc speed of 1.5 metres per second was conducted. Whilst loading up to 5 N,
a cavitating film was observed, the cavitation zone occurring over the first millimetre of
the pocket whilst spreading across the entire width and depth of the pocket. Figure 5.42
shows the extent of the cavitated zone across the pocket. The cavitated oil film region is
located entirely towards the front of the pocket, whilst the oil film meniscus situated
within the pocketed area exhibits a slight angle. This is most likely due to the resultant
velocity profile of the incoming oil flow (centripetal due to the nature of the spinning
disc).
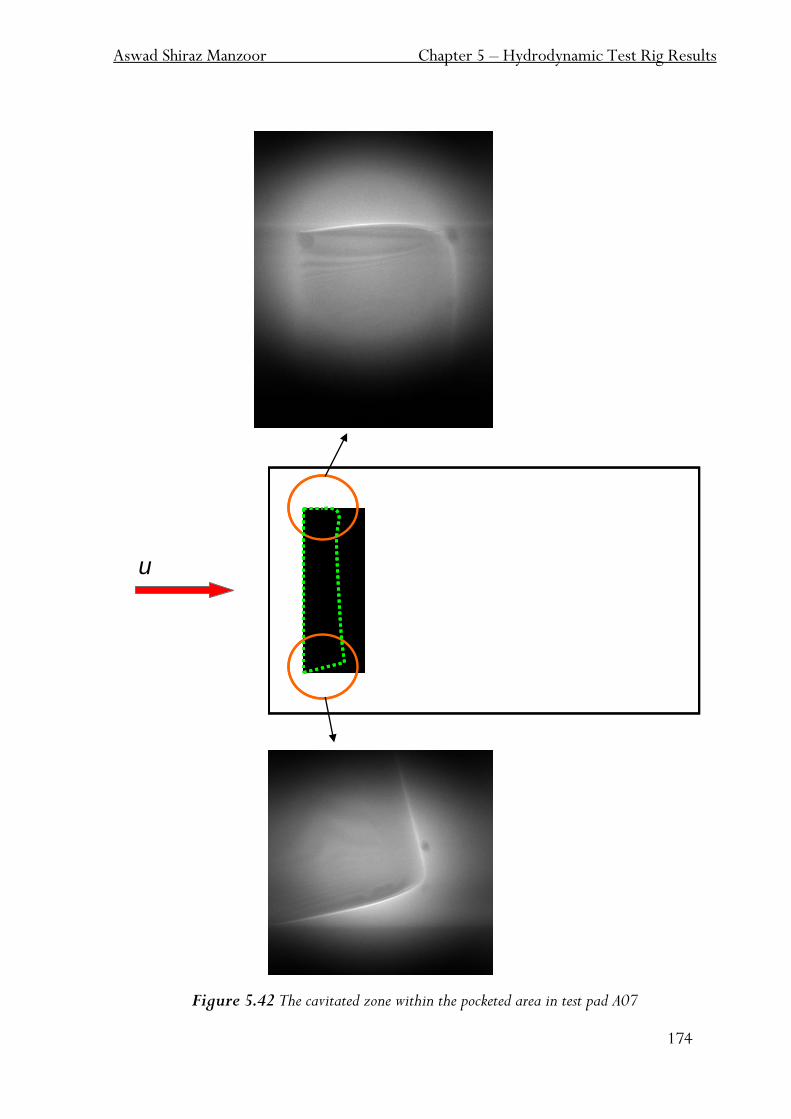
Aswad Shiraz Manzoor Chapter 5 – Hydrodynamic Test Rig Results
174
Figure 5.42 The cavitated zone within the pocketed area in test pad A07
u
Aswad Shiraz Manzoor Chapter 5 – Hydrodynamic Test Rig Results
175
5.8 Summary
This chapter has introduced all of the minimum film thickness, friction and load support
data obtained from the hydrodynamic test rig. Comments have been made with regards
to their performance and ranking, where necessary. Specific mention has been made to
favourable test pads under certain conditions. In addition, the concept of a two-
dimensional convergence phenomenon occurring on the test pad during testing has been
noted. The significance and impact of these results will be discussed in the following
chapter.

Chapter 6
Discussion
Aswad Shiraz Manzoor Chapter 6 – Discussion
177
6.1 Introduction
The current work has introduced a novel and unique method to simultaneously measure
friction, load support, minimum film thickness and cavitation within a hydrodynamic pad
bearing.
This chapter reviews all the results presented in this current work. Comments are made
with regards to their validity and significance in hydrodynamic bearing applications. All
test case performances are analysed and arguments presented where unexpected findings
arise, with both the possible consequences and implications of the findings reviewed. The
experimental findings are analysed with respect to a limited theoretical study, and the
relevant significance of such a task is reviewed. Some of the key points of interest that this
chapter (and ultimately this current work) aims to address include the following;
Do any of the textures significantly increase load capacity and/or reduce friction?
If so, under what particular conditions do they occur and why? (i.e. the likely
mechanism of increased load support and/or reduced friction)
Can any particular texture be said to be preferable than a plain pad over a wide
range of conditions, and why?
The overall experimental approach (taking into account both technique and
methodology) is then discussed. Opinions and thoughts regarding their suitability are
offered, and suggestions made where improvements may be required. The chapter is
Aswad Shiraz Manzoor Chapter 6 – Discussion
178
finally concluded by a short summary. This entails the contribution of the current
research and its role and position within the textured hydrodynamic bearing field. A
parting comment regarding the originality of the current work is made.
6.2 Review of Results
This section discusses the experimental results achieved, as shown in Chapter 5. Load
support graphs were produced using the experimental film thickness and coefficient of
friction results. Their impact upon the use of textured surfaces in certain operating
conditions is commented upon.
6.2.1 Film Thickness and Friction data
This section refers to the minimum film thickness and friction graphs presented in
Chapter 5, Section 5.3. Generally, all the test cases exhibit similar trends to that
predicted by the theory. The manner in which the plain pad film thickness and friction
results subsequently decrease and increase with respect to load, is replicated well by
experiment. However, if one considers absolute values of the minimum film thickness,
an underlying difference is clearly present (discussed later in Section 6.4). This is true for
all the „minimum film thickness versus load‟ comparisons.
It is very difficult to judge when considering the friction results as most data points are
overlapping across the entire load range. This is true for most test cases over the entire
load range, barring a possible anomalous data point at 5 N for test pad C07 as shown in
Aswad Shiraz Manzoor Chapter 6 – Discussion
179
Figure 5.9. The experimental friction reading is considerably (approximately 20 percent)
lower than the theoretical plain pad equivalent.
The two anomalous data points representing test pad A07, as shown in Figure 5.7, are as
result of the „cavitating case‟ as introduced in Chapter 5, Section 5.7. The margin of
difference within this cavitating case is very similar to the majority of the data points at
the 5 N test load condition for all other test cases (where no cavitation occurred within
the lubricating film). This applies for both the minimum film thickness and friction
results.
In summary, well replicated trends are exhibited by the experimental cases, albeit with
an absolute difference in minimum film thickness readings. As the load increases, the
minimum film thickness reduces whilst the friction increases due to the uncontrollable
change in the test pad convergence ratio (and coupled with the fact that the minimum
film thickness cannot be set during a test run). This said, the friction results are more
useful when considering the possible tribological gains typically associated with textured
surfaces. The closely spaced friction result data points make it difficult to determine a
ranking order for the entire test pad cases. Also, the minimum film thickness and friction
graphs presented in section 5.3 do not give an indication as to the convergence ratio, K,
for each individual data point and consequently, these graphs are not suitable to
determine any such ranking order. Alongside this, each individual graph presents
experimental data for a single test pad against its theoretical plain pad equivalent, as such
Aswad Shiraz Manzoor Chapter 6 – Discussion
180
does not compare two experimental test pad cases. This is to be expected as each test pad
case contains a great number of data points, and having two or more closely-related test
pad case results on the same graph would be difficult to assess graphically. The only
exception to this is Figure 5.13 which compares both the plain and A05 textured
experimental pads, highlighting a very small difference between the two. This difference
is more apparent at the low load test cases for both high and low disc speeds.
6.2.2 Percentage difference in Friction data
The majority of the data presented within the friction percentage difference graphs
(Section 5.4, Chapter 5) shows good repeatability with regards to the percentage
difference in friction from the plain pad theoretical data. Small differences in the vertical
axis (percentage difference in friction between the experimental pad and its plain pad
theoretical equivalent) may be explained by a large range of test pad convergence ratios.
For example, this may be the case as shown by Figures 5.19 and 5.21, data for textured
pads A07 and A05 respectively. However, Figure 5.18 exhibits a possible shift in
percentage difference in friction from theoretical plain pad over the three consecutive
testing days. This, again, may also be due to a large range of convergence ratios
experienced during testing, or it may be due to noise/interference present within the
friction results.
Figure 5.23 collates the percentage difference in friction results for all the test cases. The
graph is presented in ranking order with regards to most effect upon the percentage
Aswad Shiraz Manzoor Chapter 6 – Discussion
181
difference in friction over the plain pad analyses. Whilst the plain pad experimental
results are pretty much on par with the theoretical analysis, all bar one of the test pads
show an improvement in the average percentage difference in friction compared to the
experimental plain pad case. Test pad C07r is the only case showing a disadvantage when
referring to the average friction data. Typical friction percentage reductions are in the
range of single figures, ranging from approximately -3 percent to +6 percent.
As with the previous film thickness and friction results, the results discussed in this
section refers to the full range of convergence ratios. Further analysis would be required
with regards to the performance of each textured bearing under specific operating
conditions.
6.2.3 Load support versus Convergence ratio
As this study is attempting to establish the potential of textured surfaces to reduce
friction, it is coupled with a search for increased load support (the non-dimensional
representation being W*). The load support graphs (introduced in Section 5.5, Chapter5)
show the relationship between the dimensionless load support and the convergence ratio.
As the experimental plain pad data set is presented along with each textured test pad
case, a cross-comparison is easily achieved.
The optimum convergence ratio for an infinitely long linear wedge is approximately 1.2,
whilst within other prominent wedge shape bearings (i.e. step, tapered land and
Aswad Shiraz Manzoor Chapter 6 – Discussion
182
exponential) it is close to K=1. The experimental results show convergence ratio values
ranging from 0.5 to 11. The plain pad experimental data points show good agreement
with the plain pad theoretical analysis, albeit with an offset as the plain pad load support
results presented in Figure 5.24 are clearly higher than what the theoretical plain pad
analysis predicts but it is thought that the theory does not precisely model the
experimental test rig conditions exactly (discussed later in Section 6.4).
If one focuses one‟s attention on the lower convergence ratio tests (where K ~ 0.5 to 2),
distinguishable differences exist between textured pad A05, A05r and C07. Pad A05
(large single pocket situated at the front of the pad) exhibits what can be considered the
most beneficial or „improved‟ load support in this region, as shown by Figure 5.24.
Improved load support in this case means that a greater normal load is generated for a
particular film thickness (or, a higher film thickness exists for a given load). It does not
mean that the bearing will necessarily support a greater maximum load.
A similar outcome is evident for pad A05r (large single pocket situated at the rear of the
pad) as depicted by Figure 5.25. In contrast to this in Figure 5.28, pad C07 which
comprises several smaller pockets located near the front of the pad, clearly demonstrates
its reduced load support capability across similar convergence ratios when compared
against both the plain and other textured experimental test pads.
Aswad Shiraz Manzoor Chapter 6 – Discussion
183
6.2.4 Minimum Film Thickness data
The minimum film thickness comparison graphs presented in Chapter 5 Section 5.6 can
be thought of as a „scale‟ to see the potential benefit in minimum film thicknesses when
using textured pads. For any given theoretical ho value, an experimental film thickness
value which is placed on the right hand side of the dashed green marker line would
indicate a thicker minimum film thickness. Even taking into account the potential
constant offset between theoretical and experimental data, film thickness results for pads
A05 and A05r are marginally higher (a desired benefit), whilst pad C07 results are
fractionally closer to the dashed line, indicating that negligible minimum film thickness
improvements would result. As with the film thickness and friction graphs presented in
Sections 5.3 and 5.4, these graphs are heavily clustered with closely related data points
and as such, make it difficult to draw any real conclusions with the introduction of
textured surfaces within these bearings.
6.2.5 Cavitation Implications
Interestingly, even with the apparent „benefit‟ in minimum film thickness for the solitary
data point obtained during cavitating case in pad A07 (as seen in Figure 5.7), the friction
value obtained is slightly higher than the plain pad theoretical analysis, for the same given
test conditions. Judgement is reserved for now as it is impossible to comment upon a
scenario where only a single data point result exists. One may be inclined to suggest that
the cavitating case leads to a higher friction reading than that of a plain pad as the
maximum load capacity occurs at the onset of cavitation (as discussed by Olver et al [17])
Aswad Shiraz Manzoor Chapter 6 – Discussion
184
and not during a cavitated test run. Coupled to this, any inaccuracies in the friction
measurement (as the absolute friction value itself was relatively high, with a coefficient of
friction, μ, of approximately 0.13) may have led to any perceived differences.
However, the fact remains that cavitation occurred within the lubricating oil film and was
consequently captured simultaneously alongside film thickness and friction data collation
remains a novel aspect of the current work.
6.2.6 Summary of experimental results discussion
From the range of tests conducted, the most obvious choice of result to base any
judgment would be the load support graphs as they are, visually, the easiest to configure;
in which case pad A05 seems to possess the most beneficial texture whilst pad C07 would
be the least effective. However, on the basis of „highest percentage difference in average
friction‟ from the plain pad theoretical analysis would be pad C07r.
6.3 Theoretical comparisons
The results presented thus far have only been compared to theoretical plain pad analyses.
This section introduces one dimensional textured and plain pad analyses, as modelled by
an infinitely long linear wedge pad bearing (these theoretical results have been produced
by the computational collaborators working alongside this research). These are compared
against the two dimensional plain pad analyses and select textured pad cases.
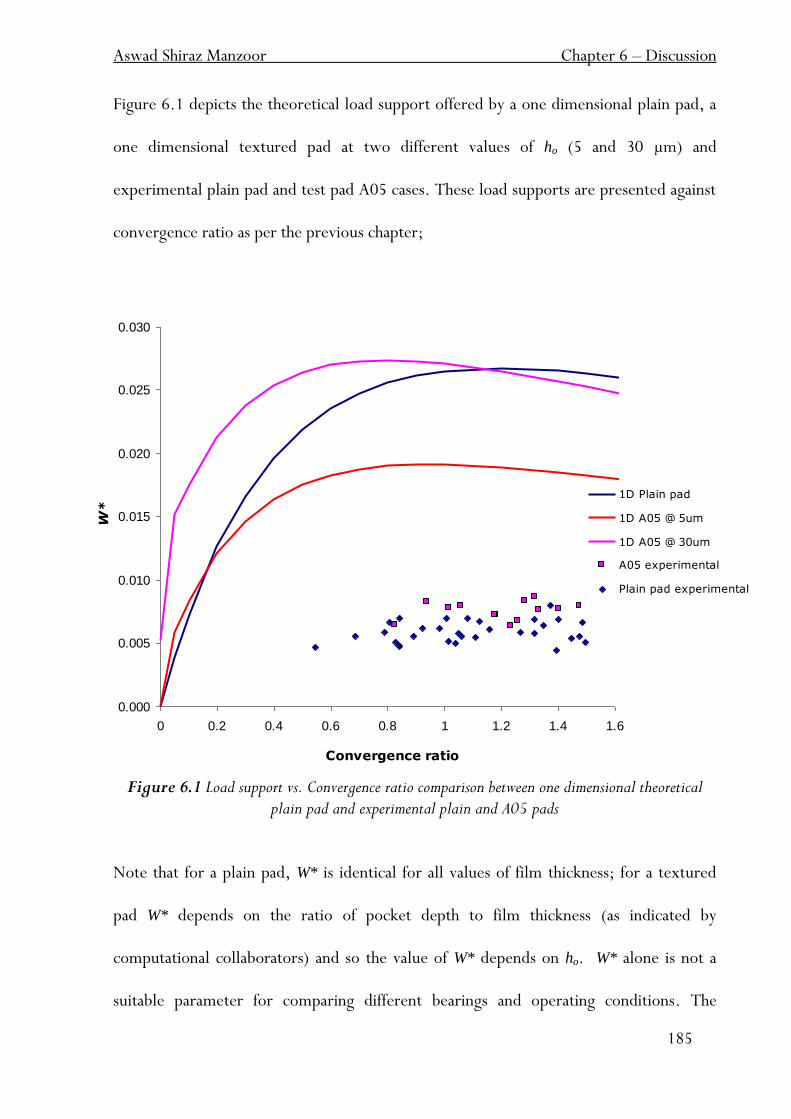
Aswad Shiraz Manzoor Chapter 6 – Discussion
185
0.000
0.005
0.010
0.015
0.020
0.025
0.030
0 0.2 0.4 0.6 0.8 1 1.2 1.4 1.6
Convergence ratio
W*
1D Plain pad
1D A05 @ 5um
1D A05 @ 30um
A05 experimental
Plain pad experimental
Figure 6.1 depicts the theoretical load support offered by a one dimensional plain pad, a
one dimensional textured pad at two different values of ho (5 and 30 µm) and
experimental plain pad and test pad A05 cases. These load supports are presented against
convergence ratio as per the previous chapter;
Figure 6.1 Load support vs. Convergence ratio comparison between one dimensional theoretical plain pad and experimental plain and A05 pads
Note that for a plain pad, W* is identical for all values of film thickness; for a textured
pad W* depends on the ratio of pocket depth to film thickness (as indicated by
computational collaborators) and so the value of W* depends on ho. W* alone is not a
suitable parameter for comparing different bearings and operating conditions. The
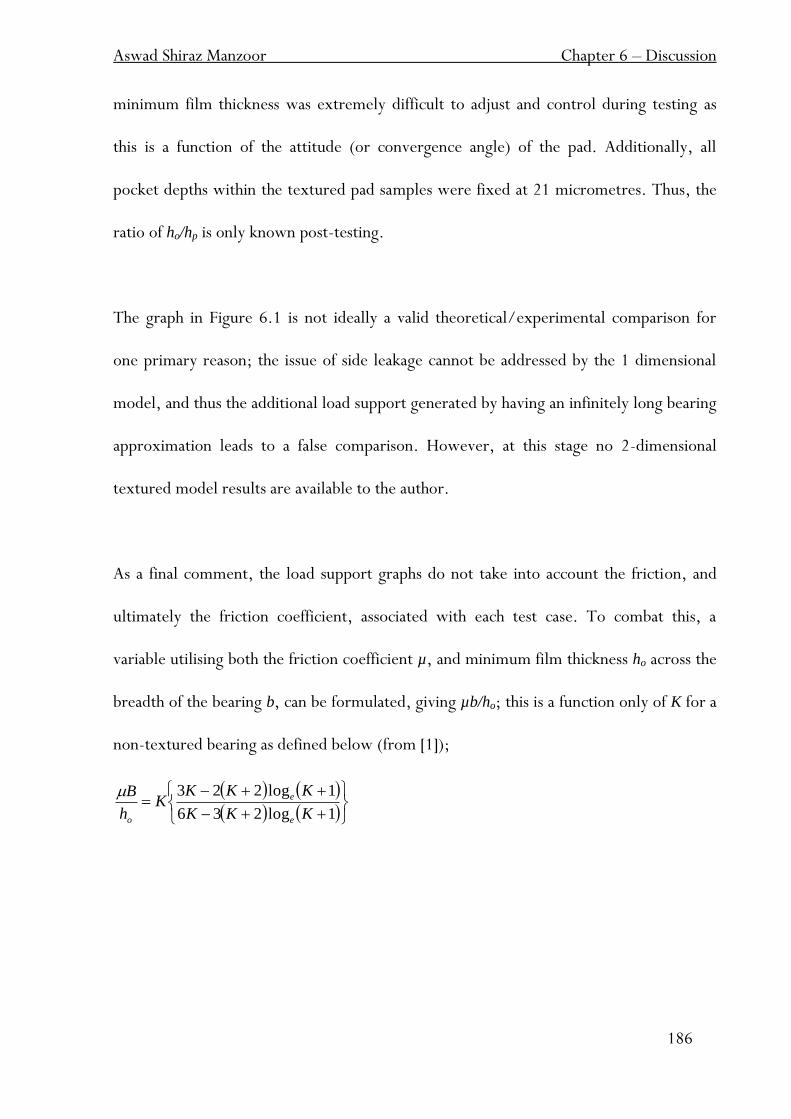
Aswad Shiraz Manzoor Chapter 6 – Discussion
186
minimum film thickness was extremely difficult to adjust and control during testing as
this is a function of the attitude (or convergence angle) of the pad. Additionally, all
pocket depths within the textured pad samples were fixed at 21 micrometres. Thus, the
ratio of ho/hp is only known post-testing.
The graph in Figure 6.1 is not ideally a valid theoretical/experimental comparison for
one primary reason; the issue of side leakage cannot be addressed by the 1 dimensional
model, and thus the additional load support generated by having an infinitely long bearing
approximation leads to a false comparison. However, at this stage no 2-dimensional
textured model results are available to the author.
As a final comment, the load support graphs do not take into account the friction, and
ultimately the friction coefficient, associated with each test case. To combat this, a
variable utilising both the friction coefficient µ, and minimum film thickness ho across the
breadth of the bearing b, can be formulated, giving µb/ho; this is a function only of K for a
non-textured bearing as defined below (from [1]);
1log236
1log223
KKK
KKKK
h
B
e
e
o
Aswad Shiraz Manzoor Chapter 6 – Discussion
187
0
50
100
150
200
250
300
0 0.2 0.4 0.6 0.8 1 1.2 1.4 1.6
Convergence ratio
µb/h
o
2D Plain pad theoretical
1D Plain pad theoretical
Plain pad experimental
Figure 6.2 µb/ho vs. Convergence ratio comparison between both one & two dimensional plain pad
theoretical and experimental plain pad
Figure 6.2 shows this term versus convergence ratio for both the one and two
dimensional theoretical plain pad cases as well as the plain pad experimental test runs.
Very good agreement exists between the two dimensional theoretical and experimental
data. Note the behaviour of the one dimensional theoretical model at very low
convergence ratios (0.2 and below) relative to the two dimensional model predictions.
The one dimensional relationship has a sharp cut-off region at a convergence ratio of
approximately 0.05 at which point the µb/ho curve decreases, whilst the two dimensional
curve is more gradual over the entire range of convergence ratios. As expected for an
infinitely long wedge plain pad bearing, the one dimensional case offers greater load
support, and thus µb/ho, for the same convergence ratios when compared to the two
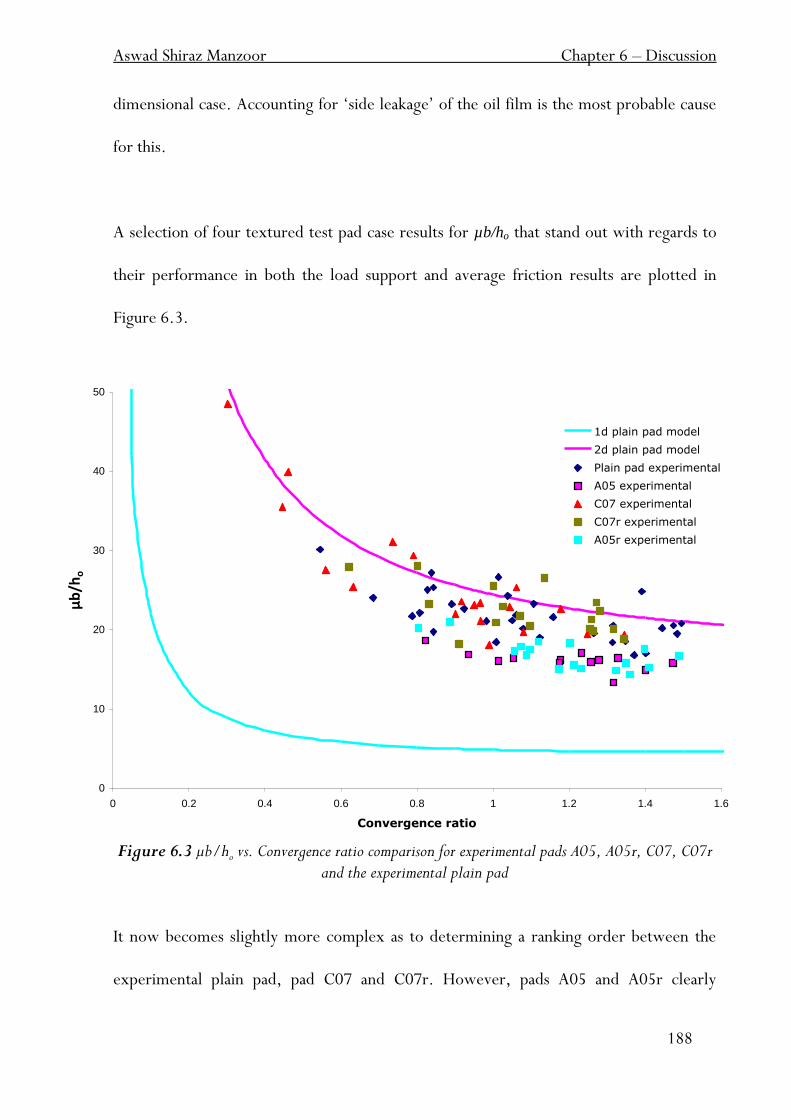
Aswad Shiraz Manzoor Chapter 6 – Discussion
188
0
10
20
30
40
50
0 0.2 0.4 0.6 0.8 1 1.2 1.4 1.6
Convergence ratio
µb/h
o
1d plain pad model
2d plain pad model
Plain pad experimental
A05 experimental
C07 experimental
C07r experimental
A05r experimental
dimensional case. Accounting for „side leakage‟ of the oil film is the most probable cause
for this.
A selection of four textured test pad case results for µb/ho that stand out with regards to
their performance in both the load support and average friction results are plotted in
Figure 6.3.
Figure 6.3 µb/ho vs. Convergence ratio comparison for experimental pads A05, A05r, C07, C07r and the experimental plain pad
It now becomes slightly more complex as to determining a ranking order between the
experimental plain pad, pad C07 and C07r. However, pads A05 and A05r clearly
Aswad Shiraz Manzoor Chapter 6 – Discussion
189
demonstrate their desirability compared to the other pads when an operating
convergence ratio range of approximately 2 and under is called for.
6.3.1 Influence of textured surfaces
Regarding the mechanisms by which texture may affect lubrication in hydrodynamic
bearings, it is proposed that large (and wide) pockets situated near inlet of bearing
perform in a very similar manner to a Rayleigh step bearing. In this end, the increase in
load support by using pad A05 is most likely due to the „entry-bridging‟ effect upon
lubricant entrainment (when pockets are situated near to the inlet of the bearing). The
friction reduction associated with these types of textured bearings is postulated to arise
from the shear stress reduction within the pocked region. However, one may be inclined
to suggest that textured bearings with larger pocket densities would also act in a similar
fashion. This was not the perceived case with the multiple pocketed pads used in this
work. Concerning pocketed bearings with large pocketed areas near the rear of the
bearing (as exhibited by pad A05r) where thinner films and higher pressure regions exist,
shear rate reductions due to the presence of the large pocketed areas may be almost as
effective as large pockets near the inlet. This was shown by the load support graphs
(Section 5.5 Chapter 5) which highlighted similar load support trends for pad A05r when
compared against pad A05. It is unclear at this stage as to why the presence of multiple
pockets placed perpendicular to the flow of oil (as commonly present in a typical
piston/liner interface with a honed surface finish) may have a detrimental effect upon
both load support (as exhibited by pad C07) and friction (as exhibited by pad C07r). As
Aswad Shiraz Manzoor Chapter 6 – Discussion
190
analyses have shown that inlet suction may be more pronounced at low convergence
ratios (K<0.0001), it is near impossible to comment (based upon experimental findings)
as to whether inlet suction may play an underlying role in reducing the coefficient of
friction and increasing the load support for a given film thickness in hydrodynamic
bearings.
6.3.2 Summary
Based upon the test conditions observed, it may be said that the texturing geometries
within pads A05 and A05r would be the wiser choice when compared to an experimental
plain pad. These textures specifically exhibit favourable load support and film thickness
values over a wide range of convergence ratios, as well as a lower overall percentage
reduction in friction compared to a plain experimental pad. Pads C07 and C07r may not
be advisable to use in applications where similar test conditions are experienced as they
tend to deliver poorer performance both in terms of load support (pad C07) and friction
reduction (pad C07r).
6.4 Discussion of Experimental Technique and Future Proposals
This section deals with the validity of the techniques chosen for this current work,
opportunities for improvement and proposed further work. These include such areas as
the experimental methodology and calibration techniques applied.
Aswad Shiraz Manzoor Chapter 6 – Discussion
191
6.4.1 Friction calibration
One of the biggest points of interest that can be considered when referring to the friction
calibration is that of the possibility of deformation of the steel shim used within the
loading arm system. It may be that a transition of the elastic-plastic deformation boundary
occurs during a test, especially at higher friction readings (typically encountered at a high
load/low convergence test condition), but more likely is a slight hysteresis effect
occurring within the shim. This is extremely difficult to detect during a test run.
A possible solution would be to employ the use of a thicker shim. However, this in itself
may have implications with regards to the resolution of the load arm to small changes in
friction as effectively the sensitivity of the friction measurement system is ultimately
reduced.
6.4.2 Load calibration
The current loading calibration process consists of loading the load arm with up to
approximately 40 N prior to testing. As actual test conditions only call for the load arm
to be loaded up to a maximum load of 20 N, this technique may be considered to be
liable for change; the two steel bridging pieces used to couple the load arm to the test pad
holder (i.e. the gimbal) may undergo slight plastic deformation during testing but more
likely is the presence of hysteresis, an issue extremely difficult to detect throughout the
duration of a single test run. This possible plastic deformation will most likely induce

Aswad Shiraz Manzoor Chapter 6 – Discussion
192
errors in the strain gauge readings indicating the applied load, and consequently lead to
load errors.
Again, the use of a thicker section of steel in place of the current pieces may reduce the
chances (and/or the severity) of this error, but at a cost of resolution. Reduced loading
during the calibration process would be advisable.
6.4.3 Film thickness calibration
The wedge technique used to calibrate for film thickness has been one of the major
reworks of the current work. This has led to a drastic improvement over the previous
obsolete interferometry method with regards to accuracy and repeatability of film
thickness calibration. It is not without its potential shortcomings, however. Assumptions
include the accurate positioning and step height measurement of the cover slip attached at
one end of the flat silicon calibration piece. The tolerance of the x-y micrometer stage to
which the camera itself is attached to is effectively 5 µm in both axes. This may have a
small bearing upon the positioning of the camera over a specific film thickness region. A
most viable solution to ensure an accurate calibration would be to introduce the
possibility of using a known „stepped‟ calibration piece in place of a wedge.
6.4.4 Image analysis
The number of images taken over a single location was set to 20 as previously mentioned.
This could be considered as inadequate; particularly if there were pronounced
misalignment issues still inherent within the spinning disc mechanism such as the run-out
Aswad Shiraz Manzoor Chapter 6 – Discussion
193
experienced due to the limited manufacturing process (read accuracy) when producing
the main shaft of the rig. This may ultimately have the potential to cause a difference in
film thickness readings over the sequence of 20 images as „squeeze‟ phenomena may
occur within the film (i.e. those thick films with a low stiffness). No reported issues
caused by vibrations in the camera system were experienced. All z-stage mounts were
adequately dampened between rigid couplings, and efforts were made to remove any
components with moving parts (i.e. fans, motors etc.) away from the bench upon which
the camera system was mounted.
Images were taken at four separate locations over the pad area, but only across three
corners of the test pad. These were concentrated near the edges of the pad, as opposed to
the centre of the pad. This was to ensure that any film thickness measurements did not
include the additional pocket induced film thickness depth. Film thickness imaging may
have been possible at the left hand side of the pad inlet for a few test cases, but frequent
image saturation occurred owing to the uncontrollable tilting of the pad perpendicular to
the direction of travel. It was decided for this reason to only image the oil film at three
corners of the test pad, for all test pads and all test conditions. Increasing the film
thickness during film thickness calibration process would cater for thicker film
measurements, and consequently more frequent imaging at all four corners of the test
pad should be introduced.
Aswad Shiraz Manzoor Chapter 6 – Discussion
194
An important point to note is the theoretical derivation of the final ho value from two
experimental film thickness values (i.e. the average of hoL and hoR). Although strictly
speaking, the value of ho is obtained by averaging two experimental values, it was deemed
accurate in the context of the current work. Related to this, it was shown that relatively
large differences exist between some values of paired hoL and hoR values due to the
presence of the aforementioned tilt. For the sake of continuity, the averaged value of film
thickness was used throughout the entire results analysis. One may be inclined to suggest
that either appropriate modifications to the theoretical analyses are implemented (as the
theoretical analysis does not take into account this tilt that exists experimentally) or that
images are taken directly in the centre line of the test pad in future tests.
A 3x3 pixel matrix, located directly in the centre of the image, was used to give an
average intensity reading from any given image across the 9 pixels. This value was then
used to determine a film thickness value. It may be argued that a larger matrix would be
called for; within reason as image aberration was thought to occur within the image due
to the nature of the curved optics located within the fluorescent cube microscope system.
A thorough review of the optics within the fluorescence imaging system is called for.
6.4.5 Oil entrainment velocity
It is feasible to presume that a velocity gradient may exist in the oil entrainment speed
between the spinning glass disc and the stationary test pad underneath. This is most likely
the reason why the tilt phenomenon exists on the test pad during a test run, as introduced
Aswad Shiraz Manzoor Chapter 6 – Discussion
195
in Section 6.4.4. The radius between the centre line of the test pad and the centre of
rotation for the glass disc is 40 mm. As the pad is 10 mm wide, it is presumed that
theoretically, a difference in oil entrainment speed across the width of the pad in the
region of 25% exists between the outer (45 mm) and inner (35 mm) radii. Again, this is
not currently modelled in the computational analyses. This may address the issue of the
slight differences in absolute values that currently exist between the experimental and
theoretical analyses. A possible solution to alleviate this issue may be to eradicate any tilt
in the perpendicular direction to oil flow by redesigning the pad gimbal entirely.
6.4.6 Oil temperature and viscosity
A presumption of the oil temperature measurements, and consequently the oil viscosity
values associated with those readings, is that the oil temperature is uniform both within
the oil nozzle and over the entire area of the test pad. This may be misleading to a degree
as these experimentally derived oil temperatures are used within Reynolds equation
calculations to ultimately produce both the theoretical minimum film thickness, ho and
non-dimensional load support, W*.
Small temperature differentials present within the oil result in viscosity gradients, as oil
viscosity varies at an inverse exponential rate with temperature. At present, this situation
cannot be improved upon the experimental rig, however, such techniques to improve the
oil temperature monitoring over a wider range of locations would be considered
paramount. The possibility of Infra-Red mapping (using a thermal imaging camera instead
Aswad Shiraz Manzoor Chapter 6 – Discussion
196
of a high sensitivity camera for instance) of the hydrodynamic oil film may be useful in
providing a more suited approach when considering oil temperatures within the contact
zone, and coupled to this would be the introduction of a greater range of oil viscosities to
the test regime in light of the occurrence of cavitation and to mimic temperature effects.
6.4.7 Theoretical Analyses Correction
As stated, there is the utmost need to ensure that the theoretical analyses correctly model
the experimental test rig. The issue of the tilting pad and differences in oil entrainment
velocity need to be addressed swiftly before valid comparisons can be made between the
two sets of results.
6.4.8 Summary
This sub-section has dealt with possible issues arising from the current experimental
technique employed and how they may be dealt with when considering future work. The
two most crucial areas for improvement lie in the accuracy of the current film thickness
technique (both oil film calibration and imaging) and the temperature mapping of the oil
film. Possible correctional techniques have been put forward where necessary. The lack
of many cavitating cases during test runs may indicate the need to further explore the pad
geometry, the design of the test ad gimbal and the need to test various grades (viscosities)
of oils used within the tests.
Aswad Shiraz Manzoor Chapter 6 – Discussion
197
6.5 Summary of discussions
This chapter has reviewed the hydrodynamic test rig results thoroughly. Where observed
advantageous trends and patterns were noticed, possible explanations were provided.
The same applied to where discrepancies and detrimental findings were reported.
Preferred texture choices under certain working conditions were recommended. A
number of issues arising from the current research were listed, and recommendations to
combat these were provided where necessary.

Chapter 7
Conclusions
Aswad Shiraz Manzoor Chapter 7 – Conclusions
199
7.1 Summary of thesis
This thesis has presented experimental research concerning the reported effects of
increased load support and reduction of coefficients of friction of textured bearings
within hydrodynamic applications. This has been achieved by the means of designing and
constructing a novel test rig capable of measuring film thickness, friction and load all
simultaneously. The use of a high sensitivity optical fluorescence imaging system to allow
for the capture of both the film thickness measurements and cavitation in-situ alongside a
high resolution friction detection system has been implemented.
To begin with, the relevant literature was reviewed and recommendations made
regarding the apparent gaps in current knowledge relating to textured bearings in
hydrodynamic applications. This covered such areas as; the underlying theoretical
explanations offered as to why these textured surfaces generate extra load support and
reduction in friction, the current state of play in film thickness measurements and the
precise role (if any) of cavitation occurring within the lubricant fluid film during the
perceived performance improvements.
Secondly, the development of the experimental techniques to be used to determine the
above was presented. Selection criteria for a number of the employed methods were
justified. Accurately produced texture geometries were processed upon optically flat
silicon wafers to replicate textured bearings, and tests were carried out on both plain and
Aswad Shiraz Manzoor Chapter 7 – Conclusions
200
textured pad bearings. From the film thickness results given by the test rig, a novel
technique to determine the convergence ratio of the convergent pad bearing was
introduced. Friction measurements were also monitored. These allowed for the
calculation of load support and coefficients of friction for any given test condition.
Finally, comparisons between the test results for all experimental pads against a limited
theoretical study were made; enabling both the performance of the experimental test
pads and the repeatability of the test rig to be quantitatively evaluated.
7.2 Conclusions
A novel experimental test rig capable of measuring the friction, load and film thickness
present between a spinning glass disc and a loaded flat pad bearing whilst simultaneously
being able to monitor cavitation has been achieved.
It has the capability of being able to detect small changes in friction that occur as a result
of testing various textured bearings as well as thick hydrodynamic lubricant films. It can
be seen quite clearly from the evidence presented that the resultant effects of using
textured bearings can be distinctly observed when comparing data obtained from plain
pad experiments (under equivalent test conditions). Even taking into account scatter of
data within the results, marked differences in load support and reduction of coefficient of
friction were easily observed for those textures consisting of a single large pocket either

Aswad Shiraz Manzoor Chapter 7 – Conclusions
201
near the inlet or outlet of the pad bearing. In some cases, detrimental effects of testing
multiple pocketed pads were measured and reported. At present, more comparisons
between the experimental data (produced as a result of this current work) and a complete
set of theoretical analyses (which are indicative of the test rig) are needed to elucidate the
experimental trends observed. This is with the aim of further increasing the current
limited knowledge regarding the underlying principles of how the introduction of
textured surfaces affect friction and load support in hydrodynamic bearings.
The opinion that this research has been a most worthwhile contribution to the current
state of knowledge regarding the use of microtextured bearings, especially relating to pad
geometries containing a single large pocket, is put forward.
Aswad Shiraz Manzoor References
202
References
[1] Spikes, H.A., Hydrodynamic Lubrication, Tribology Course Notes, Imperial College
London
[2] Dowson, D., Developments in lubrication - the thinning film. J. Phys. D: Appl Phys,
1992. 25: pp 334-339
[3] Tower, B., First report on friction experiments. Proceedings of the institution of
Mechanical Engineers, 1883: pp 632-664
[4] Petrov, N. P., Inzh. Zh. St.Peterb. pp 71-40, pp 227-229, pp 377, pp 535-564
[5] Reynolds, O., On the theory of lubrication and its application to Mr Beauchamp Tower's
experiments, including an experimental determination of the viscosity of olive oil. Philosophical
Transactions of the Royal Society Series A, 1886. A177: pp 157
[6] Dowson, D., Hamrock, B.J., Ball bearing lubrication. The elastohydrodynamics of
elliptical contacts. John Wiley & Sons, 1981
[7] Cameron, A., Basic Lubrication Theory, 2nd ed. Distributed by Wiley, 1976
Longman
Aswad Shiraz Manzoor References
203
[8] Hamilton, D.B., Walowit, J.A., Allen, C.M., 1966, A Theory of Lubrication by
Microirregularities Trans ASME, Journal of Basic Eng., 88, pp 177-185
[9] Anno, J.N., Allen, C.M., Walowit, J.A., 1968, Microasperity Lubrication, Trans.
ASME, Journal of Lubr. Technology, 90, pp 351-355
[10] Anno, J.N., Walowit, J.A., Allen, C.M., Load support and leakage from microasperity
lubricated face seals. Transactions of the ASME Journal of Basic Engineering, 1969: pp 726-
731
[11] Etsion, I., State of the Art in Laser Surface Texturing Trans. ASME J. of Tribology,
2005, 127, pp 248-253
[12] Ryk, G., Kligerman, Y., Etsion, I., 2002, Experimental Investigation of Laser Surface
Texturing for Reciprocating Automotive Components Trib. Trans., 45, pp 444-449
[13] Spikes, H.A., Manzoor, A.S., Fowell, M.T., Olver, A.V., Pegg, I.G, Texture,
friction and cavitation in hydrodynamic bearings, Proceedings 1st Leeds-Lyon Symposium on
Tribology, 2008,
Aswad Shiraz Manzoor References
204
[14] Fowell, M.T., Olver, A.V., Gosman, A.D., Spikes, H.A., Entrainment and Inlet
Suction: Two Mechanisms of Hydrodynamic Lubrication in Textured Bearings, Trans. ASME J.
Trib., 2007 129, pp 336-347
[15] Stephens, L.S., et al., Deterministic micro asperities on bearings and seals using a
modified LIGA process. Journal of Engineering for Gas Turbines and Power-Transactions of
the Asme, 2004. 126(1): pp 147-154
[16] Brizmer, V., Kligerman, Y., Etsion, I., A Laser Surface Textured Parallel Thrust
Bearing, Trib. Trans., 2003, pp 397-403
[17] Olver, A.V., Fowell, M.T., Spikes, H.A., Pegg, I.G., ‘Inlet Suction’, a load support
mechanism in non-convergent, pocketed hydrodyanmic bearings, Proc. Inst. Mech. Eng. J J. Eng.
Trib., 220, 2005 pp 105-108
[18] Tonder, K., Hydrodynamic Effects of Tailored Inlet Roughness: Extended Theory. Trib.
Int., 37, 2004, pp 137-142
[19] Ryk, G., Y. and I. Etsion, Testing piston rings with partial laser surface texturing for
friction reduction, Wear 261, 2006, pp 792-796
Aswad Shiraz Manzoor References
205
[20] Ryk, G., et al., Experimental investigation of partial laser surface texturing for piston-ring
friction reduction. Tribology Transactions, 2005. 48(4): pp 583-588
[21] Etsion, I., Improving the performance of mechanical components by laser surface texturing
Tribology Letters, Vol.17, No.4, 2004
[22] Tonder, K., Inlet Roughness Tribodevices: Dynamic Coefficients and Leakage. Tribology
Int., 2001, 34, pp 847-852
[23] Tateishi, Y., Tribological issues in reducing piston ring friction losses Tribology
International, Vol. 2, No.1, 1994, pp 17-23
[24] Rahnejat H, Balakrishnan S, King PD, et al, In-cylinder friction reduction using a
surface finish optimization technique, Proc. I.MechE. Vol. 220 Part D: J. Automobile
Engineering, 2006, pp 1309-1318
[25] Gangopadhyay, A., McWatt, D.G., The effect of novel surface textures on tappet shims
on valvetrain friction and wear Trib. Trans. 51, 2008, pp 221-230,
[26] Wang, X et al, Loads carrying capacity map for the surface texture design of SiC thrust
bearing sliding in water, 2002, Trib. Inter. 36, pp 189-197
Aswad Shiraz Manzoor References
206
[27] Costa, H., Hutchings, I., Hydrodynamic lubrication of textured steel surfaces under
reciprocating sliding conditions, Trib. Int., 40(8), 2007 pp 1227-1238
[28] Cameron, A. Gohar, R., Theoretical and Experimental Studies of the Oil Film in
Lubricated Point Contact, Proceedings of the Royal Society of London. Series A,
Mathematical and Physical Sciences, 1966. 291(1427): pp 520-536
[29] Kirk, M.T., Hydrodynamic lubrication or Perspex. Nature, 1962. 194: pp 965
[30] Cameron, A., Gohar, R., Nature, 1963. 200: pp 458-459
[31] Hardy, W.B., Collected scientific papers of Sir William Bate Hardy, Cambridge
University Press London 1936: pp 609-623
[32] Wedeven, L.D., Optical measurements in elastohydrodynamic rolling-contact bearings,
Ph.D. Thesis, 1970.
[33] Ford, R.A.J. and C.A. Ford, Laser based fluorescence techniques for measuring thin
liquid films, Wear, 1978. 51: pp 289-297
[34] Poll, G., et al., Dynamic mapping of rotary lip seal lubricant films by fluorescent image
processing, BHRA Conference, Bruges, Belgium 1992.
Aswad Shiraz Manzoor References
207
[35] Hidrovo. C.H., Hart, D.P., Development of a dual purpose visualisation technique for
the study of rotating shaft seals, Proc. 3rd ASME/JSME Joint fluids Engineering conference,
July 18-23 1999 California
[36] Hidrovo. C.H., Hart, D.P., Dual emission laser induced fluorescence technique for oil
film thickness and temperature measurement, Proc. ASME FEDSM‟00, ASME Fluids
Engineering division summer meeting, June 11-15 2000, Boston, MA
[37] Hidrovo. C.H., Hart, D.P., 2D thickness and temperature mapping of fluids by means of
a two-dye laser induced fluorescence ratiometric scheme, Journal of flow visualisation and image
processing, Vol. 9, 2002, pp 171-191
[38] Sugimura, J., M. Hashimoto, and Y. Yamamoto, Study of elastohydrodynamic
contacts with fluorescence microscope. Thinning Films and Tribological Interfaces / Dowson D et
al (Editors), 2000: pp 609-617
[39] Johnston, G.J., Wayte, R. and Spikes, H.A., The measurement and study of very thin
lubricant films in concentrated contacts, Trib. Trans. 34, 2, 1991 pp 187-194
[40] Azushima, A., In lubro 3D measurement of oil film thickness at the interface between tool
and workpiece in sheet drawing using a fluorescence microscope, Tribology International, 2005.
38(2): pp 105-112
Aswad Shiraz Manzoor References
208
[41] Jones et al, Calibration of an optical fluorescence method for film thickness measurement,
Meas, Sci, Technol, 12 2001, pp 23-27
[42] Desevaux et al, Interface measurement technique for liquid film flowing inside small
grooves by laser induced fluorescence, Applied thermal Engineering, 22, 2002, pp 521-534
[43] Hoult et al, Calibration of laser fluorescence measurements of lubricant film thickness in
engines, Int. Fuels and Lubricants, meting and exposition, Portland, Oregon, October 10-
13, 1988
[44] Richardson, D.E., and Borman G.L., Using fiber optics and laser fluorescence for
measuring thin films with application to engines, Int. Fuels and Lubricants, meting and
exposition, Toronto, Canada, October 7-10, 1991
[45] Arcoumanis et al, Measurements of lubricant film thickness in the cylinder of a firing
diesel engine using LIF, Int. Fuels and Lubricants, meting and exposition, San Francisco,
California, Canada, October 7-10, 1991
[46] Nakayama et al, A study of measurement of oil film thickness on engine bearing by using
laser induced fluorescence method, 2003 SAE World Congress, Detroit, March 306, 2003
Aswad Shiraz Manzoor References
209
[47] Broman, G.I., Implications of cavitation in individual grooves of spiral groove bearings.
Proceedings of the Institution of Mechanical Engineers Part J-Journal of Engineering
Tribology, 2001. 215(J5): pp 417-424.
[48] Dowson, D., Taylor, C. M., Fundamental aspects of cavitation in bearings.
Proceedings 1st Leeds-Lyon Symposium on Tribology, 1975: pp 15-28.
[49] Priest, M., D. Dowson, and C.M. Taylor, Theoretical modelling of cavitation in
piston ring lubrication. Proceedings of the Institution of Mechanical Engineers Part C-
Journal of Mechanical Engineering Science, 2000. 214(3): pp 435-447.
[50] Williams, P.R. and R.L. Williams, Cavitation of liquids under dynamic stressing by
pulses of tension. Journal of Physics D-Applied Physics, 2002. 35(17): pp 2222-2230
[51] Arcoumanis, C., and Dellis, P., Cavitation development in the lubricant film of a
reciprocating piston ring assembly, Proc. Inst. Mech. Engs. VOL 218 Part J, J. of
Engineering Tribilogy
[52] Dhunput, A., Teodorescu, M., Investigation of cavitation development in the lubricant
film of piston ring assemblies, Journal Of Physics, Conference series 85, 2007, 012005

Aswad Shiraz Manzoor References
210
[53] Berlman, I. B., Handbook of fluorescence spectra of aromatic molecules, Academic Press,
Pub date 1965.
[54] Pettersson, U., Jacobson, S., Friction and wear properties of microtextured DLC coated
surfaces in boundary lubricated conditions, Tribology Letters, Vol 17 No. 3, October 2004