Embed Size (px)
Citation preview

Fluorescence Correlation Spectroscopy (FCS)
Introduction
In FCS, one usually considers the dynamics of number fluctuations in an open sampling
volume of a macroscopic system that fluctuates about average equilibrium concentrations that
are determined by the surrounding medium and its thermodynamics.
The concentration fluctuations of each species can occur by in situ chemical reactions and by
diffusion of each species in and out of the sampling volume (= laser focus).

Fluorescence Correlation Spectroscopy (FCS)
General principles
1. Confocal
microscopy
3. Time-
correlation
analysis
2. Concentration
& intensity
fluctuations

FCS: 1. Principles of fluorescence confocal microscopy
Diameter 0.3 µm
Height 1 µm
Volume 0.1 fL
1 molecule in 0.1 fL at 20 nM
Double cone of focused laser illumination

FCS: 2. Relation between spatial & temporal concentration fluctuations
and measured fluorescence intensity fluctuationsWebb: Appl Optics 40 (2001) 3969-3983
Local concentration fluctuations
Dj Diffusion constant, Tjk Chemical interaction coefficients representing the relevant reactions
Diffusion Chemical reactions
Integration over sampling volume defines temporal
fluorescence intensity fluctuations:
and in turn fluorescence intensity itself:
Characterizing the focal volume by the spatial detectivityfunction !(r), the fluorescence fluctuations are:
F(t) - <F(t)> =
Reflects the fluctuations of the number of molecules in the volume


!
P x, t( ) =1
4"Dt( )1 2exp #
x2
4Dt
$
% &
'
( )


Fluctuations and time-correlation functions
Consider property A that depends on positions and momenta of all particles in the system.
Due to thermal motion, particles are constantly changing their positions and momenta and so too property A.
As a consequence, the time-dependence of property A(t) will generally resemble a noise pattern.
Example: Consider the pressure on the wall of a cylinder containing a gas in equilibrium.
Pressure on wall at given time is proportional to total force on the wall = function of distance of
particles from the wall. As particles move randomly, total force fluctuates in time and in
consequence also pressure is fluctuating property.
If we could measure pressure changes rapidly by a gauge, the needle of the gauge would
fluctuate rapidly. If we would measure the pressure at a large number of time intervals and note
the average we would measure a fairly reliable pressure of the container, i.e. the average values
measered at different times should yield the same average values.

Properties of time-correlation functions

Properties of time-correlation functions

Overlap ! correlation

Properties of time-correlation functions
!
= A2

Properties of time-correlation functions

Properties of time-correlation functions

Autocorrelation function of the relative fluorescence fluctuations
The form of G(") reflects the dynamics of the fluctuating system. For any fluorescent
species the convolution of the spatial concentration fluctuations with the spatial detectivityfunction #(r) yields the applicable fluorescence correlation function.
Typically, #(r) is approximated as a Gaussian cylinder (2D) or Gaussian ellipsoid (3D).
!
G' "( ) = F t( ) # F t + "( ) = limT$%
1
TF t( ) # F t + "( )dt
0
T
& = F t( )2
+ 'F t( ) # 'F t + "( )
Fluorescence autocorrelation function
!
"F r,t( )
!
"F r',t + #( )

"D = $12 / 4D
$1 = radius of sampling volume
"D
1/N
!
G "( ) =1
N
1
1+"
"D
1
1+4D"
w2
2
#
$
% % % %
&
'
( ( ( (
1
2
The zero time correlation G(0) yields <N> and thus concentration fluctuations <C >
Extracted parameters
For a Gaussian observation volume:
For a standard dye (M=550D), "D = 37 µs
For an antibody (M=140 kD), "D = 235 µs
G(0) is the normalized variance of F(t)

Effects of the concentration & the molecular weight of
the fluorescent species
!
D =kT
6"#r
kT in J ! kg.m2.s-2
%: viscosity of the medium in kg.m-1.s-1
& ' 1.2 g.cm-3 for proteins
1.8 g.cm-3 for nucleic acids
0.9-1.1 g.cm-3 for lipids, etc.
!
r =3M
4"#NA
3
Einstein relation
Hydrodynamic radius
for globular molecules
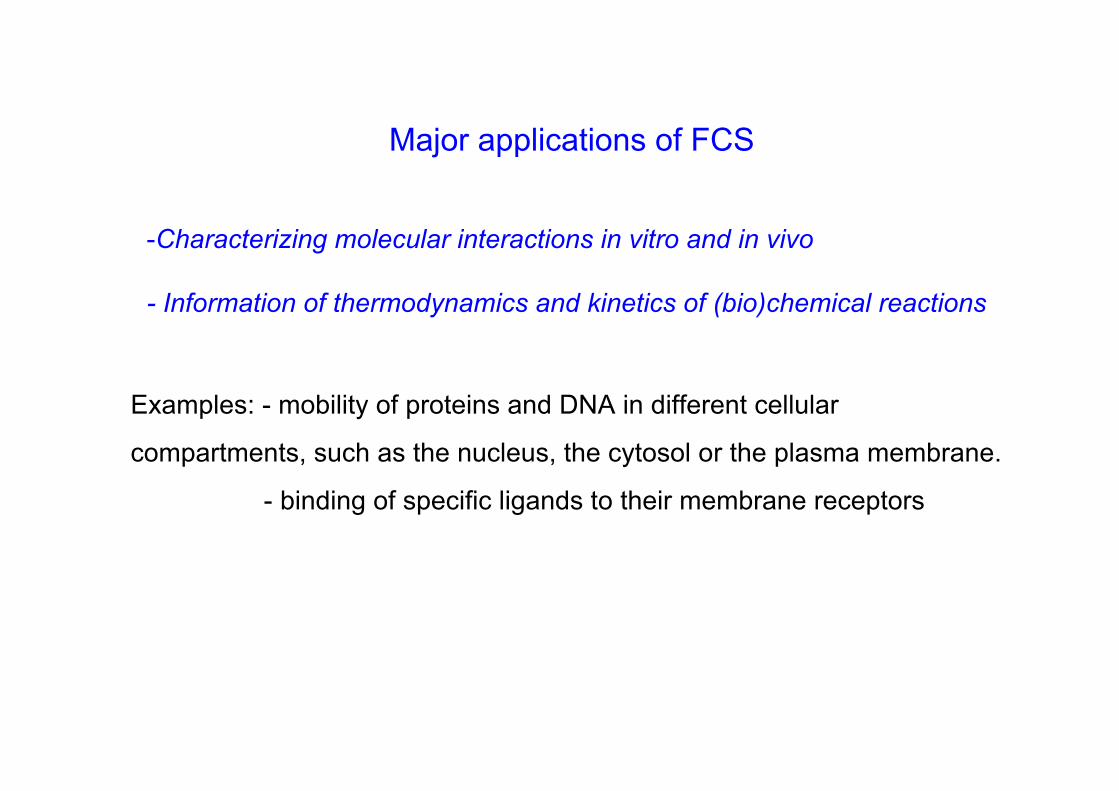
Major applications of FCS
-Characterizing molecular interactions in vitro and in vivo
- Information of thermodynamics and kinetics of (bio)chemical reactions
Examples: - mobility of proteins and DNA in different cellular
compartments, such as the nucleus, the cytosol or the plasma membrane.
- binding of specific ligands to their membrane receptors

Trends Pharmacol Sci July 2000, 266

Fluorescence cross correlation spectroscopy