Embed Size (px)
Citation preview
Lab on a Chip
Publ
ishe
d on
24
Janu
ary
2014
. Dow
nloa
ded
by M
ichi
gan
Tec
hnol
ogic
al U
nive
rsity
on
22/1
0/20
14 1
8:31
:19.
PAPER View Article OnlineView Journal | View Issue
Lab ChipThis journal is © The Royal Society of Chemistry 2014
aWilliam L. Everett Laboratory, Department of Electrical and Computer
Engineering, University of Illinois at Urbana-Champaign, 1406 W. Green St.,
Urbana, IL 61801, USAbMicro and Nanotechnology Lab, University of Illinois at Urbana-Champaign,
208 N. Wright St., Urbana, IL 61801, USAc 1270 Digital Computer Laboratory, Department of Bioengineering, University of
Illinois at Urbana-Champaign, 1304 W. Springfield Ave., Urbana, IL 61801, USA.
E-mail: [email protected]
† Electronic supplementary information (ESI) available. See DOI: 10.1039/c3lc51278a‡ Present address: Nabsys, Inc., 60 Clifford St., Providence, RI 02903, USA.§ Present address: Massachusetts Institute of Technology, 77 MassachusettsAve, Cambridge, MA 02139, USA.
Cite this: Lab Chip, 2014, 14, 1469
Received 15th November 2013,Accepted 24th January 2014
DOI: 10.1039/c3lc51278a
www.rsc.org/loc
Flow metering characterization within anelectrical cell counting microfluidic device†
U. Hassan,ab N. N. Watkins,‡ab C. Edwards§b and R. Bashir*bc
Microfluidic devices based on the Coulter principle require a small aperture for cell counting. For
applications using such cell counting devices, the volume of the sample also needs to be metered to
determine the absolute cell count in a specific volume. Hence, integrated methods to characterize and
meter the volume of a fluid are required in these microfluidic devices. Here, we present fluid flow
characterization and electrically-based sample metering results of blood through a measurement
channelwith a cross-section of 15 μm × 15 μm (i.e. the Coulter aperture). Red blood cells in whole blood
are lysed and the remaining fluid, consisting of leukocytes, erythrocyte cell lysate and various reagents,
is flown at different flow rates through the measurement aperture. The change in impedance across
the electrodes embedded in the counting channel shows a linear relationship with the increase in the
fluid flow rate. We also show that the fluid volume can be determined by measuring the decrease in
pulse width, and increase in number of cells as they pass through the counting channel per unit time.
Introduction
Integrated flow metering is essential in lab-on-a-chip andmicrofluidic devices. Microfluidic cell counters based on theCoulter counting principle use a small cross-sectional channelor aperture with micro-fabricated electrodes. The impedanceacross the electrodes increases as a cell passes through thechannel and a voltage spike, of which the amplitude is pro-portional to the cell’s size and the width is proportional tothe cell's velocity, is produced. The change in impedance alsodepends on the flow rate at which the fluid is flowing, thusproviding an opportunity to meter the fluid volume. Errors inthe measurement of a fluid volume can come from the vari-ance in the device channel dimensions, introduction of bub-bles, or fluid dead volumes. This could become a significantproblem for single blood drop point-of-care devices as only afew microliters of blood is used in these measurements.
Many have shown that flow metering is possible using dif-ferent sensing mechanisms such as periodic flapping motiondetection,1 thermistor based temperature difference detectionwith varying flow rates,2 atomic emission detection usingradio RF plasma for nanoscale flow rate metering,3 rapidscanning using a laser-induced self-mixing effect,4 and othermethods. The heat sensing mechanism works by measuringthe temperature difference in a micro channel across twopoints. However, such sensors are complicated in design asthey require heat sensing using (2 reference and 3 sensing)thermistors, and a heat sink to provide insulation on thesame device.2 A microfluidic flow sensor based on a Venturitube design was shown to meter the volume of deionizedwater but requires the maintenance of a stable vacuum.5
The flow of an electrolyte in a microfluidic channel isgiven by a parabolic profile when the flow is laminar(Reynolds number < 1) and would result in the redistributionof ions within the electric double layer in the channel.6–8 Whenthe AC voltage is applied across the channel electrodes, theions respond to the electrical fields across the electrodes.9 Theelectro-kinetic effects result in ionic redistribution, which thenresults in changing the electrical impedance across theelectrodes. Thus, the flow of the fluid in a micro channel canbe related to the change in impedance across the microelectrodes.10–12 The different parameters, including the ampli-tude of AC voltage, the frequency of the signal, the conductivityof the electrolyte, and the dimensions of the electrodes, needto be optimized for better sensitivity.6,13 With an increase inflow rate, the mass transport increases due to an increase inthe ionic concentration. The mass transport limited current,
, 2014, 14, 1469–1476 | 1469
Lab on a ChipPaper
Publ
ishe
d on
24
Janu
ary
2014
. Dow
nloa
ded
by M
ichi
gan
Tec
hnol
ogic
al U
nive
rsity
on
22/1
0/20
14 1
8:31
:19.
View Article Online
iL, increases as it is directly proportional to the cube root ofthe volumetric flow rate, Q, of the fluid, as given by eqn (1)below.6,14
i nF D Q w l h wL bulk A e A 0 925 2 3 1 3 2 23. [ ] // / (1)
where, n is the number of electrons transferred, F is theFaraday constant, l is the electrode length, h is the half-heightof the cell, w is the width of the cell, we is the electrode widthand DA is the diffusion coefficient.6
Performing flow metering in a microfluidic device withhuman blood has many applications in clinical diagnosticdevices.15,16 Recently, we reported a cell counting device forHIV/AIDS diagnostics that takes a drop of blood to countthe CD4+ T cells with high accuracy at point-of-care.17 Usingthat device design, we show here that we can meter the fluidsample using the same electrodes used to count the cells.In our bio-chip, the whole blood is mixed with a lysing bufferto lyse all erythrocytes and preserve the leukocytes. The
1470 | Lab Chip, 2014, 14, 1469–1476
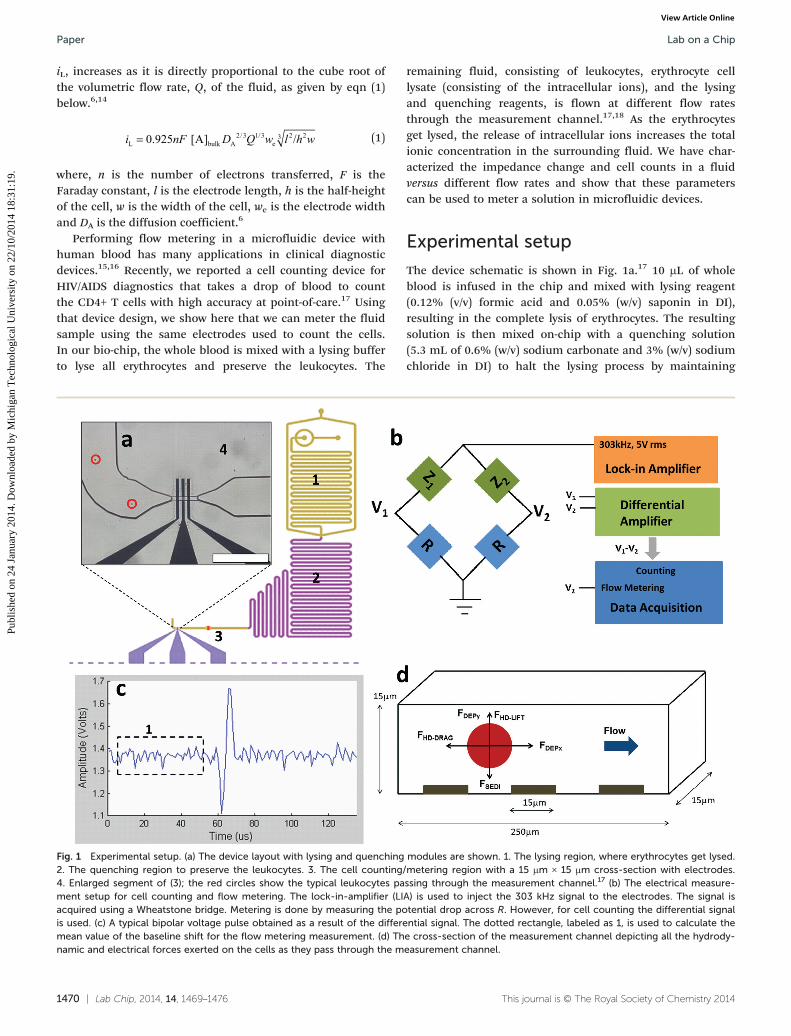
Fig. 1 Experimental setup. (a) The device layout with lysing and quenching2. The quenching region to preserve the leukocytes. 3. The cell counting/4. Enlarged segment of (3); the red circles show the typical leukocytes pament setup for cell counting and flow metering. The lock-in-amplifier (LIacquired using a Wheatstone bridge. Metering is done by measuring the pois used. (c) A typical bipolar voltage pulse obtained as a result of the differemean value of the baseline shift for the flow metering measurement. (d) Thnamic and electrical forces exerted on the cells as they pass through the m
remaining fluid, consisting of leukocytes, erythrocyte celllysate (consisting of the intracellular ions), and the lysingand quenching reagents, is flown at different flow ratesthrough the measurement channel.17,18 As the erythrocytesget lysed, the release of intracellular ions increases the totalionic concentration in the surrounding fluid. We have char-acterized the impedance change and cell counts in a fluidversus different flow rates and show that these parameterscan be used to meter a solution in microfluidic devices.
Experimental setup
The device schematic is shown in Fig. 1a.17 10 μL of wholeblood is infused in the chip and mixed with lysing reagent(0.12% (v/v) formic acid and 0.05% (w/v) saponin in DI),resulting in the complete lysis of erythrocytes. The resultingsolution is then mixed on-chip with a quenching solution(5.3 mL of 0.6% (w/v) sodium carbonate and 3% (w/v) sodiumchloride in DI) to halt the lysing process by maintaining
This journal is © The Royal Society of Chemistry 2014
modules are shown. 1. The lysing region, where erythrocytes get lysed.metering region with a 15 μm × 15 μm cross-section with electrodes.ssing through the measurement channel.17 (b) The electrical measure-A) is used to inject the 303 kHz signal to the electrodes. The signal istential drop across R. However, for cell counting the differential signalntial signal. The dotted rectangle, labeled as 1, is used to calculate thee cross-section of the measurement channel depicting all the hydrody-easurement channel.
Lab on a Chip Paper
Publ
ishe
d on
24
Janu
ary
2014
. Dow
nloa
ded
by M
ichi
gan
Tec
hnol
ogic
al U
nive
rsity
on
22/1
0/20
14 1
8:31
:19.
View Article Online
the pH and osmolarity of the solution and thus preservingthe remaining leukocytes.18 The lysed blood solution passesthrough the measurement channel with a cross-section of15 μm × 15 μm with micro-fabricated electrodes used forboth cell counting and flow metering. Fig. 1a also shows theelectrodes with the measurement (counting/metering) chan-nel and the leukocytes (encircled in red) passing throughthe channel. The electronic measurement setup for flowcharacterization is shown in Fig. 1b. Z1 and Z2 represent theimpedance in between the middle and the side electrodesand R is the 10 kΩ resistance connected as part of the Wheat-stone bridge circuit. The input signal of 5 V at 303 kHz is fedto the middle electrode. Two different referenced signals arecollected, first, a differential V1–V2 signal for cell countingusing a differential amplifier, and second, a V1 or V2 voltagesignal that is ground referenced. Fig. 1c shows the differen-tial signal, which is a bipolar pulse for each passage of a cellacross the electrodes. The height of the pulse depends onthe size of the cell and the distance above the electrodes,whereas the pulse width depends on the flow rate. As weshow later, the baseline of the signal also depends on theflow rate of the solution and its average value can be used tometer the flow rate.
A cell while flowing through the measurement channelexperiences mechanical and electrical forces as shown inFig. 1d. The sedimentation force, hydrodynamic drag force,hydrodynamic lift force and dielectrophoresis force areexerted on the cell and can alter its trajectory, thus resultingin a change of the electrical signal obtained.
This journal is © The Royal Society of Chemistry 2014
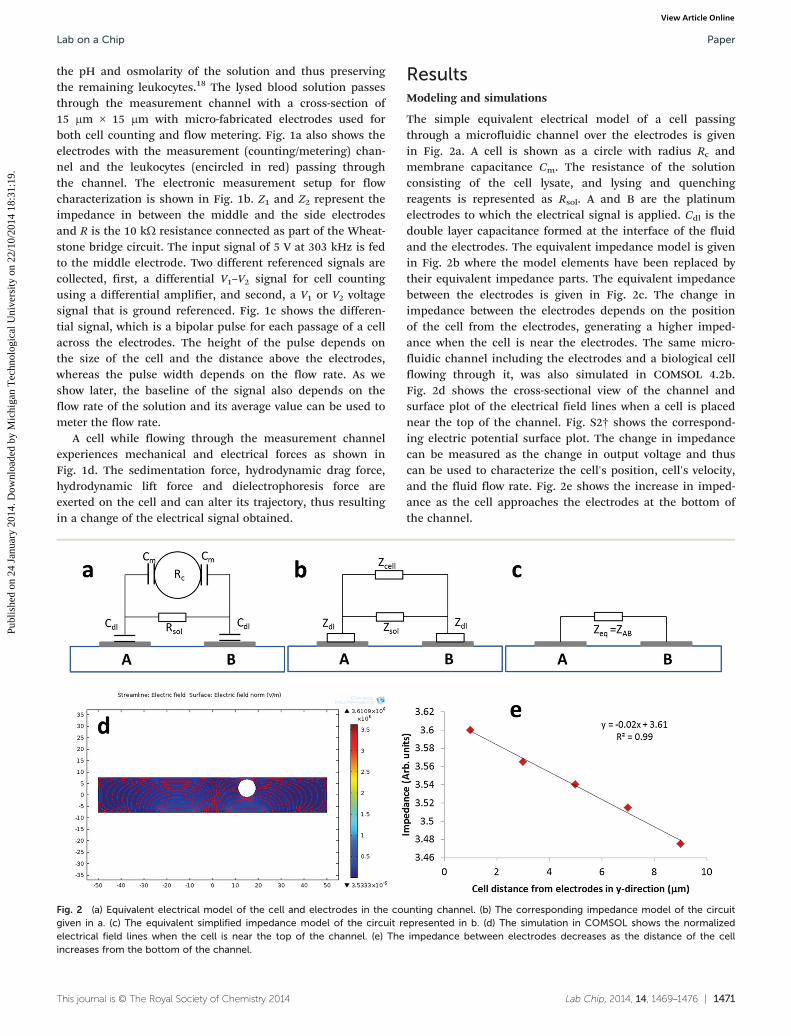
Fig. 2 (a) Equivalent electrical model of the cell and electrodes in the cogiven in a. (c) The equivalent simplified impedance model of the circuit relectrical field lines when the cell is near the top of the channel. (e) Theincreases from the bottom of the channel.
ResultsModeling and simulations
The simple equivalent electrical model of a cell passingthrough a microfluidic channel over the electrodes is givenin Fig. 2a. A cell is shown as a circle with radius Rc andmembrane capacitance Cm. The resistance of the solutionconsisting of the cell lysate, and lysing and quenchingreagents is represented as Rsol. A and B are the platinumelectrodes to which the electrical signal is applied. Cdl is thedouble layer capacitance formed at the interface of the fluidand the electrodes. The equivalent impedance model is givenin Fig. 2b where the model elements have been replaced bytheir equivalent impedance parts. The equivalent impedancebetween the electrodes is given in Fig. 2c. The change inimpedance between the electrodes depends on the positionof the cell from the electrodes, generating a higher imped-ance when the cell is near the electrodes. The same micro-fluidic channel including the electrodes and a biological cellflowing through it, was also simulated in COMSOL 4.2b.Fig. 2d shows the cross-sectional view of the channel andsurface plot of the electrical field lines when a cell is placednear the top of the channel. Fig. S2† shows the correspond-ing electric potential surface plot. The change in impedancecan be measured as the change in output voltage and thuscan be used to characterize the cell's position, cell's velocity,and the fluid flow rate. Fig. 2e shows the increase in imped-ance as the cell approaches the electrodes at the bottom ofthe channel.
Lab Chip, 2014, 14, 1469–1476 | 1471
unting channel. (b) The corresponding impedance model of the circuitepresented in b. (d) The simulation in COMSOL shows the normalizedimpedance between electrodes decreases as the distance of the cell
Lab on a ChipPaper
Publ
ishe
d on
24
Janu
ary
2014
. Dow
nloa
ded
by M
ichi
gan
Tec
hnol
ogic
al U
nive
rsity
on
22/1
0/20
14 1
8:31
:19.
View Article Online
Flow characterization with signal baseline shift
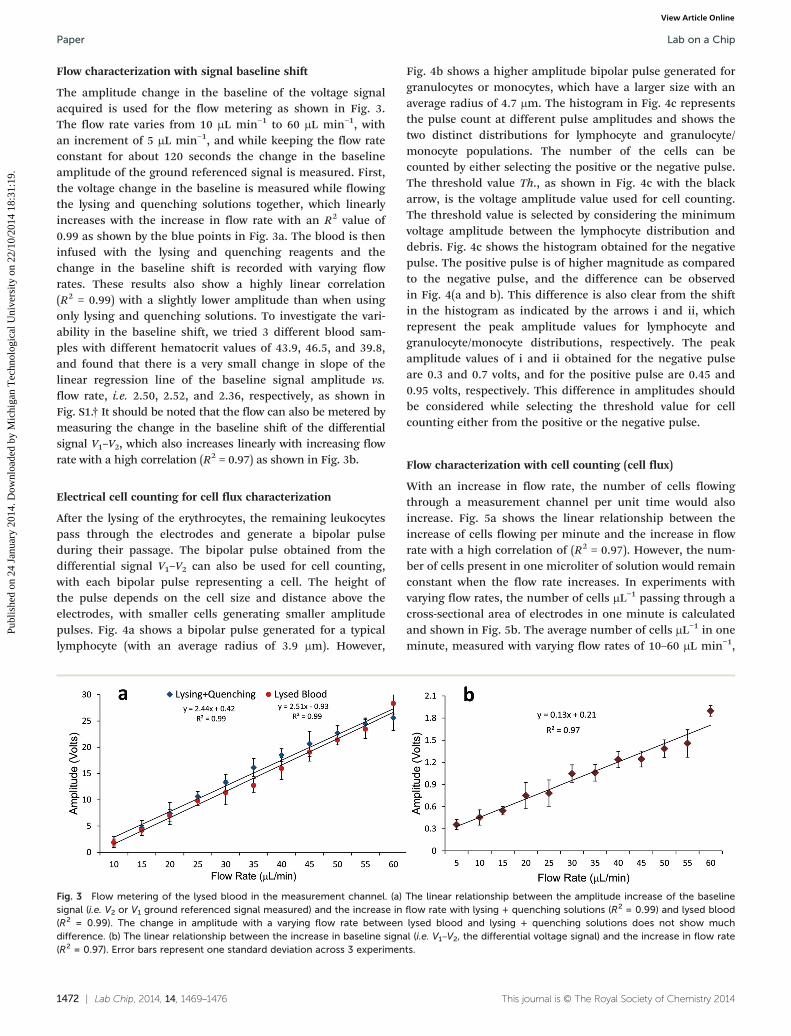
The amplitude change in the baseline of the voltage signalacquired is used for the flow metering as shown in Fig. 3.The flow rate varies from 10 μL min−1 to 60 μL min−1, withan increment of 5 μL min−1, and while keeping the flow rateconstant for about 120 seconds the change in the baselineamplitude of the ground referenced signal is measured. First,the voltage change in the baseline is measured while flowingthe lysing and quenching solutions together, which linearlyincreases with the increase in flow rate with an R2 value of0.99 as shown by the blue points in Fig. 3a. The blood is theninfused with the lysing and quenching reagents and thechange in the baseline shift is recorded with varying flowrates. These results also show a highly linear correlation(R2 = 0.99) with a slightly lower amplitude than when usingonly lysing and quenching solutions. To investigate the vari-ability in the baseline shift, we tried 3 different blood sam-ples with different hematocrit values of 43.9, 46.5, and 39.8,and found that there is a very small change in slope of thelinear regression line of the baseline signal amplitude vs.flow rate, i.e. 2.50, 2.52, and 2.36, respectively, as shown inFig. S1.† It should be noted that the flow can also be metered bymeasuring the change in the baseline shift of the differentialsignal V1–V2, which also increases linearly with increasing flowrate with a high correlation (R2 = 0.97) as shown in Fig. 3b.
Electrical cell counting for cell flux characterization
After the lysing of the erythrocytes, the remaining leukocytespass through the electrodes and generate a bipolar pulseduring their passage. The bipolar pulse obtained from thedifferential signal V1–V2 can also be used for cell counting,with each bipolar pulse representing a cell. The height ofthe pulse depends on the cell size and distance above theelectrodes, with smaller cells generating smaller amplitudepulses. Fig. 4a shows a bipolar pulse generated for a typicallymphocyte (with an average radius of 3.9 μm). However,
1472 | Lab Chip, 2014, 14, 1469–1476
Fig. 3 Flow metering of the lysed blood in the measurement channel. (a)signal (i.e. V2 or V1 ground referenced signal measured) and the increase in(R2 = 0.99). The change in amplitude with a varying flow rate betweendifference. (b) The linear relationship between the increase in baseline signa(R2 = 0.97). Error bars represent one standard deviation across 3 experimen
Fig. 4b shows a higher amplitude bipolar pulse generated forgranulocytes or monocytes, which have a larger size with anaverage radius of 4.7 μm. The histogram in Fig. 4c representsthe pulse count at different pulse amplitudes and shows thetwo distinct distributions for lymphocyte and granulocyte/monocyte populations. The number of the cells can becounted by either selecting the positive or the negative pulse.The threshold value Th., as shown in Fig. 4c with the blackarrow, is the voltage amplitude value used for cell counting.The threshold value is selected by considering the minimumvoltage amplitude between the lymphocyte distribution anddebris. Fig. 4c shows the histogram obtained for the negativepulse. The positive pulse is of higher magnitude as comparedto the negative pulse, and the difference can be observedin Fig. 4(a and b). This difference is also clear from the shiftin the histogram as indicated by the arrows i and ii, whichrepresent the peak amplitude values for lymphocyte andgranulocyte/monocyte distributions, respectively. The peakamplitude values of i and ii obtained for the negative pulseare 0.3 and 0.7 volts, and for the positive pulse are 0.45 and0.95 volts, respectively. This difference in amplitudes shouldbe considered while selecting the threshold value for cellcounting either from the positive or the negative pulse.
Flow characterization with cell counting (cell flux)
With an increase in flow rate, the number of cells flowingthrough a measurement channel per unit time would alsoincrease. Fig. 5a shows the linear relationship between theincrease of cells flowing per minute and the increase in flowrate with a high correlation of (R2 = 0.97). However, the num-ber of cells present in one microliter of solution would remainconstant when the flow rate increases. In experiments withvarying flow rates, the number of cells μL−1 passing through across-sectional area of electrodes in one minute is calculatedand shown in Fig. 5b. The average number of cells μL−1 in oneminute, measured with varying flow rates of 10–60 μL min−1,
This journal is © The Royal Society of Chemistry 2014
The linear relationship between the amplitude increase of the baselineflow rate with lysing + quenching solutions (R2 = 0.99) and lysed bloodlysed blood and lysing + quenching solutions does not show muchl (i.e. V1–V2, the differential voltage signal) and the increase in flow ratets.
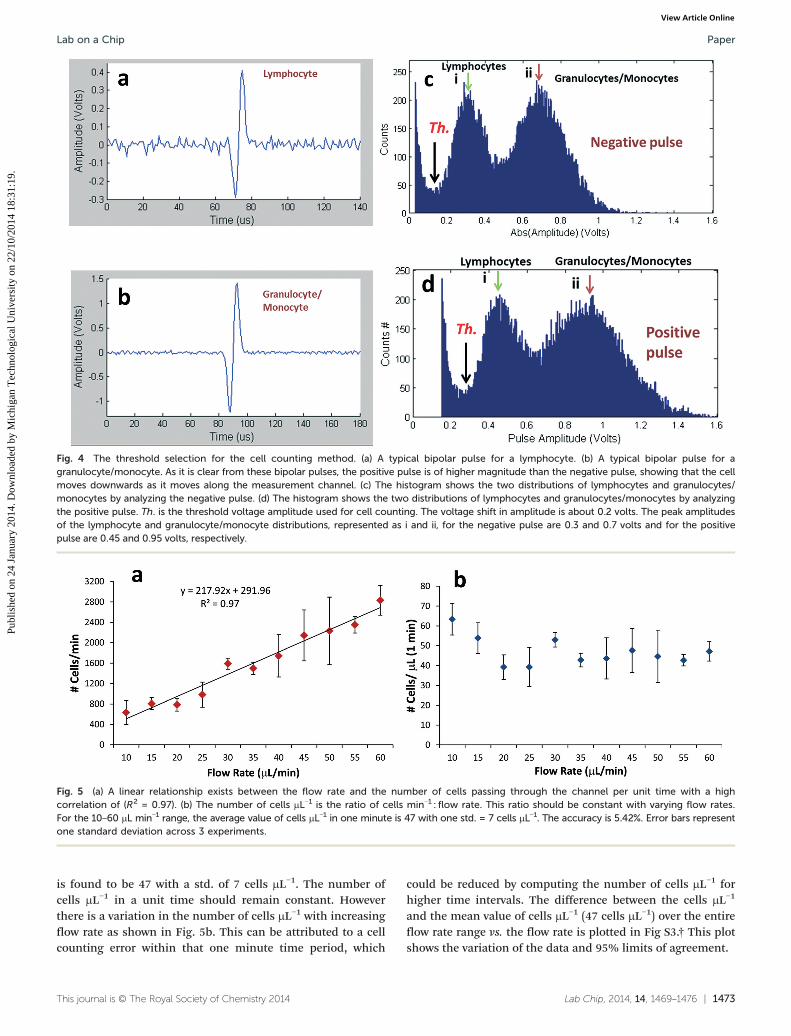
Fig. 4 The threshold selection for the cell counting method. (a) A typical bipolar pulse for a lymphocyte. (b) A typical bipolar pulse for agranulocyte/monocyte. As it is clear from these bipolar pulses, the positive pulse is of higher magnitude than the negative pulse, showing that the cellmoves downwards as it moves along the measurement channel. (c) The histogram shows the two distributions of lymphocytes and granulocytes/monocytes by analyzing the negative pulse. (d) The histogram shows the two distributions of lymphocytes and granulocytes/monocytes by analyzingthe positive pulse. Th. is the threshold voltage amplitude used for cell counting. The voltage shift in amplitude is about 0.2 volts. The peak amplitudesof the lymphocyte and granulocyte/monocyte distributions, represented as i and ii, for the negative pulse are 0.3 and 0.7 volts and for the positivepulse are 0.45 and 0.95 volts, respectively.
Fig. 5 (a) A linear relationship exists between the flow rate and the number of cells passing through the channel per unit time with a highcorrelation of (R2 = 0.97). (b) The number of cells μL−1 is the ratio of cells min−1 : flow rate. This ratio should be constant with varying flow rates.For the 10–60 μL min−1 range, the average value of cells μL−1 in one minute is 47 with one std. = 7 cells μL−1. The accuracy is 5.42%. Error bars representone standard deviation across 3 experiments.
Lab on a Chip Paper
Publ
ishe
d on
24
Janu
ary
2014
. Dow
nloa
ded
by M
ichi
gan
Tec
hnol
ogic
al U
nive
rsity
on
22/1
0/20
14 1
8:31
:19.
View Article Online
is found to be 47 with a std. of 7 cells μL−1. The number ofcells μL−1 in a unit time should remain constant. Howeverthere is a variation in the number of cells μL−1 with increasingflow rate as shown in Fig. 5b. This can be attributed to a cellcounting error within that one minute time period, which
This journal is © The Royal Society of Chemistry 2014
could be reduced by computing the number of cells μL−1 forhigher time intervals. The difference between the cells μL−1
and the mean value of cells μL−1 (47 cells μL−1) over the entireflow rate range vs. the flow rate is plotted in Fig S3.† This plotshows the variation of the data and 95% limits of agreement.
Lab Chip, 2014, 14, 1469–1476 | 1473
Lab on a ChipPaper
Publ
ishe
d on
24
Janu
ary
2014
. Dow
nloa
ded
by M
ichi
gan
Tec
hnol
ogic
al U
nive
rsity
on
22/1
0/20
14 1
8:31
:19.
View Article Online
Flow metering with a change in pulse width
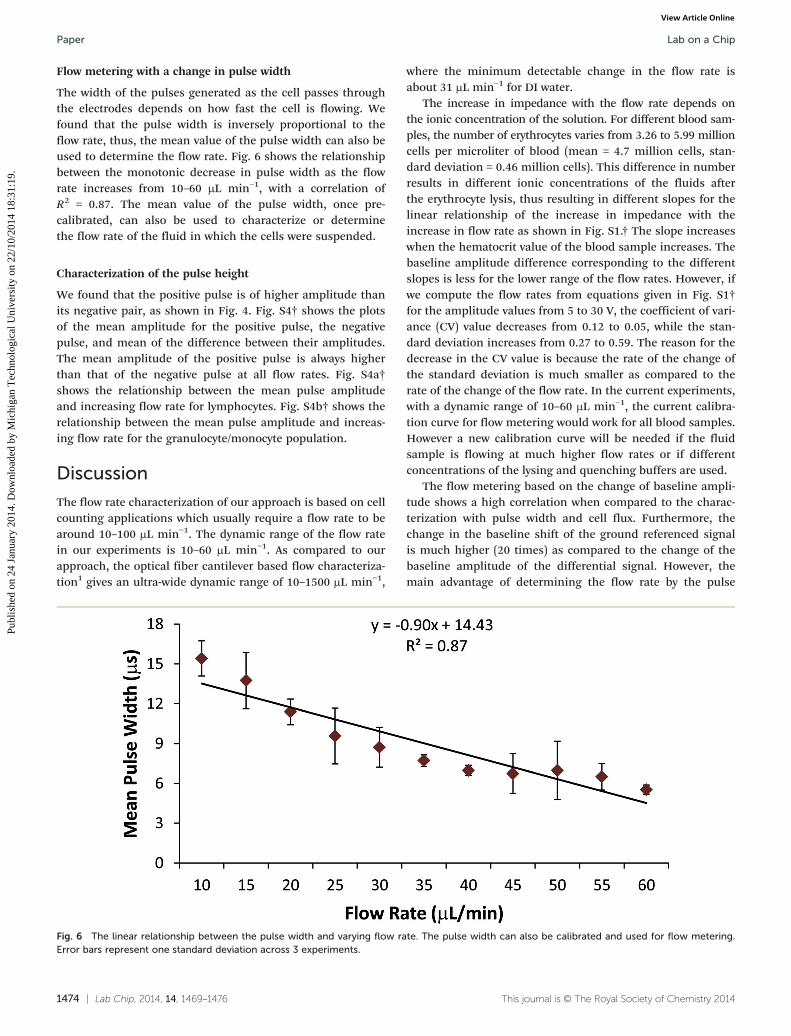
The width of the pulses generated as the cell passes throughthe electrodes depends on how fast the cell is flowing. Wefound that the pulse width is inversely proportional to theflow rate, thus, the mean value of the pulse width can also beused to determine the flow rate. Fig. 6 shows the relationshipbetween the monotonic decrease in pulse width as the flowrate increases from 10–60 μL min−1, with a correlation ofR2 = 0.87. The mean value of the pulse width, once pre-calibrated, can also be used to characterize or determinethe flow rate of the fluid in which the cells were suspended.
Characterization of the pulse height
We found that the positive pulse is of higher amplitude thanits negative pair, as shown in Fig. 4. Fig. S4† shows the plotsof the mean amplitude for the positive pulse, the negativepulse, and mean of the difference between their amplitudes.The mean amplitude of the positive pulse is always higherthan that of the negative pulse at all flow rates. Fig. S4a†shows the relationship between the mean pulse amplitudeand increasing flow rate for lymphocytes. Fig. S4b† shows therelationship between the mean pulse amplitude and increas-ing flow rate for the granulocyte/monocyte population.
Discussion
The flow rate characterization of our approach is based on cellcounting applications which usually require a flow rate to bearound 10–100 μL min−1. The dynamic range of the flow ratein our experiments is 10–60 μL min−1. As compared to ourapproach, the optical fiber cantilever based flow characteriza-tion1 gives an ultra-wide dynamic range of 10–1500 μL min−1,
1474 | Lab Chip, 2014, 14, 1469–1476
Fig. 6 The linear relationship between the pulse width and varying flow raError bars represent one standard deviation across 3 experiments.
where the minimum detectable change in the flow rate isabout 31 μL min−1 for DI water.
The increase in impedance with the flow rate depends onthe ionic concentration of the solution. For different blood sam-ples, the number of erythrocytes varies from 3.26 to 5.99 millioncells per microliter of blood (mean = 4.7 million cells, stan-dard deviation = 0.46 million cells). This difference in numberresults in different ionic concentrations of the fluids afterthe erythrocyte lysis, thus resulting in different slopes for thelinear relationship of the increase in impedance with theincrease in flow rate as shown in Fig. S1.† The slope increaseswhen the hematocrit value of the blood sample increases. Thebaseline amplitude difference corresponding to the differentslopes is less for the lower range of the flow rates. However, ifwe compute the flow rates from equations given in Fig. S1†for the amplitude values from 5 to 30 V, the coefficient of vari-ance (CV) value decreases from 0.12 to 0.05, while the stan-dard deviation increases from 0.27 to 0.59. The reason for thedecrease in the CV value is because the rate of the change ofthe standard deviation is much smaller as compared to therate of the change of the flow rate. In the current experiments,with a dynamic range of 10–60 μL min−1, the current calibra-tion curve for flow metering would work for all blood samples.However a new calibration curve will be needed if the fluidsample is flowing at much higher flow rates or if differentconcentrations of the lysing and quenching buffers are used.
The flow metering based on the change of baseline ampli-tude shows a high correlation when compared to the charac-terization with pulse width and cell flux. Furthermore, thechange in the baseline shift of the ground referenced signalis much higher (20 times) as compared to the change of thebaseline amplitude of the differential signal. However, themain advantage of determining the flow rate by the pulse
This journal is © The Royal Society of Chemistry 2014
te. The pulse width can also be calibrated and used for flow metering.
Lab on a Chip Paper
Publ
ishe
d on
24
Janu
ary
2014
. Dow
nloa
ded
by M
ichi
gan
Tec
hnol
ogic
al U
nive
rsity
on
22/1
0/20
14 1
8:31
:19.
View Article Online
width is that it is independent of the small changes in theionic concentration that may arise due to the difference inred blood cell concentration in the blood samples. However,the flow metering based on the cell flux is more sensitiveto the variation of the number of blood cells in differentsamples. The strength of the proposed approach is that byacquiring a single voltage differential signal, the baselineamplitude, cell flux and pulse width, all can be measured.Thus, using a single signal, the flow rate characterization canbe done by all techniques.
The accuracy in estimating the flow rate with the numberof cells passing through the counting channel per unit timedepends on the cell density in the solution. In healthy indi-viduals, there are on average about 6000 leukocytes μL−1 witha standard deviation of 500–800 cells μL−1. This variation indensity of cells in a sample could be a source of error. Forevery 5 μL min−1 change in flow rate, the mean change of cellflux is about 220 cells min−1, as shown in Fig. 5a. A 10% vari-ation in the blood cell count would produce a change ofaround 30 cells. This would limit the flow rate detection toapproximately 2 μL min−1. However, for all clinical blood cellcounting applications there will be much more variation inthe cell concentration range. Furthermore, for simultaneouslyperforming cell counting and flow metering characterization,the cell flux approach cannot be applied directly. In suchapplications, the volume will be metered by the baseline shiftor pulse width method and the cell concentration will becomputed, which can be further used to meter the volume.
The amplitude impedance change between the positiveand negative pulse could have resulted due to the applicationof hydrodynamic forces on the cells as they pass through themeasurement channel, thus changing the relative position ofthe cell to the electrodes. The high flow rates 20–60 μL min−1
would result in a significant drag force greater than the sedi-mentation and the lift force (ESI†).19,20 However, it shouldalso be noted that the fabrication inaccuracies between thethree electrodes, due to the small variation in the platinumdeposition and the electronics, might also be the source oferror for the variation in the impedance amplitude of thepulses. Another possibility is the increase in hydrophobicityof the polydimethylsiloxane (PDMS) devices over time. Oxy-gen plasma treatment of PDMS results in producing reactivesilanol groups on the surface which reorient back to thebulk over time during “hydrophobic recovery”. An increase inhydrophobicity also increases the fluid contact angle on thePDMS surface, which might create more resistance to thefluid flow and could be a source of error of amplitude varia-tion in the pulse. The measurement of this amplitude changeis important while selecting the threshold value for the posi-tive or negative pulse for accurate cell counting and in turnflow characterization through cell flux.
Conclusions
In this paper, a microfluidic cell counter is characterized forelectrically metering the sample volume using the same
This journal is © The Royal Society of Chemistry 2014
electrodes that are used to count the cells. We demonstratethat there is a linear increase in the signal impedance asthe flow rate is increased. We also show that the volumetricflow rate can be characterized electrically and that the pulsewidth decreases and cell counts per unit time increases withthe increase in flow rate. These approaches can be very usefulin measuring the sample volume in electrically based cellcounting devices.
Materials and methodsChip fabrication
The platinum electrodes were patterned on a Pyrex glass sub-strate by evaporating a 25 nm Ti adhesion layer and 75 nm Ptconduction layer and then lifting off undesired metal usingstandard photolithographic metal lift off procedures. Micro-fluidic channels were created by patterning a SU-8 thick nega-tive photoresist (Microchem) as a negative master in whichpolydimethylsiloxane (PDMS) was poured and cured. Fluidicinlets and outlets were cored into the cured PDMS chipsbefore permanently bonding them to the glass/electrode layerusing oxygen plasma bonding.
Blood sample collection
The blood samples used in the study were collected fromUniversity of Illinois student volunteers through proper Insti-tutional Review Board (IRB) approval. Blood was drawn viavenipuncture into EDTA-coated BD Vacutainers (BD Biosci-ences). After the blood draw, the blood was kept on a samplerotisserie at room temperature until used for the experimentson the same day.
Modelling equations
Equations in Fig. 3, 5, and 6 do not represent a physical rela-tionship between the flow rate and voltage amplitude, pulsewidth or cell flux. The equations are not dimensionally con-sistent as well. These equations represent the modellingequations to characterize the flow rate from voltage ampli-tude, pulse width or cell flux.
Acknowledgements
The authors would like to acknowledge the help ofG. Damhorst for drawing the blood from healthy studentdonors. Funding: R. Bashir acknowledges the support ofthe NSF NSEC at OSU grant number EEC-0914790, NationalScience Foundation Industry-University Collaborative ResearchCenter for Agricultural, Biomedical, and PharmaceuticalNanotechnology at the University of Illinois at Urbana-Champaign, and funding from the University of Illinois,Urbana-Champaign.
References
1 V. Lien and F. Vollmer, Lab Chip, 2007, 7, 1352.
Lab Chip, 2014, 14, 1469–1476 | 1475
Lab on a ChipPaper
Publ
ishe
d on
24
Janu
ary
2014
. Dow
nloa
ded
by M
ichi
gan
Tec
hnol
ogic
al U
nive
rsity
on
22/1
0/20
14 1
8:31
:19.
View Article Online
2 H. Ernst, A. Jachimowicz and G. Urban, Sens. Actuators, A,
2002, 100, 54.3 T. Nakagama, T. Maeda, K. Uchiyama and T. Hobo, Analyst,
2003, 128, 543.4 R. Kliese, Y. Lim, E. Stefan, J. Perchoux, S. Wilson and
A. Rakić, Conference on Optoelectronic and MicroelectronicMaterials and Devices (COMMAD), Canberra, Australia, 2010,pp. 7–8.5 H. Yu, D. Li, K. Xu, R. Roberts and N. Tien, Conference on
the Advances in Optoelectronics and Micro/Nano-Optics (AOM),Guangzhou, China, 2010, pp. 1–5.6 H. Ayliffe and R. Rabbitt, Meas. Sci. Technol., 2003, 14, 1321.
7 R. F. Probstein, Physicochemical Hydrodynamics, John Wiley& Sons, Inc., Hoboken, 2nd edn, 2003.8 B. J. Kirby and E. F. Hasselbrink Jr., Electrophoresis, 2004,
25, 187.9 P. D. I. Fletcher, S. J. Haswell and X. Zhang, Lab Chip, 2001,
1(2), 115.10 J. A. Cooper and R. G. Compton, Electroanalysis, 1998,
10, 141.
1476 | Lab Chip, 2014, 14, 1469–1476
11 K. Y. Tam, J. P. Larsen, B. A. Coles and R. G. Compton,
J. Electroanal. Chem., 1996, 407, 23.12 A. C. Fisher, Electrode Dynamics, Oxford Chemistry Primers,
Oxford University Press, Oxford, 1996.13 J. Collins and A. Lee, Lab Chip, 2004, 4, 7.
14 V. G. Levich, Physicochemical Hydrodynamics, Prentice Hall,Englewood Cliffs, NJ, 1962.15 I. Moser, G. Jobst and G. Urban, Laboratory on chip for
clinical applications, in Micro-total Analysis Systems, KluwerAcademic Publishers, Dordrecht, 1998.
16 E. H. Ernst, A. Jachimowicz and G. Urban, Proceedings of the
Conference Eurosensors XIV, Copenhagen, Denmark, 2000.17 N. N. Watkins, U. Hassan, G. Damhorst, H. Ni, A. Vaid,
W. Rodriguez and R. Bashir, Sci. Transl. Med., 2013, 5,214ra170.18 N. N. Watkins, S. Sridhar, X. Cheng, G. D. Chen, M. Toner,
W. Rodriguez and R. Bashir, Lab Chip, 2011, 11, 1437.19 H. Li and R. Bashir, Biomed. Microdevices, 2004, 6, 289.
20 H. Li, Y. Zheng, D. Akin and R. Bashir, Journal ofMicroelectromechanical Systems, 2005, 14, 103–112.
This journal is © The Royal Society of Chemistry 2014