Embed Size (px)
Citation preview
Flow Induced Vibration
A Review of Current Assessment Methods
David Fielding, Matt Straw (Norton Straw Consultants)
Alex Graham, Phil Shorter (CD-adapco)
Introduction
Presenting a joint study into flow-induced vibration (FIV) by – Norton Straw Consultants
– CD-adapco
Summary of work presented more fully at – Institution of Mechanical Engineering Offshore Engineering 2015
– Designing for Flow Induced Vibration with Simulation - Webinar on CD-adapco website (linked from Norton Straw news page)
Flow Induced Vibration (FIV) and assessment – Energy Institute Guidelines approach
– Use of CFD & FEA (STAR-CCM+® & wave6)
Background to FIV
Flow Induced Vibration - flow internal to structures that, due to a number of mechanisms, may cause vibration of the structure
If oscillation frequencies are close to the natural frequencies of the structure, resonance can occur – leading to excessive and potentially damaging vibration e.g. fatigue or fretting
We will present a case study that : – Introduces current energy industry practice
– Demonstrates what simulation has to offer us
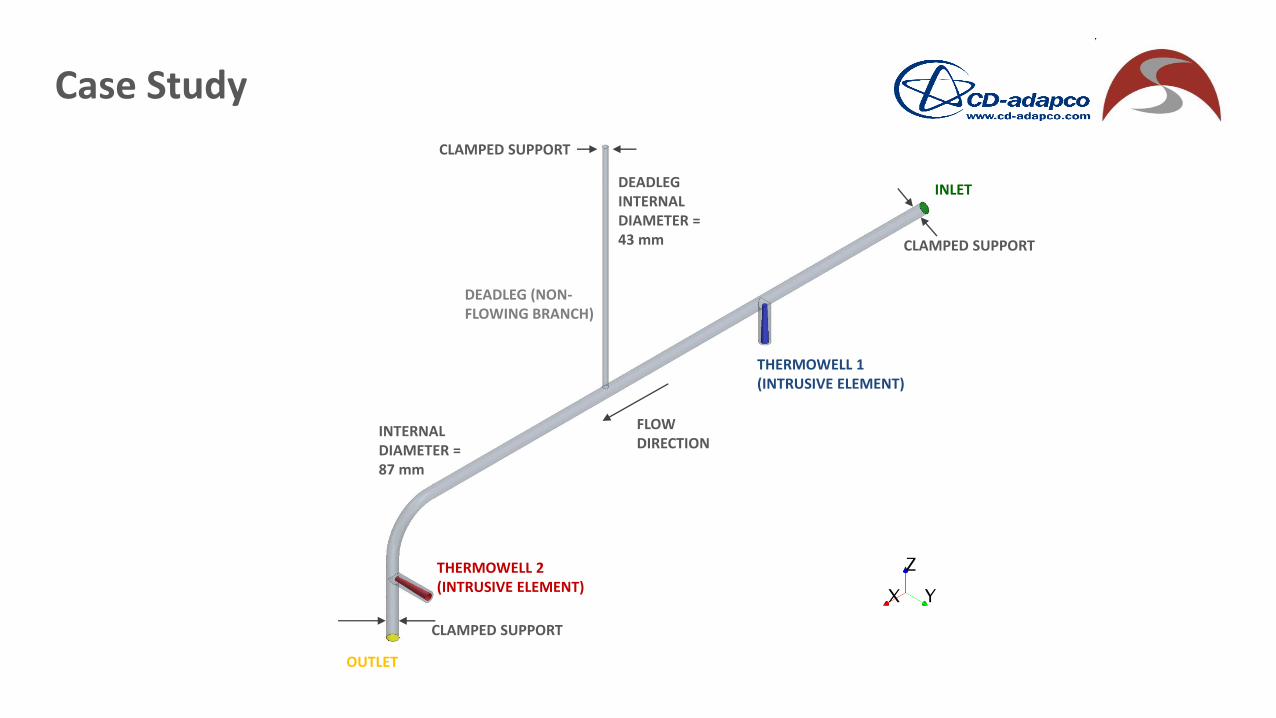
Case Study
INLET
OUTLET
THERMOWELL 2 (INTRUSIVE ELEMENT)
THERMOWELL 1 (INTRUSIVE ELEMENT)
DEADLEG (NON-FLOWING BRANCH)
FLOW DIRECTION
CLAMPED SUPPORT
CLAMPED SUPPORT
INTERNAL DIAMETER = 87 mm
DEADLEG INTERNAL DIAMETER = 43 mm
CLAMPED SUPPORT

Typical Approach – EI Guidelines
Energy Institute guidelines allow the potential for FIV to be assessed*
A case study is presented initially using the EI guidelines approach
The same case is then evaluated further using CFD and FEA methods
* Guidelines for the avoidance of vibration induced fatigue failure in process pipework, Energy Institute, 2nd edition
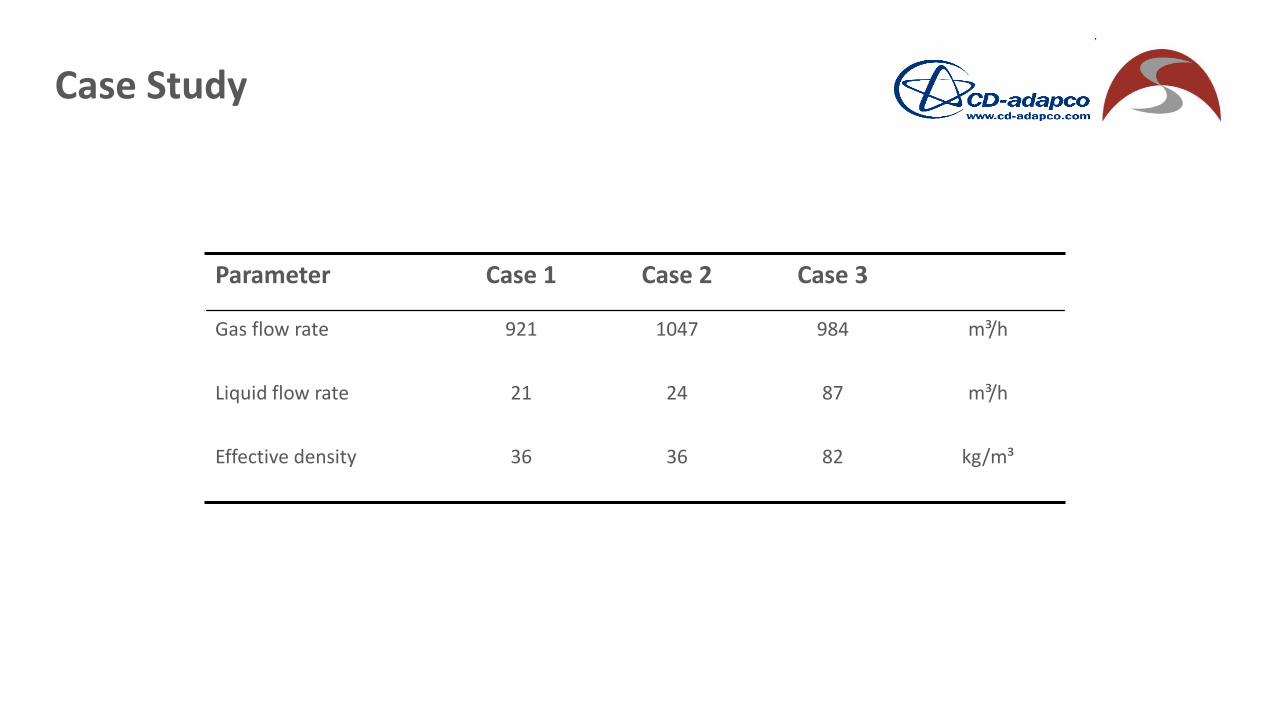
Case Study
Parameter Case 1 Case 2 Case 3
Gas flow rate 921 1047 984 m³/h
Liquid flow rate 21 24 87 m³/h
Effective density 36 36 82 kg/m³
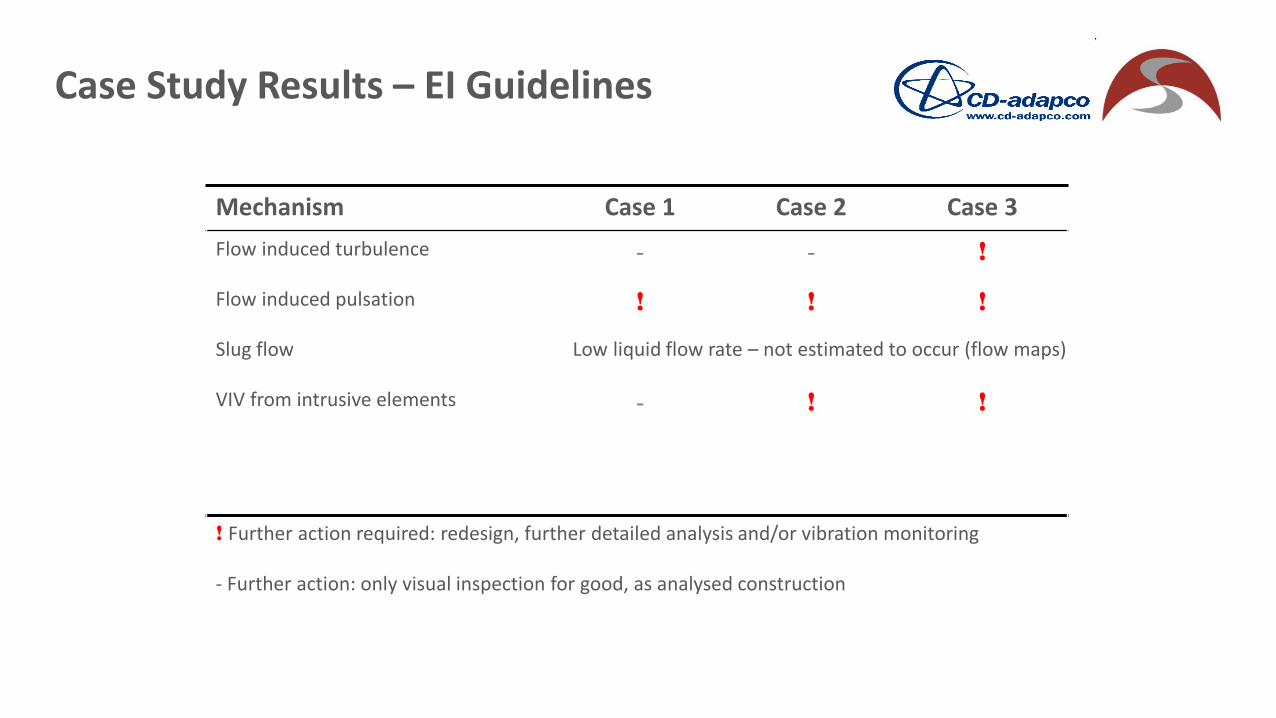
Case Study Results – EI Guidelines
Mechanism Case 1 Case 2 Case 3
Flow induced turbulence - - !
Flow induced pulsation ! ! !
Slug flow
VIV from intrusive elements -
! !
Small bore connections
! ! !
! Further action required: redesign, further detailed analysis and/or vibration monitoring
- Further action: only visual inspection for good, as analysed construction
Low liquid flow rate – not estimated to occur (flow maps)
Case Study Results – EI Guidelines
Corrective actions suggested by the EI guidelines vary for the likelihood of failure (LOF) predicted: – Redesigning or re-supporting the line or
– Carrying out detailed analysis and/or
– Carrying out vibration monitoring
Detailed analysis is not defined – Change in design is often the most simple action (and then re-evaluating using the EI
guidelines approach)
– Design changes may be not be possible
– Re-design may be unnecessary if the EI approach is providing an over-conservative answer
So what detailed analysis could we do?
What can CFD and FEA offer us?
CFD: Local flow modeling of specific phenomena e.g. – Flow-induced turbulence
– Impact of intrusive elements
– Pulsation
– Cavitation
– Multiphase flow e.g. presence of slugging
System-wide modelling – CFD to assess flow mechanisms and input to
– Finite Element Analysis (FEA) to assess • Natural frequencies of system
• How the flow-induced forces may excite the system
Coupled CFD & FEA analysis could offer the complete solution
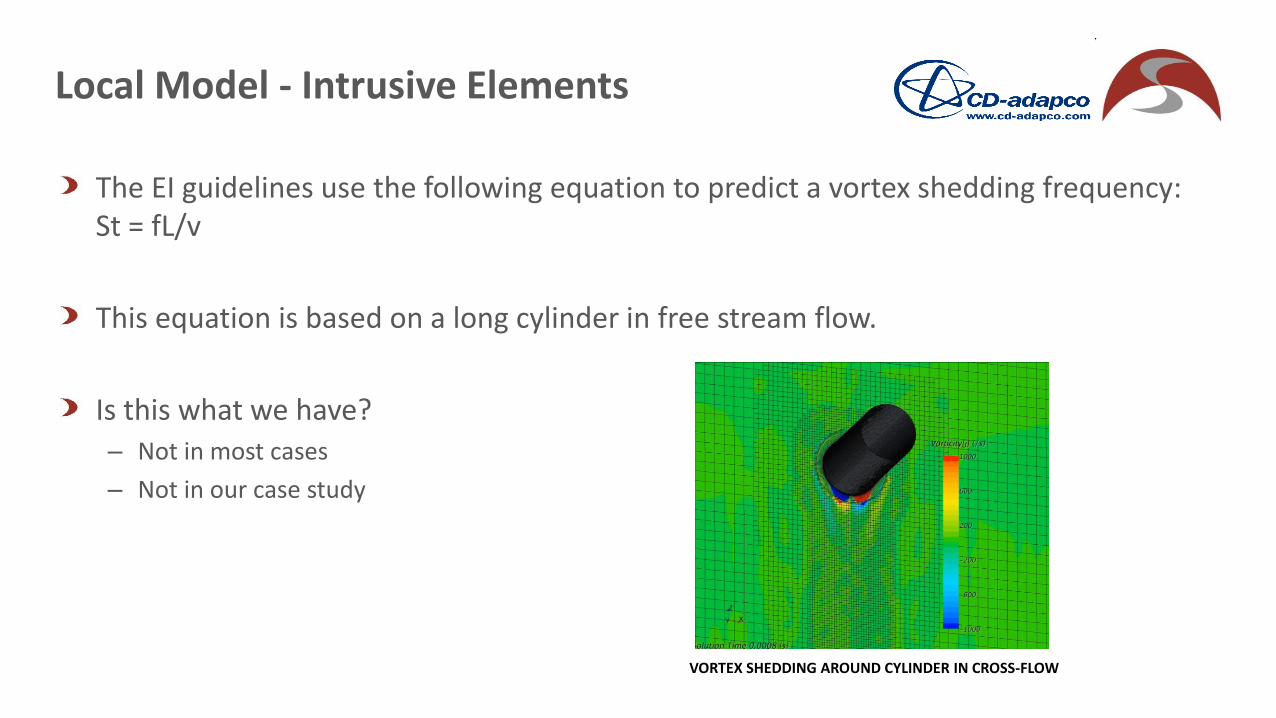
Local Model - Intrusive Elements
The EI guidelines use the following equation to predict a vortex shedding frequency: St = fL/v
This equation is based on a long cylinder in free stream flow.
Is this what we have? – Not in most cases
– Not in our case study
VORTEX SHEDDING AROUND CYLINDER IN CROSS-FLOW

Intrusive Elements
SKETCH OF THERMOWELL GEOMETRY
FLOW AROUND INTRUSIVE ELEMENT IS DIFFERENT TO LONG CYLINDER IN FREE STREAM
Using CFD need to be consider:
– Time step size
– Grid resolution
– Turbulence modelling

Whole System Analysis
CFD simulation can be used in conjunction with a finite element structural model
Here STAR-CCM+ (CFD) was used with wave6 (FEA) – CFD to assess the frequencies of flow phenomena
– FEA enables the assessment of whether flow frequencies coincide with natural frequencies of the system
A transient flow solution from STAR-CCM+ imported for random vibration analysis in wave6 – a frequency domain aero-vibro-acoustic solver – Summary of this presented here
Whole System Analysis
Flow modeling: – Unsteady (time accurate)
– Volume of Fluid method for multi-phase flow (VOF)
– Large Eddy Simulation (LES) turbulence model
– Ideal gas law applied to gas phase, liquid phase assumed to be incompressible
Objectives: – Predict internal flow regime
– Record transient wall pressure data, apply this to FE structural model in wave6
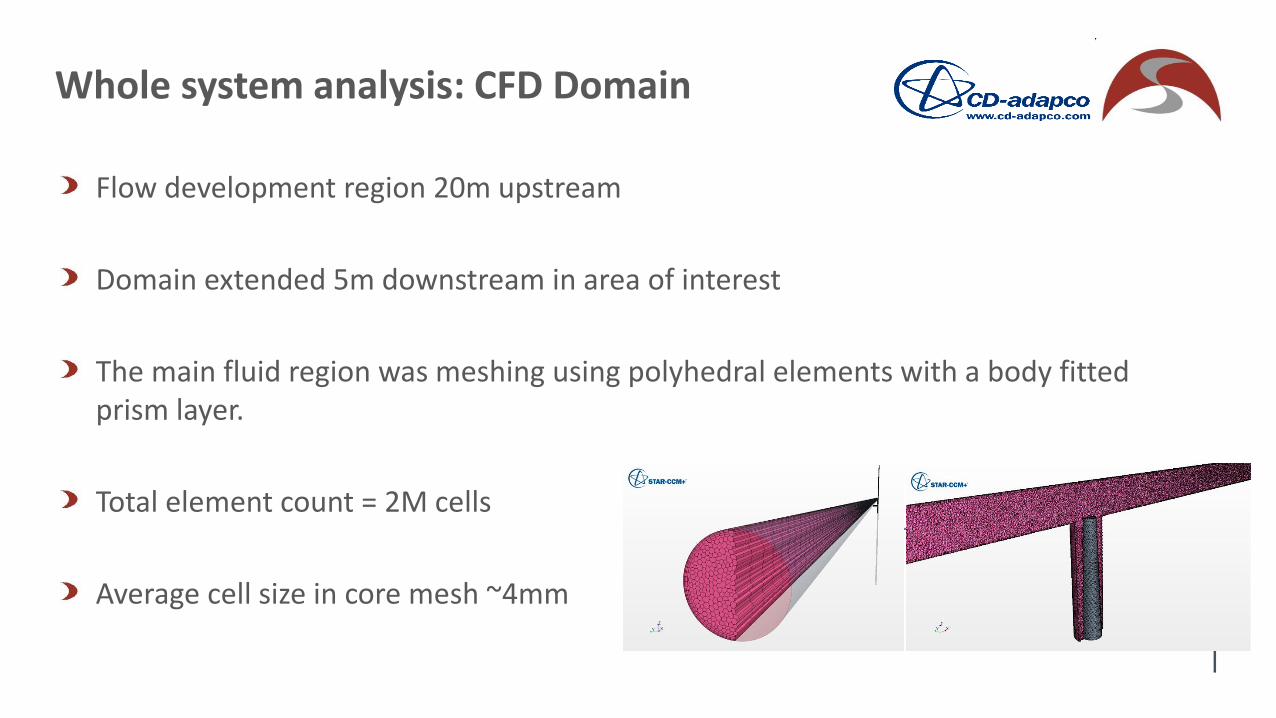
Whole system analysis: CFD Domain
Flow development region 20m upstream
Domain extended 5m downstream in area of interest
The main fluid region was meshing using polyhedral elements with a body fitted prism layer.
Total element count = 2M cells
Average cell size in core mesh ~4mm
Flow Direction
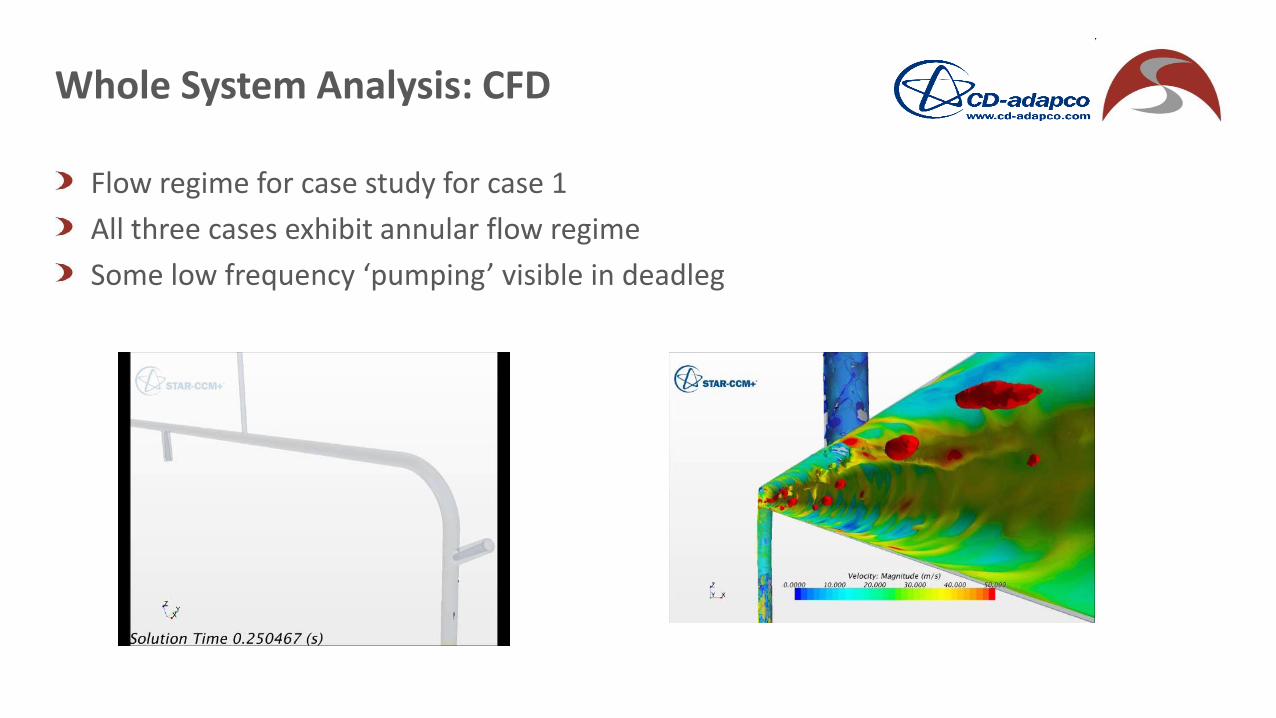
Flow regime for case study for case 1
All three cases exhibit annular flow regime
Some low frequency ‘pumping’ visible in deadleg
Whole System Analysis: CFD
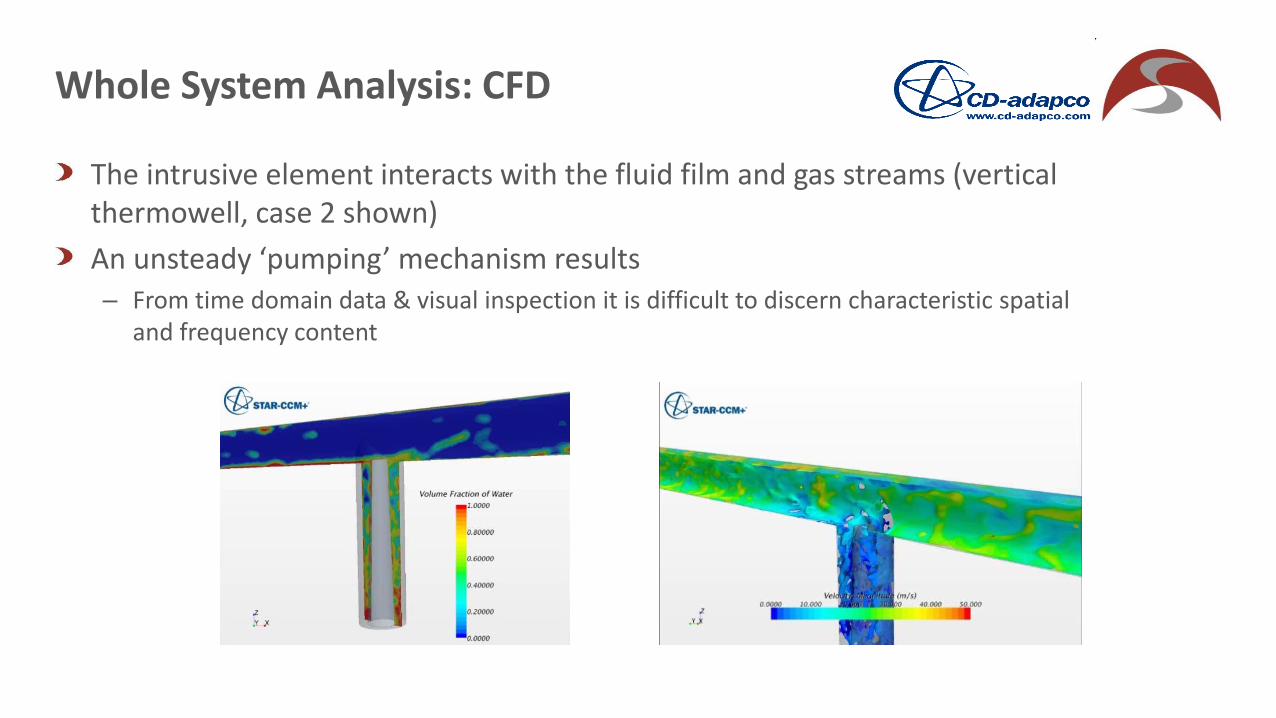
The intrusive element interacts with the fluid film and gas streams (vertical thermowell, case 2 shown)
An unsteady ‘pumping’ mechanism results – From time domain data & visual inspection it is difficult to discern characteristic spatial
and frequency content
Whole System Analysis: CFD
Frequency Domain Analysis
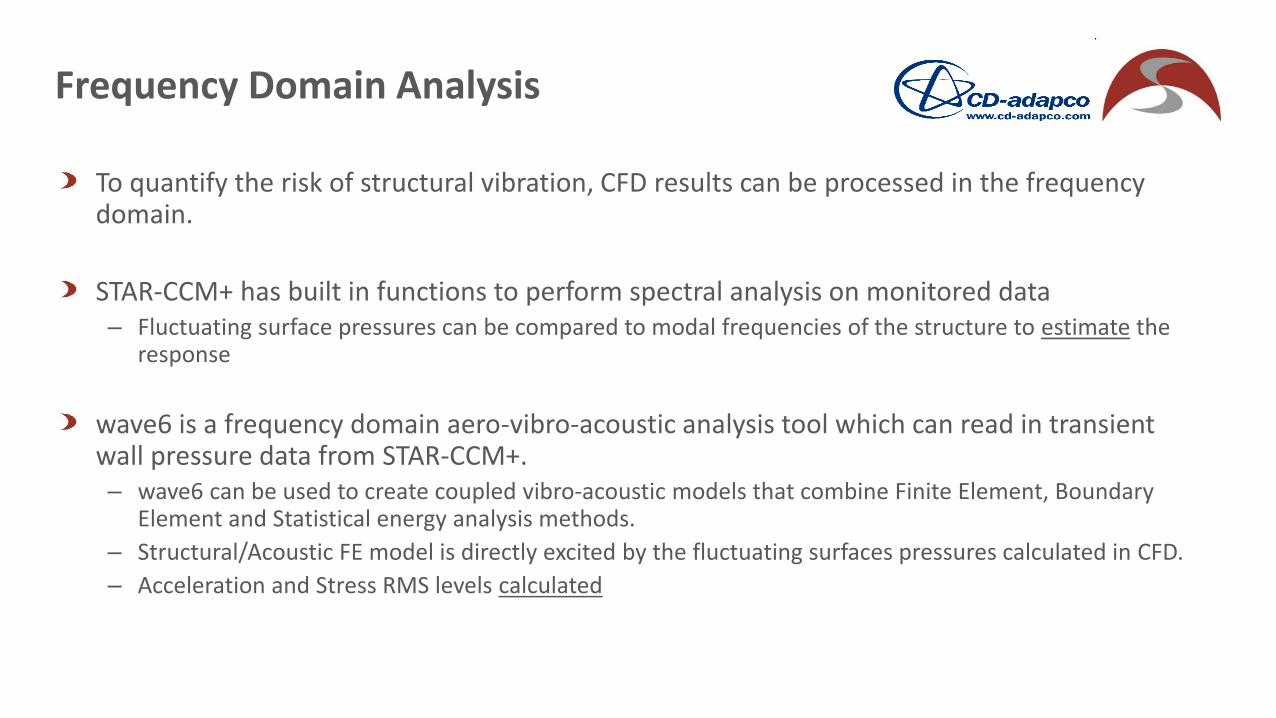
To quantify the risk of structural vibration, CFD results can be processed in the frequency domain.
STAR-CCM+ has built in functions to perform spectral analysis on monitored data – Fluctuating surface pressures can be compared to modal frequencies of the structure to estimate the
response
wave6 is a frequency domain aero-vibro-acoustic analysis tool which can read in transient wall pressure data from STAR-CCM+. – wave6 can be used to create coupled vibro-acoustic models that combine Finite Element, Boundary
Element and Statistical energy analysis methods.
– Structural/Acoustic FE model is directly excited by the fluctuating surfaces pressures calculated in CFD.
– Acceleration and Stress RMS levels calculated
A
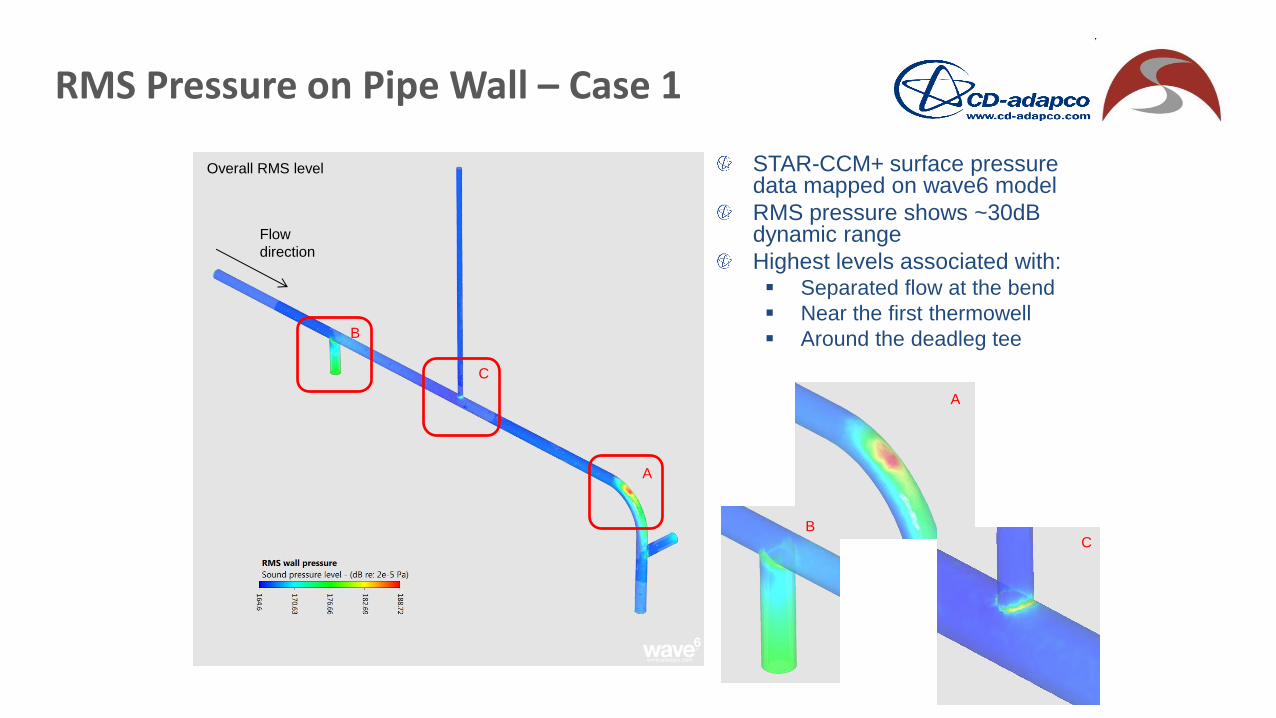
STAR-CCM+ surface pressure data mapped on wave6 model
RMS pressure shows ~30dB dynamic range
Highest levels associated with: Separated flow at the bend
Near the first thermowell
Around the deadleg tee
RMS Pressure on Pipe Wall – Case 1
Overall RMS level
B
C
A
B C
Flow
direction
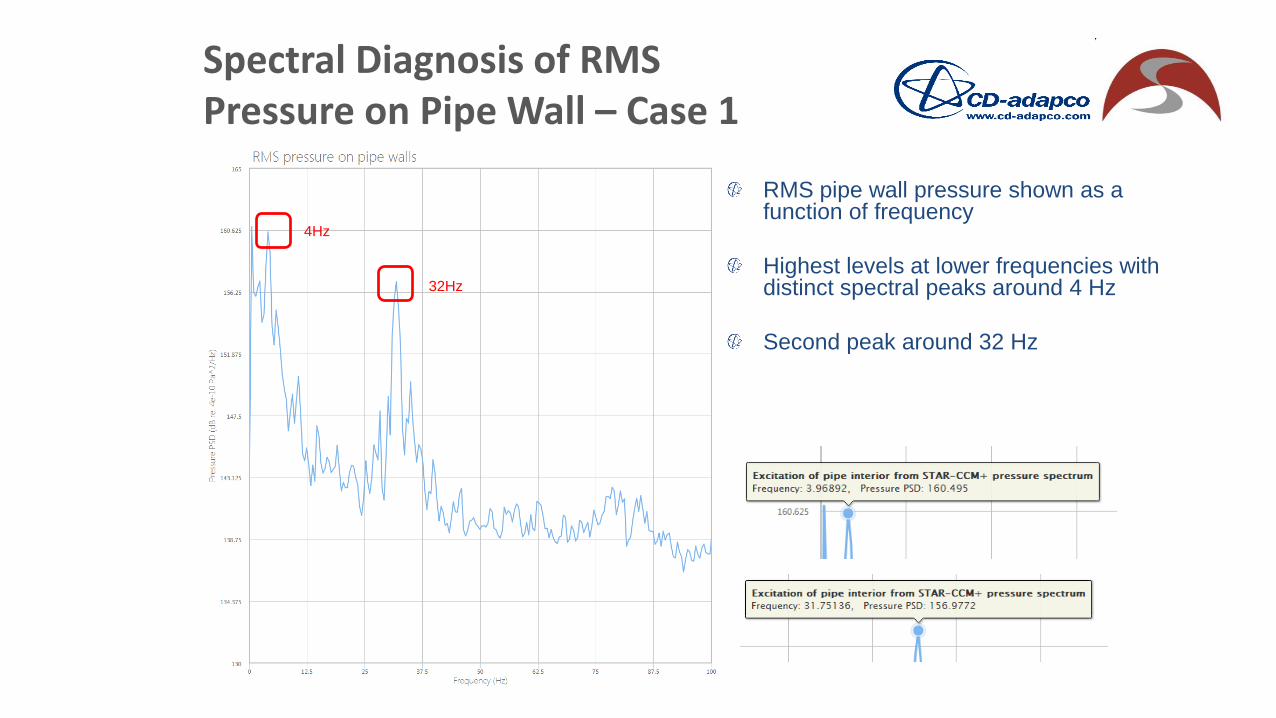
Spectral Diagnosis of RMS Pressure on Pipe Wall – Case 1
4Hz
32Hz
RMS pipe wall pressure shown as a function of frequency
Highest levels at lower frequencies with distinct spectral peaks around 4 Hz
Second peak around 32 Hz
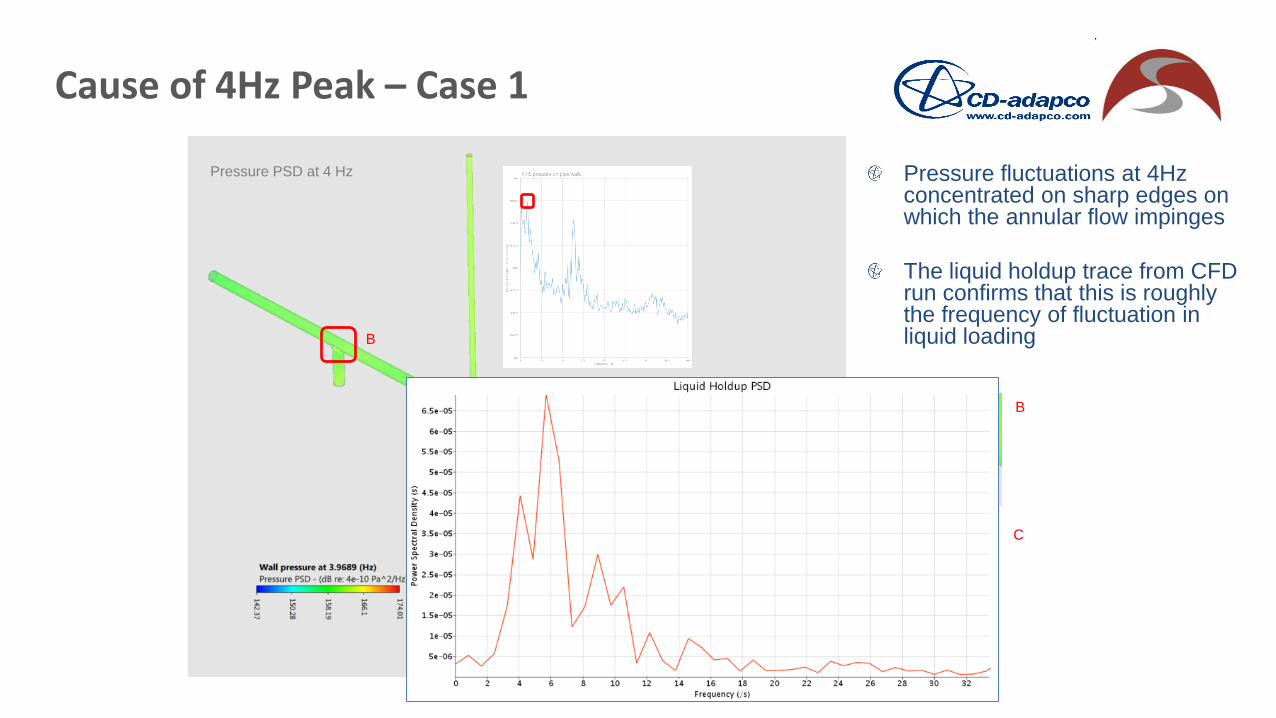
Cause of 4Hz Peak – Case 1
Pressure PSD at 4 Hz
B
C
C
B
Pressure fluctuations at 4Hz concentrated on sharp edges on which the annular flow impinges
The liquid holdup trace from CFD run confirms that this is roughly the frequency of fluctuation in liquid loading
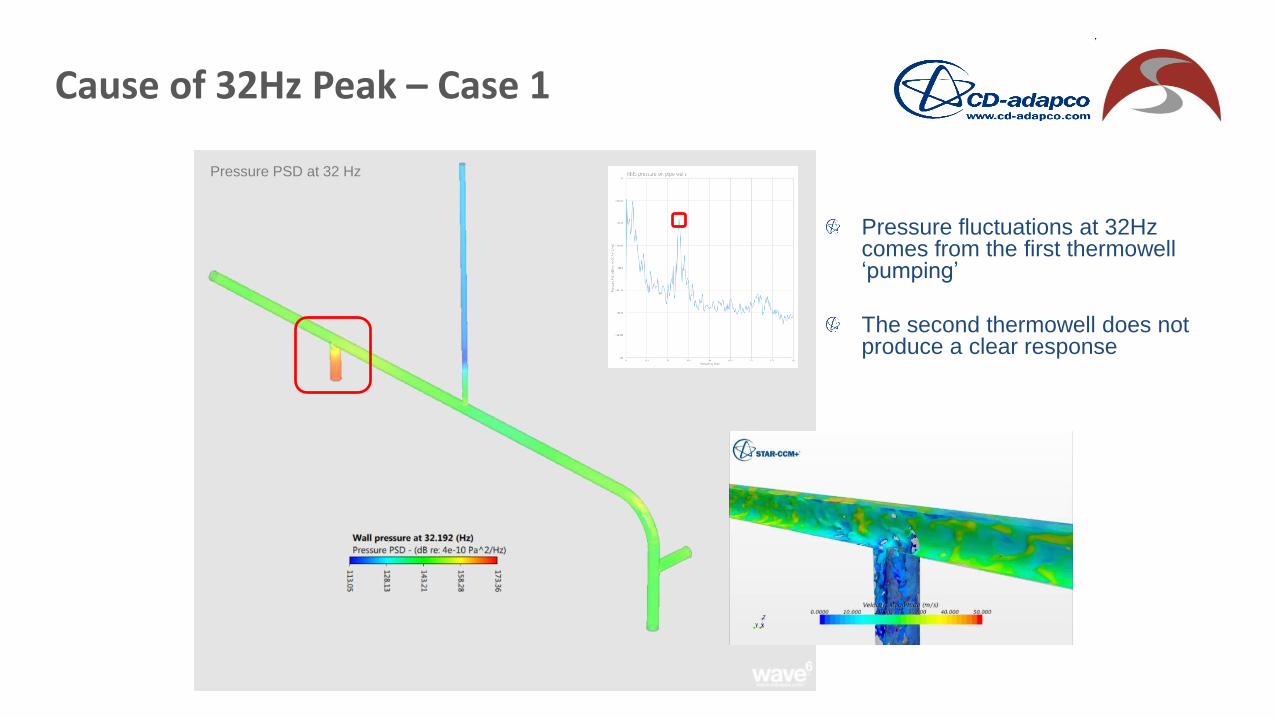
Cause of 32Hz Peak – Case 1
Pressure PSD at 32 Hz
Pressure fluctuations at 32Hz comes from the first thermowell ‘pumping’
The second thermowell does not produce a clear response
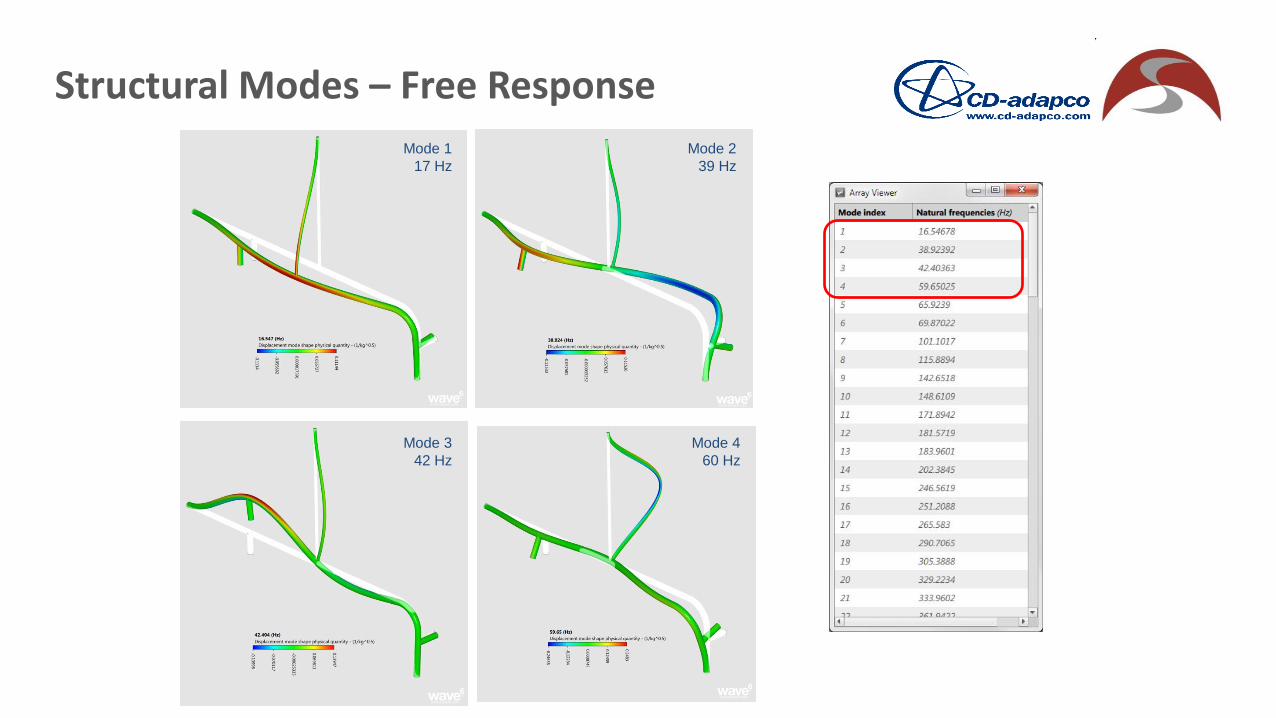
Structural Modes – Free Response
Mode 1
17 Hz
Mode 2
39 Hz
Mode 3
42 Hz
Mode 4
60 Hz
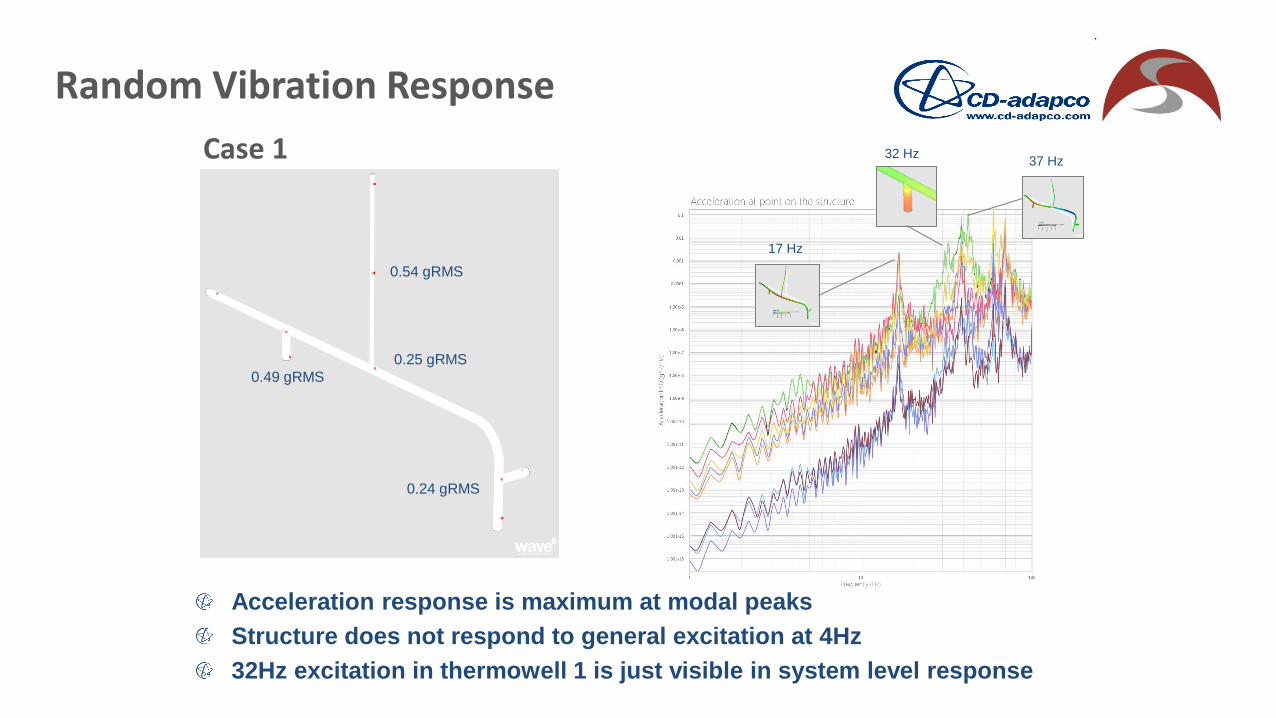
Random Vibration Response
0.54 gRMS
0.49 gRMS
0.25 gRMS
0.24 gRMS
17 Hz
37 Hz 32 Hz Case 1
Acceleration response is maximum at modal peaks
Structure does not respond to general excitation at 4Hz
32Hz excitation in thermowell 1 is just visible in system level response
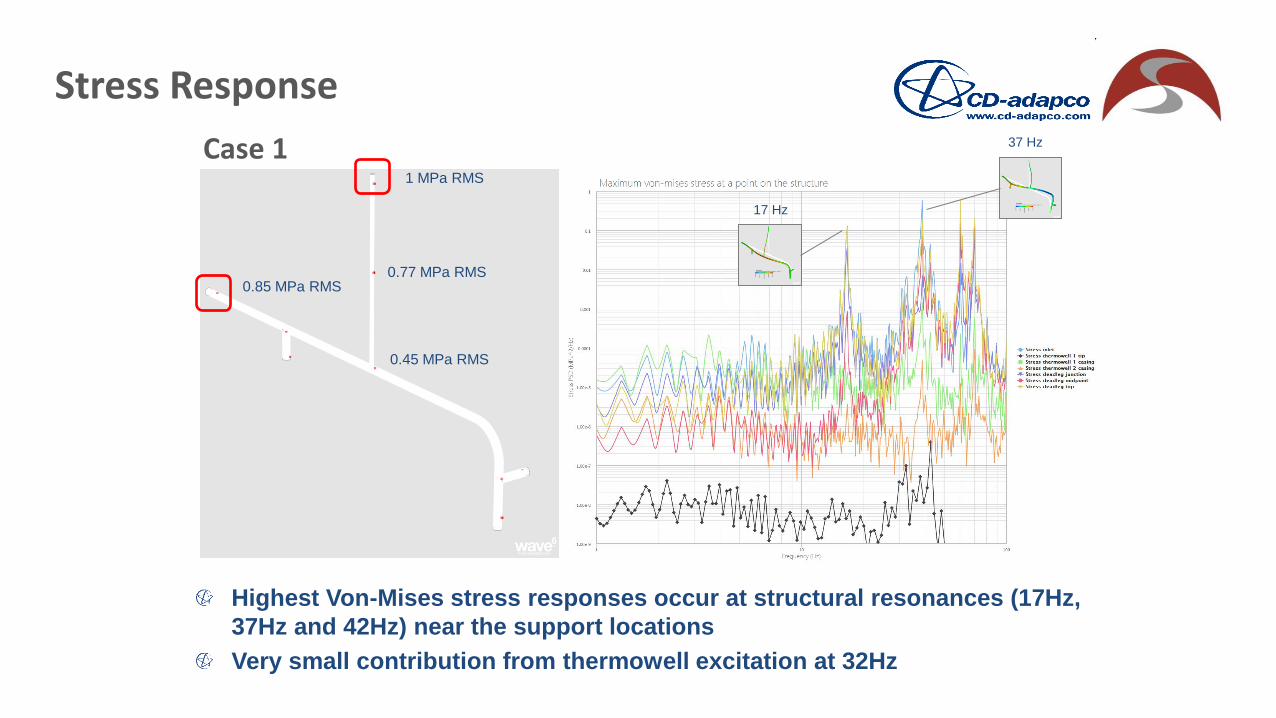
Stress Response
Case 1
Highest Von-Mises stress responses occur at structural resonances (17Hz,
37Hz and 42Hz) near the support locations
Very small contribution from thermowell excitation at 32Hz
17 Hz
37 Hz
1 MPa RMS
0.85 MPa RMS 0.77 MPa RMS
0.45 MPa RMS
Case Study Summary
EI guidelines identifies flow-induced vibration due to a range of mechanisms.
Issues identified can be further investigated by detailed analysis using CFD & FEA.
The component-level CFD analysis for intrusive element showed the VIV issue identified in EI guidelines was not present.
System-wide analysis using CFD & FEA showed: – Characteristic frequency of multiphase flow around 4Hz
– Unsteady phenomena in thermowell found to occur at 32Hz
– Natural frequencies of system did not correspond to flow
– Using STAR-CCM+ coupled with wave6 little flow-related issues were identified

STAR-CCM+ / wave6 workflow
STAR-CCM+ was run on a cluster in the CD-adapco office in Hammersmith, London – The 2M cell model was run on up to 64 cores depending on availability.
– Runtime for 8s of simulation time was two weeks per case on 32 cores, and just over one week on 64 cores.
– TRN files updated every 1E-4s, giving a frequency resolution of 0.25Hz to 5kHz
– Longer simulation time is not required for the frequency range of interest, and could be shortened.
wave6 was run on a standard workstation – Set up of basic case/workflow: ½ day
– Basic forced response calculated in one hour, if the workflow exists
– Further post processing / solving can extend this time, overall << 1 day
Conclusions
This presentation outlines the approach of using the Energy Institute guidelines to assess flow-induced vibration.
Detailed analysis can be used for: – Component-level analysis e.g. vortex shedding from intrusive elements
– System-wide analysis combining both CFD & FEA
The system-wide analysis showed: – It is possible to use STAR-CCM+ to determine frequency of pressure fluctuations.
– wave6 can use the pressure fluctuations to provide magnitudes of response and stress information to be predicted.
– The STAR-CCM+ & wave6 approach is relatively low in computational expense.
– A fully coupled flow and structural response analysis is also now possible – example in later presentation.