Embed Size (px)
Citation preview
This work is licensed under a Creative Commons Attribution-NonCommercial 3.0 Unported License
Newcastle University ePrints - eprint.ncl.ac.uk
Gonabadi HI, Moharrami N, Oila A, Bull SJ. Flexural Characteristics of Tidal
turbine blades made of composite materials. In: 11th European Wave and
Tidal Energy Conference. 2015, Nantes, France.
Copyright:
© 2015 the authors
Link to conference website:
http://www.ewtec.org/ewtec2015/
Date deposited:
18/09/2015
Flexural Characteristics of Tidal Turbine Blades
Made of Composite Materials Chemical Engineering and Advanced Materials, Newcastle University
Newcastle upon Tyne, United Kingdom
Chemical Engineering and Advanced Materials, Newcastle University
Newcastle upon Tyne, United Kingdom
Abstracts- Predicting the mechanical performance of tidal
turbine blades composed of different types of composites is
considered. For simplicity reasons and regarding the typical
loading on a tidal turbine blade, among different types of
standard tests, static three point bending tests (3PBT) were
performed on two different types of composites; fibre reinforced
epoxy resins (FRP) and sandwich composite structures (CSM). 3-
D finite element analyses (FEA) were then carried out to
determine the stress distributions in a test sample in bending.
This was used to predict failure of the composite, to interpret the
experimental results and to interpret the failure modes of the test
specimens. Mechanical behaviour of a full blade was analysed
using the finite element method. Firstly loading on the blade is
considered using computational fluid dynamics (CFD) and then
mechanical testing results of each composite were used as input
data in order to develop a simplified FEA so that static analysis
could be performed with the ANSYS static structural analysis
code to determine the critical zone on the blade where failure
initiates. Mechanical behaviour of a blade made up of various
composites is compared and the best composite from those tested
for manufacturing of a tidal turbine blade is suggested.
Keywords- tidal turbine blade, composite materials, three
point bending test, Failure mechanisms, ANSYS structural
Analysis and CFX
I. INTRODUCTION
The advantages of using marine current turbine energy
as an electricity source are pollution free electricity
generation, low maintenance costs and using predictable and
sustainable operation. Tidal turbines are used for harnessing
the kinetic energy of sea water currents; rotating movement of
turbine blades due to tidal streams can generate electricity. A
major barrier to the implementation of tidal power systems is
the cost of installation which is critically dependent on the
weight of the completed turbine [1]. Since composite
materials are light weight and their specific modulus and
strength are greater than other materials, they are ideal
candidates for deploying in the manufacturing of blades but
experimental data is needed to aid in material selection [2-5].
As a component in a tidal turbine, the blade is designed
according to hydrodynamic science in order to capture the
maximum energy from sea water currents. Tidal turbine
blades are subjected to pressure and bending loads from sea
water currents which ultimately cause failure of composite
blades. Predicting the failure modes and how these are
affected by design remains a challenge in the development of
tidal turbines. Nowadays available information and
documented data on mechanical properties of composite
materials, necessary to allow a reliable design, is not
sufficient. In order to use composite materials in this
application, knowledge of their mechanical behaviour is
required and a better understanding of the different failure
modes under static loading conditions is essential.
The objective of this study is to develop a modelling
approach to predict the mechanical response of tidal turbine
blades either made up of sandwich or fibre reinforced
composites under bending conditions. Sandwich composites
are multi-layered materials and are defined as a structure
which is divided in three main constituents; two external thin
and stiff face sheets and a central soft and thick core mat. The
face sheets are bonded to the core mat to allow transferring
loads between constituents [4]. In sandwich composites, by
placing the stiff material in the faces far from neutral axes, a
high bending stiffness is obtainable. The faces endure most of
the normal and bending stresses, while the core carries shear
stresses [6, 7]. Flexural static behaviour of sandwich
composite honeycomb material were studied by Belouettar
and Abbadi [2]. Global factors were considered for evaluation
of mechanical behaviour of sandwich composites, however
the results are not reliable and precise since there is no
comparison made between experimental and analytical
methods. Davalos and Qiao [8] investigated experimental
characterization and performed finite element analysing on
FRP honeycomb composites and reached the conclusion that
there is a good agreement between experimental values and
analytical prediction in the four point bending test.
Mechanical behaviour of a glass-polyester sandwich structure
for high performance equipment in marine applications was
investigated by Di Bella [6]. Behaviour of the sandwich
composites was studied under different quasi static conditions
like three point bending, flatwise, edgewise compression and
torsion tests. It was found that a new laminate sequence can
improve the properties of sandwich structures. Also analysing
properties from the aforementioned static mechanical tests and
failure mechanism analysis showed that utilizing a bonder at
the interface of face sheet/core mat can enhance the
mechanical properties and reduce crack initiation.
In a general review of fibre reinforced composite materials
assessment by flexural tests, the effect of material variables
such as span to thickness ratio and specimen flaws such as
voids and trapped air are discussed and it was found that in
FRP these variables may also affect failure modes[9, 10].
In three point bending test due to the applied force, test
specimen is divided to two sections, the upper section which
experience compressive stresses and in the down section
tensile stresses are created. Consequently in the concave and
convex side of test specimens corresponding to compressive
and tensile stressed regions, different potential failure modes
during a flexural test may occur. Depending on the type and
layup of composite materials theses failure mechanisms are:
Fibre buckling due to compression and pull out and
fracture due to tension in the concave and convex area of
test specimen respectively
Inter laminar shear at the middle of test specimen
between divided area and fracture of composite both in
compressive and tensile area
Theoretically the most widely used failure criteria for
composite materials is the maximum stress failure criterion
which predicts the material will fail once the magnitude of
stress in any direction overpasses its permissible level in that
direction. The advantage of using this failure criterion is that it
discerns the particular mechanism of failure within a ply. For
example in 3PBT six principal stresses are developed and
when each of these stresses exceeds its relevant tensile,
compressive and shear strength, the failure modes are fibre
tension, fibre compression and in-plane shear
respectively[11].
The experimental requirements for 3PBT on composites
are simpler than those for a tensile or compressive tests, as the
influence of defects and geometrical stress concentration sites
on the composite specimens is less severe. Moreover a parallel
sided specimen can be used and this leads to ease of sample
preparation.
In this study we have combined experimental analysis and
finite element analysis incorporating failure modes to
determine the loci and extent of failure in a composite tidal
turbine blade.
II. Experimental Procedure
A. Materials
In this study two different types of composite material
including fibre reinforced and sandwich composites were
deployed. In the case of fibre reinforced composite materials
Glass, Carbon and Kevlar fibres in the matrix of an epoxy
thermosetting resin were used to fabricate GFRP (woven
fibres of glass 0/90), CFRP (Unidirectional Carbon fibrers)
and KFRP (Kevlar fibres 0/ ±45/90 ) respectively and for
sandwich composites, three different configurations of face
sheet and core mat thicknesses were used. PVC foam is used
as a core material and chopped strand mat (CSM) glass in the
matrix of Polyester resin is used in the face sheet material.
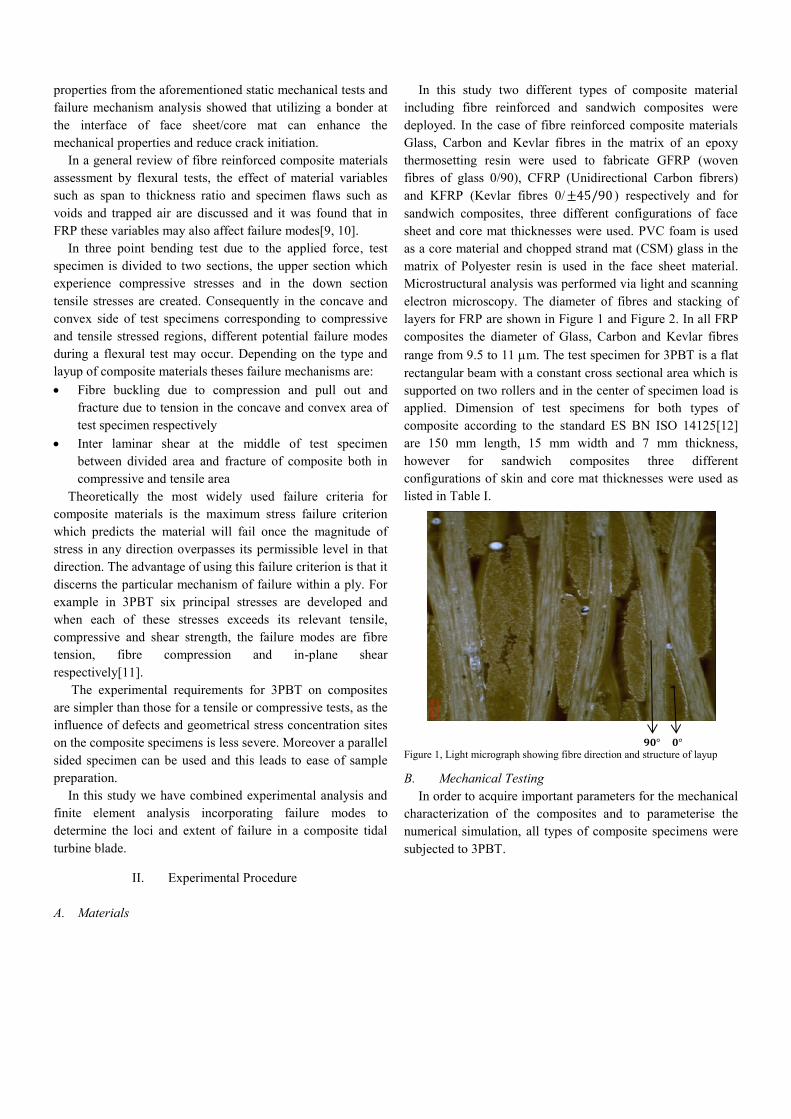
Microstructural analysis was performed via light and scanning
electron microscopy. The diameter of fibres and stacking of
layers for FRP are shown in Figure 1 and Figure 2. In all FRP
composites the diameter of Glass, Carbon and Kevlar fibres
range from 9.5 to 11 m. The test specimen for 3PBT is a flat
rectangular beam with a constant cross sectional area which is
supported on two rollers and in the center of specimen load is
applied. Dimension of test specimens for both types of
composite according to the standard ES BN ISO 14125[12]
are 150 mm length, 15 mm width and 7 mm thickness,
however for sandwich composites three different
configurations of skin and core mat thicknesses were used as
listed in Table I.
𝟗𝟎° 𝟎° Figure 1, Light micrograph showing fibre direction and structure of layup
B. Mechanical Testing
In order to acquire important parameters for the mechanical
characterization of the composites and to parameterise the
numerical simulation, all types of composite specimens were
subjected to 3PBT.
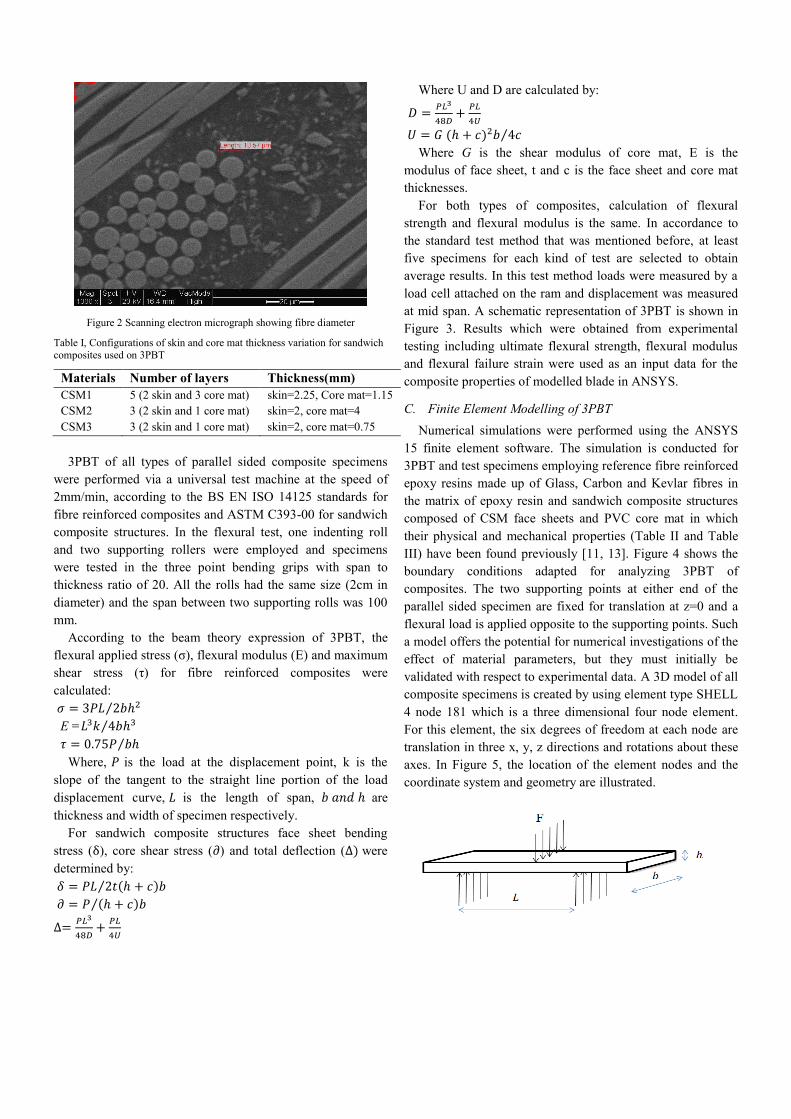
Figure 2 Scanning electron micrograph showing fibre diameter
Table I, Configurations of skin and core mat thickness variation for sandwich
composites used on 3PBT
Materials Number of layers Thickness(mm)
CSM1 5 (2 skin and 3 core mat) skin=2.25, Core mat=1.15
CSM2 3 (2 skin and 1 core mat) skin=2, core mat=4
CSM3 3 (2 skin and 1 core mat) skin=2, core mat=0.75
3PBT of all types of parallel sided composite specimens
were performed via a universal test machine at the speed of
2mm/min, according to the BS EN ISO 14125 standards for
fibre reinforced composites and ASTM C393-00 for sandwich
composite structures. In the flexural test, one indenting roll
and two supporting rollers were employed and specimens
were tested in the three point bending grips with span to
thickness ratio of 20. All the rolls had the same size (2cm in
diameter) and the span between two supporting rolls was 100
mm.
According to the beam theory expression of 3PBT, the
flexural applied stress (σ), flexural modulus (E) and maximum
shear stress (τ) for fibre reinforced composites were
calculated:
𝜎 = 3𝑃𝐿 2𝑏ℎ2⁄
E =𝐿3𝑘 4𝑏ℎ3 ⁄
𝜏 = 0.75𝑃 𝑏ℎ⁄
Where, 𝑃 is the load at the displacement point, k is the
slope of the tangent to the straight line portion of the load
displacement curve, 𝐿 is the length of span, 𝑏 𝑎𝑛𝑑 ℎ are
thickness and width of specimen respectively.
For sandwich composite structures face sheet bending
stress (δ), core shear stress (𝜕) and total deflection (∆) were
determined by:
𝛿 = 𝑃𝐿 2𝑡(ℎ + 𝑐)𝑏⁄
𝜕 = 𝑃 (ℎ + 𝑐)𝑏⁄
∆=𝑃𝐿3
48𝐷+
𝑃𝐿
4𝑈
Where U and D are calculated by:
𝐷 =𝑃𝐿3
48𝐷+
𝑃𝐿
4𝑈
𝑈 = 𝐺 (ℎ + 𝑐)2𝑏 4𝑐⁄
Where G is the shear modulus of core mat, E is the
modulus of face sheet, t and c is the face sheet and core mat
thicknesses.
For both types of composites, calculation of flexural
strength and flexural modulus is the same. In accordance to
the standard test method that was mentioned before, at least
five specimens for each kind of test are selected to obtain
average results. In this test method loads were measured by a
load cell attached on the ram and displacement was measured
at mid span. A schematic representation of 3PBT is shown in
Figure 3. Results which were obtained from experimental
testing including ultimate flexural strength, flexural modulus
and flexural failure strain were used as an input data for the
composite properties of modelled blade in ANSYS.
C. Finite Element Modelling of 3PBT
Numerical simulations were performed using the ANSYS
15 finite element software. The simulation is conducted for
3PBT and test specimens employing reference fibre reinforced
epoxy resins made up of Glass, Carbon and Kevlar fibres in
the matrix of epoxy resin and sandwich composite structures
composed of CSM face sheets and PVC core mat in which
their physical and mechanical properties (Table II and Table
III) have been found previously [11, 13]. Figure 4 shows the
boundary conditions adapted for analyzing 3PBT of
composites. The two supporting points at either end of the
parallel sided specimen are fixed for translation at z=0 and a
flexural load is applied opposite to the supporting points. Such
a model offers the potential for numerical investigations of the
effect of material parameters, but they must initially be
validated with respect to experimental data. A 3D model of all
composite specimens is created by using element type SHELL
4 node 181 which is a three dimensional four node element.
For this element, the six degrees of freedom at each node are
translation in three x, y, z directions and rotations about these
axes. In Figure 5, the location of the element nodes and the
coordinate system and geometry are illustrated.
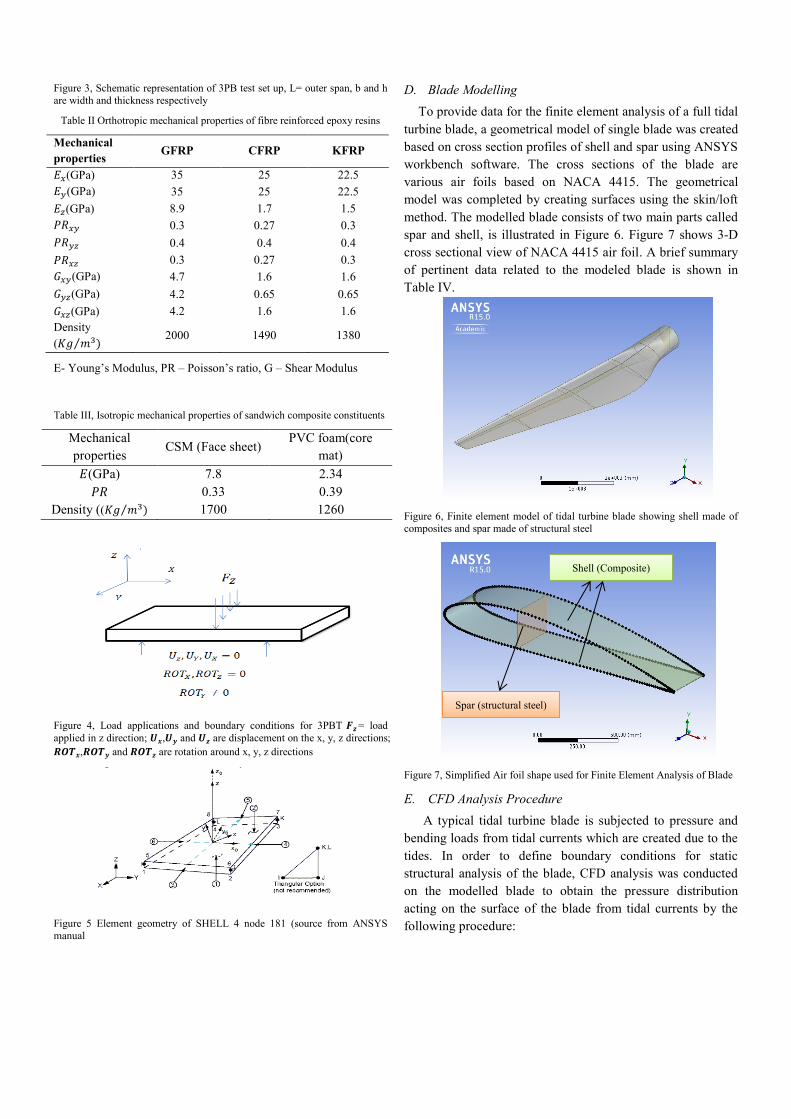
Figure 3, Schematic representation of 3PB test set up, L= outer span, b and h
are width and thickness respectively
Table II Orthotropic mechanical properties of fibre reinforced epoxy resins
Mechanical
properties GFRP CFRP KFRP
𝐸𝑥(GPa) 35 25 22.5
𝐸𝑦(GPa) 35 25 22.5
𝐸𝑧(GPa) 8.9 1.7 1.5
𝑃𝑅𝑥𝑦 0.3 0.27 0.3
𝑃𝑅𝑦𝑧 0.4 0.4 0.4
𝑃𝑅𝑥𝑧 0.3 0.27 0.3
𝐺𝑥𝑦(GPa) 4.7 1.6 1.6
𝐺𝑦𝑧(GPa) 4.2 0.65 0.65
𝐺𝑥𝑧(GPa) 4.2 1.6 1.6
Density
(𝐾𝑔 𝑚3)⁄ 2000 1490 1380
E- Young’s Modulus, PR – Poisson’s ratio, G – Shear Modulus
Table III, Isotropic mechanical properties of sandwich composite constituents
Mechanical
properties CSM (Face sheet)
PVC foam(core
mat)
𝐸(GPa) 7.8 2.34
𝑃𝑅 0.33 0.39
Density ((𝐾𝑔 𝑚3)⁄ 1700 1260
Figure 4, Load applications and boundary conditions for 3PBT 𝑭𝒛 = load
applied in z direction; 𝑼𝒙,𝑼𝒚 and 𝑼𝒛 are displacement on the x, y, z directions;
𝑹𝑶𝑻𝒙,𝑹𝑶𝑻𝒚 and 𝑹𝑶𝑻𝒛 are rotation around x, y, z directions
Figure 5 Element geometry of SHELL 4 node 181 (source from ANSYS
manual
D. Blade Modelling
To provide data for the finite element analysis of a full tidal
turbine blade, a geometrical model of single blade was created
based on cross section profiles of shell and spar using ANSYS
workbench software. The cross sections of the blade are
various air foils based on NACA 4415. The geometrical
model was completed by creating surfaces using the skin/loft
method. The modelled blade consists of two main parts called
spar and shell, is illustrated in Figure 6. Figure 7 shows 3-D
cross sectional view of NACA 4415 air foil. A brief summary
of pertinent data related to the modeled blade is shown in
Table IV.
Figure 6, Finite element model of tidal turbine blade showing shell made of
composites and spar made of structural steel
Figure 7, Simplified Air foil shape used for Finite Element Analysis of Blade
E. CFD Analysis Procedure
A typical tidal turbine blade is subjected to pressure and
bending loads from tidal currents which are created due to the
tides. In order to define boundary conditions for static
structural analysis of the blade, CFD analysis was conducted
on the modelled blade to obtain the pressure distribution
acting on the surface of the blade from tidal currents by the
following procedure:
Spar (structural steel)
Shell (Composite)
1) Creating the cavity model of the tidal turbine blade
and importing the modelled geometry into the
ANSYS CFX software
2) Meshing both cavity and geometry
3) Defining domain type as sea water for fluid and
stationary for domain motion
4) Defining boundary condition (velocity of sea water at
inlet=2.5m/s, relative pressure of sea water at the
depth of 50m at outlet =0.6MPa).
Table IV General specification of modelled blade
Parameter Value
Length of blade 8000 mm
Maximum chord length 1750 mm
Minimum chord length 500 mm
Surface area Top surface = 9.9545 𝑚2
Down surface = 9.8712 𝑚2
Angle of attack 30 degree
Airfoil cross section type NACA 4415
Thickness variation of blade
surface from root to tip (x=
distance)
150-0.00625x
Thickness of spar 50 mm
Root diameter 750 mm
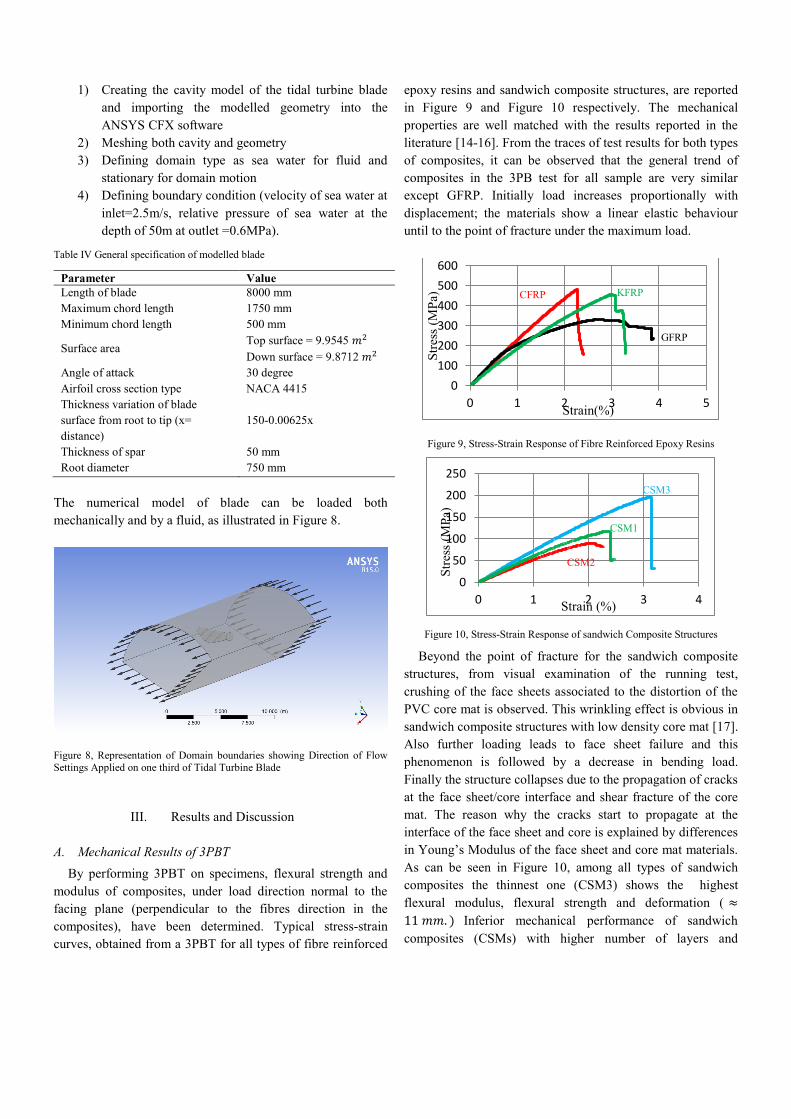
The numerical model of blade can be loaded both
mechanically and by a fluid, as illustrated in Figure 8.
Figure 8, Representation of Domain boundaries showing Direction of Flow
Settings Applied on one third of Tidal Turbine Blade
III. Results and Discussion
A. Mechanical Results of 3PBT
By performing 3PBT on specimens, flexural strength and
modulus of composites, under load direction normal to the
facing plane (perpendicular to the fibres direction in the
composites), have been determined. Typical stress-strain
curves, obtained from a 3PBT for all types of fibre reinforced
epoxy resins and sandwich composite structures, are reported
in Figure 9 and Figure 10 respectively. The mechanical
properties are well matched with the results reported in the
literature [14-16]. From the traces of test results for both types
of composites, it can be observed that the general trend of
composites in the 3PB test for all sample are very similar
except GFRP. Initially load increases proportionally with
displacement; the materials show a linear elastic behaviour
until to the point of fracture under the maximum load.
Figure 9, Stress-Strain Response of Fibre Reinforced Epoxy Resins
Figure 10, Stress-Strain Response of sandwich Composite Structures
Beyond the point of fracture for the sandwich composite
structures, from visual examination of the running test,
crushing of the face sheets associated to the distortion of the
PVC core mat is observed. This wrinkling effect is obvious in
sandwich composite structures with low density core mat [17].
Also further loading leads to face sheet failure and this
phenomenon is followed by a decrease in bending load.
Finally the structure collapses due to the propagation of cracks
at the face sheet/core interface and shear fracture of the core
mat. The reason why the cracks start to propagate at the
interface of the face sheet and core is explained by differences
in Young’s Modulus of the face sheet and core mat materials.
As can be seen in Figure 10, among all types of sandwich
composites the thinnest one (CSM3) shows the highest
flexural modulus, flexural strength and deformation ( ≈
11 𝑚𝑚. ) Inferior mechanical performance of sandwich
composites (CSMs) with higher number of layers and
0
100
200
300
400
500
600
0 1 2 3 4 5
Str
ess
(MP
a)
Strain(%)
CFRP KFRP
GFRP
0
50
100
150
200
250
0 1 2 3 4
Str
ess
(MP
a)
Strain (%)
CSM2
CSM1
CSM3
thicknesses (CSM1 and CSM2) can be attributed to bad face
sheet /core adhesion which can induce a premature failure of
the sample, due to the crack formation at the interface
between the two constituents [18, 19]
In fibre reinforced composites for a typical trend of stress-
strain curve of GFRP under 3PBT, it is possible to identify
that after an initial settlement, the trend is elastic-linear until a
mean stress value of 330 MPa. After this point micro-cracks
start to appear in the area around the loading roller. Then the
load increases but the curve slope is lower due to the crack
propagation. For Carbon and Kevlar fibre reinforced epoxy
resin, the flexural strength is higher than glass fibre reinforced
composites. The deformation of CFRP (≈ 10mm) is lower
than GFRP and KFRP (≈ 12𝑚𝑚 𝑎𝑛𝑑 14𝑚𝑚) respectively.
This behaviour of CFRP is associated with this fact that
Carbon fibre tolerates low compression stress, however, it can
absorb a high deformation energy in tension than Glass and
Kevlar fibres. The fracture load in GFRP is lower than KFRP
and CFRP, due to the reduced compressive and tensile
properties of glass fibres in relation to Carbon and Kevlar
fibres. Also the higher stiffness of GFRP than CFRP and
KFRP is attributed to the higher modulus (transvers to fibre
axis) of Glass to Kevlar and Carbon fibres. The observed
residual strength of GFRP is due to the strength of glass fibres
that do not break. Finally near the point of fracture on the
stress- strain curve of fibre reinforced composites, the
formation and evolution of damage can be investigated.
During the test running near the point of fracture, a cracking
noise was heard accompanied by a stress drop in the stress-
strain curve. Inter-laminar cracks begin to propagate until
complete failure associated with delamination, fibre breakage
and fracture in the outer surface of test specimen was
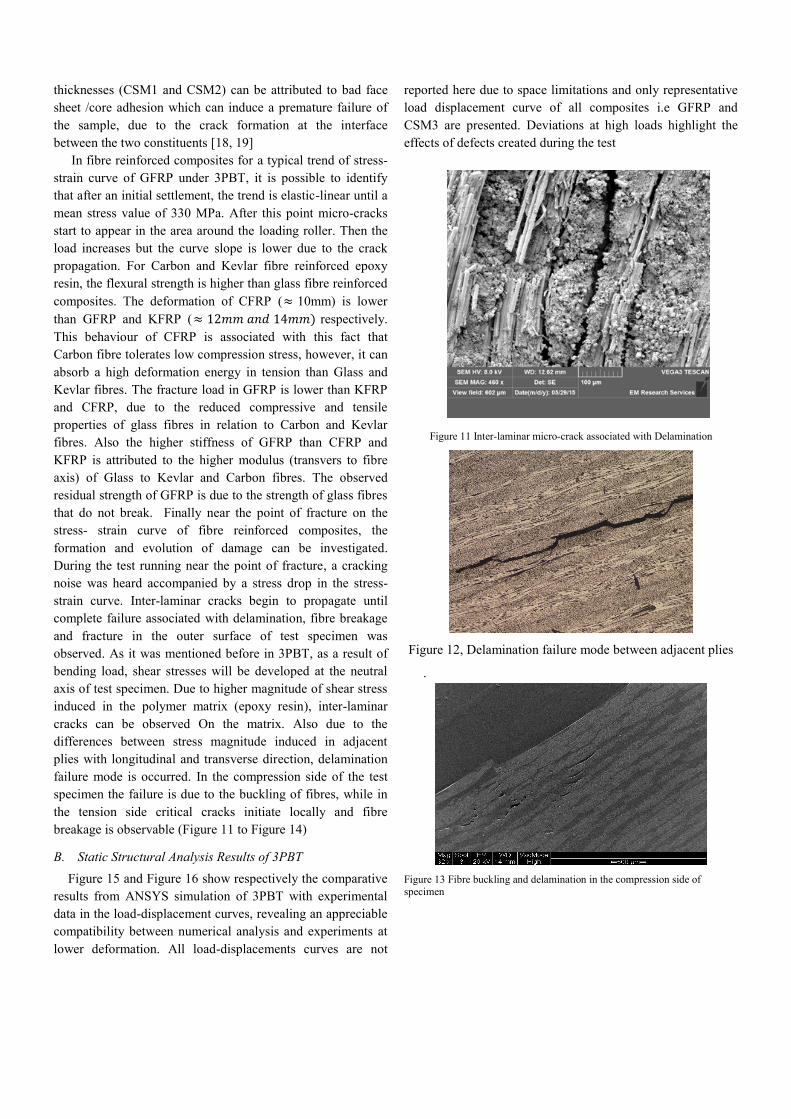
observed. As it was mentioned before in 3PBT, as a result of
bending load, shear stresses will be developed at the neutral
axis of test specimen. Due to higher magnitude of shear stress
induced in the polymer matrix (epoxy resin), inter-laminar
cracks can be observed On the matrix. Also due to the
differences between stress magnitude induced in adjacent
plies with longitudinal and transverse direction, delamination
failure mode is occurred. In the compression side of the test
specimen the failure is due to the buckling of fibres, while in
the tension side critical cracks initiate locally and fibre
breakage is observable (Figure 11 to Figure 14)
B. Static Structural Analysis Results of 3PBT
Figure 15 and Figure 16 show respectively the comparative
results from ANSYS simulation of 3PBT with experimental
data in the load-displacement curves, revealing an appreciable
compatibility between numerical analysis and experiments at
lower deformation. All load-displacements curves are not
reported here due to space limitations and only representative
load displacement curve of all composites i.e GFRP and
CSM3 are presented. Deviations at high loads highlight the
effects of defects created during the test
Figure 11 Inter-laminar micro-crack associated with Delamination
Figure 12, Delamination failure mode between adjacent plies
.
Figure 13 Fibre buckling and delamination in the compression side of
specimen
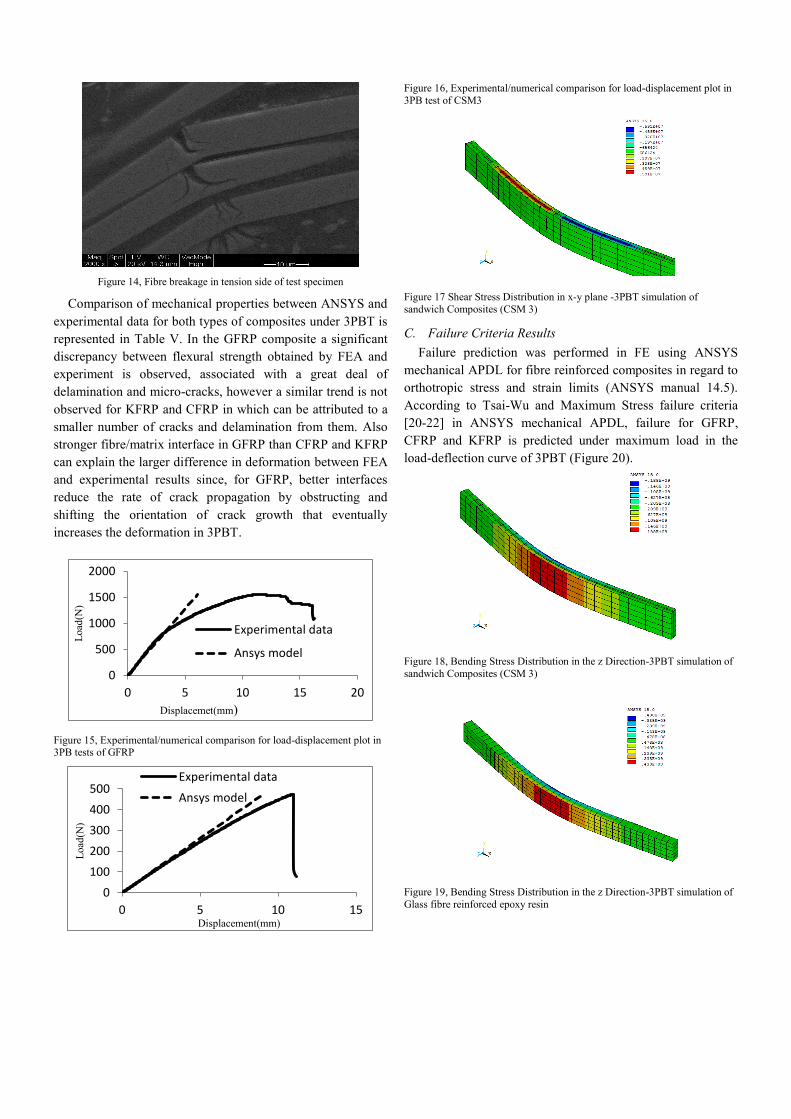
Figure 14, Fibre breakage in tension side of test specimen
Comparison of mechanical properties between ANSYS and
experimental data for both types of composites under 3PBT is
represented in Table V. In the GFRP composite a significant
discrepancy between flexural strength obtained by FEA and
experiment is observed, associated with a great deal of
delamination and micro-cracks, however a similar trend is not
observed for KFRP and CFRP in which can be attributed to a
smaller number of cracks and delamination from them. Also
stronger fibre/matrix interface in GFRP than CFRP and KFRP
can explain the larger difference in deformation between FEA
and experimental results since, for GFRP, better interfaces
reduce the rate of crack propagation by obstructing and
shifting the orientation of crack growth that eventually
increases the deformation in 3PBT.
Figure 15, Experimental/numerical comparison for load-displacement plot in 3PB tests of GFRP
Figure 16, Experimental/numerical comparison for load-displacement plot in
3PB test of CSM3
Figure 17 Shear Stress Distribution in x-y plane -3PBT simulation of
sandwich Composites (CSM 3)
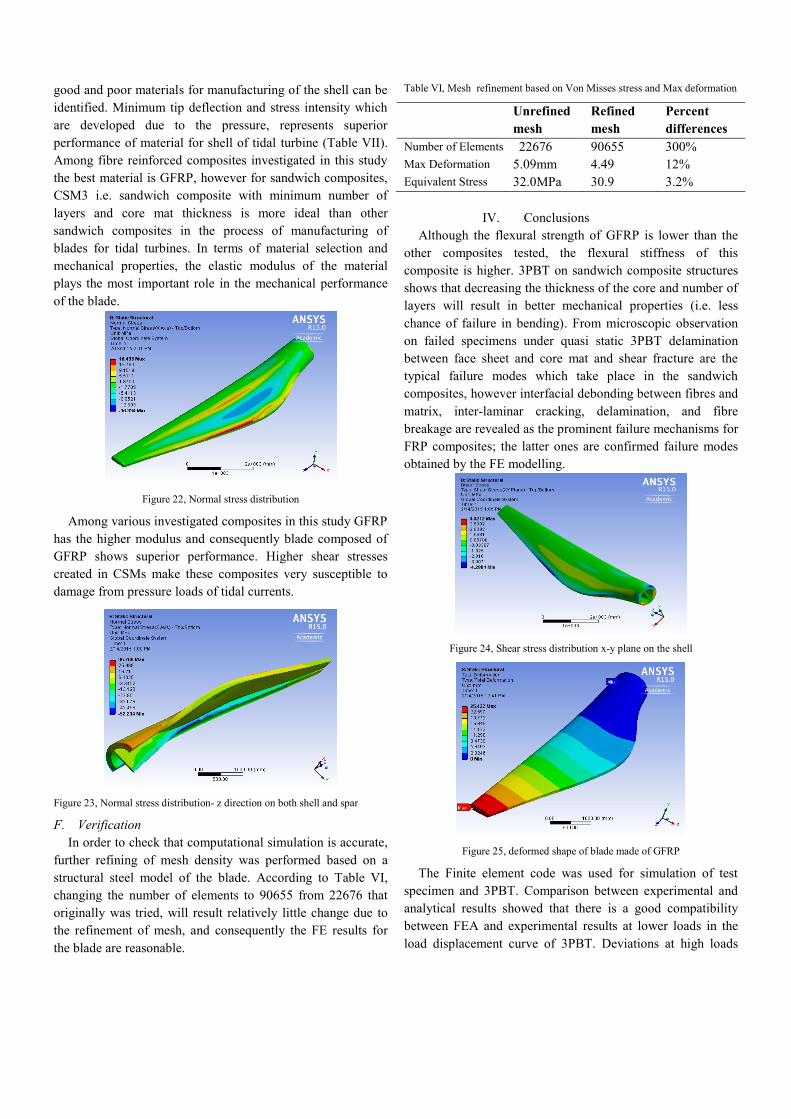
C. Failure Criteria Results
Failure prediction was performed in FE using ANSYS
mechanical APDL for fibre reinforced composites in regard to
orthotropic stress and strain limits (ANSYS manual 14.5).
According to Tsai-Wu and Maximum Stress failure criteria
[20-22] in ANSYS mechanical APDL, failure for GFRP,
CFRP and KFRP is predicted under maximum load in the
load-deflection curve of 3PBT (Figure 20).
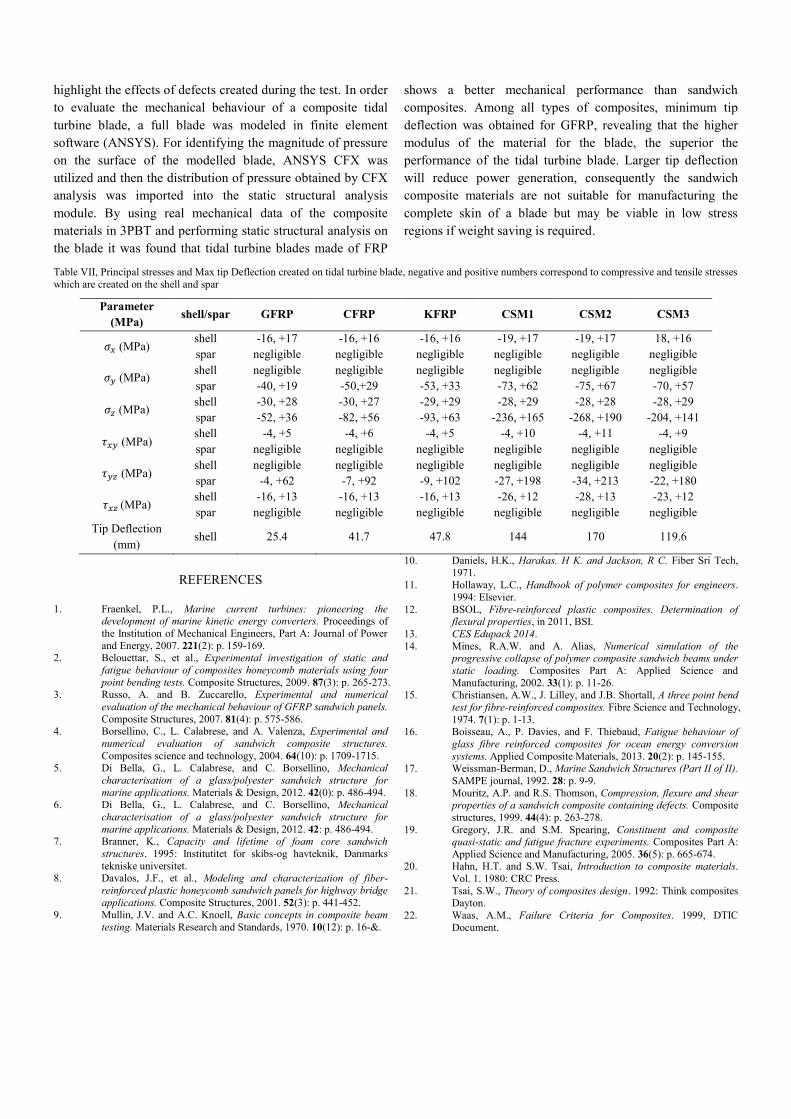
Figure 18, Bending Stress Distribution in the z Direction-3PBT simulation of
sandwich Composites (CSM 3)
Figure 19, Bending Stress Distribution in the z Direction-3PBT simulation of
Glass fibre reinforced epoxy resin
0
500
1000
1500
2000
0 5 10 15 20
Load
(N)
Displacemet(mm)
Experimental data
Ansys model
0
100
200
300
400
500
0 5 10 15
Load
(N)
Displacement(mm)
Experimental data
Ansys model
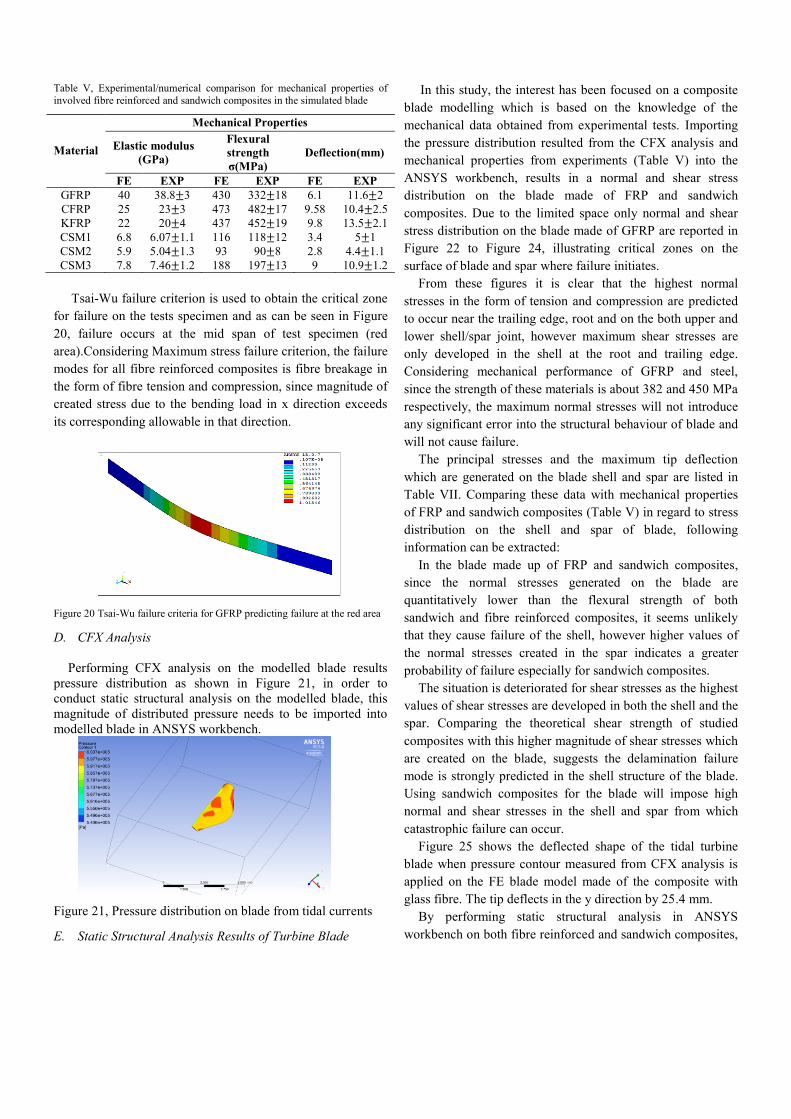
Table V, Experimental/numerical comparison for mechanical properties of
involved fibre reinforced and sandwich composites in the simulated blade
Material
Mechanical Properties
Elastic modulus
(GPa)
Flexural
strength
σ(MPa)
Deflection(mm)
FE EXP FE EXP FE EXP
GFRP 40 38.8±3 430 332±18 6.1 11.6±2
CFRP 25 23±3 473 482±17 9.58 10.4±2.5
KFRP 22 20±4 437 452±19 9.8 13.5±2.1
CSM1 6.8 6.07±1.1 116 118±12 3.4 5±1
CSM2 5.9 5.04±1.3 93 90±8 2.8 4.4±1.1
CSM3 7.8 7.46±1.2 188 197±13 9 10.9±1.2
Tsai-Wu failure criterion is used to obtain the critical zone
for failure on the tests specimen and as can be seen in Figure
20, failure occurs at the mid span of test specimen (red
area).Considering Maximum stress failure criterion, the failure
modes for all fibre reinforced composites is fibre breakage in
the form of fibre tension and compression, since magnitude of
created stress due to the bending load in x direction exceeds
its corresponding allowable in that direction.
Figure 20 Tsai-Wu failure criteria for GFRP predicting failure at the red area
D. CFX Analysis
Performing CFX analysis on the modelled blade results
pressure distribution as shown in Figure 21, in order to
conduct static structural analysis on the modelled blade, this
magnitude of distributed pressure needs to be imported into
modelled blade in ANSYS workbench.
Figure 21, Pressure distribution on blade from tidal currents
E. Static Structural Analysis Results of Turbine Blade
In this study, the interest has been focused on a composite
blade modelling which is based on the knowledge of the
mechanical data obtained from experimental tests. Importing
the pressure distribution resulted from the CFX analysis and
mechanical properties from experiments (Table V) into the
ANSYS workbench, results in a normal and shear stress
distribution on the blade made of FRP and sandwich
composites. Due to the limited space only normal and shear
stress distribution on the blade made of GFRP are reported in
Figure 22 to Figure 24, illustrating critical zones on the
surface of blade and spar where failure initiates.
From these figures it is clear that the highest normal
stresses in the form of tension and compression are predicted
to occur near the trailing edge, root and on the both upper and
lower shell/spar joint, however maximum shear stresses are
only developed in the shell at the root and trailing edge.
Considering mechanical performance of GFRP and steel,
since the strength of these materials is about 382 and 450 MPa
respectively, the maximum normal stresses will not introduce
any significant error into the structural behaviour of blade and
will not cause failure.
The principal stresses and the maximum tip deflection
which are generated on the blade shell and spar are listed in
Table VII. Comparing these data with mechanical properties
of FRP and sandwich composites (Table V) in regard to stress
distribution on the shell and spar of blade, following
information can be extracted:
In the blade made up of FRP and sandwich composites,
since the normal stresses generated on the blade are
quantitatively lower than the flexural strength of both
sandwich and fibre reinforced composites, it seems unlikely
that they cause failure of the shell, however higher values of
the normal stresses created in the spar indicates a greater
probability of failure especially for sandwich composites.
The situation is deteriorated for shear stresses as the highest
values of shear stresses are developed in both the shell and the
spar. Comparing the theoretical shear strength of studied
composites with this higher magnitude of shear stresses which
are created on the blade, suggests the delamination failure
mode is strongly predicted in the shell structure of the blade.
Using sandwich composites for the blade will impose high
normal and shear stresses in the shell and spar from which
catastrophic failure can occur.
Figure 25 shows the deflected shape of the tidal turbine
blade when pressure contour measured from CFX analysis is
applied on the FE blade model made of the composite with
glass fibre. The tip deflects in the y direction by 25.4 mm.
By performing static structural analysis in ANSYS
workbench on both fibre reinforced and sandwich composites,
good and poor materials for manufacturing of the shell can be
identified. Minimum tip deflection and stress intensity which
are developed due to the pressure, represents superior
performance of material for shell of tidal turbine (Table VII).
Among fibre reinforced composites investigated in this study
the best material is GFRP, however for sandwich composites,
CSM3 i.e. sandwich composite with minimum number of
layers and core mat thickness is more ideal than other
sandwich composites in the process of manufacturing of
blades for tidal turbines. In terms of material selection and
mechanical properties, the elastic modulus of the material
plays the most important role in the mechanical performance
of the blade.
Figure 22, Normal stress distribution
Among various investigated composites in this study GFRP
has the higher modulus and consequently blade composed of
GFRP shows superior performance. Higher shear stresses
created in CSMs make these composites very susceptible to
damage from pressure loads of tidal currents.
Figure 23, Normal stress distribution- z direction on both shell and spar
F. Verification
In order to check that computational simulation is accurate,
further refining of mesh density was performed based on a
structural steel model of the blade. According to Table VI,
changing the number of elements to 90655 from 22676 that
originally was tried, will result relatively little change due to
the refinement of mesh, and consequently the FE results for
the blade are reasonable.
Table VI, Mesh refinement based on Von Misses stress and Max deformation
Unrefined
mesh
Refined
mesh
Percent
differences
Number of Elements 22676 90655 300%
Max Deformation 5.09mm 4.49 12%
Equivalent Stress 32.0MPa 30.9 3.2%
IV. Conclusions
Although the flexural strength of GFRP is lower than the
other composites tested, the flexural stiffness of this
composite is higher. 3PBT on sandwich composite structures
shows that decreasing the thickness of the core and number of
layers will result in better mechanical properties (i.e. less
chance of failure in bending). From microscopic observation
on failed specimens under quasi static 3PBT delamination
between face sheet and core mat and shear fracture are the
typical failure modes which take place in the sandwich
composites, however interfacial debonding between fibres and
matrix, inter-laminar cracking, delamination, and fibre
breakage are revealed as the prominent failure mechanisms for
FRP composites; the latter ones are confirmed failure modes
obtained by the FE modelling.
Figure 24, Shear stress distribution x-y plane on the shell
Figure 25, deformed shape of blade made of GFRP
The Finite element code was used for simulation of test
specimen and 3PBT. Comparison between experimental and
analytical results showed that there is a good compatibility
between FEA and experimental results at lower loads in the
load displacement curve of 3PBT. Deviations at high loads
highlight the effects of defects created during the test. In order
to evaluate the mechanical behaviour of a composite tidal
turbine blade, a full blade was modeled in finite element
software (ANSYS). For identifying the magnitude of pressure
on the surface of the modelled blade, ANSYS CFX was
utilized and then the distribution of pressure obtained by CFX
analysis was imported into the static structural analysis
module. By using real mechanical data of the composite
materials in 3PBT and performing static structural analysis on
the blade it was found that tidal turbine blades made of FRP
shows a better mechanical performance than sandwich
composites. Among all types of composites, minimum tip
deflection was obtained for GFRP, revealing that the higher
modulus of the material for the blade, the superior the
performance of the tidal turbine blade. Larger tip deflection
will reduce power generation, consequently the sandwich
composite materials are not suitable for manufacturing the
complete skin of a blade but may be viable in low stress
regions if weight saving is required.
Table VII, Principal stresses and Max tip Deflection created on tidal turbine blade, negative and positive numbers correspond to compressive and tensile stresses
which are created on the shell and spar
Parameter
(MPa) shell/spar GFRP CFRP KFRP CSM1 CSM2 CSM3
𝜎𝑥 (MPa) shell -16, +17 -16, +16 -16, +16 -19, +17 -19, +17 18, +16
spar negligible negligible negligible negligible negligible negligible
𝜎𝑦 (MPa) shell negligible negligible negligible negligible negligible negligible
spar -40, +19 -50,+29 -53, +33 -73, +62 -75, +67 -70, +57
𝜎𝑧 (MPa) shell -30, +28 -30, +27 -29, +29 -28, +29 -28, +28 -28, +29
spar -52, +36 -82, +56 -93, +63 -236, +165 -268, +190 -204, +141
𝜏𝑥𝑦 (MPa) shell -4, +5 -4, +6 -4, +5 -4, +10 -4, +11 -4, +9
spar negligible negligible negligible negligible negligible negligible
𝜏𝑦𝑧 (MPa) shell negligible negligible negligible negligible negligible negligible
spar -4, +62 -7, +92 -9, +102 -27, +198 -34, +213 -22, +180
𝜏𝑥𝑧 (MPa) shell -16, +13 -16, +13 -16, +13 -26, +12 -28, +13 -23, +12
spar negligible negligible negligible negligible negligible negligible
Tip Deflection
(mm) shell 25.4 41.7 47.8 144 170 119.6
REFERENCES
1. Fraenkel, P.L., Marine current turbines: pioneering the development of marine kinetic energy converters. Proceedings of
the Institution of Mechanical Engineers, Part A: Journal of Power
and Energy, 2007. 221(2): p. 159-169. 2. Belouettar, S., et al., Experimental investigation of static and
fatigue behaviour of composites honeycomb materials using four
point bending tests. Composite Structures, 2009. 87(3): p. 265-273. 3. Russo, A. and B. Zuccarello, Experimental and numerical
evaluation of the mechanical behaviour of GFRP sandwich panels.
Composite Structures, 2007. 81(4): p. 575-586. 4. Borsellino, C., L. Calabrese, and A. Valenza, Experimental and
numerical evaluation of sandwich composite structures.
Composites science and technology, 2004. 64(10): p. 1709-1715. 5. Di Bella, G., L. Calabrese, and C. Borsellino, Mechanical
characterisation of a glass/polyester sandwich structure for
marine applications. Materials & Design, 2012. 42(0): p. 486-494. 6. Di Bella, G., L. Calabrese, and C. Borsellino, Mechanical
characterisation of a glass/polyester sandwich structure for
marine applications. Materials & Design, 2012. 42: p. 486-494. 7. Branner, K., Capacity and lifetime of foam core sandwich
structures. 1995: Institutitet for skibs-og havteknik, Danmarks
tekniske universitet. 8. Davalos, J.F., et al., Modeling and characterization of fiber-
reinforced plastic honeycomb sandwich panels for highway bridge
applications. Composite Structures, 2001. 52(3): p. 441-452. 9. Mullin, J.V. and A.C. Knoell, Basic concepts in composite beam
testing. Materials Research and Standards, 1970. 10(12): p. 16-&.
10. Daniels, H.K., Harakas. H K. and Jackson, R C. Fiber Sri Tech,
1971. 11. Hollaway, L.C., Handbook of polymer composites for engineers.
1994: Elsevier.
12. BSOL, Fibre-reinforced plastic composites. Determination of flexural properties, in 2011, BSI.
13. CES Edupack 2014.
14. Mines, R.A.W. and A. Alias, Numerical simulation of the progressive collapse of polymer composite sandwich beams under
static loading. Composites Part A: Applied Science and
Manufacturing, 2002. 33(1): p. 11-26. 15. Christiansen, A.W., J. Lilley, and J.B. Shortall, A three point bend
test for fibre-reinforced composites. Fibre Science and Technology,
1974. 7(1): p. 1-13. 16. Boisseau, A., P. Davies, and F. Thiebaud, Fatigue behaviour of
glass fibre reinforced composites for ocean energy conversion
systems. Applied Composite Materials, 2013. 20(2): p. 145-155. 17. Weissman-Berman, D., Marine Sandwich Structures (Part II of II).
SAMPE journal, 1992. 28: p. 9-9.
18. Mouritz, A.P. and R.S. Thomson, Compression, flexure and shear properties of a sandwich composite containing defects. Composite
structures, 1999. 44(4): p. 263-278.
19. Gregory, J.R. and S.M. Spearing, Constituent and composite quasi-static and fatigue fracture experiments. Composites Part A:
Applied Science and Manufacturing, 2005. 36(5): p. 665-674. 20. Hahn, H.T. and S.W. Tsai, Introduction to composite materials.
Vol. 1. 1980: CRC Press.
21. Tsai, S.W., Theory of composites design. 1992: Think composites Dayton.
22. Waas, A.M., Failure Criteria for Composites. 1999, DTIC
Document.