Embed Size (px)
Citation preview

7Fishing Rights: The Case of the Peruvian Anchoveta Fishery
Vol. XL, N° 73, Second Semester 2013: pages 7-42 / ISSN 0252-1865Copyright 2013: Centro de Investigación de la Universidad del Pacífico
Universidad del Pacífico, Lima1
Elsa Galarza and Néstor Collado
Abstract
The implementation in 2009 of maximum catch limits per vessel (LMCE) in theindustrial anchoveta fishery has engendered a series of changes in fisheriesmanagement. Under this regime, fishing rights, which should strictly representthe resource rent payment made by a boat owner to the state for the use of apublic good, were fixed for a period of ten years. This research estimates theresource rent for the industrial anchoveta fishery for 2011, which entailsmaximum rent, and compares effort under open access and the LMCE regime.The current payment for fishing rights will also be discussed along with privatesector contributions, and contrasted to the results found in this study.
Key words: Fishing quotas, fishing rents, fishing rights, Peruvian anchovetafishery.
Fishing Rights: The Case of the PeruvianAnchoveta Fishery
1. Emails: Elsa Galarza: [email protected]; Néstor Collado: [email protected]. Article receivedon June 20 and final version approved on October 15, 2013.
Acronyms:D.L. Decree Law (Peru)D.S. Supreme Decree (Peru)Foncopes Compensation Fund for Fisheres Management (Fondo de
Compensación para el Ordenamiento Pesquero)IATTC Inter-American Tropical Tuna ConventionIHC Indirect human consumptionImarpe Peruvian Institute of the Sea (Instituto del Mar del Perú)LMCE Maximum catch limits per vessel (Límites máximos de
captura por embarcación)

Apuntes 73, Second Semester 2013 / Galarza and Collado8
2. UIT (Unidad Impositiva Tributaria) is an officially established Peruvian tax unit used to determine tax liability.
MEP Maximum economic productionMEY Maximum economic yieldMSY Maximum sustainable yieldMSP Maximum sustainable productionMT Metric TonOA Open AccessONP Pension Standardization Office (Oficina de
Normalización Previsional)OROP Regional Organization for Fisheries Management
(Organización Regional de Ordenamiento Pesquero)PMCE Maximum catch percentage per vesselProduce Ministry of ProductionPVCPD Surveillance and Control Program for Maritime Sector
Fishing and Landings (Programa de Vigilancia y Controlde la Pesca y Desembarque en el Ámbito Marítimo)
Sisesat Satellite systemSNP National Fisheries Society (Sociedad Nacional de
Pesquería)UIT Unidad impositiva tributaria2
WACC Weighted average capital cost

9Fishing Rights: The Case of the Peruvian Anchoveta Fishery
INTRODUCTION
Fishing rights have been conceptualized in a variety of ways in fisheries around the world.In some countries, fishing rights are imposed or require fishing licenses, while in others,they are based on the underlying concept of resource rent. In this respect, the definitionand calculation of fishing rent is an interesting exercise, albeit not an easy one, since itenables recognition of the payment that the state should receive for the use of a renewablenatural resource: in this case anchoveta.
The anchoveta fishery is of particular interest, not only because it ranks among the world’slargest, but because in 2008 Peru passed the Maximum Catch Limit per Vessel Law (Ley deLímites Máximos de Captura por Embarcación), which entails the assignment of resourceusage rights. Economic theory holds that the implementation of this instrument meansthat resource rent is the maximum possible compared with the open access status thatpreviously existed.
Peruvian fishing regulations stipulate a charge for fishing rights as payment for the use ofa resource belonging to the nation. Each boat owner is charged for fishing rights based ona percentage of the price of fishmeal per ton landed. Recently there has been debate as tothe relevance of the quantity of fish landed and whether this genuinely reflects the resourcerent, given that the implementation of LMCEs have prompted an increase in the value ofthe anchoveta resource.
The objective of this paper is to estimate the resource rent for the case of the Peruviananchoveta fishery, comparing the situation prior to 2009, when open access to the resourceexisted,3 to that under the LMCEs introduced in 2011. Furthermore, fishing rights and thepayments made by boat owners as a result of the implementation of the quota system isdiscussed in order to establish whether the estimated rent amount is covered. In this sense,the purpose is to clarify the problems that arise when calculating fishing rent and theextreme variability to which fishing rent estimates are subject as well as to providerecommendations for the effective collection of rents.
This study is divided into five sections. The first introduces the theoretical concept of rentand its application to fisheries. The second section presents the case of the anchoveta
3. It is worth noting that prior to 2009, the anchoveta fishery had been declared fully exploited and theentry of new boat owners was thus prohibited. Moreover, though an overall catch quota existed, thecompetition for the resource was high, leading to a fishing season of just 49 days per year. This periodcan therefore be seen as one of open access since the consequences were the same.

Apuntes 73, Second Semester 2013 / Galarza and Collado10
fishery and an estimate of rent in the current situation. In the third section, a reviewis provided of the literature on rent application in a range of fisheries and themethodologies employed. Then a proposal is presented for the model applied to thecase of the anchoveta fishery. In the fourth section, a rent estimate is provided for thePeruvian case. Finally, in the fifth section, the results are discussed in light ofdevelopments in the anchoveta fishery.
1. THE CONCEPT OF ECONOMIC RENT
The concept of rent in economic theory originates with the classics, specifically with DavidRicardo, who in On the Principles of Political Economy and Taxation (1973, 1816) definedrent (in accordance with the approach used in his time) as that portion of the land’sproduce paid to the landowner for its use, apart from production factors. For Ricardo, rentis a consequence of the value of the land, which increases due to its limited quantity andits quality and as a result of population growth. Many authors refer to this as differentialrent, which is associated with variations in the quality and fertility of the land.
The concept of rent is also applied to mining, another use of land for which rent is paid toits owner. In Ricardo’s conception, the justification for rent paid to the owners of naturalresources is the same as that for rent revenue received by a property owner or a franchiseawarded by an owner of a brand or formula, among other cases.
Therefore, every factor payment for land is known as Ricardian rent and is determined onthe basis of the difference between financial gain and costs. More modern authors useRicardian rent to refer to the long term profits that can be obtained by low cost producersor to the yield obtained by owners of scarce resources (Nicholson 2007). Thus, from aneoclassical viewpoint, rent is the marginal productivity of the natural resource, whateverthis may be.
The economic theory of rentAccording to Campbell and Haynes (1990: 5), resource rent is a form of economic rent. Ingeneral, economic rent is found in company profits, individual earnings, and in the pricepaid for goods. Undoubtedly, however, economic rent does not cover all profits, onlyearnings from any activity above or below what is required to render that activityeconomically justifiable in the long run. This definition requires consideration of twoimportant economic concepts: opportunity cost and normal profits.
Rent is not usually identifiable in regular accounting in companies. In businesses, grossearnings have two components: revenue that covers costs, and profits that provide a return

11Fishing Rights: The Case of the Peruvian Anchoveta Fishery
on capital investment. From the economic point of view, gross revenue can be split in two:normal returns, and rent.
Normal returns for an activity are accounted for by revenue that covers production costs(labor, basic ingredients, and other inputs), but also include returns on capital investment,in terms of depreciation of machinery and equipment, as well as the opportunity cost ofthat investment4; that is, that which is not obtained from the best alternative use of thiscapital must be taken into account (Nicholson 2007). When opportunity cost is considered,the activity returns are regarded as normal returns in the sense that they represent the bestresult that may be obtained from all available options.
The above mentioned concepts can be seen in Graph 1, in which the supply and demand forany good Q is shown. If this good is sold at a price P, then the revenue received by theproducer is the rectangular area with height P and base Q (price per quantity). The areabelow the supply curve for Q goods produced represents the production costs, which arelower than the revenue received; the difference obtained is the rent. This graph shows acompetitive market in equilibrium in which each producer receives the profits or normalreturns on the investment.
Graph 1Economic rent
4. This is not considered in a company’s accounting reports.

Apuntes 73, Second Semester 2013 / Galarza and Collado12
In summary, rent is all revenue received in excess over and above production costs measuredin terms of economic costs; that is, including the concept of opportunity cost.
Rent in fisheriesFollowing the definition of rent provided in the previous section, Owen (1998), Hartwickand Olewiler (1998), Charles (2001), Ithindi (2003) and DFID (2004) define fisheries rent asthe difference between the landed value of the resource and the total economic costs oftaking the catch to port. Simple though it may seem, the application of the concept of rentto fisheries requires the utmost care given the characteristics of this activity (stock variabilityand uncontrollable weather conditions), the fact that this is a renewable natural resource,and that the assignment of property rights plays an important role in determining rent.
First, it should be noted that boat owners face severe fluctuations in their revenue, whichdepends on the availability of the resource (species) in question, irrespective of the fisheriesmanagement model applied. This is because we are dealing with a natural resource that issubject to multiple uncontrollable factors such as weather variability, and biological andoceanographic factors. Nonetheless, one can expect that, in the long term, boat ownerswill be able to cover their direct and indirect costs. This situation causes problems indetermining rent and the means of collecting it, as will be discussed later on.
Moreover, fishing costs are primarily comprised of fuel, labor, license costs, and costs ofcapital invested in the vessel and fishing gear (Paredes 2010). These costs depend on vesseltype (wooden or steel) and size (hold capacity) and are related to the concept of opportunitycost of capital investment as the equivalent of investment in the best fishing relatedalternative. The variability of costs also poses a problem in determining rent, especiallywhen consolidated into a single rate or a single per ton amount landed.
Another relevant aspect in determining rent in fisheries relates to resource property.According to Campbell and Haynes (1990: 5), rent should reflect the amount payable foran unexploited resource when an efficient market for it exists and, precisely because nomarket for the fish exists prior to its extraction, the resource cost is zero for the individualfisher. Therefore, there will be an incentive for fishers to continue fishing until the marginalvalue is zero and, thus, the rent disappears.
Among the different fisheries, efficient markets are not very common given the lack ofproperty rights assignment. For instance, deep sea fishing resources do not have specificowners, they are found in international waters and therefore access is open, and their

13Fishing Rights: The Case of the Peruvian Anchoveta Fishery
management is highly complicated.5 Even inside the two-hundred mile limit or in theexclusive economic zone, where the Peruvian state is the legal resource owner, the applicationof property rights remains uncommon for fisheries (FAO 1999). As a result, resource accessis traditionally considered to be open. Nonetheless, the fisheries management system,responsible as it is for assigning individual catch quotas, is required to secure maximumprofits for the boat owner and the biological sustainability of the species. This systemallows the generation of rent (the greatest possible amount) which is maintained overtime, unlike in open access in which rent disappears as increasing numbers of boat ownersparticipate in the activity.
In summary, if a fishery is open access, there will be no resource rent due to the presence ofa very large number of fishing boats, which leads to the extraction of the resource beyondbiologically sustainable levels. Meanwhile, if a fishery falls under a regime of assignedproperty rights, the rent generated will be positive and will guarantee a biologically andeconomically efficient level of extraction.
This situation can be illustrated in a Gordon-Schaefer logistic growth fishery model (Galarza2010). Here, total revenue (IT) for the fishery is the yield (H) multiplied by the species price(p). If one relates IT to the fishing effort,6 Graph 2 indicates an initial increase and asubsequent decrease in IT. The total cost is determined, according to Owen (1998), as theunit cost (w), which represents the opportunity cost of factors multiplied by effort (E). Thus,costs increase as revenue increases. When the total revenue (IT = p.H) and total cost CT =w.E) curves are related, Graph 2 is obtained.
The widest vertical difference between the total revenue and total cost curves measureseconomic rent. This economically sustainable yield point occurs at a level of effort EMEP andcan be reached with a fishery regime that assigns property rights to fishers. In the case ofan open access regime, competition promotes a higher effort level, EOA , which leads to aneconomic rent equal to zero, known as common property yield. Even in the case when aneffort level is achieved that allows a maximum sustainable catch (EMSP ); that is, biologicalequilibrium, the rent will not be optimal so there will always be a tendency to increase theeffort and the rent will disappear. Therefore, the resource rent depends on the type offishing regime applied to the fishery (see appendix for further details).
5. Today there are international organizations for the management of certain fisheries in internationalwaters, such as the Inter-American Tropical Tuna Convention (CIAT) for tuna or the Regional Organizationfor Fisheries Management (OROP) for jack mackerel.
6. Fishing effort includes all costs necessary for extraction.

Apuntes 73, Second Semester 2013 / Galarza and Collado14
EMEP: Economically sustainable catch effort
EMSP: Maximun sustainable catch effort
EOA: Catch effort under open-access regime
Source: Hanneson (1993).
Graph 2Sustainable fishing model
2. THE CASE OF ANCHOVETA IN PERU
The history of the anchoveta fishery in Peru goes back to the 1950s, when development ofthe fishmeal industry commenced. For more than sixty years, this industry has gone throughboth expansion processes and crises7 which were the result of deficient management aswell as climactic factors such as the El Niño and La Niña phenomena.
Rent and the fisheries management systemThe anchoveta fishery, like many others around the world, has experienced the «tragedy ofthe commons» (Hardin 1968); that is, the absence of property rights on fish stocks and theirhabitat, which resulted in the absence of market forces to guide the behavior of this publicgood. As economic theory has shown (Gordon 1954), common property fisheries present amarket failure that is reflected in an excessive expansion of investment, which leads to theelimination of rent for the activity - especially given that a natural resource is concerned.The elimination of rent is accompanied by significant stock reduction (Arnason 2002: 8,18) which, in some cases, results in the disappearance of a species.
7. In 2010, Peru processed only 3.3 million MT of anchoveta due to the presence of juvenile specimens,which necessitated the imposition of bans. Nevertheless, 787,000 MT of fishmeal was produced and US$1,614 million FOB was exported.

15Fishing Rights: The Case of the Peruvian Anchoveta Fishery
Open access to anchoveta prompted a rush to exploit the resource that resulted, on the onehand, in a progressive reduction of fishing days, from 240 days in 2001 to just 52 days in2007, and, on the other, in a substantial increase in the daily catch, more than one hundredthousand MT. This meant there was a significant increase in anchoveta fishing and processingcapacity as well as considerable environmental impacts as a result of the excessiveconcentration of landings and processing. According to Paredes’ estimates (2010), thefleet’s hold capacity stood at between 2.5 and 4.6 times its optimum size, while plantinstalled capacity was between 3 to 5 times its optimum size.
In 2008, following many years of discussions regarding the establishment of a quotasystem, the LMCE Law (D.L. N° 1084)8 was passed for the Peruvian anchoveta and longnoseanchovy (engraulis ringens and anchoa nasus) fisheries intended for indirect humanconsumption. Until then, an instrument of this type had never been applied to one of theworld’s largest fisheries, a category to which anchoveta belongs9 (biomass of ten to twelvemillion tons) nor to one as variable as this fishery (due to the upwelling system in which itis located) (Freón et al. 2010; Clark 1976; Díaz et al. 2010). Individual catch quotas, as theyare known in economic theory, constitute an economic instrument that assigns a propertyright and thus simultaneously promotes the efficiency and sustainability of fisheries.Unlike open access, this regime allows resource rent to be maximized.
Fishing rightsThe concept of rent discussed in the previous section does not apply directly to the case ofthe anchoveta fishery or to many of Peru’s other natural resources, with the exception ofmining. Royalties have been applied as a form of taxation with the aim of extractingresources from mining because of the large earnings this industry generates. That is,resource usage rights are usually thought of as a tax - despite having different names -whose purpose is the redistribution of profits.
Nonetheless, the General Fisheries Law (Ley General de Pesca) and its regulations10 stipulatethat owners of large fishing boats (hold capacity of at least 32.6 m3) and small boats areobliged to pay a sum for the right to extract fishing resources which are public property,and that payment of this sum confers fishing rights (Chapter III, Articles 40 to 47 of theregulations).
8. This law was promulgated by the Presidency on June 27, 2008, based on legislative powers delegatedby the Peruvian congress.
9. Individual catch quotas have been applied in hundreds of fisheries around the world (e.g., New Zealand,Iceland, Australia, Canada, United States and, most recently, Chile) and it has been calculated that morethan 10% of the total worldwide catch corresponds to this type of regime.
10. D.L. N° 25977, General Fishing Law, and its regulations (D.S. N° 012-2011 Produce).

Apuntes 73, Second Semester 2013 / Galarza and Collado16
Right establishedNorm
Methods of charging for fishing rights have undergone many changes over time, as can beseen in Table 1. Traditionally, the sum paid for the right was established as a percentage ofthe UIT, but when the price of fishmeal started to increase, the calculation method waschanged. At present, the law establishes that rights are calculated by considering 0.25% ofthe FOB value per ton of fishmeal and the number of tons of anchoveta landed.
It should be noted that the current definition is not very precise. This means that howfishing rights are calculated is subject to interpretation. For example, one interpretationcould be that 0.25% of the average fishmeal price per ton – equivalent to 4.5 MT ofanchoveta11 — would mean that the per ton value of this resource would be just 0.056% ofthe FOB value. Nonetheless, current collection figures show that the calculation has beencarried out correctly; that is:
DP = 0.25% PPH x AD,
where PPH is the average FOB cost per ton of fishmeal and AD is the total tons ofanchoveta landed.
Table 1Fishing rights legislation
0.075% UIT/MT landed for: anchoveta, sardine, jack mackereland mackerel.
0.23% UIT/MT of hydrobiological resources landed forindirect human consumption.
0.116% UIT/MT landed for resources intended for indirecthuman consumption.
Based on 0.25% of the FOB value per ton of fishmeal (Aduanetaverage). Fishing boat owners can allocate 25% of the totalsum that they are obliged to pay for fishing rights to financescientific research projects, develop new technologies, trainsector workers, etc.
The sum payable and the calculation method for fishing rightsassociated with the extraction of hydrobiological resourcesintended for indirect human consumption is not to be modifiedfor ten years from the entry into effect of this legislation.
Chapter III of the GeneralRegulations of the GeneralFishing Law(D.S. N° 012-2011-Produce)
D.S. N° 007-2002-Produce
D.S. N° 011-2002-Produce
D.S. N° 024-2006-Produce
D.L. N° 1084-2007: LMCE, finalprovision [article 1]
11. The productivity of the fishmeal industry is highly variable since it depends on factors such as planttechnology and the type of meal produced, etc. After the application of LMCEs, the industry’s averageproductivity fell to 4.4 MT of anchoveta per ton of fishmeal.

17Fishing Rights: The Case of the Peruvian Anchoveta Fishery
Thus, between 2007 and 2010, fishing rights increased due to the rise in the price offishmeal from US$ 2.39 to US$ 3.71 per MT. It is noteworthy that the sums collected havebeen lower than is legally provided for as a result of problems in enforcing and overseeingthe sanctions established.
Fishing rights as applied in the anchoveta fishery have no relationship whatsoever to theresource usage cost or to what might be termed the royalty collected by the state, giventhat they permit the use of a public resource. As mentioned previously, fishing rights shouldbe calculated based on resource rent; that is, the difference between total revenue andtotal costs.
Table 2Fishing rights for anchoveta intended for indirect human consumption (CHI), 2007-2011
2007 957 2.39 6,160 14,737
2008 896 2.24 6,258 14,017
2009 953 2.38 5,935 14,140
2010 1,485 3.71 3,451 12,810
2011 1,357 3.39 6,994 23,727
Collection of fishingrights payments
(thousands of US dollars)
Average price(FOB; US dollars
per TM)
Fishing rights(US dollars per TM)
TM landed (thousands)
Year
Source: Paredes (2012).
On the other hand, S.D. N° 024-2006-Produce established that boat owners can allocate25% of the total sum they are obliged to pay for fishing rights to financing scientificresearch projects, developing new technologies, training sector workers, etc. Though notclearly explained in the legislation, the logic of this provision is that this percentage wouldbe allocated by the Ministry of Production (Produce) for the stated purposes. The ministryhas established the corresponding mechanisms for the use of these funds.
Finally, a key element of the LMCE Law is that it establishes that the sum payable forfishing rights for landings intended for indirect human consumption as well as thecalculation method to be used will remain unchanged for ten years. This provision cameinto effect in mid-2008, which means that the rights system cannot be modified until mid-2018. It was introduced because of the costs that the private sector must assume as aconsequence of the new LMCE system, which can be summarized as follows:

Apuntes 73, Second Semester 2013 / Galarza and Collado18
A. Payment of US$ 1.95 per MT landed in industrial fish processing facilities for thecreation of an intangible fund as a permanent solution to the problem of the fishermen’spension system (social contribution).
B. Contribution to the Fishermen’s Social Security and Benefits Fund (Caja de Beneficiosy Seguridad Social del Pescador), set at US$ 0.26 dollars per MT landed.
C. Payment of between 24 and 35 Peruvian soles per PMCE (maximum percentage catchper vessel),12 assigned to each vessel as a fixed annual contribution to Foncopes13
(covers fixed costs).D. Variable payment per vessel to Foncopes, based on the number of workers on the
benefits program (covers variable costs).E. Payment towards the satellite system (Sisesat).F. Payment towards the Surveillance and Control Program for Maritime Sector Fishing
and Landings (PVCPD).14
In the first case, the payment of US$ 1.95 per MT constitutes a social contribution inresponse to the welfare problem of the fishermen’s retirement fund. The contribution isfixed and is set for a period of ten years. Although this requirement is not directly relatedto the LMCE management system, it was considered appropriate to guarantee theinstrument’s social viability. The second payment mentioned above is a contribution to theretirement funds of the Fishermen’s Social Security and Benefits Fund.15
Foncopes was created by the LMCE Law in an attempt to address the law’s social implications;namely, the decline in the number of workers in this fishery resulting from efforts to curtailexpansion of the fishing fleet. To this end, a special voluntary retirement scheme wasintroduced with incentives and an occupational retraining program, financed entirely byprivate contributions. In this case, the contribution has a fixed and a variable component,the latter based on the number of workers registered in the program.
In the case of the PVCPD, the aim is to tackle illegal exploitation of the sea’s hydrobiologicalresources, whether in terms of vessels without fishing permits, landings that exceed authorized
12. In the case of vessels with permission to fish in the center-north zone, the annual payment variesbetween 25 and 35 soles while for vessels with permission to fish in the south zone, the amount rangesfrom 2 to 3 soles.
13. The Compensation Fund for Fisheries Management (Foncopes) was established with the aim of providingsupport and training to fishermen displaced from the anchoveta fishery as well as redeployment in otherfisheries and sectors.
14. D.S. N° 027-2003-Produce.15. The fund was declared insolvent this year and workers will now be reassigned to private insurance
schemes or the Pension Standardization Office (ONP).

19Fishing Rights: The Case of the Peruvian Anchoveta Fishery
limits or the catching of unauthorized resources. This program was approved in 2003and since then has contributed to strengthening the surveillance and control capacitiesfor state resources. The program is notable for being financed by the private sector.Payment for services provided by private companies specialized in reporting, inspection,and control – currently SGS and Cerper – is assumed by the owners of licenses forindustrial fish processing facilities through agreements of full and faithful compliancewith the provisions contained in the program, in accordance with the models approvedby Produce. Recently, by way of D.S. N° 008-2010-Produce, the program was extended toinclude industrial fish processing plants that manufacture products for indirect humanconsumption and residual fishmeal, plants that reuse discards and waste fromhydrobiological resources, and plants that manufacture products for direct humanconsumption and conventional and/or high-protein fishmeal. The aim of all of theabove is to improve levels of control.
The characteristics of the Peruvian fishing industry are such that a series of complementarymeasures were required to ensure the viability of introducing the quota system, such assupport for the fishermen’s pension system. As the state was unable to assume these costs,private sector contributions were introduced for the social programs mentioned above.
Fishing rights in other countriesAs mentioned above, the concept of fishing rights is applied in a variety of different ways,some in order to reveal fishing rent, in which case fishing rights constitute a royalty, whilein other cases, the approach is more comparable to taxation.
In the case of Australia, resource rent is extracted by levying taxes (Rodgers and Webster2007: 3). In the abalone fishery, 6% of the gross annual value was collected in 2000 basedon the average beach price. In 2004 the calculation method was altered in response toconcerns that the levy was too high and the formula became based on an indexed sliding-scale linked to the average annual beach price. For example, if the price falls below $43 perkilo, no taxes are levied. On the other hand, if the price is between $43 and $52 perkilogram, between 0.5% and 5% of earnings are collected (5% in the case of $52). Themore variable the price, the higher the rate of contribution.
In Chile (Peña 2008: 2), the so-called patent (patente) is conceptualized as a tax forrecouping the costs of administering that country’s fisheries management system. Prior tothe latest reform, 2% was paid on annual fisheries sales under an individual quota regime.Under the current system, there is one part that is a fixed payment and another which isvariable, depending on landings.

Apuntes 73, Second Semester 2013 / Galarza and Collado20
Owen (1998: 204) states that in the South American countries, access fees are calculatedbased on a percentage of expected revenue. In addition, he explains that an access feebased on total revenue is confused with a fee based on access value because the calculationmethod for the former has more in common with a revenue tax than a resource rent tax.
In the case of Namibia’s horse mackerel fishery, Ithindi (2003: 15) notes that country’sfisheries administration issues fishing rights through bids for four, seven and ten years. Thisprocess assesses factors such as investment in vessels and facilities, fishing experience andsocial investment. Namibia extracts fishing rent via an ad valorem tax of between 5% and15% of fish prices, adjusted for vessel type.
3. THEORETICAL FRAMEWORK
As with all economic activity, producers (boat owners in our case) aim to maximize rent.Under an open access scheme, the incentives lie in maximizing rent in the short run withoutaddressing the resource’s biological factors. In an assigned rights scheme there are incentivesto both maximize rent and to sustain the resource over time. In other words, fishing effortis reduced with the aim of extracting a smaller quantity of the resource so as to insure thelargest possible difference between total revenue and costs. Earnings acquired via thislevel of effort are termed fishing rent.
As mentioned in the previous section, setting the rent in the fishing sector is challenging asit depends on factors of both supply and demand. Thus, for example, rent may vary due tochanges in technological factors, input prices and biomass size, etc. Likewise, not allfisheries contain the same number of vessels, technology, experience, and cost structure.Overestimated rent could result in the penalization of those with a lesser capacity to meetcosts, potentially giving rise to efficiency losses. On the other hand, an undervaluation ofrent creates a beneficial situation for the producer. According to Owen (1998: 201) thiscould encourage innovation, though certainly not on the part of the state.
Methods of charging fishing rentAccording to Grafton (1995: 57), the literature defines four methods for estimating rent infisheries. These are:
A. Quota rental charge: The rent (R) collected from fisher i over time t is determined as aproportion of the price of the quota multiplied by the number of quotas held by thefisher in a competitive market at a rate of interest r.
Rit = Ctrqit ,

21Fishing Rights: The Case of the Peruvian Anchoveta Fishery
where is the quota charge rate, C the quota price at time t, r the competitive interestrate, and q the number of quotas held by fisher i at time t. One of the main problemswith this method lies in recognizing the expected quota price, especially in the absenceof a competitive market, when quotas are concentrated in the hands of a few. Theother problem is that this method is ex ante and therefore rent is captured based onexpected rather than real profits.
B. Profit charge: ex post method that captures rent as a fixed proportion of fisher profit.
Rit =p si p 0it it 0, d.o.m.
Where p is the profit charge rate and the profit of fisher i at time t. This method canonly capture rent when the profits are positive. However, the government is vulnerableto problems of information asymmetry and it would be very difficult to ascertain theprofits attained by producers. In addition, those fishers who invest with borrowedcapital will profit more under this method if the interest payments are deductible or ifthere are measures such as accelerated depreciation or other schemes that render bookprofits different from real profits. Therefore, the effects of this charge are not uniformamong fishers.
C. Lump sum charge: the total rent to be collected, R, is divided by the percentage quotafor fisher i at time t; the charge is similar for all quota holders, although it cannot beassumed that all fishers will incur the same costs. Administratively, this method is veryeasy to implement once the rent has been determined. Unlike the previous method,there is no scope for the boat owner to attempt to reduce profits in order to avoidpayment of rent. Nevertheless, the fixed charge will not vary if the rent varies, makingit necessary to recalculate rent and the charge.
D. Ad valorem charge: collection of rent as a percentage of the landed resource pricetimes the number of individual quotas held. This method is flexible against rent valuechanges arising from fluctuations in product price. It also reduces the likelihood ofcollecting rent when fishers suffer losses. Moreover, its flexibility allows differentiatedrates to be established according to profit levels.
There are countries that use one or another of these four methods to obtain fishing rent.Owen (1998: 198) states that in many cases an additional cost per unit of effort is applied,equivalent to an ad valorem royalty on the catch. In the countries of the southwest Pacific,for instance, access fees tend to be a percentage of expected revenues. In Namibia, rentcollection is calculated using the ad valorem method (Ithindi 2003: 15).

Apuntes 73, Second Semester 2013 / Galarza and Collado22
The modelRent estimation requires the determination of the profits generated in the fishery. To thisend, the Gordon-Schaefer (Arnason 2007) method will be employed, which allows theconsideration of two moments in time: 2006, under an open access regime in the anchovetafishery, and 2011, under a catch quota scheme. According to economic theory, rentmaximization should occur in the 2011 context as a consequence of the bioeconomiccatch level; that is, when the profits that are subject to the conservation of the biologicalresource are maximized.
To estimate catch and effort levels in conditions of open access and of assigned propertyrights, the following equations are used:
(1) Biomass growth function: x = G(x)-y(2) Extraction function: h = H (E,x) = q.E.x(3) Biomass growth function: G (x) = a.x - b.x2
(4) Costs function: C (E) = c.E + fk(5) Revenue function: I (H) = p.H (E, x)(6) Profits function: = p.H (E,x) - C(E);
where x, h, q, E, , p, c and fk represent: biomass, volume extracted (catch), catchabilitycoefficient,16 fishing effort, profits, landed fish prices, marginal cost and fixed costs,respectively. The costs function (4) includes the capital opportunity cost.
If it is assumed that the biomass is at equilibrium, the growth function is equal to zero(x = 0). Thus, equation (1) would be represented as follows (Arnason 2007: 4):
(7) Condition of biological equilibrium: G (x) = H (E, x)
If functions (2) and (3) are replaced in expression (7), the following relationship is obtained:
(8) a.x - bx2 = q.E.x,
and rearranging it, we obtain:
(9) x = a qb b
. E
16. The catchability coefficient (q) measures the level of technology employed in fish extraction.

23Fishing Rights: The Case of the Peruvian Anchoveta Fishery
17. The shadow price can be represented by the fishing quota price, provided that a competitive marketexists.
a q2
b b. q.E. . E2
a q2
b b
Relationship (9) is replaced in the catch function (2), obtaining:
(10) H (E, x) =
If are expressed as and , an extraction function is obtained that depends
on effort, E:
(11) H (E, x) = .E. - .E2
Then, on replacing function (11) in expressions (5) and (6), we obtain:
(12) Revenue function: I (E ) = p. (.E .- .E2)
(13) Profits function: = p. (.E. - .E2) - C (E )
. q and
The maximization of the biomass growth function (3) or the attainment of the conditionof equilibrium (7) allows the MSP to be found, which constitutes biological equilibrium.The level of effort that maximizes profits (13) allows the maximum economic production(MEP) to be obtained; that is, bioeconomic equilibrium.
A fundamental element in calculating the rent is the use of a price that reflects the valueof the resource. With this in mind, the shadow price17 or social price should be used, whichis defined as the marginal value of a stock unit in terms of its contribution to future profits,taking into account the growth of the stock as well as its implications for extraction costs(Hatcher n.d.). The shadow price of the resource can also be defined as that which isconstructed for those goods that are not traded on the market; thus, it can be said that itexpresses the value of the resource for society (De Bruyn et al. 2010).
Method of estimating variablesThe results provided by the model are the levels of stock, catch and equilibrium effort. Onthis basis, the economic variables of revenue and costs are resolved in order to thencalculate the rent. Table 3 provides a summary of the coefficient and variable estimationmethods.

Apuntes 73, Second Semester 2013 / Galarza and Collado24
Biomass growth function
Biomass growth function
Maximumcarrying capacity
Captura de MPS
Catch coefficient
Catch function
Catch function
Catch function
MPS effort
Economic coefficients
Cost function
Cost function
Cost function
Income function
Income function
Variables (in base year)
Landings
Biomass growth
Intrínsic growth rate
Intrínsic growth rate
Maximum biomass that canbe sustained by theecosystem
Maximum sustainable catch
Catchability
Coefficient of catchfunction
Coefficient of catchfunction
MSP effort
Proportion of fixed cost overtotal cost
Fixed cost
Marginal cost over variable
Historical beach prices
Cost of catch
Volume of landings
Biomass growth
a > 0
b > 0
q > 0
> 0
0
E > 0
fk / CT > 0
H (t) > 0
Authors’ owncalculation
Authors’ owncalculation
a / b
4. Ka
a
b
K
H(2)
q
E (2)
fk / CT
f k
c
P (t)
P
H (t)
X(t+1)-X(t)
Nomenclature Description Permissiblevalues
Method orsource(1)
Coefficients& variables
q = e ln(CPUEt /Xt )nt
n
Biological coefficients
q2
b
ab
. q
2
National FisheriesSociety (SNP)
SNP
Produce
Instituto del Mardel Perú (Imarpe)
fk = (CT).( )CTfk
C.E* +
Produce
H*P =
Table 3Characteristics of coefficient and variable estimation methods
Notes:(1) Here and in tables 4 and 7, the data was provided directly by the SNP, Produce, Imarpe and the Vice-
Ministry for Fisheries.(2) Values that correspond to biological equilibrium.Source: World Bank (2009); authors’ own calculations.

25Fishing Rights: The Case of the Peruvian Anchoveta Fishery
Coefficients a and b of the biomass growth function (3) are calculated through an ordinaryleast squares regression of historical catch and biomass data for the period 1990-2011.
Because of information limitations, the shadow anchoveta price has been estimated asthat which allows us to arrive at the point of perfect competition equilibrium; that is, zeroprofit, at a level of MSP. Following the Gordon-Schaefer model, the condition of equilibriumwill be given by:
(14) P = Cme,
which, including cost components, results in:
C. E*H*
P = ,
where C, E* and H* are the cost per unit of effort of the most inefficient vessel,18 the MSPeffort, and the MSP catch, respectively.
Rent calculation for the industrial anchoveta fisheryUtilizing the above model, the estimate was carried out based on the data in Table 4.
The average costs per ton were calculated using a weighted average of steel and woodenvessel costs. The assigned weights represent the proportion of the catch quota for eachvessel type. This average weighted cost was multiplied by the WACC to incorporate theopportunity cost of capital.
(15) Average costs per MT: Cprom = (0.8.Cme + 0.2.Cma) * (1 + WACC),
where: Cme and Cma are the costs per MT for metal and wooden vessels respectively. Inaddition, it has been assumed that the proportion of fixed and variable costs is the samefor both vessel types and that the WACC and vessel participation for 2011 is maintainedover the period 2006-2011.
18. For 2011, the most inefficient vessel costs are those corresponding to wooden vessels.

Apuntes 73, Second Semester 2013 / Galarza and Collado26
Fishing effort (E)
Landings (H)
Biomass growth (X)
Cost of landing
- Thousands of m3 1990-2011
- Thousands of TM 1990-2011
- Thousands of TM 1990-2011
- US$ 2000-2011
- US$ per TM 2006-2011
13 % 2011
90 US$ per TM 2011
179 Thousands of m3 2011
6,994 Thousands of m3 2011
227.63 US$ 2011
0.27 Ratio 2011
692,195.62 Thousands of US$ 2011
899,832.40 Thousands of US$ 2011
213 Thousands of m3 2006
5,935 Thousands of MT 2006
101.85 US$ 2006
0.45 Ratio 2006
452,853.64 Thousands of US$ 2006
151,596.58 Thousands of US$ 2006
Vice-Ministry of
Fisheries
Produce
Produce / SNP
SNP
SNP
SNP
Produce
Produce
Produce
SNP
SNP
Produce
Produce
Produce
Produce
SNP
SNP
Produce
Produce(deseasonalized)
Fixed and variable costs ofrepresentative metal vessel
WACC (weighted average cost ofcapital)
Variable costs of wood
Fishing effort (E), 2011
Landings (H), 2011
Landing cost, 2011
Fixed coefficient cost, 2011
Total cost, 2011
Profits, 2011
Fishing effort (E), 2006
Landings (H), 2006
Landing cost, 2006
Fixed coefficient cost, 2006
Total cost, 2006
Profits, 2006
Variables Value Unit Períod Source
Table 4Characteristics of the data utilized
.
4. RESULTS
The rent for 2011 is calculated according to two points of reference: MSP and MEP effort.The empirical data utilized is shown in Table 5.

27Fishing Rights: The Case of the Peruvian Anchoveta Fishery
7,323.68
181.87
1.8038
0.0001
80.53
0.2214
103.33
181.87
7,323
120.18
6,481
156.31
7,179
Variable Value Unit
Table 5Estimated data
Maximum sustainable yield (MSP)
MSP effort
Biomass growth function (a)
Biomass growth function (b)
Catch function ()
Catch function ()
Shadow price
MSP effort
Landings (H)
MEP effort, 2011
MEP landings, 2011 (H)
MEP effort, 2006
MEP landings, 2006 (H)
Thousands of MT
Thousands of m3
Coefficient
Coefficient
Coefficient
Coefficient
US$
Thousands of m3
Thousands of MT
Thousands of m3
Thousands of MT
Thousands of m3
Thousands of MT
The estimated data allow the following functions to be obtained:
(16) Costs function: C (e) = 2,822.e + 186,892.82
(17) Income function: I (p, H ) = 103.33.H
Graph 3 shows the total revenue and total cost curves for 2006 and 2011.
Graph 3Anchoveta fishery revenue and costs

Apuntes 73, Second Semester 2013 / Galarza and Collado28
At MEP
At MSP
OA
Real
6,481 120.18 143,547.73
7,324 181.87 56,469.32
7,255 199.39 0
6,994 179.00
H(thousands of TM)
Ê(thousands of m3)
^ Rent 2011(thousands of US$)
^
The total revenue curve was calculated by multiplying the proposed shadow price by thecatch function, which depends on effort. As mentioned earlier, this price - US$ 103.33 perMT of anchoveta – results in an MSP catch in which the profits are zero. The LMCE Lawprompted a change in the negotiating power of the boat owners, who have seen theirprices increase from 2009 (the first season under the LMCE regime). Thus, the average pricefor the period 2000-2008 was US$ 79 per MT of anchoveta, while for the period 2000-2011 it was US$113 per MT. The calculated shadow price lies within a range of reasonableprices, though there are still improvements to be made in the method of estimation. Inaddition, more detailed information is needed.
As regards costs, a reduction of those incurred by the fleet’s extraction was anticipatedinsofar as the LCME regime encourages cost minimization; that is, a smaller number ofboats could be used to attain the same catch level. Nonetheless, the issue of cost reductionhas still not been completely settled. In 2011, the proportion of fixed costs fell versus2006, while the variable costs rose. In that year, the variable cost was US$ 41.97 per MTand in 2011 it was US$ 72.25 per MT. Among other reasons, this increase was explainedby the change in the boat owners’ production strategy, especially among owners of fleetswho seek to extract high quality raw material, which entails, for example, not operatingat full capacity.
The maximization of profits based on the preceding functions allows us to find Ê, H and therent at the point of MEP, as shown in Table 6.
Table 6Results
The results are as expected according to the economic fishing model. The MSP effort isgreater than that of the MEP, and the real 2011 effort is less than the MSP. The real effortfor 2006 of 213,000 m3 reveals a trend approaching the bioeconomic equilibrium point(MEP). Moreover, the MSP rent is less than the rent at the point of MEP, also in line withexpectations.

29Fishing Rights: The Case of the Peruvian Anchoveta Fishery
Social contribution for retirement 13,638.50
Contribution to the Fishermen’s Benefits and Social Security Fund 1,818.44
Fixed payment to Foncopes 2,580.22
Variable payment to Foncopes 7,175.80
Surveillance and control program of landings 9,092.20
Sisesat 1,888.38
Total 36,193.54
Contributions
5. REFLECTIONS ON FISHING RIGHTS AND RENT
If one deems payment for fishing rights to be those charges that represent the resourcerent, then it is necessary to discuss two aspects: the first concerns the quantification ofpayments made by boat owners for the right to fish and of the other charges assumed aspart of the commitments required following the implementation of LMCEs in relation toestimated rent. The second aspect relates to the method of charging for fishing rights(rent), with the understanding that, to date, the vehicle for charging has not been the mosteffective means of recovering rent.
As mentioned earlier, there are commitments assumed by the private sector as a result ofthe implementation of LMCEs whose quantification is presented in Table 7. Thesecommitments cover six line items: social contributions for retirement; contributions to thefishermen’s fund; fixed and variable payments for the retraining program (Foncopes);payment towards the surveillance and control program for landings (SGS and Cerper); andpayment for the Sisesat.
Table 7Contributions made by the private fishing sector, LCME Law, 2011 (thousands of US$)
Sources: Produce (2013); SNP (2013).
In Table 7, the stated figure for the variable payment to Foncopes is an annual average ofFoncopes account statements, given that no information is available for individual payments.In that year, the total payments made by the private sector were US$ 36.2 million. Accordingto the estimates made, payments for fishing rights - set at 0.25% of the FOB price offishmeal per ton of anchoveta - for 2011 was US$ 23.7 million. Therefore, the total paid bythe private sector in 2011 was US$ 59.9 million (Table 8).
Apuntes 73, Second Semester 2013 / Galarza and Collado30
Private sector contributions
Fishing rights
Total (costs and rights)
36,193.54 5.17 4.02 25.21
23,727.00 3.39 2.64 16.53
59,920.54 8.57 6.66 41.74
Percentageof MEP
rent
Percentageof
profits
Value perMT
(US$)
Value(hundreds of
thousands of US$)Rent or right
Table 8Economic rent: private contributions and payment for rights, 2011 (dollars)
If the total paid by the private sector is compared with the estimated rent for 2011 in MEP,the former only covers 41.74% of the latter; that is, an average equivalent of US$ 8.57 ispaid per MT of anchoveta landed. This shows that even when the additional contributionsfor fishing rights are taken into account, private boat owners do not cover the resourcerent, with 58.26% going uncharged.
This outcome may be interpreted in diverse manners and it is not within the scope of thispaper to discuss the reasons why this situation exists. Nevertheless, the fact that the statedoes not collect the total rent does not mean there has been a decline in social efficiency.In this case, surpluses for boat owners have led to additional investment in other fishingsubsectors,19 resulting in greater industry diversification.
This situation makes it evident that the method of charging for fishing rights should bereviewed with a view to establishing a more effective alternative that extracts the entirerent resource. Without doubt the complex reality of the fishing sector requires that themethod employed be sufficiently flexible so that it can be adapted to the variability ofanchoveta prices and resource catch conditions.
Therefore, as an exercise we propose a rent capture method that contains one part that isflexible and another that is variable.20 The logic of this form of collection lies in thedependence of rent on total revenue and cost. The latter tends to be more stable over timewhile revenue has two large sources of variability: the catch and the evolution of prices. Inthis sense, rent is a variable number and hence its collection must also have a variablecomponent.
19. For instance, companies that previously operated only as fishmeal producers have ventured into the fishcanning industry or other fisheries.
20. The economic basis is a two part fee.

31Fishing Rights: The Case of the Peruvian Anchoveta Fishery
MEP rent
Fixed rent (40%)
Quota
Fee per percentage
Dollars per TM
MEP rent
Variable rent (60%)
Total catch
Fee per MT of anchoveta
Fee per MT
143,547,731.76 US$
57,419,092.70 US$
100% % of PMCE
5,741.91 US$ per 0.01%
8.21 US$ x MT
143,547,731.76 US$
86,128,639.05 US$
6,994,000.00 MT
12.31 US$
0.9% % of HdP price
Variable Value Unit
Variable Value Unit
At present, 40% of the fishing quota is determined by a vessel’s hold capacity; that is, bythe effort, which in turn determines the company’s total cost. The remaining 60% is madeup of the catch, which together with the price, determines total company revenue. For theproposed exercise, the fixed part is based on the quota percentage rather than vessel holdcapacity, given that the latter still varies.
The fixed part of the 2011 fishing rights will be 40% of the economic rent for the sameyear (US$ 57.4 million). When this amount is divided by 0.01% of the 2011 PMCE, onefinds that vessels would have had to pay US$ 5,741 per 0.01% of PMCE, which is equivalentto US$ 8.21 per MT (see Table 9).
Table 9Exercise in estimating fixed rent charge, 2011 (dollars)
Sixty percent of the economic rent corresponds to the variable rent charge; that is, US$ 86.1million. The collection of this variable rent, by metric ton of anchoveta extracted in 2011,is equivalent to US$ 12.3 per MT (see Table 10).
Table 10Exercise in estimating variable rent charge, 2011 (dollars)
In summary, the fishing right should be equal to:
DP = 5,741 US dollars * (per 0.01% PMCE) + (0.9% of the average FOB fishmeal price) * (MTof catch)

Apuntes 73, Second Semester 2013 / Galarza and Collado32
Since the goal of charging for fishing rights is to extract the resource rent, if there were norent, nothing would need to be paid. Therefore, fishing rights would require a set minimumbelow which rights would not be charged. The indicated minimum could be the anchovetaprice at which the rent is equal to zero.
This simple exercise in distributing total estimated rent for 2011 allows us to visualize thescale of the «prices» that should be used in charging for fishing rights as synonymous withrent. Nonetheless, more detailed studies are required to establish the optimum parametersfor a two part fee, such as that proposed for fishing rights.
Finally, this study is considered an initial estimation of fisheries rent of anchoveta in thePeruvian case. A series of variables have been identified that change over time and thismakes it necessary to estimate rent for each period. Therefore there is a need for researchinto the incorporation of dynamic models that consider uncertainty variables. As in thecase of this study, one of the main constraints on such research is the lack of detailedinformation in terms of both complete series and consistent sources.
Another element that requires more in depth analysis is the estimation of the shadowanchoveta price. According to the literature, complex models do exist which require moreanalysis time as well as information that, in some cases, is not registered.
Finally, to enhance the impact of this research, alternative fee schemes for the collection ofrent should be proposed in order to contribute to sustainable management of fisheries.

33Fishing Rights: The Case of the Peruvian Anchoveta Fishery
APPENDIX
Fishing rightsFishing rightsFishing rightsFishing rightsFishing rights21
The classic Gordon-Schaefer bioeconomic model is useful for analyzing how fishing effortand biomass behavior determine the sustainable yield of a fishery.
Population biological mechanismsGiven a particular marine species in a specific geographical location, the population orbiomass size will be naturally limited. According to Graph A1, the biomass grows over timebased on a minimum stock (Xmin), initially at an increasing rate due to the abundance offood and later decreasing growth until reaching a level Xmax of the habitat’s maximum self-sustainability capacity (biomass saturation level).
Graph A1Biomass growth over time
21. This model is based on chapter five of the book Economía de los recursos naturales (Galarza 2010).
The change of stock between one period and another will be represented by dX (t ) / dt. Thus,the growth rate of a population over a period of time, when the resource is not exploited,will be given by F (X ) = dX (t ) / dt; that is, the net growth rate of biomass X stock for a shortperiod of time.
Apuntes 73, Second Semester 2013 / Galarza and Collado34
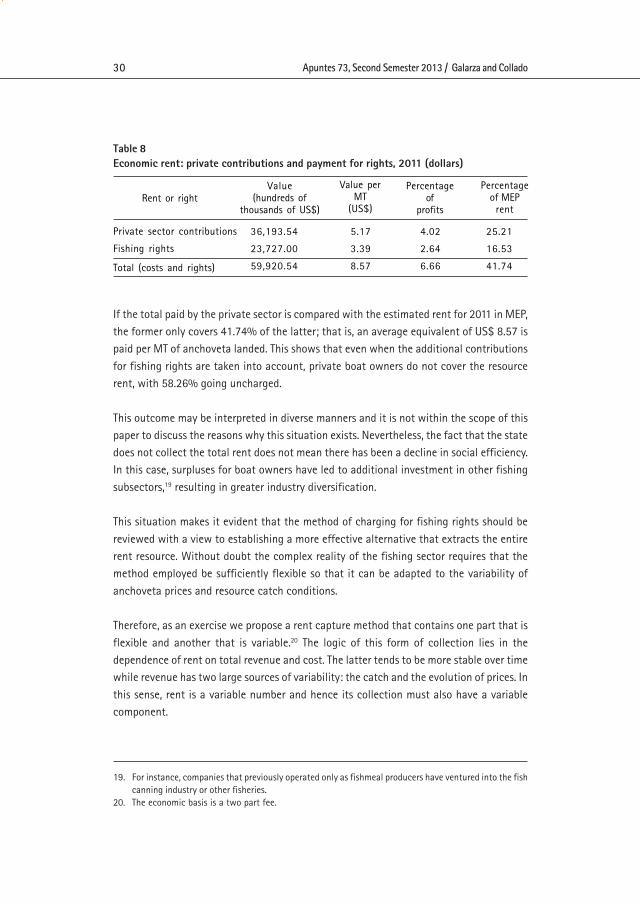
Graph A2 represents instantaneous growth in relation to stock size, in which F (X ) isrepresented by a logistic function. It can be seen that with a small but positive stock,biomass grows rapidly, and when growth reaches its maximum level, to stock XMSP, it thenstarts to decline until reaching its maximum level of habitat support, with a stock equal toXmax and a growth rate equal to zero. It should also be noted that, with two different stocklevels, X1 and X2, the same net growth rate applies. This is because in X1, the stock is smallso there is enough food for all specimens and the number of births over deaths representsa large proportion of the stock; in X2, on the other hand, births still exceed deaths andrepresent an equal growth rate over a larger stock.
Graph A2Biomass growth function
Graph A2 shows that sustainable revenue (on the y-axis) increases along with fishing effort(number of vessels on the x-axis), since the volume of fishing increases (ascending part ofthe curve). Nonetheless, given that fishing volume is a function of biomass and thatbiomass is inversely related to the fishing effort, the slope of the sustainable revenue curvedecreases until it reaches zero, the point that corresponds to the maximum sustainableyield (MSY). After this point, all increases in fishing effort are reflected in a decrease insustainable revenue (descending part of the curve), and correspond to overexploitation ofthe fishery. The distance between the sustainable revenue curve and the total costs (CT) linerepresents economic rent, which is maximized at the point of MEY which, as can be seen onGraph A2, is lower than the MSY. This result is very interesting and not necessarily intuitive

35Fishing Rights: The Case of the Peruvian Anchoveta Fishery
since it shows that economic maximization does not necessarily correspond to themaximization of fishing effort, even if this is sustainable from a biological point of view.
Bioeconomic equilibrium in a simple modelIf one introduces the economic analysis of fishing activity, a bioeconomic equilibrium willresult, which involves a biological and economic equilibrium.
Graph A3 shows that if the extraction rate is H2, then the growth function F (X ) is found atits point of MSP. Given the logistic growth function, the MSP point will have a stock equalto half the habitat support capacity (k/2). Since H2 exceeds F (X) for any stock valuebetween XMSP and k, the stock will gradually decrease until reaching XMSP (o k/2). In this case,the remaining biomass will grow to the maximum rate since space and food exist.
Graph A3Stock and extraction levels
This extraction level H2o HMSP is the maximum sustainable and is the result of extractingexactly the biomass growth level (in a unit of time); that is, the maximum stock growthlevel. Given a simple fishing model, in which there are no extraction costs and futurerevenue is not discounted, this level of extraction will be the fishery’s desirable biologicalequilibrium. As we will see, this equilibrium will coincide with the fishery’s point ofmaximum revenue.

Apuntes 73, Second Semester 2013 / Galarza and Collado36
Extraction with open access and private propertyFirst, an extraction function is defined for the industry by assuming that the fishingindustry is perfectly competitive; that is, price taking (including factor price), with thesebeing constant over time. Furthermore, fishing effort (E) is a measure of the productionfactors used by the industry: capital, work, materials and energy, and may be measured byvessel hold capacity or the number of nets with which the fishing industry is provided. Theother factor that determines extraction is fish stock (A) over a period t: the bigger the stockgiven the same effort level, the higher the number of fish that can be caught (graphs A4and A5).
Graph A4Equilibrium in open access
Graph A5Equilibrium in private property

37Fishing Rights: The Case of the Peruvian Anchoveta Fishery
Let us assume that there is open access to a given species; that is, anyone with a boat and netscan catch it if he wishes to do so and the extraction unit costs, measured in soles per unit ofeffort, are constant and equal to «c». Graph A4 shows the total industry costs, represented byline CT0 whose slope is equal to «c »(CT0 = cE ). Total industry revenue is given by the speciesprice multiplied by the quantity caught. Given total costs CT0 and total revenue, the openaccess equilibrium level will be at point A. Lower effort levels have positive profits, whichencourages the entry of more companies into the industry, thus increasing the effort level. Atpoint A, costs equal revenue, thus discouraging the entry of companies and the increase ofeffort. The equilibrium of open access will utilize an effort E0.
Open access equilibrium can also be analyzed based on the marginal extraction cost (dCT/dE = CMg), which is equal to «c»; of the mean revenue (IT/ E = IMe) and of the marginalrevenue (dIT/ dE= IMg). Open access equilibrium occurs at the point where mean revenueintersects with marginal cost. As can be seen, at this point CMg is greater than IMg and theIMg are negative; therefore, it cannot be economically efficient. To be efficient, industryprofits (IT- CT) must be maximized, which is achieved via an effort level that complies withthe condition of maximization: IMg = CMg.
Finally, sustainable extraction levels are shown for different stocks. It can be seen that twocompatible levels of stock, X0 and X1, exist for the level of extraction H0. As the open accesseffort level E0 falls to the left of the MSP extraction point, the biomass stock for this levelof effort will be less than XMSP . Graph 4 shows that more effort than is necessary is used toextract the same level of biomass H0 (E0 > E1).
In summary, two conclusions can be drawn regarding open access equilibrium in fishing.First, this equilibrium occurs when IT = CT, which means that IMe = CMg. In addition, at thispoint CMg is greater than IMg. Second, open access equilibrium can be economically andbioeconomically inefficient. It is economically inefficient since efficiency requires CMg =IMg, which is not achieved. It can be bioeconomically inefficient if, as in the case presented,equilibrium is to the left of stock, XMSP, so that the same extraction can occur with greaterstock. Nonetheless, if the extraction unit cost is greater (c’ ) , then this equilibrium isbioeconomically efficient.
The individual decisions of companies do not ensure socially optimal distribution of resourcesbecause of market failures caused by the absence of property rights. Therefore, it is nowassumed that each company is assigned exclusive rights to catch a species in a givenregion. If companies have well defined property rights, the industry behaves competitivelyand there are no other externalities; thus, the assignment of property rights guaranteesthat the social optimum is reached.

Apuntes 73, Second Semester 2013 / Galarza and Collado38
This is explained by the fact that since each company is the sole possessor of an extractionarea, companies incorporate into their decisions the effect of the effort applied to the fishstock and the level of extraction. In this way, the stock effect is internalized by companiesand their production decision goes from equaling the mean product at marginal cost tothe marginal product at its marginal cost (IMg = CMg of effort). On the other hand, eachcompany will limit its number of nets to the quantity that maximizes its profits, therebyobtaining an EMEP (Graph A5). The efficiency of this equilibrium is reflected in the equilibriumstock XMEP , which is found to the right of XMSP .
Graph A5 shows that EMEP is lower than that used in EOA , despite both having the samerevenue and costs. Another difference is the maximum rent received by companies underprivate property. In open access, the rent disappears. In addition, the equilibrium stock isgreater, XMEP , than in open access.

39Fishing Rights: The Case of the Peruvian Anchoveta Fishery
BIBLIOGRAPHY
ARNASON, Ragnar2007 Loss of Economic Rents in the Global Fishery. Aquatic Living Resources.
Reykjavik: Department of Economics-University of Iceland.2005 «Property Rights in Fisheries: Iceland’s Experience with ITQs». In: Reviews in Fish Biology
and Fisheries, vol. 15, N° 3 pp. 243-264.2002 «A Review of International Experiences with ITQs». CEMARE Report, N° 58. Annex to
Future Options for UK Fish Quota Management.
BJORNDAL, Trond y Bezabih MINTEWAB2010 Resource Rents and Management Regimes: The Case of Western Channel
Sole Fishery. Portsmouth: Cemare / University of Portsmouth.
CAMPBELL, David and Jos HAYNES1990 Resource Rents in Fisheries. Australian Bureau of Agricultural and Resource Economics.
Canberra: Australian Government Publications Service.
CHARLES, Anthony2001 Sustainable Fisheries Systems. Oxford: Blackwell Science.
CLARK, W. G.1976 «The Lessons of the Peruvian Anchoveta Fishery». Report, Vol. XIX. Rome: California
Cooperative Oceanic Fisheries Investigations.
COGLAN, Louisa and Sean PASCOE1999 «Separating Resource Rents form Intra-marginal Rents in Fisheries». In: Agricultural and
Resource Economics Review, vol. 28, N° 2 pp. 219-228.
CSA, CENTRO PARA LA SOSTENIBILIDAD DEL AMBIENTE2012 La pesquería peruana de anchoveta: evaluación de los sistemas de gestión pesquera en el
marco de la certificación a cargo del Marine Steward Council. Lima: UPCH.
DE BRUYN, Sander; Marisa KORTELAND; Agnieszka MARKOWSKA; MarcDAVIDSON; Femke DE JONG; Mart BLES and Maartje SEVENSTER2010 Valuation and Weighting of Emissions and Environmental Impacts. Delft: Shadow Prices
Handbook.
DFID, DEPARTMENT FOR INTERNATIONAL DEVELOPMENT2 0 0 4 «Fiscal Reform in Fisheries. Resource Rent». DFID. Date retrieved 10/4/2013.
<http://www.odi.org.uk/sites/odi.org.uk/files/odi-assets/publications-opinion-files/3113.pdf>.

Apuntes 73, Second Semester 2013 / Galarza and Collado40
DÍAZ, Erich; Christian GARCÍA; Dante ESPINOZA; Renato GUEVARA-CARRASCO; Jorge CSIRKE;Miguel ÑIQUEN; Nathaly VARGAS and Juan ARGÜELLES2010 «Evaluación del stock norte-centro de la anchoveta peruana (Engraulis ringens Jenyns)
por un modelo estadístico estructurado por edades». In: Boletín Instituto del Mar del Perú,vol. XXV, N° 1-2, pp. 57-62.
FAO, FOOD AND AGRICULTURE ORGANIZATION OF THE UNITED NATIONS1999 «La ordenación pesquera». Technical Guidelines for Responsible Fisheries. Versión 4. Rome:
FAO.
FRÉON, Pierre; Marilú BOUCHON andy Carlota ESTRELLA2010 «Comparación de los impactos ambientales y aspectos socioeconómicos de las cadenas de
producción de anchoveta». In: Boletín Imarpe, vol. XXV, N° 1-2, pp. 63-72.
FRÉON, Pierre; Marilú BOUCHON; Christian MULLÓN; Christian GARCÍA and Miguel ÑIQUEN2008 «Interdecadal Variability of Anchoveta Abundance and Overcapacity of the Fishery in
Peru». In: Progress in Oceanography, N° 79, pp. 401-412.
GALARZA, Elsa2010 La economía de los recursos naturales. 2nd ed. Lima: CIUP-Biblioteca Universitaria.
GALARZA, Elsa y Héctor MALARÍN1994 «Lineamiento para el manejo eficiente de los recursos en el sector pesquero industrial
peruano». Working paper. Lima: CIUP.
GORDON, H. Scott1954 «The Economic Theory of Common Property Resource: The Fishery». In: Journal of Political
Economy, vol. 79, N° 2 pp. 124-142.
GRAFTON, R. Quentin1995 «Rent Capture in Right Based Fisheries». In: Journal of Environmental Economics
Management, vol. 28, N° 1 pp. 48-67.
HANNESON, Rognvaldur1993 Bioeconomic Analysis of Fisheries. New York: Haltsted Press.
HARDIN, Garret1968 «The Tragedy of the Commons». In: Science, N° 162 (3859), pp. 1243-1248.
41Fishing Rights: The Case of the Peruvian Anchoveta Fishery
HARTWICK, John y Nancy OLEWILER1998 The Economics of Natural Resources Use. 2nd ed. New York: Addison-Wesley Longman.
HATCHER, Aaronn.d. Renewable Resource Exploitation: Fishery Regulation. Introduction to Natural Resource
Economics. Portsmouth: University of Portsmouth.
ITHINDI, Andreas2003 Rent Capture in the Namibian Fisheries: The Case of Hake. Reykjavik: United Nations
University-Fisheries Training Programme.
NICHOLSON, Walter2007 Teoría microeconómica. Principios básicos y ampliaciones. 9th ed. Thomson Learning.
OWEN, Anthony1998 «Measurement and Collection of Economic Rent in a Managed Tuna Fishery». In: Le thon:
enjeux et stratégies pour l’océan Indien. Paris: Office de la Recherche Scientifique etTechnique Outre-Mer (Orstom), pp. 195-208.
PAREDES, Carlos2012 Eficiencia y equidad en la pesca peruana: la reforma y los derechos de pesca. Lima: Instituto
del Perú.2010 «Reformando el sector de la anchoveta peruana, progreso reciente y desafíos futuros».
Cuaderno de investigación N° 10. Lima: Instituto del Perú.
PAREDES, Carlos y María Elena GUTIÉRREZ2008 La industria anchovetera peruana: costos y beneficios. Un análisis de su evolución reciente
y de los retos para el futuro. Lima: Instituto del Perú.
PEÑA TORRES, Julio2008 El mar de oportunidades de las cuotas individuales de pesca. Santiago: Observatorio Econó-
mico-Universidad Alberto Hurtado.
RICARDO, David1973 [1816] Principios de economía política y tributación. México: Fondo de Cultura Económica.
RODGERS Trudi and Stewart WEBSTER2007 Resource Rent Mechanisms in Australian Primary Industries: Some Observations and Issues.
New Zealand: Australian and Resource Economics Society.
SNP Sociedad Nacional de Pesquería2008 Libro de oro de la pesquería peruana. Lima: SNP Sociedad Nacional de Pesquería
Apuntes 73, Second Semester 2013 / Galarza and Collado42
WORLD BANK2009 Los miles de millones hundidos: una justificación económica de la renta pesquera. Washing-
ton. World Bank.
YANG, Ziajiang y Xiaojie NIE2008 FAO/World Bank Rent Drain Study: China Case. Fisheries in the Bohai Sea & Yellow Sea.
Beijing: FAO.