Embed Size (px)
Citation preview

p
Fiscal Year Ended June 30, 2011


Valley Metro Regional Public Transportation Authority Phoenix, Arizona
Board of Directors Chair, Councilmember Shana Ellis, Tempe Vice Chair, Councilmember Ron Aames, Peoria Treasurer, Councilmember Michael Johnson, Phoenix Vice Mayor Jim McDonald, Avondale Councilmember Eric Orsborn, Buckeye Vice Mayor Trinity Donovan, Chandler Mayor Lana Mook, El Mirage Vice Mayor Jenn Daniels, Gilbert Mayor Elaine Scruggs, Glendale Councilmember Joe Pizzillo, Goodyear Supervisor Max Wilson, Maricopa County Vice Mayor Scott Somers, Mesa Vice Mayor Robert Littlefield, Scottsdale Mayor Lyn Truitt, Surprise Vice Mayor Kathie Farr, Tolleson Councilman Rui Pereira, Wickenburg Executive Director’s Office David A. Boggs, Executive Director Bryan Jungwirth, Chief of Staff Michael Taylor, Acting Finance Director Carol Ketcherside, Planning Director Jim Wright, Operations Director Prepared By Finance Department


Valley Metro Regional Public Transportation Authority
Organization Chart
Citizens of Maricopa County
Board of Directors
Finance Operations Planning Management Services
Marketing & Strategic Services
Executive Director’s Office
Valley Metro Rail, Inc. Staff (Reports to VMR, Inc. Board of Directors)


Valley Metro Regional Public Transportation Authority Table of Contents Comprehensive Annual Financial Report and Single Audit Reports Fiscal Year Ended June 30, 2011
Page
i
Introductory Section
Letter of Transmittal iii GFOA Certificate of Achievement x
Financial Section
Independent Auditors’ Report 1 . Management’s Discussion and Analysis (required supplementary information) 3 . Basic Financial Statements: .
Government-wide Financial Statements: Statement of Net Assets 14 Statement of Activities 15
. Fund Financial Statements:
Balance Sheet – Governmental Funds 17 Statement of Revenues, Expenditures and Changes in Fund Balances –
Governmental Funds 18 Reconciliation of the Statement of Revenues, Expenditures and Changes in
Fund Balances of Governmental Funds to the Statement of Activities 19 Statement of Revenues, Expenditures and Changes in Fund Balance –
Budget to Actual – General Fund 20 Statement of Revenues, Expenditures and Changes in Fund Balance –
Budget to Actual – Transit Planning Fund 21 Statement of Revenues, Expenditures and Changes in Fund Balance –
Budget to Actual – Transportation Demand Management Fund 22 Statement of Net Assets – Proprietary Funds 23 Statement of Revenues, Expenses and Changes in Fund Net Assets –
Proprietary Funds 24 Statement of Cash Flows – Proprietary Funds 25 Statement of Changes in Fiduciary Net Assets – Fiduciary Fund 26
. Index to the Notes to the Financial Statements 27 Notes to the Financial Statements 28
. Other Supplementary Information – Individual Fund Financial Statements and
Schedules: .
Schedule of Revenues, Expenses and Changes in Net Assets – Budget to Actual – Proprietary Funds:
Enterprise Funds: Transit Service Operations Fund 51 Valley Metro Rail Fund 52
Statistical Section
Statistical Section Contents 53 Financial Trends

Valley Metro Regional Public Transportation Authority Table of Contents (Concluded) Comprehensive Annual Financial Report and Single Audit Reports Fiscal Year Ended June 30, 2011
Page
ii
Net Assets by Component 54 Changes in Net Assets 56 Fund Balances of Governmental Funds 60 Changes in Fund Balances of Governmental Funds 62
Revenue Capacity Sales Tax Revenues by Component 64 Maricopa County Transportation Excise Tax Revenue Distributions 66 Maricopa County Transportation Excise Tax Revenue Collections by Category 68 Arizona Transaction Privilege Tax Excise Tax Rates by Category 69
Debt Capacity Transportation Excise Tax Revenue Bonds – Bond Coverage 71 Outstanding Debt by Type 72 Debt Service Revenue and Cost per Capita 73
Demographic and Economic Information Regional Population Statistics 74 Top Ten Employers for Maricopa County 76 Local Transportation Assistance Funds 77 Demographic and Economic Statistics 79
Operating Information Full-time Equivalent Employees by Function/Program 80 Operating Indicators by Program:
Fixed Route System 81 Dial-a-Ride System 83 Shuttle / Circulator System 87
Capital Asset Statistics by Function/Program Revenue Vehicles for Transit Service Operations 89
Single Audit Section
Supplementary Schedule of Expenditures of Federal Awards 90 Notes to the Supplementary Schedule of Expenditures of Federal Awards 91 Report on Internal Control Over Financial Reporting and on Compliance and
Other Matters Based on an Audit of Financial Statements Performed in Accordance With Government Auditing Standards 92
Report on Compliance With Requirements That Could Have a Direct and Material Effect on Each Major Program and on Internal Control Over Compliance in Accordance With OMB Circular A-133 94
Schedule of Findings and Questioned Costs 97

Introductory Section The Introductory Section includes the Authority’s transmittal letter and the Certificate of Achievement for Excellence in Financial Reporting.


(This page intentionally left blank)

x

(This page intentionally left blank)

Financial Section The Financial Section includes the independent auditors’ report, Management’s Discussion and Analysis (MD&A), the basic financial statements (government-wide statements and fund statements), notes to the financial statements, other Required Supplementary Information (RSI) and other financial schedules.

INDEPENDENT AUDITORS’ REPORT Chair and Members of the Board of Directors Valley Metro Regional Public Transportation Authority We have audited the accompanying financial statements of the governmental activities, the business-type activities, and each major fund of Valley Metro Regional Public Transportation Authority (the Authority), as of and for the year ended June 30, 2011, which collectively comprise the Authority’s basic financial statements as listed in the table of contents. These financial statements are the responsibility of the Authority’s management. Our responsibility is to express opinions on these financial statements based on our audit. We conducted our audit in accordance with auditing standards generally accepted in the United States of America and the standards applicable to financial audits contained in Government Auditing Standards, issued by the Comptroller General of the United States. Those standards require that we plan and perform the audit to obtain reasonable assurance about whether the financial statements are free of material misstatement. An audit includes examining, on a test basis, evidence supporting the amounts and disclosures in the financial statements. An audit also includes assessing the accounting principles used and the significant estimates made by management, as well as evaluating the overall financial statement presentation. We believe that our audit provides a reasonable basis for our opinions. In our opinion, the financial statements referred to above present fairly, in all material respects, the respective financial position of the governmental activities, the business-type activities, and each major fund of the Valley Metro Regional Public Transportation Authority, as of June 30, 2011, and the respective changes in financial position and cash flows, where applicable, thereof and the respective budgetary comparisons for the General Fund and major special revenue funds for the year then ended in conformity with accounting principles generally accepted in the United States of America. As described in Note 1, the Authority implemented the provisions of the Governmental Accounting Standards Board (GASB) Statement No. 54, Fund Balance Reporting and Governmental Fund Type Definitions, for the year ended June 30, 2011, which represents a change in accounting principle. In accordance with Government Auditing Standards, we have also issued our report dated February 27, 2012, on our consideration of Valley Metro Regional Public Transportation Authority’s internal control over financial reporting and on our tests of its compliance with certain provisions of laws, regulations, contracts, and grant agreements and other matters. The purpose of that report is to describe the scope of our testing of internal control over financial reporting and compliance and the results of that testing, and not to provide an opinion on the internal control over financial reporting or on compliance. That report is an integral part of an audit performed in accordance with Government Auditing Standards and should be considered in assessing the results of our audit.
10120 N. Oracle Road, Tucson, Arizona 85704Tel: (520) 742-2611 Fax: (520) 742-2718
HEINFELD, MEECH & CO., P.C.CERTIFIED PUBLIC ACCOUNTANTS
Hein
feld, Meech & Co.th
1986-2011
25Anniversary

Page 2
Accounting principles generally accepted in the United States of America require that the management’s discussion and analysis on pages 3 through 13 be presented to supplement the basic financial statements. Such information, although not a part of the basic financial statements, is required by Governmental Accounting Standards Board, who considers it to be an essential part of financial reporting for placing the basic financial statements in an appropriate operational, economic, or historical context. We have applied certain limited procedures to the required supplementary information in accordance with auditing standards generally accepted in the United States of America, which consisted of inquiries of management about the methods of preparing the information and comparing the information for consistency with management’s responses to our inquiries, the basic financial statements, and other knowledge we obtained during our audit of the basic financial statements. We do not express an opinion or provide any assurance on the information because the limited procedures do not provide us with sufficient evidence to express an opinion or provide any assurance. Our audit was conducted for the purpose of forming opinions on the financial statements that collectively comprise the Authority’s financial statements as a whole. The accompanying supplementary information such as the introductory section, individual fund financial schedules, and statistical section are presented for purposes of additional analysis and are not a required part of the financial statements. The individual fund financial schedules are the responsibility of management and were derived from and relate directly to the underlying accounting and other records used to prepare the financial statements. The information has been subjected to the auditing procedures applied in the audit of the financial statements and certain additional procedures, including comparing and reconciling such information directly to the underlying accounting and other records used to prepare the financial statements or to the financial statements themselves, and other additional procedures in accordance with auditing standards generally accepted in the United States of America. In our opinion, the information is fairly stated in all material respects in relation to the financial statements as a whole. The introductory and statistical sections have not been subjected to the auditing procedures applied in the audit of the basic financial statements and, accordingly, we do not express an opinion or provide any assurance on them. HEINFELD, MEECH & CO., P.C. Certified Public Accountants February 27, 2012

Valley Metro Regional Public Transportation Authority Management’s Discussion and Analysis
3
As management of Valley Metro Regional Public Transportation Authority (the Authority), we offer this narrative overview and analysis of the financial activities of the Authority for the fiscal year ended June 30, 2011. This discussion and analysis is designed to (1) assist the reader in focusing on significant financial issues, (2) provide an overview of the Authority’s financial activity, (3) identify changes in the Authority’s financial position, (4) identify any material deviations from the financial plan (adopted annual budget) and (5) identify individual fund issues or concerns. Financial Highlights • The Authority’s total net assets decreased $25.8 million in FY 2011, an increase of $6.9
million in governmental activities and a decrease $32.6 million in business-type activities. Total net assets of the Authority are $90.6 million, of which $67.7 million is unrestricted.
• The governmental activities revenues increased by approximately $3.7 million (3.5%) over
the previous year. • The business-type activities revenues decreased by approximately $11.5 million (25%)
from the previous year. • At June 30, 2011, the Authority’s governmental fund balance sheet reported a combined
ending fund balance of $52.4 million, an increase of $6.2 million (13.5%) compared to the previous fiscal year.
OVERVIEW OF THE FINANCIAL STATEMENTS The financial statements are presented as follows: • Government-wide reporting – presents financial statements on a government-wide basis. • Fund financial statements – presents governmental, proprietary and fiduciary fund financial
statements, with the focus on major funds within each fund type. • Measurement focus for governmental activities – in the government-wide financial
statements all activities, including the governmental activities, are reported using the economic resources measurement focus and accrual basis of accounting. The current financial resources focus and modified accrual basis of accounting are followed for the governmental fund financial statements.
• Budgetary reporting – the display of both the original adopted budget and the revised
budget in the budgetary comparison schedules is required by GAAP. These schedules are only required for the general fund and major special revenue funds; these statements are presented as part of the basic financial statements, and the Authority has presented this information for the proprietary funds in the other supplementary information section as additional information.
• Required narrative analysis – the financial statements are required to be accompanied by
narrative introduction and analytical overview of the government’s financial activities in the form of “Management’s Discussion and Analysis” (MD&A).

Valley Metro Regional Public Transportation Authority Management’s Discussion and Analysis (Continued)
4
As presented below, the financial section of the Comprehensive Annual Financial Report (CAFR) for the Authority consists of this discussion and analysis, the basic financial statements and required supplementary information (other than MD&A). There are also additional non-required supplementary schedules presented after the basic financial statements. The basic financial statements include the government-wide financial statements, fund financial statements, including the budgetary statements for the general fund and major special revenue funds, and notes to the financial statements.
Government-wide Financial Statements The government-wide financial statements (see pages 14 – 16) are designed to provide a broad overview of the Authority’s finances in a manner similar to those used by private businesses. All of the activities of the Authority, except those of a fiduciary nature, are included in these statements. The activities of the Authority are broken down into two columns on these statements – governmental activities and business-type activities. A total column for the Authority is also provided. • The governmental activities include the basic services of the Authority including general
government (administration), regional planning, transportation demand management and regional customer services. Grants and general revenues generally support these activities.
• The business-type activities include the private sector type activities which are transit
service operations and light rail transit. These activities are partially supported by user charges and provide substantial benefits, both direct and indirect, to the public at large.
The statement of net assets presents information on all of the Authority’s assets and liabilities, both current and noncurrent, with the difference between the two reported as net assets. The focus on net assets is designed to be similar to the emphasis for businesses. Over time, increases or decreases in net assets may serve as a useful indicator of whether the financial position of the Authority is improving or deteriorating. To assess the overall health of the

Valley Metro Regional Public Transportation Authority Management’s Discussion and Analysis (Continued)
5
Authority, other indicators, including non-financial indicators like the Authority’s tax base and the condition of its capital assets, should also be considered. The statement of activities presents information showing how the Authority’s net assets changed over the most recent fiscal year. Since full accrual accounting is used for the government-wide financial statements, all changes to net assets are reported at the time that the underlying event giving rise to the change occurs, regardless of the timing of the related cash flows. This statement also focuses on both the gross and net costs of the various functions of the Authority, based only on direct functional revenues and expenses. This is designed to show the extent to which the various functions depend on general taxes and revenues for support. Fund Financial Statements Also presented are more traditional fund financial statements for governmental funds, proprietary funds and fiduciary funds. A fund is a grouping of related accounts that is used to maintain control over resources that have been segregated for specific activities or conditions. Funds are used to ensure and demonstrate compliance with finance-related legal requirements as well as for managerial control to demonstrate fiduciary responsibility over the assets of the Authority. Governmental funds – Governmental funds are used to account for most of the Authority’s basic services. Unlike the governmental activities column on the government-wide financial statement, these fund financial statements (pages 17 - 18) focus on near-term inflows and outflows of spendable resources as well as on balances of spendable resources available at the end of the fiscal year. Such information is useful in looking at the Authority’s near-term financial requirements. Since the governmental activities on the statements focus on near-term spendable resources, while the governmental activities on the government-wide financial statements have a longer term focus, a reconciliation of the differences between the two statements is provided following the fund financial statements and is also provided in Note 2 (pages 38 - 39). Proprietary funds – Proprietary funds are used to account for business-type activities of the Authority. Enterprise funds are used for activities that primarily serve customers outside the governmental unit. The proprietary fund financial statements (pages 23 - 25) are prepared using the same long-term focus as the government-wide financial statements. The enterprise funds generally provide information similar to the business-type activities column of the government-wide financial statements, but provide more detail and additional information (i.e., cash flows). Fiduciary funds – Fiduciary funds are used to account for resources held for the benefit of others. Fiduciary funds are not included in the government-wide financial statements because the resources of those funds are not available to support programs of the Authority. The fiduciary fund statement (page 26) is prepared on the same basis as the government-wide and proprietary fund statements. Notes to the Financial Statements – The notes to the financial statements (pages 28 – 50) provide additional information that is essential to a full understanding of the data provided in the government-wide and fund financial statements and should be read with the financial statements.

Valley Metro Regional Public Transportation Authority Management’s Discussion and Analysis (Continued)
6
Required supplementary information other than MD&A – Governments have an option of including the budgetary comparison statements of the general fund and major special revenue funds as either part of the fund financial statements within the basic financial statements, or as required supplementary information after the footnotes. The Authority has chosen to present these budgetary statements as part of the basic financial statements. GOVERNMENT-WIDE FINANCIAL ANALYSIS The following tables and analysis discuss the financial position and changes to the financial position for the Authority as a whole as of and for the year ended June 30, 2011, with comparative information for the previous year. Net Assets Net assets may serve over time as a useful indicator of a government’s financial position. The following table reflects the condensed Statement of Net Assets as of June 30, 2011 compared to the prior year:
Percent2011 2010 2011 2010 2011 2010 Change
Current and other assets 53,235.3$ 46,808.8$ 43,424.5$ 37,341.4$ 96,659.8$ 84,150.2$ 14.9%Noncurrent assets
Cash and cash equivalents - - 33,376.2 68,556.2 33,376.2 68,556.2 -51.3%Deferred charges - - 756.5 816.9 756.5 816.9 -7.4%Capital assets 1,346.6 689.8 93,285.7 108,271.0 94,632.3 108,960.8 -13.2%
Total assets 54,581.9$ 47,498.6$ 170,842.9$ 214,985.5$ 225,424.8$ 262,484.1$ -14.1%
Other liabilities 1,486.5$ 683.8$ 29,948.1$ 38,262.1$ 31,434.6$ 38,945.9$ -19.3%Long-term liabilities 247.2 837.9 103,161.7 106,348.4 103,409.0 107,186.3 -3.5%
Total liabilities 1,733.7$ 1,521.7$ 133,109.8$ 144,610.5$ 134,843.6$ 146,132.2$ -7.7%
Net assets:Invested in capital assets,net of related debt 1,346.6$ 689.8$ 21,322.7$ 106,601.8$ 22,669.3$ 107,291.6$ -78.9%Restricted 178.4 - - - 178.4 - 100.0%Unrestricted 51,323.2 45,287.1 16,410.2 (36,226.8) 67,733.4 9,060.3 647.6%
Total net assets 52,848.2$ 45,976.9$ 37,732.9$ 70,375.0$ 90,581.1$ 116,351.9$ -22.1%
Primary GovernmentTotal
(in thousands of dollars)
As of June 30
Condensed Statement of Net Assets
ActivitiesGovernmental Business-type
Activities
The Authority’s total net assets decreased $25.8 million in FY 2011, an increase of $6.9 million in governmental activities and a decrease of $32.6 million in business-type activities. Total net assets of the Authority are $90.6 million, of which $67.7 million is unrestricted.

Valley Metro Regional Public Transportation Authority Management’s Discussion and Analysis (Continued)
7
A portion of net assets (25.0%) represents the Authority’s investment in capital assets net of accumulated depreciation and related outstanding debt used to acquire those assets. The Authority uses these capital assets to provide services to the region’s citizens; consequently, it is not the Authority’s intention to sell these assets, and they are therefore not available for future spending. The capital assets are reported net of related debt; as discussed in the Capital Assets and Debt Administration section (pages 11 - 12), the Authority pledged future transportation excise tax revenues to repay the outstanding debt obligations. The capital assets themselves are not intended to be used to liquidate these liabilities. An additional 0.2% ($0.2 million) of the Authority’s net assets reflects resources that are subject to external restrictions, of which the majority is restricted for compensated absences. The remaining 74.8% ($67.7 million) represents unrestricted resources that may be used to meet the Authority’s ongoing obligations to citizens, member agencies, contractors and creditors within the respective governmental and business-type activities. The governmental activities reported an increase of $6.0 million (13.3%) of unrestricted net assets over the prior year largely attributed to an increase in the interfund balance relating to short-term loans to cover temporary cash deficits in the Transit Service Operations Fund. The significant increase of $47.0 million (129.9%) of unrestricted net assets over the prior year in business-type activities is significantly due to the change in classification of the invested in capital assets net of related debt to accurately report net assets from capital purchases net of the 2009 bond issuance. Changes in Net Assets The following table compares the revenues and expenses of the Authority for the current and previous fiscal year. The increase (decrease) in net assets for each year represents the extent to which revenues were over (under) expenses during the year.
(Remainder of this page intentionally left blank)

Valley Metro Regional Public Transportation Authority Management’s Discussion and Analysis (Continued)
8
Percent2011 2010 2011 2010 2011 2010 Change
REVENUESProgram revenues:
Charges for services 189.0$ 150.4$ 23,374.8$ 27,253.1$ 23,563.8$ 27,403.5$ -14.0%Operating grants and contributions 2,286.9 2,055.9 2,144.5 2,607.8 4,431.4 4,663.7 -5.0%Capital grants and contributions - - 8,289.3 14,996.6 8,289.3 14,996.6 -44.7%
General revenues:Sales taxes 107,111.1 103,722.5 - - 107,111.1 103,722.5 3.3%Interest earnings 79.9 231.4 215.8 587.5 295.7 818.9 -63.9%Other 233.4 73.5 560.6 650.6 794.0 724.1 9.7%
Total revenues 109,900.3 106,233.7 34,585.0 46,095.6 144,485.3 152,329.3 -5.1%
EXPENSESGovernmental activities:
Regional planning 2,274.7 1,822.0 - - 2,274.7 1,822.0 24.8%Transportation demand management 1,542.4 1,808.2 - - 1,542.4 1,808.2 -14.7%Regional customer services 7,995.4 8,497.2 - - 7,995.4 8,497.2 -5.9%Administration 1,966.3 1,879.1 - - 1,966.3 1,879.1 4.6%
Business-type activities:Transit service operations - - 90,336.8 93,074.5 90,337 93,074.5 -2.9%Light rail transit - - 66,140.2 60,704.3 66,140 60,704.3 9.0%
Total expenses 13,778.8 14,006.5 156,477.0 153,778.8 170,255.8 167,785.3 1.5%
Excess (deficit) before transfers 96,121.5 92,227.2 (121,892.0) (107,683.2) (25,770.5) (15,456.0) 66.7%Transfers in (out) (89,250.2) (84,745.3) 89,250.2 84,745.3 - - N/A
Increase (decrease) in net assets 6,871.3$ 7,481.9$ (32,641.8)$ (22,937.9)$ (25,770.5)$ (15,456.0)$ 66.7%
Pimary GovernmentTotal
(in thousands of dollars)
Fiscal year ended June 30
Changes in Net Assets
ActivitiesGovernmental
ActivitiesBusiness-type
The largest financing source for the Authority as a whole is sales taxes (74.1%). The major funding sources of governmental activities are sales taxes (97.5%) and federal and state grants (2.1%). The major funding source for business-type activities are charges for services (67.6%) and transfers from the government activities (72.1%). Business-type activities also received substantial federal grants and contribution revenue (8.4%). The Authority’s overall revenues decreased by $7.8 million, or 5.1%, compared to last fiscal year. Total revenues of governmental activities increased by $3.7 million, or 3.5% over the previous year mainly due to the sales tax revenues in the Public Transportation Fund. Program revenues of business-type activities decreased by $11.5 million, or 25%, compared to last fiscal year, which is largely attributable to decreases in Federal Transit Administration (FTA) capital grants. The Authority’s sales tax revenue over the prior year is limited to incorporating those elements necessary for implementing the sixth year of the Proposition 400 Transit Life Cycle Program (TLCP). The Public Transportation Fund (PTF) revenues are restricted to the implementation of the transit element of the Regional Transportation Plan (RTP). The laws pertaining to Regional Area Road Fund (RARF) revenues have changed beginning with FY 2006. Most notably, as a result of changes in the distribution of funds made by House Bill 2292, the amount of money that the Authority received previously has been divided in two, with one half going to the Maricopa Association of Governments (MAG). Additionally, the allowable use of these funds has changed as well. Previously, RARF was unrestricted as to use. However, RARF revenue is now limited to fund administration in the General Fund and planning and is no longer available to fund transit services.
Valley Metro Regional Public Transportation Authority Management’s Discussion and Analysis (Continued)
9
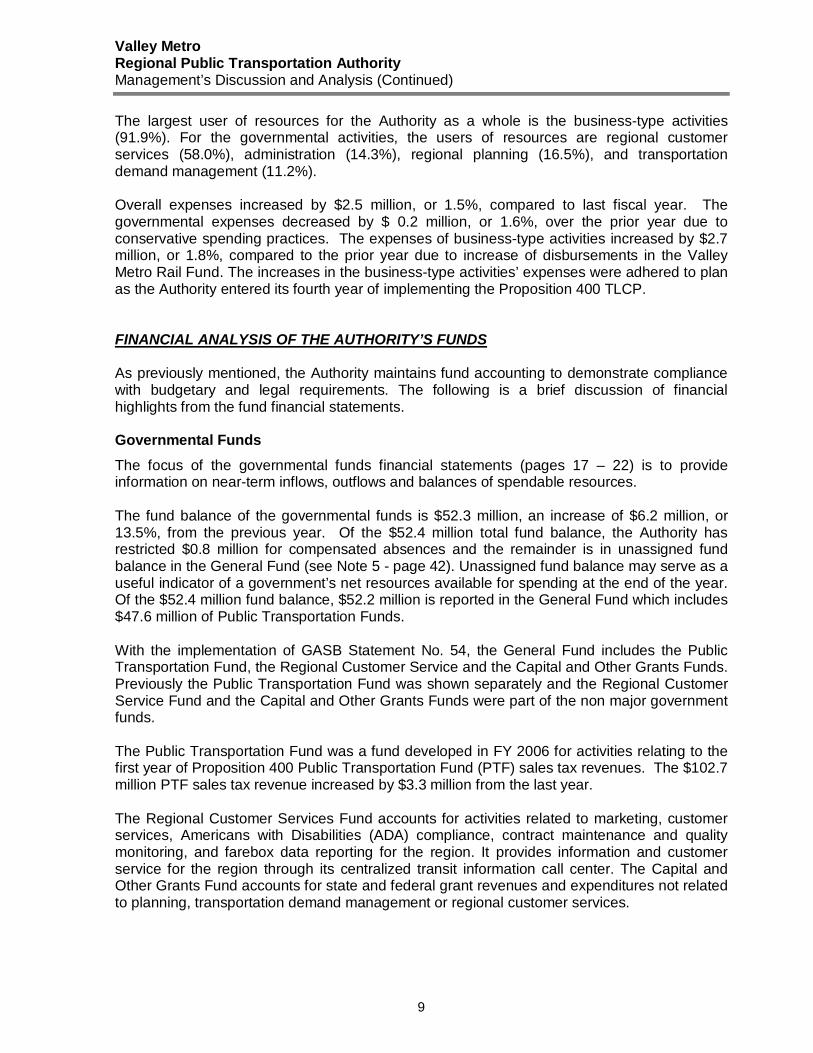
The largest user of resources for the Authority as a whole is the business-type activities (91.9%). For the governmental activities, the users of resources are regional customer services (58.0%), administration (14.3%), regional planning (16.5%), and transportation demand management (11.2%). Overall expenses increased by $2.5 million, or 1.5%, compared to last fiscal year. The governmental expenses decreased by $ 0.2 million, or 1.6%, over the prior year due to conservative spending practices. The expenses of business-type activities increased by $2.7 million, or 1.8%, compared to the prior year due to increase of disbursements in the Valley Metro Rail Fund. The increases in the business-type activities’ expenses were adhered to plan as the Authority entered its fourth year of implementing the Proposition 400 TLCP. FINANCIAL ANALYSIS OF THE AUTHORITY’S FUNDS As previously mentioned, the Authority maintains fund accounting to demonstrate compliance with budgetary and legal requirements. The following is a brief discussion of financial highlights from the fund financial statements. Governmental Funds The focus of the governmental funds financial statements (pages 17 – 22) is to provide information on near-term inflows, outflows and balances of spendable resources. The fund balance of the governmental funds is $52.3 million, an increase of $6.2 million, or 13.5%, from the previous year. Of the $52.4 million total fund balance, the Authority has restricted $0.8 million for compensated absences and the remainder is in unassigned fund balance in the General Fund (see Note 5 - page 42). Unassigned fund balance may serve as a useful indicator of a government’s net resources available for spending at the end of the year. Of the $52.4 million fund balance, $52.2 million is reported in the General Fund which includes $47.6 million of Public Transportation Funds. With the implementation of GASB Statement No. 54, the General Fund includes the Public Transportation Fund, the Regional Customer Service and the Capital and Other Grants Funds. Previously the Public Transportation Fund was shown separately and the Regional Customer Service Fund and the Capital and Other Grants Funds were part of the non major government funds. The Public Transportation Fund was a fund developed in FY 2006 for activities relating to the first year of Proposition 400 Public Transportation Fund (PTF) sales tax revenues. The $102.7 million PTF sales tax revenue increased by $3.3 million from the last year. The Regional Customer Services Fund accounts for activities related to marketing, customer services, Americans with Disabilities (ADA) compliance, contract maintenance and quality monitoring, and farebox data reporting for the region. It provides information and customer service for the region through its centralized transit information call center. The Capital and Other Grants Fund accounts for state and federal grant revenues and expenditures not related to planning, transportation demand management or regional customer services.

Valley Metro Regional Public Transportation Authority Management’s Discussion and Analysis (Continued)
10
The Transit Planning Fund accounts for activities related to the development of strategies to promote social and economic well-being of the community through the provision of an efficient and effective regional transit system. Revenues increased $0.6 million (254.1%) due to the increase of $.4 million in Federal grants and $.2 million in charges for services to Valley Metro Rail to complete an Origins & Destinations study. The expenditures increased 24.8% from the prior year due to an increase in short range planning and to complete an Origins and Destinations study. Prior to 2006, sales taxes allocated to the Transit Planning Fund were shown as revenues. These monies are now shown as transfers in. Total transfers in decreased 9.5% over the prior year. The Transportation Demand Management Fund accounts for activities related to the countywide ridesharing program, trip reduction program and clean air campaign. Revenues decreased 16.0% and expenditures decreased 14.7% from the prior year due to decreases in grant funds available for regional rideshare, telework and bike education programs. Proprietary Funds The proprietary fund financial statements (pages 23 – 25) are prepared on the same accounting basis and measurement focus as the government-wide financial statements, but provide additional detail since each enterprise fund is a major fund and is shown discretely on the fund statements. The Transit Service Operations Fund accounts for the activities related to the operations of local and express bus, paratransit and vanpool services for the region. Net assets decreased $35.6 million (58%) over the prior year due mainly to increases in transfers out to Valley Metro Rail for bond proceeds, decreases in Federal grants, and reduction in bus service. The Valley Metro Rail Fund accounts for staffing and administrative services that are contractually provided by the Authority to Valley Metro Rail, Inc. (VMR) and the PTF sales tax revenues and expenses of such funds related to the Regional Transportation Plan approved light rail projects. Valley Metro Rail, Inc. is a nonprofit corporation organized for the purpose of planning, designing, constructing and operating the light rail transit project in metropolitan Phoenix (see Note 1(a) on page 28). The Valley Metro Rail Fund has net assets of $12.0 million as of June 30, 2011 as compared to net assets of $9.0 million at the end of the previous year. In fiscal year 2011, the Valley Metro Rail Fund received 42.4% of the total PTF sales tax revenues distributed to the Authority from the Arizona Department of Revenue, totaling $40.8 million and received 11.3% of the $4.4 million RARF sales tax revenue received by the Authority, totaling $0.5 million. Additionally, the Valley Metro Rail Fund received $19.5 million of transfers in of 2009 Bond proceeds from the Transit Service Operations Fund for VMR capital expenditure reimbursements. GENERAL FUND BUDGETARY HIGHLIGHTS During the year there was a decrease $0.2 million in appropriations between the original and final amended expenditure budget. For the year ended June 30, 2011, actual expenditures were under the adopted budget amounts by $0.5 million. The positive variance was attributable to the Marketing and Finance & Management Services activities of the General Fund being under budget because of conservative spending practices.
Valley Metro Regional Public Transportation Authority Management’s Discussion and Analysis (Continued)
11
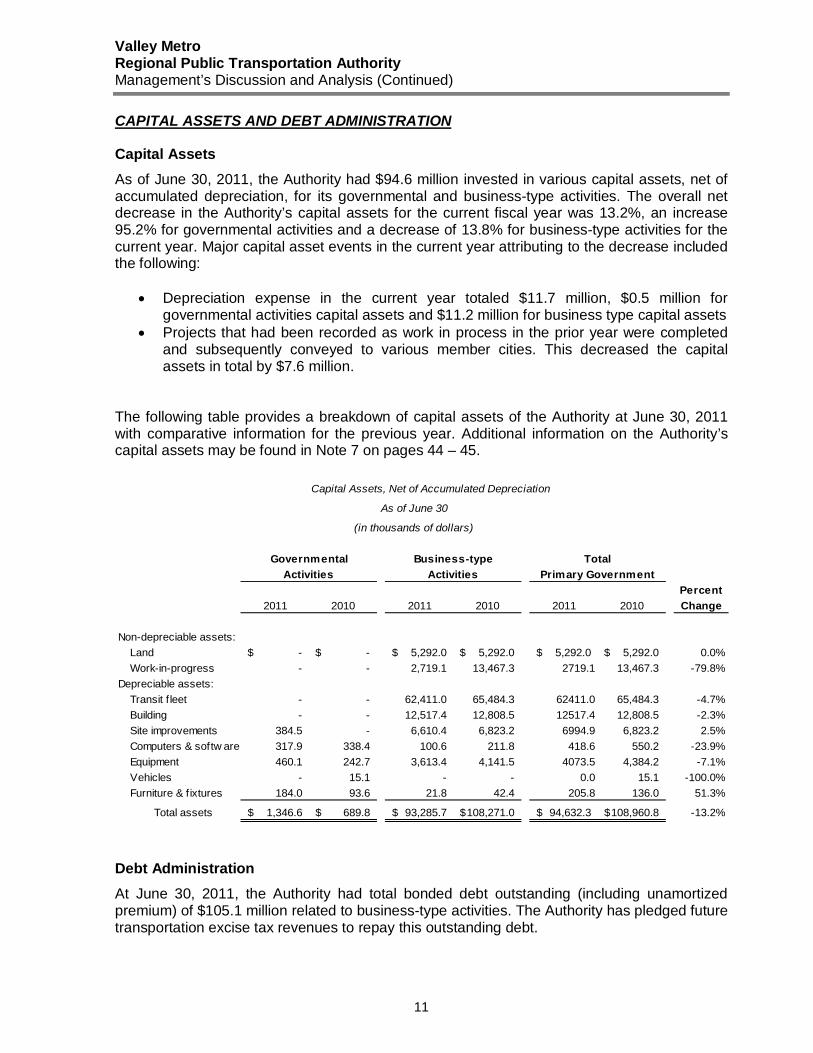
CAPITAL ASSETS AND DEBT ADMINISTRATION Capital Assets As of June 30, 2011, the Authority had $94.6 million invested in various capital assets, net of accumulated depreciation, for its governmental and business-type activities. The overall net decrease in the Authority’s capital assets for the current fiscal year was 13.2%, an increase 95.2% for governmental activities and a decrease of 13.8% for business-type activities for the current year. Major capital asset events in the current year attributing to the decrease included the following:
• Depreciation expense in the current year totaled $11.7 million, $0.5 million for governmental activities capital assets and $11.2 million for business type capital assets
• Projects that had been recorded as work in process in the prior year were completed and subsequently conveyed to various member cities. This decreased the capital assets in total by $7.6 million.
The following table provides a breakdown of capital assets of the Authority at June 30, 2011 with comparative information for the previous year. Additional information on the Authority’s capital assets may be found in Note 7 on pages 44 – 45.
Capital Assets, Net of Accumulated Depreciation
Percent2011 2010 2011 2010 2011 2010 Change
Non-depreciable assets:Land -$ -$ 5,292.0$ 5,292.0$ 5,292.0$ 5,292.0$ 0.0%Work-in-progress - - 2,719.1 13,467.3 2719.1 13,467.3 -79.8%
Depreciable assets:Transit f leet - - 62,411.0 65,484.3 62411.0 65,484.3 -4.7%Building - - 12,517.4 12,808.5 12517.4 12,808.5 -2.3%Site improvements 384.5 - 6,610.4 6,823.2 6994.9 6,823.2 2.5%Computers & softw are 317.9 338.4 100.6 211.8 418.6 550.2 -23.9%Equipment 460.1 242.7 3,613.4 4,141.5 4073.5 4,384.2 -7.1%Vehicles - 15.1 - - 0.0 15.1 -100.0%Furniture & f ixtures 184.0 93.6 21.8 42.4 205.8 136.0 51.3%
Total assets 1,346.6$ 689.8$ 93,285.7$ 108,271.0$ 94,632.3$ 108,960.8$ -13.2%
Primary GovernmentTotal
(in thousands of dollars)
As of June 30
ActivitiesGovernmental
ActivitiesBusiness-type
Debt Administration At June 30, 2011, the Authority had total bonded debt outstanding (including unamortized premium) of $105.1 million related to business-type activities. The Authority has pledged future transportation excise tax revenues to repay this outstanding debt.

Valley Metro Regional Public Transportation Authority Management’s Discussion and Analysis (Continued)
12
2011 2010
Revenue bonds payable 100.1$ 100.1$ Plus unamortized premium:
Bond premium payable 5.0 5.4
Total 105.1$ 105.5$
ActivitiesBusiness-type
The Authority’s current bond ratings on transportation excise revenue tax bonds are AA+ from Standard & Poor’s and AA+ from Fitch. Additional information on the Authority’s bonded debt and other long-term liabilities can be found in Note 9 on pages 46 - 47. ECONOMIC FACTORS RPTA undertook a number of key projects during FY 2011, as the agency continues the implementation of the TLCP operating and capital projects. Funding for these projects and studies comes from a combination of sales tax revenues (Public Transportation Funds [PTF] and Regional Area Road Funds [RARF]) and federal grants. The key initiatives for fiscal year 2011 included:
• Opening of the Valley Metro Mobility Center with a “transit walk” offering in-person Americans with Disabilities Act (ADA) assessments for the first time in the Valley.
• Start-up of Route 184, offering bus service to Phoenix-Mesa Gateway Airport, as well as public transportation for the first time south of Superstition Springs Mall on Power Road.
• New LINK bus route began on Arizona Avenue and Country Club Drive allowing a direct public transit link to METRO light rail from Chandler and Gilbert.
• Developed a new model for providing ADA Dial-a-Ride service in the West Valley utilizing a partnership with Discount Cab.
• For the first time ever, provided bus service to the Gila River Indian Community. • Enhanced the mobile website and began using bar codes for enhanced communication
to passengers. • Kicked off the NextRide program to assist passengers with getting automated next bus
and train information using a cell phone or the internet. • Implemented the Interactive Voice Response system for East Valley Dial-a-Ride
service making it easier for passengers to check on the status of upcoming trips or cancel trips.
• A real time bus tracker was initiated for the LINK bus routes, which is available at the station or by using the internet or a cell phone to see the exact location of a bus in real time.

Valley Metro Regional Public Transportation Authority Management’s Discussion and Analysis (Concluded)
13
The adopted FY 2012 combined operating and capital budget is $233.1 million (up approximately 4% from fiscal year 2011). The FY 2012 budget includes the sixth full year of projects funded with Proposition 400 PTF sales tax revenues ($103.4 million). Of the $103.4 million PTF revenue budgeted, $58.7 million is for bus operating and bus capital and $44.7 million is for light rail/high capacity capital. The total operating budget of $84.7 million represents a $563,000 (1%) decrease under the fiscal year 2011 operating budget of $85.3 million. The total capital budget of $148.4 million represents an $8.7 million (6%) increase over the fiscal year 2011 capital budget of $139.7 million. The major reason for the decrease in the operating budget is directly related to the projects programmed in the Transit Life Cycle Program (TLCP) for fiscal year 2012. The budget is balanced; decreases in net assets other than capital assets are not anticipated for fiscal year 2012. FINANCIAL CONTACT The financial report is designed to provide a general overview of the Authority’s finances and to demonstrate accountability for the use of public funds. Questions about any of the information provided in this report, or requests for additional financial information should be addressed to the Authority’s Acting Finance Director, Valley Metro RPTA, 101 N. 1st Avenue, Suite 1100, Phoenix, AZ 85003.

(This page intentionally left blank)

Basic Financial Statements
• Government-wide Financial Statements
• Fund Financial Statements
• Notes to the Financial Statements


Valley Metro Regional Public Transportation Authority Statement of Net Assets June 30, 2011
14
Governmental Business-type
Activities Activities Total
Assets
Current Assets:Cash and cash equivalents 34,574,298$ 10,989,469$ 45,563,767$ Due from other governments 10,006,801 41,076,533 51,083,334 Interfund balances 8,643,989 (8,643,989) - Prepaid Items 10,169 2,500 12,669
Total current assets 53,235,257 43,424,513 96,659,770
Noncurrent Assets:Cash and cash equivalents - 33,376,169 33,376,169 Deferred charges - 756,476 756,476 Capital assets, not being depreciated - 8,011,141 8,011,141 Capital assets, net of accumulated depreciation 1,346,607 85,274,532 86,621,139 Total noncurrent assets 1,346,607 127,418,318 128,764,925
Total assets 54,581,864 170,842,831 225,424,695
Liabilities
Liabilities:Current Liabilities
Accounts payable 276,041 3,223,865 3,499,906 Accrued salaries and benefits 579,191 99,001 678,192 Due to other governments 30,198 21,234,150 21,264,348 Revenue bonds payable - 2,265,000 2,265,000 Bond interest payable - 2,622,659 2,622,659 Compensated absences payable 601,049 503,466 1,104,515
Total current liabilities 1,486,479 29,948,141 31,434,620
Noncurrent liabilities:Compensated absences payable 247,212 377,797 625,009 Revenue bonds payable, including unamortized premium - 102,783,942 102,783,942
Total noncurrent liabilities 247,212 103,161,739 103,408,951
Total liabilities 1,733,691 133,109,880 134,843,571
Net Assets
Invested in capital assets, net of related debt 1,346,607 21,322,728 22,669,335 Restricted 178,382 - 178,382 Unrestricted 51,323,184 16,410,223 67,733,407
Total net assets 52,848,173$ 37,732,951$ 90,581,124$
See accompanying notes to the financial statements.

Valley Metro Regional Public Transportation Authority Statement of Activities Fiscal Year June 30, 2011
15
Charges for Operating Grants Capital GrantsExpenses Services & Contributions & Contributions
ProgramsGovernmental activities:
Regional planning:Long range 101,121 189,000$ 799,840$ -$ Short range 1,063,291 - 851,443 - Capital 113,073 - 635,647 - Program support 997,203 - - -
Transportation demand management:Trip reduction 909,742 - - - Ridesharing 590,062 - - - Other programs 42,633 - - -
Regional customer services:Marketing 2,201,863 - - - Call center 3,833,319 - - - Other programs 1,960,196 - - -
Administration:Executive director’s office 1,284,141 - - - Finance & management services 682,197 - - -
Total governmental activities 13,778,841 189,000 2,286,930 -
Business-type activities:Transit service operations 90,336,819 15,173,161 2,144,496 8,289,329 Light rail transit 66,140,185 8,201,600 - -
Total business-type activities 156,477,004 23,374,761 2,144,496 8,289,329 Total primary government 170,255,845$ 23,563,761$ 4,431,426$ 8,289,329$
General revenues:Sales taxes:
Public transportation fundsRegional area road funds
Interest earningsOther income
Transfers in (out) Total general revenues & transfers
Change in net assets
Net assets - beginningNet assets - ending
Program Revenues
(Continued)
See accompanying notes to the financial statements.

16
Governmental Business TypeActivities Activities Total
887,719$ -$ 887,719$ (211,848) - (211,848) 522,574 - 522,574
(997,203) - (997,203)
(909,742) - (909,742) (590,062) - (590,062)
(42,633) - (42,633)
(2,201,863) - (2,201,863) (3,833,319) - (3,833,319) (1,960,196) - (1,960,196)
(1,284,141) - (1,284,141) (682,197) - (682,197)
(11,302,911) - (11,302,911)
- (64,729,833) (64,729,833) - (57,938,585) (57,938,585) - (122,668,418) (122,668,418)
(11,302,911)$ (122,668,418)$ (133,971,329)$
102,688,559 - 102,688,559 4,422,559 - 4,422,559
79,874 215,800 295,674 233,357 560,643 794,000
(89,250,166) 89,250,166 - 18,174,183 90,026,609 108,200,792
6,871,272 (32,641,809) (25,770,537)
45,976,901 70,374,760 116,351,661 52,848,173$ 37,732,951$ 90,581,124$
Net (Expense) Revenues andChanges in Net Assets

Valley Metro Regional Public Transportation Authority Balance Sheet Governmental Funds June 30, 2011
17
Transportation Total
Transit Demand GovernmentalGeneral Planning Management Funds
Assets
Cash and cash equivalents 34,574,298$ -$ -$ 34,574,298$ Due from other governments 9,154,974 623,452 228,375 10,006,801 Due from other funds 9,251,963 - - 9,251,963 Prepaid Items 6,797 - 3,372 10,169
Total assets 52,988,032$ 623,452$ 231,747$ 53,843,231$
Liabilities and Fund Balances
Liabilities:Accounts payable 222,964$ 37,223$ 15,854$ 276,041$ Accrued salaries and benefits 563,425 10,595 5,171 579,191 Due to other funds - 475,428 132,546 607,974 Due to other governments 30,198 - - 30,198
Total liabilities 816,587 523,246 153,571 1,493,404
Fund balances:Nonspendable:
Prepaids 6,797 - 3,372 10,169 Restricted: - 100,206 74,804 175,010 Unassigned: 52,164,648 - - 52,164,648
Total fund balances 52,171,445 100,206 78,176 52,349,827 Total liabilities and fund balances 52,988,032$ 623,452$ 231,747$ 53,843,231$
Reconciliation of the balance sheet to the statementof net assets
Fund balances, total governmentalfunds balance sheet 52,349,827$
Amounts reported for governmentalactivities in the statement of netassets are different because:
Governmental capital assets 4,041,918 Less accumulated depreciation (2,695,311)
Governmental compensated absences (848,261)
Net assets of governmentalactivities, statement of net assets 52,848,173$
See accompanying notes to the financial statements.

Valley Metro Regional Public Transportation Authority Statement of Revenues, Expenditures and Changes in Fund Balances Governmental Funds Fiscal Year Ended June 30, 2011
18
Transportation Total
Transit Demand GovernmentalGeneral Planning Management Funds
Revenues:Sales taxes:
Public transportation funds 102,688,559$ -$ -$ 102,688,559$ Regional area road funds 4,422,559 - - 4,422,559
Intergovernmental:State & county grants & pass through gra - - 635,647 635,647 Federal Transit Administration 149,065 650,775 - 799,840 CMAQ - - 851,443 851,443
Charges for services - 189,000 - 189,000 Interest earnings 79,874 - - 79,874 Miscellaneous 191,489 48 41,820 233,357
Total revenues 107,531,546 839,823 1,528,910 109,900,279
Expenditures:Current:
Regional planning:Long range - 101,121 - 101,121 Short range - 1,063,291 - 1,063,291 Capital - 113,073 - 113,073 Program support - 997,203 - 997,203
Transportation demand management:Trip reduction - - 909,742 909,742 Ridesharing - - 590,062 590,062 Other programs - - 42,633 42,633
Regional customer services:Marketing 2,201,863 - - 2,201,863 Call center 3,833,319 - - 3,833,319 Other programs 1,815,740 - - 1,815,740
Administration:Executive director’s office 1,284,141 - - 1,284,141 Finance & management services 359,637 - - 359,637
Capital outlay 1,113,456 - - 1,113,456 Total expenditures 10,608,156 2,274,688 1,542,437 14,425,281
Excess (deficiency) of revenues over (under) expenditures 96,923,390 (1,434,865) (13,527) 95,474,998
Other financing sources (uses):Transfers in - 1,434,865 12,714 1,447,579 Transfers out (90,697,745) - - (90,697,745)
Total other financing sources (uses) (90,697,745) 1,434,865 12,714 (89,250,166) Net change in fund balances 6,225,645 - (813) 6,224,832
Fund balance, beginning as restated 45,945,800 100,206 78,989 46,124,995 Fund balance, ending 52,171,445$ 100,206$ 78,176$ 52,349,827$
See accompanying notes to the financial statements.

Valley Metro Regional Public Transportation Authority Reconciliation of the Statement of Revenues, Expenditures and Changes in Fund Balances of Governmental Funds to the Statement of Activities Fiscal Year Ended June 30, 2011
19
Net change in fund balances, total governmental funds 6,224,832$
The change in net assets reported for governmental activities in the statement of different because:
1. Governmental funds report capital outlays as expenditures. However, in the statement of activities, the costs of capitalized assets is allocated over their estimated useful lives and reported as depreciation expense.
This is the amount by which capital outlay expense ($1,114,341) exceeded depreciation expense ($453,736) in the current period. 660,607
2. In the Statement of Activities, only the gain/loss on the sale of capital assets is reported, whereas in the governmental funds, the proceeds from the sale increase financial resources. Thus, the change in net assets differ from the change in fund balance by the book value of capital assets sold. (3,786)
3. The governmental funds, under the modified accrual basis of accounting, do not report the unpaid compensated absences as an expenditure or liability, as they are not paid with expendable available financial resources. In the statement of activities, however, which is presented on the accrual basis, expenses and liabilities are reported regardless of when financial resources are used. (10,381)
Change in net assets of governmental activities, statement of activities 6,871,272$
See accompanying notes to the financial statements.

Valley Metro Regional Public Transportation Authority Statement of Revenues, Expenditures and Changes in Fund Balance – Budget to Actual General Fund Fiscal Year Ended June 30, 2011
20
Variance withFinal Budget
Actual OverOriginal Final Amounts (Under)
Revenues:Sales taxes:
Regional area road funds 4,467,000$ 4,422,558$ 4,422,559$ 1$ Public Transportation fund 97,300,000 98,800,000 102,688,559 3,888,559
Intergovernmental:Federal Transit Administration 100,000 150,000 149,065 (935)
Interest earnings 100,000 100,000 79,874 (20,126) Miscellaneous 150,515 150,515 191,489 40,974
Total revenues 102,117,515 103,623,073 107,531,546 3,908,473
Expenditures:Current:Regional Customer Services:
Marketing 2,581,525 2,350,000 2,201,863 (148,137) Call Center 3,819,385 3,819,385 3,833,319 13,934 Other Programs 2,184,385 1,818,385 1,815,740 (2,645)
Executive director’s office 1,255,083 1,255,083 1,284,141 29,058 Finance & management services 591,671 1,094,725 359,637 (735,088) Capital Outlay 442,000 773,901 1,113,456 339,555
Total expenditures 10,874,049 11,111,479 10,608,156 (503,323)
Excess of revenues over expenditures 91,243,466 92,511,594 96,923,390 4,411,796
Other financing uses:Transfers in 8,876,780 9,064,210 - (9,064,210) Transfers out (100,120,246) (102,450,759) (90,697,745) 11,753,014
Total other financing uses (91,243,466) (93,386,549) (90,697,745) 2,688,804
Net change in fund balance - (874,955) 6,225,645 7,100,600
Fund balance, beginning 33,078,580 33,078,580 45,945,800 12,867,220
Fund balance, ending 33,078,580$ 32,203,625$ 52,171,445$ 19,967,820$
Budgeted Amounts
See accompanying notes to the financial statements.

Valley Metro Regional Public Transportation Authority Statement of Revenues, Expenditures and Changes in Fund Balance – Budget to Actual Transit Planning Fund Fiscal Year Ended June 30, 2011
21
Variance withFinal Budget
Actual OverOriginal Final Amounts (Under)
Revenues:Intergovernmental:
Federal Transit Administration 701,711$ 709,256$ 650,775 (58,481)$ Charges for Services 26,000 189,000 189,000 - Miscellaneous - - 48 48
Total revenues 727,711 898,256 839,823 (58,433)
Expenditures:Current:Regional planning:
Long range 136,723 136,723 101,121 (35,602) Short range 985,728 1,220,898 1,063,291 (157,607) Capital 145,187 145,187 113,073 (32,114) Program support 1,259,743 1,227,743 997,203 (230,540)
Total expenditures 2,527,381 2,730,551 2,274,688 (455,863)
Excess of revenues over expenditures (1,799,670) (1,832,295) (1,434,865) 397,430
Other financing uses:Transfers in 1,799,670 1,832,295 1,434,865 (397,430)
Total other financing uses 1,799,670 1,832,295 1,434,865 (397,430)
Net change in fund balance - - - -
Fund balance, beginning - - 100,206 100,206
Fund balance, ending -$ -$ 100,206$ 100,206$
Budgeted Amounts
See accompanying notes to the financial statements.

Valley Metro Regional Public Transportation Authority Statement of Revenues, Expenditures and Changes in Fund Balance – Budget to Actual Transportation Demand Management Fund Fiscal Year Ended June 30, 2011
22
Variance withFinal Budget
Actual OverOriginal Final Amounts (Under)
Revenues:Intergovernmental:
State grants & pass through grants 507,238$ 512,238$ 635,647$ 123,409$ CMAQ 994,000 994,000 851,443 (142,557) Miscellaneous - - 41,820 41,820
Total revenues 1,501,238 1,506,238 1,528,910 22,672
Expenditures:Current:Transportation Demand Management:
Trip reduction 907,238 912,238 909,742 (2,496) Ridesharing 594,000 594,000 590,062 (3,938) Other programs - - 42,633 42,633
Total expenditures 1,501,238 1,506,238 1,542,437 36,199
Excess of revenues over expenditures - - (13,527) (13,527)
Other financing uses:Transfers in - - 12,714 12,714
Total other financing uses - - 12,714 12,714
Net change in fund balance - - (813) (813)
Fund balance, beginning - - 78,989 78,989
Fund balance, ending -$ -$ 78,176$ 78,176$
Budgeted Amounts
See accompanying notes to the financial statements.
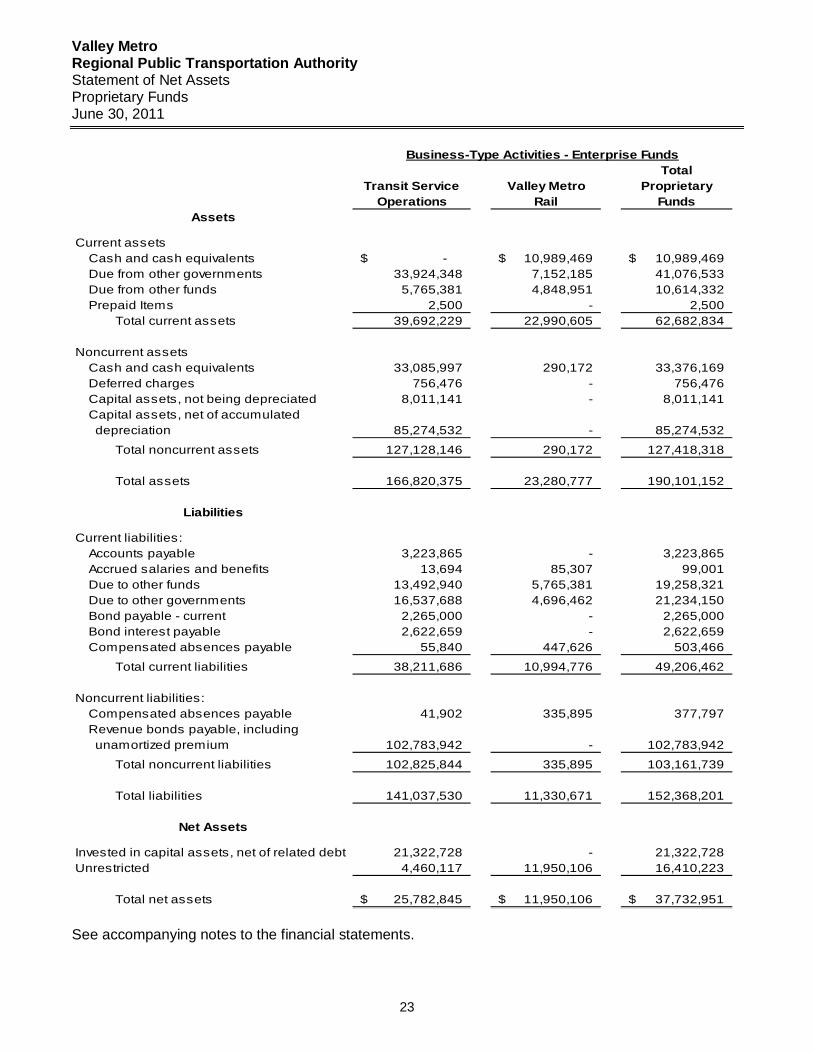
Valley Metro Regional Public Transportation Authority Statement of Net Assets Proprietary Funds June 30, 2011
23
TotalTransit Service Valley Metro Proprietary
Operations Rail FundsAssets
Current assetsCash and cash equivalents -$ 10,989,469$ 10,989,469$ Due from other governments 33,924,348 7,152,185 41,076,533 Due from other funds 5,765,381 4,848,951 10,614,332 Prepaid Items 2,500 - 2,500
Total current assets 39,692,229 22,990,605 62,682,834
Noncurrent assetsCash and cash equivalents 33,085,997 290,172 33,376,169 Deferred charges 756,476 - 756,476 Capital assets, not being depreciated 8,011,141 - 8,011,141 Capital assets, net of accumulated depreciation 85,274,532 - 85,274,532
Total noncurrent assets 127,128,146 290,172 127,418,318
Total assets 166,820,375 23,280,777 190,101,152
Liabilities
Current liabilities:Accounts payable 3,223,865 - 3,223,865 Accrued salaries and benefits 13,694 85,307 99,001 Due to other funds 13,492,940 5,765,381 19,258,321 Due to other governments 16,537,688 4,696,462 21,234,150 Bond payable - current 2,265,000 - 2,265,000 Bond interest payable 2,622,659 - 2,622,659 Compensated absences payable 55,840 447,626 503,466
Total current liabilities 38,211,686 10,994,776 49,206,462
Noncurrent liabilities:Compensated absences payable 41,902 335,895 377,797 Revenue bonds payable, including unamortized premium 102,783,942 - 102,783,942
Total noncurrent liabilities 102,825,844 335,895 103,161,739
Total liabilities 141,037,530 11,330,671 152,368,201
Net Assets
Invested in capital assets, net of related debt 21,322,728 - 21,322,728 Unrestricted 4,460,117 11,950,106 16,410,223
Total net assets 25,782,845$ 11,950,106$ 37,732,951$
Business-Type Activities - Enterprise Funds
See accompanying notes to the financial statements.
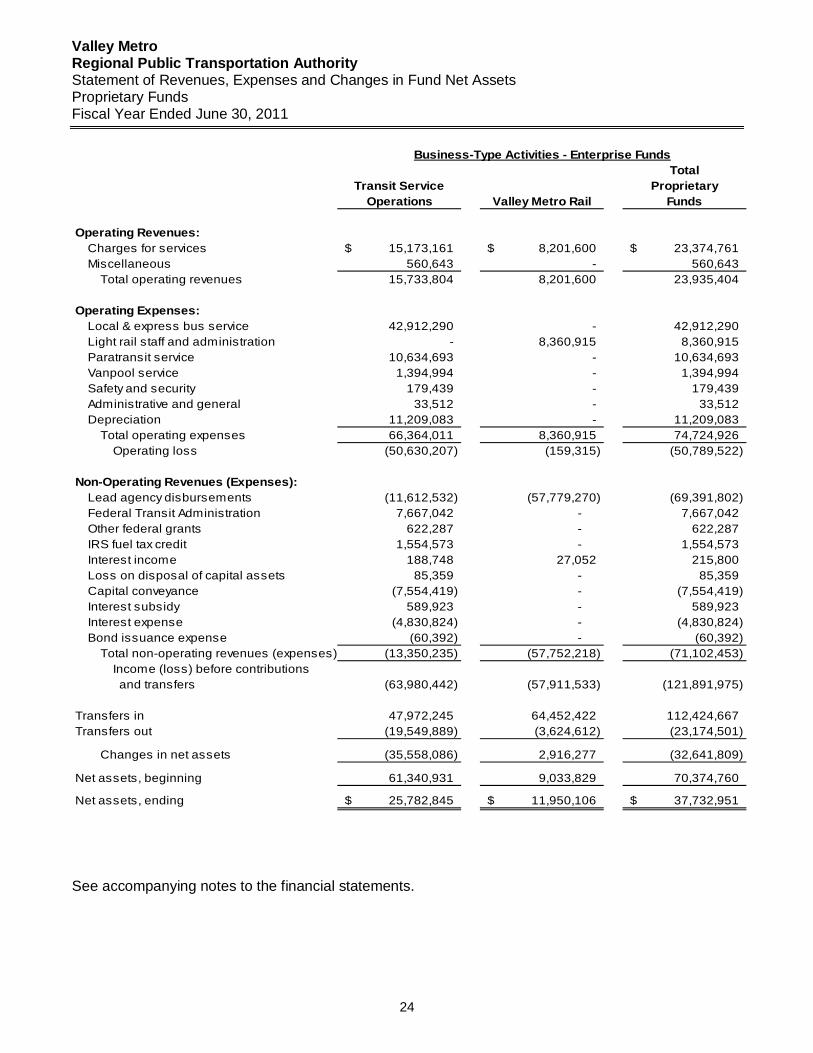
Valley Metro Regional Public Transportation Authority Statement of Revenues, Expenses and Changes in Fund Net Assets Proprietary Funds Fiscal Year Ended June 30, 2011
24
TotalTransit Service Proprietary
Operations Valley Metro Rail Funds
Operating Revenues:Charges for services 15,173,161$ 8,201,600$ 23,374,761$ Miscellaneous 560,643 - 560,643
Total operating revenues 15,733,804 8,201,600 23,935,404
Operating Expenses:Local & express bus service 42,912,290 - 42,912,290 Light rail staff and administration - 8,360,915 8,360,915 Paratransit service 10,634,693 - 10,634,693 Vanpool service 1,394,994 - 1,394,994 Safety and security 179,439 - 179,439 Administrative and general 33,512 - 33,512 Depreciation 11,209,083 - 11,209,083
Total operating expenses 66,364,011 8,360,915 74,724,926 Operating loss (50,630,207) (159,315) (50,789,522)
Non-Operating Revenues (Expenses):Lead agency disbursements (11,612,532) (57,779,270) (69,391,802) Federal Transit Administration 7,667,042 - 7,667,042 Other federal grants 622,287 - 622,287 IRS fuel tax credit 1,554,573 - 1,554,573 Interest income 188,748 27,052 215,800 Loss on disposal of capital assets 85,359 - 85,359 Capital conveyance (7,554,419) - (7,554,419) Interest subsidy 589,923 - 589,923 Interest expense (4,830,824) - (4,830,824) Bond issuance expense (60,392) - (60,392)
Total non-operating revenues (expenses) (13,350,235) (57,752,218) (71,102,453) Income (loss) before contributions and transfers (63,980,442) (57,911,533) (121,891,975)
Transfers in 47,972,245 64,452,422 112,424,667 Transfers out (19,549,889) (3,624,612) (23,174,501)
Changes in net assets (35,558,086) 2,916,277 (32,641,809)
Net assets, beginning 61,340,931 9,033,829 70,374,760
Net assets, ending 25,782,845$ 11,950,106$ 37,732,951$
Business-Type Activities - Enterprise Funds
See accompanying notes to the financial statements.

Valley Metro Regional Public Transportation Authority Statement of Cash Flows Proprietary Funds Fiscal Year Ended June 30, 2011
25
Transit Valley TotalService Metro Proprietary
Operations Rail FundsCash flows from operating activities
Receipts from customers 6,430,725$ 1,942,874$ 8,373,599$ Payments to suppliers (68,363,795) 753,031 (67,610,764) Payments to employees (931,438) (6,056,104) (6,987,542)
Net cash provided by (used in) operating activities (62,864,508) (3,360,199) (66,224,707)
Cash flows from noncapital and related financing activities
Transfers in - sales taxes 47,939,297 500,000 48,439,297 Lead agency disbursements (8,573,158) (500,000) (9,073,158) Due to/from other funds 8,661,228 10,582,761 19,243,989 Federal alternative fuel tax credit 1,554,573 - 1,554,573 Receipts from federal grants 622,287 - 622,287
Net cash provided by (used in) noncapital and related financing activities 50,204,227 10,582,761 60,786,988
Cash flows from capital and related financing activities
Purchases of capital assets 3,861,567 - 3,861,567 Capital conveyance (7,554,419) - (7,554,419) Lead agency disbursements (3,039,374) (57,279,270) (60,318,644) Receipts from federal capital grants 7,667,042 - 7,667,042 Interest subsidy 589,923 589,923 Interest paid on capital debt (5,245,320) - (5,245,320) Transfers out (19,549,889) (3,624,612) (23,174,501) Transfers in - sales taxes 32,948 63,952,422 63,985,370
Net cash provided by (used in) capital and related financing activities (23,237,522) 3,048,540 (20,188,982)
Cash flows from investing activitiesInterest received on investments 188,748 27,052 215,800
Net cash provided by investing activities 188,748 27,052 215,800
Net increase(decrease) in cash and cash equivalents (35,709,055) 10,298,154 (25,410,901) Cash and cash equivalents, beginning of year 68,795,052 981,487 69,776,539 Cash and cash equivalents, end of year 33,085,997$ 11,279,641$ 44,365,638$
From the Proprietary Funds Statement of Net AssetsCurrent cash and cash equivalents - 10,989,469 10,989,469 Noncurrent cash and cash equivalents 33,085,997 290,172 33,376,169
Total cash and cash equivalents 33,085,997$ 11,279,641$ 44,365,638$
Reconciliation of operating loss to net cash provided by (used in) operating activitiesOperating loss (50,630,207)$ (159,315)$ (50,789,522)$ Adjustments to reconcile operating loss to net cash provided by (used in) operating activities:
Depreciation 11,209,083 - 11,209,083 (Increase) decrease in assets:
Due from other governments (9,303,079) (6,258,726) (15,561,805) Other assets 3,750 - 3,750
Increase (decrease) in liabilities:Accounts payable (3,061,764) - (3,061,764) Accrued salaries and benefits 4,864 18,248 23,112 Due to other governments (11,054,174) 3,010,357 (8,043,817) Compensated absences payable (32,981) 29,237 (3,744)
Total adjustments (12,234,301) (3,200,884) (15,435,185) Net cash provided by (used in) operating activities (62,864,508)$ (3,360,199)$ (66,224,707)$
Noncash capital and operating activitiesCapital assets contributed by a local member city -$ -$ -$
See accompanying notes to the financial statements.
Business-Type Activities - Enterprise Funds

Valley Metro Regional Public Transportation Authority Statement of Changes in Fiduciary Net Assets Fiduciary Fund Fiscal Year Ended June 30, 2011
26
LTAF II PrivatePurpose Trust
Fund
Additions
Contributions 3,201,875$
Total additions 3,201,875
Deductions
Distributions 3,201,875
Total deductions 3,201,875
Changes in net assets -
Net assets, beginning -
Net assets, ending -$
See accompanying notes to the financial statements.

(This page intentionally left blank)

Valley Metro Regional Public Transportation Authority Index to the Notes to the Financial Statements
27
Page
1. Summary of Significant Accounting Policies 28
a. Financial Reporting Entity 28 b. Basic Financial Statements 29-30 c. Basis of Presentation 30-31 d. Measurement Focus, Basis of Accounting and Financial Statement Presentation 31-33 e. Budgetary Basis of Accounting 33 f. Deposits and Investments 33-34 g. Prepaid Items 34 h. Capital Assets 34 i. Transactions Between Funds 35 j. Receivables 35 k. Compensated Absences 35 l. Long Term Obligations 36 m. Net Assets 36 n. Fund Balances 36-37 o. Cash Equivalents 37 p. Use of Estimates 37 q. Accounting Pronouncements 37
2. Reconciliation of Governmental Fund Financial Statements to Government-Wide Statements 38-39
3. Deposits and Investments 40 a. Deposits 40 b. Investments 40-41
4. Interfund Receivables/Payables and Interfund Transactions 41-42 5. Fund Balance/Net Assets Reservations and Designations 42 6. Restatement of Net Assets/Fund Balances 43 7. Capital Assets 44-45 8. Operating Leases 45 9. Long-Term Liabilities 46-47
a. Transportation Excise Tax Revenue Bonds 46-47 b. Compensated Absences 47
10. Risk Management 47 11. Retirement and Pension Plans 48
a. Plan descriptions 48 b. Funding policy 48
12. Contractual and Other Commitments 49 a. Underground Storage Tank Revolving Fund Replenishment 49 b. Commitments 49
13. Contingencies 49 14. Related Party Transactions 50 15. Excess of Expenditures over Appropriations 50 16. Subsequent Events 50

Valley Metro Regional Public Transportation Authority Notes to the Financial Statements Fiscal Year Ended June 30, 2011
28
1. Summary of Significant Accounting Policies The accounting policies of the Regional Public Transportation Authority (the Authority) conform to accounting principles generally accepted in the United States of America (GAAP) as applicable to governmental units. The Governmental Accounting Standards Board (GASB) is the accepted standard-setting body for establishing governmental accounting and financial reporting principles. The following summary of the more significant accounting policies of the Authority is presented to assist the reader in interpreting these financial statements, and should be viewed as an integral part of this financial report. a. Financial Reporting Entity
The Authority was established under the laws of the State of Arizona in 1985 along with the passage of a one-half of one percent sales tax increase to fund regional highway and public transportation improvements. The Authority was charged with developing a regional transit plan and developing and operating a regional transit system for Maricopa County (the County). In 1993, the Authority’s Board of Directors adopted Valley Metro as the identity for the regional transit system. Valley Metro was chosen to give the region’s buses a more recognizable identity and to help unify public transit systems in the County. The Authority is governed by a Board of Directors consisting of a member of the County Board of Supervisors and the mayors (or their designees) of the member cities and towns. For fiscal year 2010-11, the members included the cities of Avondale, Chandler, El Mirage, Glendale, Goodyear, Mesa, Peoria, Phoenix, Scottsdale, Surprise, Tempe and Tolleson, and the towns of Buckeye, Gilbert and Wickenburg. A municipality may have one elected official serve on the Authority’s Board of Directors by committing a portion of their local transportation assistance funds to local public transportation. In October 2002, the city councils of Glendale, Mesa, Phoenix and Tempe approved the formation of a public nonprofit corporation by the name of Valley Metro Rail, Inc. (VMR). The nonprofit corporation was organized for the purpose of planning, designing, constructing and operating the Light Rail Transit Project. VMR contracts with the Authority for certain administrative functions, including personnel, administration and financial and accounting services. This activity is recorded in the Authority’s Valley Metro Rail Enterprise Fund. All VMR staff is hired and employed by the Authority but works solely under the direction of the legally separate entity of VMR and its Board of Directors through a contractual arrangement with the Authority. The Board of VMR is solely responsible for the governance of VMR, and the Authority’s Board of Directors has no responsibility for VMR. VMR is not a component unit of the Authority because the economic resources received by VMR are entirely for the direct benefit of VMR, and the Authority is not entitled to and has no ability to otherwise access any of the economic resources received or held by VMR. However, VMR is a related party of the Authority since the cities who are members of VMR’s Board of Directors are also members of the Authority’s Board of Directors.
Valley Metro Regional Public Transportation Authority Notes to the Financial Statements (Continued) Fiscal Year Ended June 30, 2011
29
b. Basic Financial Statements The government-wide financial statements (statement of net assets and statement of activities) report on the Authority as a whole, excluding fiduciary activities. Governmental activities, which normally are supported by taxes and intergovernmental revenues, are reported separately from business-type activities, which rely to a significant extent on fees and charges for support. The government-wide financial statements focus more on the sustainability of the Authority as an entity and the change in aggregate financial position resulting from the activities of the fiscal period. Generally, the effect of interfund activity has been removed from the government-wide financial statements. Net interfund activity and balances between governmental activities and business-type activities are shown in the government-wide financial statements. The government-wide Statement of Net Assets reports all financial and capital resources of the government (excluding fiduciary funds). It is displayed in a format of assets less liabilities equal net assets, with the assets and liabilities shown in order of their relative liquidity. Net assets are required to be displayed in three components: 1) invested in capital assets, net of related debt, 2) restricted and 3) unrestricted. Invested in capital assets, net of related debt is capital assets net of accumulated depreciation and reduced by outstanding balances of any bonds, mortgages, notes or other borrowings that are attributable to the acquisition, construction or improvement of those assets. Restricted net assets are those with constraints placed on their use by either: 1) externally imposed by creditors (such as through debt covenants), grantors, contributors or laws or regulations of other governments, or 2) imposed by law through constitutional provisions or enabling legislation. All net assets not otherwise classified as restricted are shown as unrestricted. Generally, the Authority would first apply restricted resources when an expense is incurred for purposes for which both restricted and unrestricted net assets are available. Reservations or designations of net assets imposed by the reporting government, whether by administrative policy or legislative action of the reporting government, are not shown on the government-wide financial statements. Note 5 discusses the internal reservations and designations of fund balances/net assets in the various funds to demonstrate the government’s intended use of those net assets. The government-wide Statement of Activities demonstrates the degree to which the direct expenses of the various functions and segments of the Authority are offset by program revenues. Direct expenses are those that are clearly identifiable with a specific function or segment. Program revenues include: 1) charges to customers or users who purchase, use or directly benefit from goods, services or privileges provided by a particular function or segment and 2) grants and contributions that are restricted to meeting the operational or capital requirements of a particular function or segment. Taxes, investment income and the other revenues not identifiable with particular functions or segments are included as general revenues. The general revenues support the net costs of the functions and segments not covered by program revenues.

Valley Metro Regional Public Transportation Authority Notes to the Financial Statements (Continued) Fiscal Year Ended June 30, 2011
30
Also part of the basic financial statements are fund financial statements for governmental funds, proprietary funds and fiduciary funds, even though the latter are excluded from the government-wide financial statements. Major individual governmental funds and major individual enterprise funds are reported as separate columns in the fund financial statements.
c. Basis of Presentation The accounts of the Authority are organized and operated on the basis of funds. A fund is an independent fiscal and accounting entity with a self-balancing set of accounts, which includes assets, liabilities, fund equity, revenues and expenditures/expenses. Fund accounting segregates funds according to their intended purpose and is used to aid management in demonstrating compliance with finance-related legal and contractual provisions. The minimum number of funds is maintained consistent with legal and managerial requirements. The following fund categories are used by the Authority: Governmental Funds Governmental funds are used to account for the Authority’s general government activities. The focus of Governmental Fund measurement, in the fund financial statements, is upon determination of financial position and changes in financial position rather than upon net income. The Authority reports the following major Governmental Funds:
The General Fund is the Authority’s primary operating fund. It accounts for all financial resources of the general government, except those required to be accounted for in another fund. The Transit Planning Fund accounts for the receipt and expenditure of U.S. Department of Transportation, Federal Transit Administration, Federal Transit Technical Studies grant monies and member cities local match restricted for various planning studies. The Transportation Demand Management Fund accounts for the receipt and expenditure of various grant monies restricted for activities related to the countywide ridesharing program, trip reduction program and clean air campaign.
Proprietary Funds Proprietary funds account for activities of the Authority similar to those found in the private sector, where cost recovery and the determination of net income are useful or necessary for sound fiscal management. The focus of proprietary fund measurement is upon the determination of operating income, changes in net assets, financial position and cash flows. Currently, enterprise funds are the only type of proprietary funds that the Authority uses.
Valley Metro Regional Public Transportation Authority Notes to the Financial Statements (Continued) Fiscal Year Ended June 30, 2011
31
Enterprise funds are used to account for those operations that provide services to the general public for a fee. Enterprise funds are also required for any activity whose principal revenue sources meet any of the following criteria: 1) any activity that has issued debt backed solely by the fees and charges of the activity, 2) if the cost of providing services for an activity, including capital costs such as depreciation or debt service, must legally be recovered through fees and charges, or 3) it is the policy of the Authority to establish activity fees or charges to recover the cost of providing services, including capital costs. The Authority reports the following major enterprise funds:
The Transit Service Operations Fund accounts for the activities related to the operations of local and express bus, dial-a-ride and vanpool services for the region. The Valley Metro Rail Fund accounts for the activities related to the staffing and administrative services that are contractually provided by the Authority to Valley Metro Rail, Inc. and transfers in of the Public Transportation Fund (PTF) and the Regional Area Road Funds (RARF) sales tax revenues and expenses of such funds related to the Regional Transportation Plan approved light rail projects.
Fiduciary Funds Fiduciary funds account for assets held by the Authority in a trustee or agency capacity on behalf of others and therefore are not available to support Authority programs. The reporting focus is upon net assets and changes in net assets and employs accounting principles similar to proprietary funds. Fiduciary funds are not included in the government-wide financial statements since they are not assets of the Authority available to support Authority programs. Currently, private-purpose trust funds are the only type of fiduciary funds that the Authority uses: Private-purpose trust fund accounts for assets held by the Authority under the terms of a formal trust agreement where both the principal and income may be used to support individuals, private organizations or other governments as set forth in the trust agreement. The private-purpose trust fund of the Authority is as follows:
The LTAF II Fund accounts for state general fund monies received from the Arizona Department of Transportation and distributed to the cities and county within the Authority’s region.
d. Measurement Focus, Basis of Accounting, and Financial Statement Presentation
The government-wide financial statements are reported using the economic resources measurement focus and the accrual basis of accounting, as are the proprietary fund and fiduciary fund financial statements. Revenues are recorded when earned and expenses are recorded when a liability is incurred, regardless of the timing of related cash flows.

Valley Metro Regional Public Transportation Authority Notes to the Financial Statements (Continued) Fiscal Year Ended June 30, 2011
32
Governmental fund types are presented, in the fund financial statements, using the flow of current financial resources measurement focus and modified accrual basis of accounting. With this measurement focus, operating statements present increases and decreases in net current assets and unreserved fund balance is a measure of available spendable resources. Under the modified accrual basis of accounting, revenues are recognized when susceptible to accrual (i.e., when they are “measurable and available”). “Measurable” means the amount of the transaction can be determined and “available” means collectible within the current period or soon thereafter to pay liabilities of the current period. The Authority considers revenues available under modified accrual, if they are earned by June 30 (all eligibility requirements have been met) and the revenue is expected to be collected within six months after year-end. Expenditures are recorded when the related fund liability is incurred. This is the traditional basis of accounting for governmental funds and also is the manner in which these funds are normally budgeted. This presentation is deemed most appropriate to 1) demonstrate legal and covenant compliance, 2) demonstrate the sources and uses of liquid resources, and 3) demonstrate how the Authority’s actual revenues and expenditures conform to the annual budget. Since the governmental fund financial statements are presented on a different basis than the governmental activities column of the government-wide financial statements, a reconciliation is provided immediately following each fund statement. These reconciliations briefly explain the adjustments necessary to transform the fund financial statements into the governmental activities column of the government-wide financial statements. Additional reconciliations are also provided in Note 2. When applying the “susceptible to accrual” concept to intergovernmental revenues pursuant to GASB Statement No. 33 – Recipient Reporting for Certain Shared Non-exchange Transactions (Statement No. 33), receivables and revenues are recognized when the applicable eligibility requirements, including time requirements, are met. Resources transmitted before the eligibility requirements are met are reported as deferred revenue. Interest income is recognized on the modified accrual basis. Changes in fair value of investments are recognized in investment income at the end of the year. Sales taxes, entitlements and shared revenues are recorded at the time of receipt or earlier if the susceptible to accrual criteria are met. Expenditure-driven grants are recognized as revenue when the qualifying expenditures have been incurred and all other grant requirements have been met. For the governmental fund statements, grant revenue earned but not expected to be received within six months of year end is deferred. The proprietary fund and private purpose trust funds financial statements are prepared on the same basis (economic resources measurement focus and accrual basis of accounting) as the government-wide financial statements. Therefore, the total enterprise funds on the proprietary fund financial statements will directly reconcile to the business-type activities column on the government-wide financial statements. The flow of economic resources measurement focus emphasizes the determination of net income.

Valley Metro Regional Public Transportation Authority Notes to the Financial Statements (Continued) Fiscal Year Ended June 30, 2011
33
Under the accrual basis of accounting, revenues are recorded when earned and expenses are recorded at the time liabilities are incurred. On the proprietary fund financial statements, operating revenues are those that flow directly from the operations of that activity, i.e., charges to customers or users who purchase or use the goods or services of that activity. Operating expenses are those that are incurred to provide those goods or services. Non-operating revenues and expenses are items like investment income and interest expense that are not a result of the direct operations of the activity.
e. Budgetary Basis of Accounting An annual budget of revenues and expenditures is prepared and adopted by the Board of Directors each fiscal year for all funds. The legal level of budgetary control is the total annual appropriated budget. Costs in excess of the total annual appropriated budget require approval of the Board of Directors. Transfers of appropriations between departments require the approval of the Executive Director. The annual budget is adopted on the modified accrual basis. Encumbrance accounting is used and all appropriations lapse at year end. Prior to final adoption, a proposed budget is presented to the Board of Directors for review and public comment is received. Final adoption of the budget must be on or before June 30 of each year. Budgetary comparison statements for the general fund and major special revenue funds must be presented as part of the basic financial statements or as required supplementary information. The Authority has chosen to present this information as part of the basic financial statements. These statements must display original budget, amended budget and actual results (on a budgetary basis). Budgetary comparisons for the major enterprise funds are presented following the notes to the financial statements. Where necessary, a reconciliation has been provided of the adjustments required to convert the budgetary revenues and expenditures or changes in net assets on a budgetary basis to revenues and expenditures/expenses or change in net assets on a GAAP basis.
f. Deposits and Investments State statutes authorize the Authority to invest in obligations of the U.S. Treasury and any of its agencies, corporations or instrumentalities, collateralized repurchase agreements, certificates of deposit and the State of Arizona’s Local Government Investment Pool (LGIP). Currently the Authority invests only in the LGIP, which is operated by the Arizona State Treasurer’s Office, as authorized by Arizona Revised Statues, §35-326. Arizona Revised Statutes §35-312 and §35-313 regulate authorized investments. Local Government Investment Pool investments are carried at fair value. The fair value of pooled investments is determined annually and is based on current market prices. The fair value of participants’ position in the pool approximates the value of the pool shares. The method used to determine the value of participants’ equity withdrawn is based on the book value of the participants’ percentage participation at the date of such withdrawal.

Valley Metro Regional Public Transportation Authority Notes to the Financial Statements (Continued) Fiscal Year Ended June 30, 2011
34
The Authority maintains pooled cash and investments. Income from pooled cash and investments is allocated to the individual funds based on the fund’s month end cash balance in relation to the total pooled cash and investments. Authority management has determined that the investment income related to all funds except the Valley Metro Rail Enterprise Fund should be allocated to the General Fund. Each fund’s equity in the pooled cash and investments is tracked on an ongoing basis. In the event that a certain fund overdraws its share of pooled cash, the overdraft is reported as due to other funds at year end.
g. Prepaid Items Certain payments to vendors reflect costs applicable to future accounting periods and are recorded as prepaid items in both government-wide and fund financial statements.
h. Capital Assets All capital assets, whether owned by governmental activities or business-type activities, must be recorded and depreciated (unless the modified approach is used) in the government-wide financial statements. No long-term assets or depreciation are shown in the governmental fund financial statements. Capital assets are defined as assets with an initial, individual cost of more than $5,000 and an estimated useful life greater than one year. The Authority has no public domain infrastructure (e.g., roads, bridges, sidewalks and other assets that are immovable and of value only to the Authority) or capital construction projects. Capital assets are recorded at cost or estimated historical cost if purchased or constructed. Donated capital assets are recorded at the estimated fair market value at the date of donation. The cost of normal maintenance and repairs that do not add to the value of the asset or materially extend asset lives are not capitalized. Major improvements are capitalized and depreciated over the remaining useful lives of the related capital assets. Property, plant and equipment are depreciated using the straight-line method over the following estimated useful lives:
Useful Life Assets (Years) Equipment 3-20 Vehicles
Cars and vans 4 Buses greater than 30 feet 10 Buses greater than 40 feet 20
Computers and software 3 Site improvements 16-30 Buildings 46-50
Capital assets transferred between funds are transferred at their net book value (cost less accumulated depreciation) or net realizable value, if lower, as of the date of the transfer.

Valley Metro Regional Public Transportation Authority Notes to the Financial Statements (Continued) Fiscal Year Ended June 30, 2011
35
i. Transactions Between Funds Activities between funds that are representative of lending/borrowing arrangements outstanding at the end of the fiscal year are reported in the fund financial statements as “due to/from other funds”. See Note 4 for further discussion of the interfund receivables/payables at June 30. Certain transactions occurring between funds that are combined within the same fund type or displayed in the same financial statement column for presentation in these annual financial statements have been eliminated from the financial statements. In the government-wide financial statements, only the net interfund activity and balances between governmental activities and business-type activities are shown (reported as “internal balances”).
j. Receivables Receivables primarily result from various grants awarded by the Federal Transit Administration and the Federal Highway Administration. These receivables are passed through to the Authority and are due from the City of Phoenix, Maricopa Association of Governments, Maricopa County, Pima County and the Arizona Department of Transportation as reimbursement for eligible grant expenditures associated with operating, capital projects and capital maintenance. During the fiscal year ended June 30, 2011, the Authority recorded $1,554,573 as non-operating revenues and receivables of alternative fuel tax credit filed with the Internal Revenue Service (IRS) for fuel purchases. $725,000 is reserved for capital purchases. The federal alternative fuel tax credit went into effect October 1, 2006, as part of the 2005 Transportation Act. Government and certain nonprofit organizations that qualify for the credit but do not have excise tax liability can receive cash payment from the federal government in the amount of $0.50 per gallon-equivalent. This credit applies to CNG, liquefied natural gas(LNG), propane, and several other less frequently used fuels. The Authority registered with the IRS and was approved as a qualifying agency to receive the alternative fuel tax credit.
k. Compensated Absences Employees of the Authority are entitled to 23.6 - 31.5 paid time off days (vacation and sick leave) per calendar year - based on an eight-hour workday, depending upon length of service. The valuation of accrued leave benefits is calculated in accordance with GASB Statement No. 16. Unpaid compensated absences are recorded as a liability when the benefits are earned in the proprietary fund financial statements. For governmental funds, there is no legal requirement to accumulate expendable available financial resources to liquidate the obligation; thus expenditures are recognized in the governmental funds when payments are made to employees. The current portion of the accrued compensated absences liability is based on the average annual amount of leave charged over the preceding three years. Generally, resources from the General Fund are used to liquidate the governmental funds liabilities for compensated absences.

Valley Metro Regional Public Transportation Authority Notes to the Financial Statements (Continued) Fiscal Year Ended June 30, 2011
36
l. Long-term Obligations In the government-wide financial statements and proprietary fund types in the fund financial statements, long-term debt and other long-term obligations are reported as liabilities on the statement of net assets. Bond premiums and discounts, as well as issuance costs and the difference between the reacquisition price and the net carrying amount of the old debt, are deferred and amortized over the life of the bonds using the straight-line method over the term of the related debt. In the fund financial statements, governmental fund types recognize bond premiums and discounts, as well as bond issuance costs, during the current period. The face amount of debt issued is reported as other financing sources. Premiums received on debt issuances are reported as other financing sources while discounts on debt issuances are reported as other financing uses. Issuance costs, whether or not withheld from the actual debt proceeds received, are reported as debt service expenditures.
m. Net Assets In the government-wide financial statements, net assets are reported in three categories: net assets invested in capital assets, net of related debt; restricted net assets; and unrestricted net assets. Net assets invested in capital assets, net of related debt is separately reported because capital assets make up a significant portion of total net assets. Restricted net assets account for the portion of net assets restricted by parties outside the Authority. Unrestricted net assets are the remaining net assets not included in the previous two categories.
n. Fund Balances Fund balances of the governmental funds are reported separately within classifications based on a hierarchy of the constraints placed on the use of those resources. The classifications are based on the relative strength of the constraints that control how the specific amounts can be spent. The classifications are nonspendable and spendable fund balances. Spendable fund balances include restricted, committed, assigned and unassigned fund balance classifications. The nonspendable fund balance classification includes amounts that cannot be spent because they are either not in spendable form or are legally or contractually required to be maintained intact.

Valley Metro Regional Public Transportation Authority Notes to the Financial Statements (Continued) Fiscal Year Ended June 30, 2011
37
Restricted fund balances are those that have externally imposed restrictions on their usage by creditors (such as through debt covenants), grantors, contributors, or laws and regulations. The committed fund balances are self-imposed limitations approved by the Authority’s Board of Directors, which is the highest level of decision-making authority within the Authority. Only RPTA’s Board of Directors can remove or change the constraints placed on committed fund balances. The Board of Directors must commit fund balances before the end of the fiscal year. Assigned fund balances are resources constrained by the Authority’s intent to be used for specific purposes, but are neither restricted nor committed. The Board of Directors has authorized the Executive Director or designee to make assignments of resources for a specific purpose. The unassigned fund balance is the residual classification for the General Fund and includes all spendable amounts not reported in the other classifications. Also, deficits in fund balances of the other governmental funds are reported as unassigned. When an expenditure is incurred, it is the Authority’s policy to use restricted fund balance first, then committed, assigned and unassigned fund balances as resources are available.
o. Cash Equivalents The Authority considers short-term investments in the State of Arizona’s Local Government Investment Pool, mutual fund-money market, U.S. Treasury bills and notes with maturities of three months or less at acquisition date to be cash equivalents.
p. Use of Estimates The preparation of financial statements in conformity with accounting principles generally accepted in the United States of America necessarily requires management to make estimates and assumptions that affect the reported amounts of assets and liabilities, disclosure of contingent assets and liabilities at the date of the financial statements and the reported amounts of revenue and expenditures during the reporting financial period. Actual results could differ from these estimates.
q. Accounting Pronouncements GASB Statement No. 54, Fund Balance Reporting and Governmental Fund Type Definitions, has been implemented by the Board of Directors for the current fiscal year. GASB Statement No. 2, Accounting and Financial Reporting for Proprietary Funds and Other Governmental Entities That Use Proprietary Fund Accounting, as amended, requires that governments’ enterprise activities apply all applicable GASB pronouncements as well as the following pronouncements issued on or before November 20, 1989, unless those pronouncements conflict with or contradict GASB pronouncements: Financial Accounting Standards Board (FASB) Statements and Interpretations, Accounting Principles Board Opinions and Accounting Research Bulletins. Governments are given the option whether or onto to apply all FASB Statements and Interpretations issued after November 30, 1989, except those that conflict with or contradict GASB pronouncements. The Authority has elected not to implement FASB Statements and Interpretations issued after November 33, 1989.

Valley Metro Regional Public Transportation Authority Notes to the Financial Statements (Continued) Fiscal Year Ended June 30, 2011
38
2. Reconciliation of Governmental Fund Financial Statements to Government-Wide Statements The governmental fund financial statements are presented on a current financial resources measurement focus and modified accrual accounting basis while the government-wide financial statements are prepared on a long-term economic resources measurement focus and accrual accounting basis. Reconciliations briefly explaining the adjustments necessary to transform the fund financial statements into the governmental activities column of the government-wide financial statements immediately follow each fund financial statement. Additional reconciliations are provided below. Reconciliation of Governmental Funds Balance Sheet and the government-wide Statement of Net Assets:
ReclassificationsTotal Long-term for Internal Statement of
Governmental Assets/ Balances and Net AssetsFunds Liabilities Eliminations Totals
AssetsCash and cash equivalents 34,574,298$ -$ -$ 34,574,298$ Due from other governments 10,006,801 - - 10,006,801 Due from other funds 9,251,963 - (9,251,963) - Internal balances - - 8,643,989 8,643,989 Prepaid items 10,169 - - 10,169 Capital assets (net) - 1,346,607 - 1,346,607
Total assets 53,843,231$ 1,346,607$ (607,974)$ 54,581,864$
LiabilitiesAccounts payable 276,041$ -$ -$ 276,041$ Accrued salaries and benefits 579,191 - - 579,191 Due to other funds 607,974 - (607,974) - Due to other governments 30,198 - - 30,198 Other liabilities - - - - Compensated absences - 848,261 - 848,261
Total liabilities 1,493,404 848,261 (607,974) 1,733,691
Fund Balance/Net AssetsTotal fund balance/net assets 52,349,827$ 498,346$ -$ 52,848,173$
When capital assets that are to be used in governmental activities are purchased, the costs of those assets are reported as expenditures in governmental funds, and thus a reduction in fund balance. However, the statement of net assets includes those capital assets among the assets of the Authority as a whole:
Cost of capital assets 4,041,918$ Accumulated depreciation (2,695,311) Capital assets, net 1,346,607$
Interfund transactions between governmental activities of $607,974 are eliminated in the consolidation of these activities for the statement of net assets.

Valley Metro Regional Public Transportation Authority Notes to the Financial Statements (Continued) Fiscal Year Ended June 30, 2011
39
Under the modified accrual basis of accounting, the governmental funds do not accrue for unpaid compensated absences in the amount of $848,261 as a liability, as they are not paid with expendable available financial resources. However, the statement of net assets includes the unpaid compensated absences as long-term liabilities regardless of when financial resources are used, and thus a reduction in net assets. Reconciliation of Governmental Funds Statement of Revenues, Expenditures and Changes in Fund Balances and the Government-wide Statement of Activities:
Total Statement ofGovernmental Capital Depreciation Compensated Activities
Funds Purchases and Disposals Absences TotalsRevenuesSales taxes 107,111,118$ -$ -$ -$ 107,111,118$ Intergovernmental 2,286,930 - - - 2,286,930 Interest earnings 79,874 - - - 79,874 Charges for services 189,000 - - - 189,000 Miscellaneous 233,357 - - - 233,357
Total revenues 109,900,279 - - - 109,900,279
Expenditures/ExpensesCurrent:
Regional planning 2,274,688 - - - 2,274,688 Transportation demand management 1,542,437 - - - 1,542,437 Regional customer services 7,850,922 - 141,557 - 7,992,479 Administration 1,643,778 - 312,179 10,381 1,966,338 Capital outlay 1,113,456 (1,114,343) 3,786 - 2,899 Total expenditures/expenses and other uses 14,425,281 (1,114,343) 457,522 10,381 13,778,841
Other financing uses/changes in net assetsTransfers in 1,447,579 - - - 1,447,579 Transfers out (90,697,745) - - - (90,697,745)
Net transfers (89,250,166) - - - (89,250,166)
Net change for the year 6,224,832$ 1,114,343$ (457,522)$ (10,381)$ 6,871,272$
When capital assets that are to be used in governmental activities are purchased, the resources expended for those assets are reported as expenditures in governmental funds. However, in the statement of activities, the cost of those assets is allocated over their useful lives and reported as depreciation expense. As a result, fund balance decreases by the amount of the financial resources expended for capital outlay ($1,114,343), whereas net assets decrease by the amounts of disposals and depreciation expense charged for the year ($457,522). The governmental funds do not report the change in unpaid compensated absences in the amount of $10,381 as expenditures, as they are not paid with expendable available financial resources. However, the statement of net assets includes the change in unpaid compensated absences as accrued expenses regardless of when financial resources are used, and thus a reduction in net assets.

Valley Metro Regional Public Transportation Authority Notes to the Financial Statements (Continued) Fiscal Year Ended June 30, 2011
40
3. Deposits and Investments The Authority maintains a cash and investment pool that is available for use by all funds. Each fund type’s portion of this pool is displayed on the government-wide Statement of Net Assets as “Cash and Investments”. a. Deposits
The carrying amount of the Authority’s deposits at June 30, 2011, was $32,655,888 and the bank ledger balance was $35,463,541. The difference of $2,807,653 represents deposits in transit and outstanding checks. Of the bank balance, $250,000 was covered by federal depository insurance and $35,213,541 was covered by collateral held by the pledging financial institution in the Authority’s name. Cash held with trustee in the amount of $37,049,779 has federal depository insurance coverage in the amount of $250,000 and $36,799,779 was covered by collateral held by the pledging financial institution’s trust department but not in the Authority’s name.
b. Investments Interest Rate Risk. As a means of managing its exposure to fair value losses arising from increasing interest rates, the Authority’s investment policy provides for matching investment maturities with anticipated cash flow requirements while maintaining an emphasis on liquidity. Unless matched to a specific cash flow requirement, the Authority will not directly invest in securities maturing more than two years from the date of purchase. Historically, the Authority has limited its investments to participation in the State of Arizona’s Local Government Investment Pool (LGIP). As of June 30, 2011, the Authority’s investments in the LGIP, investing in money market mutual funds, have the weighted average maturities less than 90 days. Credit Risk. State statutes authorize the Authority to invest in obligations of the U.S. Treasury and any of its agencies, corporations or instrumentalities, collateralized repurchase agreements, certificates of deposit and the LGIP. The Authority’s investment policy does not further limit its investment choices. The LGIP is operated by the Arizona State Treasurer’s Office, as authorized by Arizona Revised Statutes §35-326. Arizona Revised Statutes §35-312 and §35-313 regulate authorized investments. The LGIP is overseen according to Arizona State Statute by the State Board of Investment. The Authority’s investment in the LGIP is stated at fair value, which is the same as the value of the Authority’s pool shares. The LGIP does not receive a credit quality rating. Investments, including investments held by trustee, at June 30, 2011 consist of the following:
State of Arizona Local Government Investment Pool 9,234,269$

Valley Metro Regional Public Transportation Authority Notes to the Financial Statements (Continued) Fiscal Year Ended June 30, 2011
41
Governmental Accounting Standards Board Statement No. 40, Deposit and Investment Risk Disclosures, provides for disclosures of custodial credit risk associated with investment securities. An exception is provided for investments in external investment pools and for investments in open-ended mutual funds. Cash and Investments at June 30, 2011 consist of the following:
Carrying amount of the Authority’s deposits 32,655,888$ Investments in the LGIP 9,234,269 Cash and investments with Trustee 37,049,779
Total cash and investments 78,939,936$
Of the $37,049,779 of cash and investments held with Trustee, $32,162,120 represents unspent bond proceeds that will be used in future periods to pay for capital purchases. The remaining $4,887,659 is principal and interest due on the bonds July 1, 2011.
4. Interfund Receivables/Payables and Interfund Transactions Interfund receivables and payables within the governmental activities and business-type activities are eliminated for the government-wide financial statements at June 30, 2011. The following interfund receivables and payables are included in the fund financial statements at June 30, 2011:
GeneralFund Total
Due to other fundsGovernmental funds:
Transit Planning 475,428$ -$ -$ 475,428$ Transportation Demand Management 132,546 - - 132,546
Total governmental funds 607,974 - - 607,974
Enterprise funds:Transit Service Operations 8,643,989 - 4,848,951 13,492,940 Valley Metro Rail - 5,765,381 - 5,765,381
Total enterprise funds 8,643,989 5,765,381 4,848,951 19,258,321 Grand totals 9,251,963$ 5,765,381$ 4,848,951$ 19,866,295$
Due from other funds
Transit Service Operations
FundValley Metro Rail Fund
The interfund balances for the governmental funds at June 30, 2011 are short-term loans to cover temporary cash deficits in various funds. This occasionally occurs prior to grant and other reimbursements.

Valley Metro Regional Public Transportation Authority Notes to the Financial Statements (Continued) Fiscal Year Ended June 30, 2011
42
The interfund balances within the business-type activities funds are amounts held in the Transit Service Operations Fund for debt service payments to be made by the Valley Metro Rail Fund and short-term loans to cover temporary cash deficits in pooled cash accounts. All interfund balances outstanding at June 30, 2011 are expected to be repaid within one year. Interfund transfers are primarily used for transfers of sales tax revenues from the General Fund and the Public Transportation Fund to the various funds that receive earmarked sales tax revenues. Interfund transfers between the enterprise funds are for transfers of bond proceeds for reimbursements of light rail capital expenditures. The following interfund transfers are reflected in the fund financial statements for the year ended June 30, 2011.
GeneralFund Totals
Transfers InGovernmental funds:
Transit Planning 1,434,865$ -$ -$ 1,434,865$ Transportation Demand Management 12,714 - - 12,714
Total governmental funds 1,447,579 - - 1,447,579
Enterprise funds:Transit Service Operations 44,347,633 - 3,624,612 47,972,245 Valley Metro Rail 44,902,533 19,549,889 - 64,452,422
Total enterprise funds 89,250,166 19,549,889 3,624,612 112,424,667 Grand totals 90,697,745$ 19,549,889$ 3,624,612$ 113,872,246$
Transfers Out
Transit Service Operations
FundValley Metro Rail Fund
Net transfers from governmental activities to business-type activities on the government-wide statement of activities to the enterprise funds are in the amount $89,250,166.
5. Fund Balance Reservations and Designations Fund Balance classifications reported in the governmental funds include the following:
GeneralFund Totals
NonspendablePrepaids 6,797$ -$ 3,372$ 10,169$
SpendableRestricted
Transit Planning - 100,206 - 100,206 Transportation Demand Management - - 74,804 74,804
Unassigned 52,164,648 - - 52,164,648 52,171,445$ 100,206$ 78,176$ 52,349,827$
Transportation Demand
Management Fund
Transit Planning Fund

Valley Metro Regional Public Transportation Authority Notes to the Financial Statements (Continued) Fiscal Year Ended June 30, 2011
43
6. Restatement of Fund Balances As a result of the implementation of GASB Statement No.54, the Public Transportation Fund Regional Customer Services Fund and Capital and Other Grants Fund previously reported as Special Revenue Funds, were reclassified to be included as part of the General Fund. The Transit Planning Fund and Transportation Demand Management Fund continue to be reported as Special Revenue Funds due to their fund definitions and restricted funding sources. The following summary is to reconcile beginning Fund Balances to the prior year audited financial statements:
RestatementFund Balances Due to ChangeAs Previously in Accounting Fund Balances
Nonspendable Stated Principle As Restated
Governmental FundsGeneral Fund 4,690,767$ 41,255,033$ 45,945,800$ Public Transportation Fund 41,012,210 (41,012,210) - Transit Planning Fund 100,206 - 100,206 Transportation Demand Management Fund 78,989 - 78,989 Nonmajor Governmental Funds 242,823 (242,823) -
Total Governmental Funds 46,124,995$ -$ 46,124,995$

Valley Metro Regional Public Transportation Authority Notes to the Financial Statements (Continued) Fiscal Year Ended June 30, 2011
44
7. Capital Assets A summary of capital asset activity, for the government-wide financial statements, for the year ended June 30, 2011:
Balances, Balances,July 1, 2010 Increases Decreases June 30, 2011
Governmental activities:Depreciable assets:
Site Improvements -$ 430,572$ -$ 430,572$ Computers & software 2,092,511 240,441 - 2,332,952 Equipment 572,034 311,102 (115,990) 767,146 Vehicles 134,911 - - 134,911 Furniture & fixtures 274,537 132,228 (30,428) 376,337
Total depreciable assets at historical cost 3,073,993 1,114,343 (146,418) 4,041,918
Less accumulated depreciation for:Site Improvements - (46,071) - (46,071) Computers & software (1,754,155) (260,861) - (2,015,016) Equipment (329,314) (90,574) 112,878 (307,010) Vehicles (119,766) (15,148) - (134,914) Furniture & fixtures (180,972) (41,082) 29,754 (192,300)
Total accumulated depreciation (2,384,207) (453,736) 142,632 (2,695,311)
Governmental activities capital assets, net 689,786$ 660,607$ (3,786)$ 1,346,607$
Business-type activities:Non-depreciable assets:
Land 5,292,000$ -$ -$ 5,292,000$ Work in progress 13,467,250 2,557,051 (13,305,160) 2,719,141
Total non-depreciable assets 18,759,250 2,557,051 (13,305,160) 8,011,141
Depreciable assets:Transit fleet 101,829,892 6,864,410 (4,782,677) 103,911,625 Building 13,390,733 - - 13,390,733 Site improvements 7,802,996 243,483 - 8,046,479 Computers & software 325,536 - (54,075) 271,461 Equipment 6,799,462 201,002 - 7,000,464 Furniture & fixtures 127,037 - - 127,037
Total depreciable assets at historical cost 130,275,656 7,308,895 (4,836,752) 132,747,799
Less accumulated depreciation for:Transit fleet (36,345,548) (9,654,854) 4,499,758 (41,500,644) Building (582,206) (291,103) - (873,309) Site improvements (979,783) (456,332) - (1,436,115) Computers & software (113,766) (57,063) - (170,829) Equipment (2,657,992) (729,104) - (3,387,096) Furniture & fixtures (84,647) (20,627) - (105,274)
Total accumulated depreciation (40,763,942) (11,209,083) 4,499,758 (47,473,267)
Business-type activities capital assets, net 108,270,964$ (1,343,137)$ (13,642,154)$ 93,285,673$

Valley Metro Regional Public Transportation Authority Notes to the Financial Statements (Continued) Fiscal Year Ended June 30, 2011
45
Depreciation expense was charged to the following functions in the basic financial statements:
Regional customer services 141,557$ -$ Administration 312,179 - Transit service operations - 11,209,083
Total depreciation expense 453,736$ 11,209,083$
Governmental Activities
Business Type Activities
The Authority’s enterprise funds in the business-type activities have entered into contracts having remaining commitments at June 30, 2011 totaling approximately $1.7 million. These commitments have not been recorded in the accompanying financial statements. Only the currently payable portions of these contracts have been included in the accounts payable in the accompanying financial statements. In the Business-Type Activities, the decrease in construction in progress is greater than total additions, due to the capital conveyance of completed projects to member cities during the fiscal year.
8. Operating Leases The Authority leases office space under three separate lease agreements. Total rent expenditures were $790,120 for the fiscal year ended June 30, 2011. The future minimum lease payments under noncancelable operating lease at June 30, 2011 were as follows:
101 N 1st Ave 4600 E Washington St Phoenix, AZ Phoenix, AZ
June 302012 552,593$ 391,208$ 2013 566,071 391,208 2014 579,549 457,785 2015 593,027 524,362 2016 606,505 535,487
2017-21 2,843,445 2022-26 2,474,314
Total 2,897,745$ 7,617,809$

Valley Metro Regional Public Transportation Authority Notes to the Financial Statements (Continued) Fiscal Year Ended June 30, 2011
46
9. Long-Term Liabilities a. Transportation Excise Tax Revenue Bonds
In May 2009, the Board adopted the issuance of transportation revenue bonds, which are specifically for the purpose of payment or reimbursement of the costs of capital projects expenditures in the regional transportation plan. These bonds are payable solely from the revenues received by the Authority from the transportation excise tax revenues collected by the Arizona Department of Revenue. The bonds were issued on June 30, 2009 in two series. Series 2009A consisted of $73,795,000 transportation excise tax revenue bonds – tax exempt bonds and Series 2009B consisted of $26,280,000 transportation excise tax revenue bonds – federally taxable Build America Bonds. Annual installments of $2,265,000 to $9,260,000 will be made through 2026; interest ranges from 3.25 to 6.46 percent. The Authority has pledged future transportation excise tax revenues to repay a total of $100,075,000 in outstanding transportation revenue bonds. Proceeds of the bonds were used for improvements and expansions to the Authority’s bus and light rail projects. The bonds are payable solely from excise tax revenues and are payable through July 1, 2026. For the fiscal year ended June 30, 2011, the revenues available for service of this debt were $102,688,559 while interest paid on the debt was $5,245,318. Principal payment date is July 1. Interest payment dates are January 1 and July 1. Transportation Excise Revenue Bonds annual debt service requirements at June 30, 2011 were as follows:
Year EndingJune 30 Principal Interest Total
2012 2,265,000$ 5,200,018$ 7,465,018$ 2013 5,085,000 5,053,018 10,138,018 2014 5,290,000 4,819,068 10,109,068 2015 5,555,000 4,547,943 10,102,943 2016 5,835,000 4,282,006 10,117,006
2017-2021 33,555,000 16,816,940 50,371,940 2022-2026 42,490,000 6,723,166 49,213,166
Total 100,075,000$ 47,442,159$ 147,517,159$
Amortization of Costs of Issuance and Premium
Year EndingJune 30 Issuance Costs
Premium Amortization
2012 60,392$ 414,495$ 2013 60,392 414,495 2014 60,392 414,495 2015 60,392 414,495 2016 60,393 414,495
2017-2021 301,962 2,072,476 2022-2026 152,552 828,990
Total 756,475$ 4,973,941$
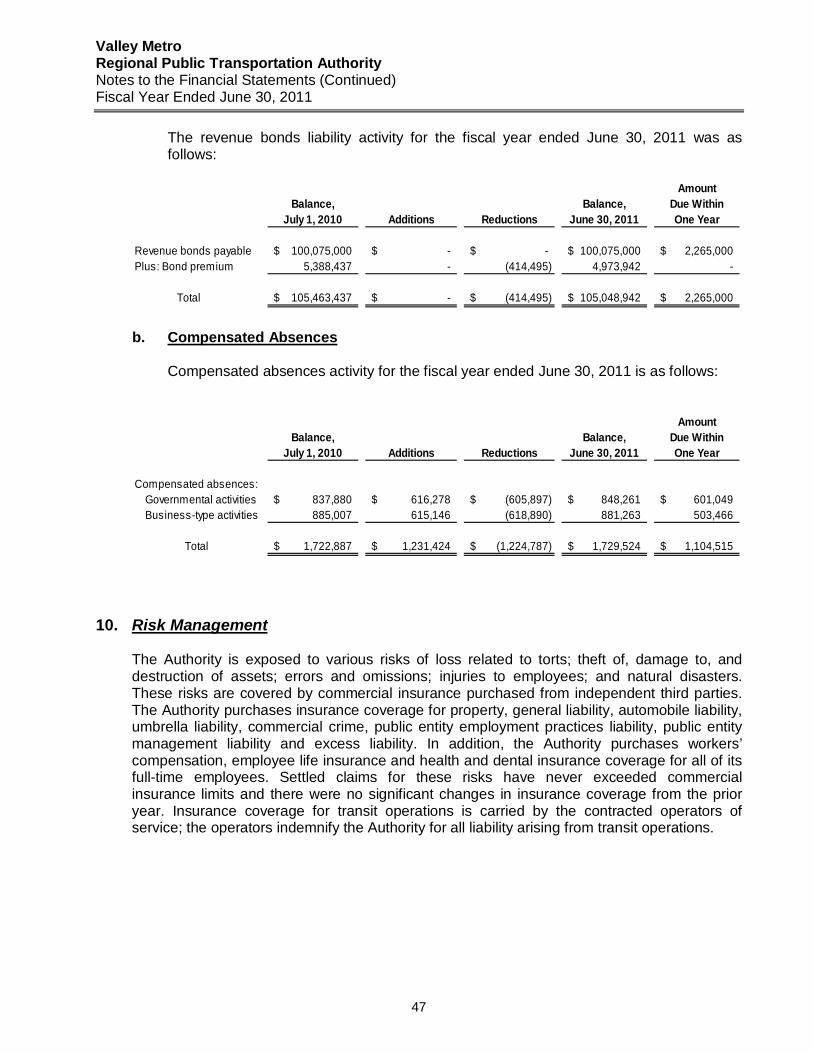
Valley Metro Regional Public Transportation Authority Notes to the Financial Statements (Continued) Fiscal Year Ended June 30, 2011
47
The revenue bonds liability activity for the fiscal year ended June 30, 2011 was as follows:
AmountBalance, Balance, Due Within
July 1, 2010 Additions Reductions June 30, 2011 One Year
Revenue bonds payable 100,075,000$ -$ -$ 100,075,000$ 2,265,000$ Plus: Bond premium 5,388,437 - (414,495) 4,973,942 -
Total 105,463,437$ -$ (414,495)$ 105,048,942$ 2,265,000$
b. Compensated Absences
Compensated absences activity for the fiscal year ended June 30, 2011 is as follows:
AmountBalance, Balance, Due Within
July 1, 2010 Additions Reductions June 30, 2011 One Year
Compensated absences:Governmental activities 837,880$ 616,278$ (605,897)$ 848,261$ 601,049$ Business-type activities 885,007 615,146 (618,890) 881,263 503,466
Total 1,722,887$ 1,231,424$ (1,224,787)$ 1,729,524$ 1,104,515$
10. Risk Management The Authority is exposed to various risks of loss related to torts; theft of, damage to, and destruction of assets; errors and omissions; injuries to employees; and natural disasters. These risks are covered by commercial insurance purchased from independent third parties. The Authority purchases insurance coverage for property, general liability, automobile liability, umbrella liability, commercial crime, public entity employment practices liability, public entity management liability and excess liability. In addition, the Authority purchases workers’ compensation, employee life insurance and health and dental insurance coverage for all of its full-time employees. Settled claims for these risks have never exceeded commercial insurance limits and there were no significant changes in insurance coverage from the prior year. Insurance coverage for transit operations is carried by the contracted operators of service; the operators indemnify the Authority for all liability arising from transit operations.

Valley Metro Regional Public Transportation Authority Notes to the Financial Statements (Continued) Fiscal Year Ended June 30, 2011
48
11. Retirement and Pension Plans
a. Plan descriptions The Authority contributes to a cost-sharing, multiple-employer defined benefit pension plan; a cost-sharing multiple employer defined benefit health care plan; and a cost-sharing, multiple-employer defined benefit long-term disability plan, all of which are administered by the Arizona State Retirement System (ASRS). The ASRS (through its Retirement Fund) provides retirement (i.e., pension), death and survivor benefits; the Health Benefit Supplement Fund provides health insurance premium benefits (i.e., a monthly subsidy); and the Long-Term Disability Fund provides long-term disability benefits. Benefits are established by state statute. The System is governed by the Arizona State Retirement System Board according to the provisions of A.R.S. Title 38, Chapter 5, Article 2. The System issues a comprehensive annual financial report that includes financial statements and required supplementary information. The most recent report may be obtained by writing the System, 3300 North Central Avenue, P.O. Box 33910, Phoenix, Arizona 85067-3910 or by calling (602) 240-2000 or (800) 621-3778.
b. Funding policy The Arizona State Legislature establishes and may amend active plan members’ and the Authority’s contribution rates. For the current fiscal year, active ASRS members were required by statute to contribute at the actuarially determined rate of 9.85 percent (9.60 percent for retirement and 0.25 percent for long-term disability) of the members’ annual covered payroll and the Authority was required by statute to contribute at the actuarially determined rate of 9.85 percent (9.01 percent for retirement, 0.59 percent for health insurance premium, and 0.25 percent for long-term disability) of the members’ annual covered payroll. The Authority’s contributions for the current and two preceding years, all of which were equal to the required contributions, were as follows.
Health BenefitRetirement Supplement Long-Term
Fund Fund Disability FundYear ending June 30:
2011 1,104,744$ 72,342$ 30,653$ 2010 1,053,332 83,357 50,520 2009 1,071,324 84,781 51,382
Valley Metro Regional Public Transportation Authority Notes to the Financial Statements (Continued) Fiscal Year Ended June 30, 2011
49
12. Contractual and Other Commitments
a. Underground Storage Tank Revolving Fund Replenishment In fiscal year 1994, the Arizona State Legislature allocated $6,000,000 to the Authority from the Arizona Area A portion of the underground storage tank revolving fund. Beginning with the first fiscal year and in each subsequent fiscal year that the Authority is allocated at least $2,000,000 from the Lottery, the amount allocated to the Authority will be reduced by a maximum of $2,000,000 each fiscal year until a total of $6,000,000 has been withheld to replenish the underground storage tank revolving fund. In the event the Authority does not receive at least $2,000,000 from the Lottery in a given year, no amounts will be withheld from the respective year’s allocation. The Authority received a Lottery distribution of $1,760,759 in fiscal year 1998 which is the only year the Authority has received a Lottery distribution.
b. Commitments The Authority has entered into various contracts for the administration and operation of transit services, travel demand management services, and regional transit planning. Commitments under these contracts exist only to the extent that services are requested or provided, and all contracts provide for cancellation without cause. In addition, the Authority has entered into various contractual agreements to reimburse member cities for bus stop improvements, the Scottsdale Loop 101 Park-and-Ride, the Surprise Park-and-Ride, the Buckeye Park-and-Ride, and ADA reimbursement contracts. At June 30, 2011, the Authority had outstanding contractual commitments for these services aggregating approximately $7.6 million. These commitments have not been recorded in the accompanying financial statements because the member cities either had not incurred the related expenses or had not requested reimbursement for the related expenses. Only the currently payable portions of these contracts have been included in accounts payable in the accompanying financial statements.
13. Contingencies
As a sub-recipient of federal and state grant monies, amounts passed through or receivable from other agencies are subject to audit and adjustment by grantor agencies. Any disallowed claims, including amounts already collected, may constitute a liability of the applicable funds. The amount, if any, of expenditures which may be disallowed by the grantor cannot be determined at this time although the Authority expects such amounts, if any, to be immaterial.
Valley Metro Regional Public Transportation Authority Notes to the Financial Statements (Concluded) Fiscal Year Ended June 30, 2011
50
14. Related Party Transactions As mentioned in Note 1 (a), the members of VMR’s Board of Directors are also members of the sixteen-member Authority’s Board of Directors. VMR contracts with the Authority for certain administrative functions, including personnel, administration, financial and accounting services, purchasing and computer support services. All VMR staff is hired and employed by the Authority but work solely under the direction of the VMR and its Board of Directors, through a contractual agreement with the Authority. For the period ended June 30, 2011, VMR paid $8,201,600 for services provided by the Authority. At June 30, 2011, the Authority reported $893,459 receivable from VMR and $1,686,105 payable to VMR. Additionally, during the fiscal year, RPTA entered into a lease arrangement with Valley Metro Rail to use a portion of their office space.
15. Excess of Expenditures over Appropriations For the fiscal year ended June 30, 2011, the Public Transportation Fund incurred $120 of bank charges that were not budgeted.
16. Subsequent Events
In February, 2012, the Board of Directors approved a contract award to Total Transit, Inc. for the provision of paratransit services for the East valley communities. This new contract changes the current service delivery model (traditional dial-a-ride service utilizing 12-14 passenger accessible mini-buses) to a brokerage model in which multiple providers would use a mixed-fleet of vehicles including wheelchair-accessible vans and taxi service based on customer need. This new contract and change in the model of delivering service will save the agency approximately $3.0 million annually.
On February 16, 2012, the governing boards of the Regional Public Transportation Authority and Valley Metro Rail, Inc. each voted unanimously to offer Steve Banta a five-year contract as the single Chief Executive Officer over both agencies. The vote capped a year-long effort involving many meetings among members of both transit boards. This contract becomes effective March 1, 2012.

Other Supplementary Information

Valley Metro Regional Public Transportation Authority Schedule of Revenues, Expenses and Changes in Net Assets – Budget to Actual Transit Service Operations Fund Fiscal Year Ended June 30, 2011
51
Actual Variance with
Amounts Final Budget(budgetary Over
Original Final basis) (Under)Operating Revenues:
Charges for services 22,019,205$ 17,063,098$ 15,173,161$ (1,889,937)$ Miscellaneous - 493,243 560,643 67,400$
Total operating revenues 22,019,205 17,556,341 15,733,804 (1,822,537)
Operating Expenses:Local & express bus service 49,419,879 43,751,217 42,912,290 (838,927) Paratransit service 11,247,761 11,442,209 10,634,693 (807,516) Vanpool service 893,000 812,045 1,394,994 582,949 Safety and security 689,145 967,062 179,439 (787,623) Administrative and general 33,776 33,776 33,512 (264) Contingency 3,137,171 1,044,423 - (1,044,423) Capital outlay 42,882,340 9,948,100 4,414,571 (5,533,529)
Total operating expenses 108,303,072 67,998,832 59,569,499 (8,429,333) Operating income (loss) (86,283,867) (50,442,491) (43,835,695) 10,251,870
Non-Operating Revenues (Expenses):Lead agency disbursements (27,029,093) (12,080,847) (11,612,532) 468,315 Federal Transit Administration grants 47,954,008 11,631,709 7,667,042 (3,964,667) Other federal grants - - 622,287 622,287 Capital Conveyance - - (7,554,419) (7,554,419) IRS fuel tax credit - 750,000 1,554,573 804,573 Interest income - - 188,748 188,748 Interest subsidy - - 589,923 589,923 Interest expense - - (4,830,824) (4,830,824) Bond issuance expense - - (60,392) (60,392)
Total nonoperating revenues (expenses) 20,924,915 600,862 (13,435,594) (14,036,456) Income (loss) before transfers (65,358,952) (49,841,629) (57,271,289) (3,784,586)
Transfers in 43,294,954 44,756,812 47,972,245 3,215,433 Transfers out (14,405,640) (5,152,183) (19,549,889) (14,397,706)
Change in net assetsbudgetary basis (36,469,638)$ (10,237,000)$ (28,848,933)$ (14,966,859)$
Explanation of differences between budgetary basis and GAAP basisExcess revenues over expenses - budgetary basis (28,848,933)$ Capital outlay is an expense for budgetary purposes, but assets are capitalized and are not an expense for GAAP purposes 4,414,571 Depreciation is not a budgeted expense, but is an expense for GAAP purposes (11,209,083) The loss on disposal of capital assets is not a budgeted revenue, but is a revenue for GAAP purposes 85,359 Changes in net assets per the statement of revenues, expenses and changes in fund net assets (35,558,086)$
Budgeted Amounts

Valley Metro Regional Public Transportation Authority Schedule of Revenues, Expenses and Changes in Net Assets – Budget to Actual Valley Metro Rail Fund Fiscal Year Ended June 30, 2011
52
Variance withFinal Budget
Actual OverOriginal Final Amounts (Under)
Operating Revenues:Charges for services 8,874,939$ 8,874,939$ 8,201,600$ (673,339)$
Total operating revenues 8,874,939 8,874,939 8,201,600 (673,339)
Operating Expenses:Light rail staff and administration 8,874,939 8,874,939 8,360,915 (514,024)
Total operating expenses 8,874,939 8,874,939 8,360,915 (514,024) Operating income (loss) - - (159,315) (159,315)
Non-Operating Revenues (Expenses):Lead agency disbursements (58,371,511) (52,237,124) (57,779,270) (5,542,146) Interest income - - 27,052 27,052
Total nonoperating revenues (expenses) (58,371,511) (52,237,124) (57,752,218) (5,515,094)
Income (loss) before transfers (58,371,511) (52,237,124) (57,911,533) (5,355,779)
Transfers in 58,371,511 52,237,124 64,452,422 12,215,298 Transfers out - - (3,624,612) (3,624,612)
Change in net assets - budgetary basis -$ -$ 2,916,277$ 3,234,907$
Budgeted Amounts

(This page intentionally left blank)

Statistical Section The Statistical Section includes selected financial and demographic information regarding the Authority.


53
Statistical Section
The Statistical Section presents detailed information as a context for understanding what the information in the financial statements, note disclosures and required supplementary information says about the Authority’s overall financial health. Financial Trends
These schedules contain trend information to help the reader understand how the Authority’s financial performance and well-being have changed over time.
Revenue Capacity These schedules contain information to help the reader assess the Authority’s most significant local revenue source, the sales tax.
Debt Capacity These schedules contain information to help the reader assess the affordability of the Authority’s current levels of outstanding debt, the Authority’s ability to issue additional debt in the future. There is no statute on the Authority’s debt limit on the issuance of bonds. The only limitation is the ability to secure the debts with available excise tax monies.
Demographic and Economic Information These schedules offer demographic and economic indicators to help the reader understand the environment within which the Authority’s financial activities take place.
Operating Information These schedules contain service and infrastructure data to help the reader understand how the information in the Authority’s financial report relates to the services the Authority provides and the activities it performs.
Sources: Unless otherwise noted, the information in these schedules is derived from the comprehensive annual financial reports for the relevant year. The Authority implemented GASB Statement No. 34 in FY 2001-02; schedules presenting government-wide information include information beginning in that year.
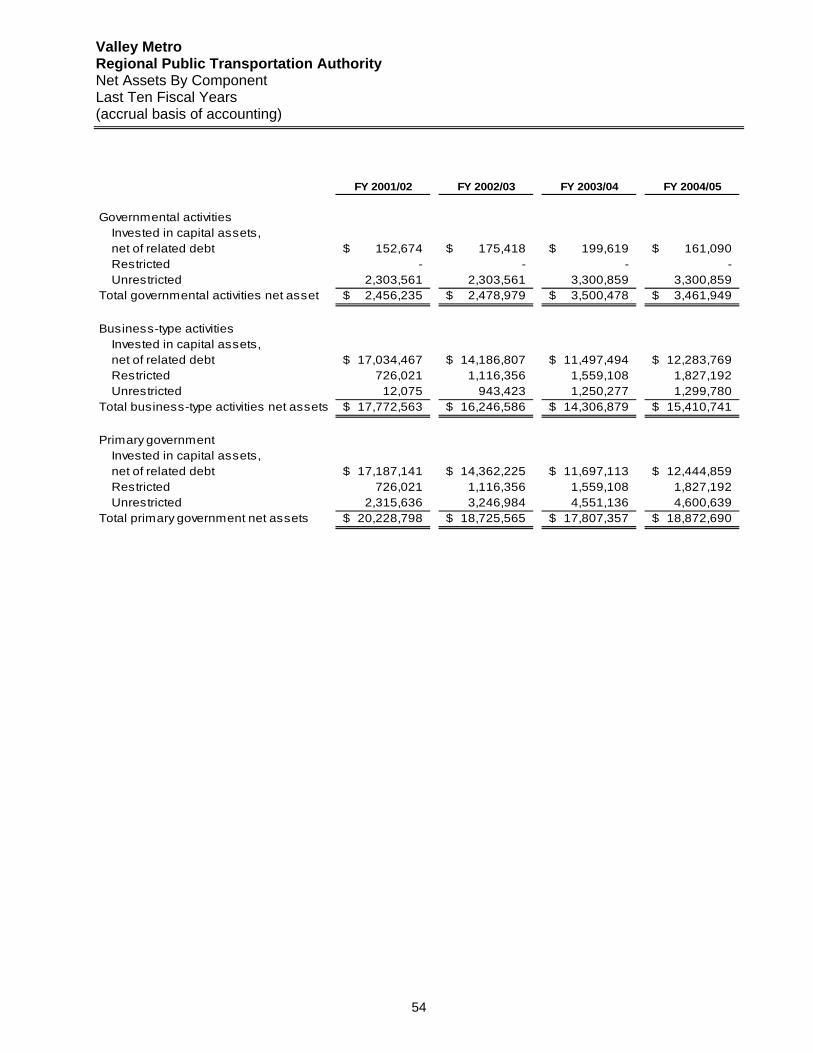
Valley Metro Regional Public Transportation Authority Net Assets By Component Last Ten Fiscal Years (accrual basis of accounting)
54
FY 2001/02 FY 2002/03 FY 2003/04 FY 2004/05
Governmental activitiesInvested in capital assets,net of related debt 152,674$ 175,418$ 199,619$ 161,090$ Restricted - - - - Unrestricted 2,303,561 2,303,561 3,300,859 3,300,859
Total governmental activities net asset 2,456,235$ 2,478,979$ 3,500,478$ 3,461,949$
Business-type activitiesInvested in capital assets,net of related debt 17,034,467$ 14,186,807$ 11,497,494$ 12,283,769$ Restricted 726,021 1,116,356 1,559,108 1,827,192 Unrestricted 12,075 943,423 1,250,277 1,299,780
Total business-type activities net assets 17,772,563$ 16,246,586$ 14,306,879$ 15,410,741$
Primary governmentInvested in capital assets,net of related debt 17,187,141$ 14,362,225$ 11,697,113$ 12,444,859$ Restricted 726,021 1,116,356 1,559,108 1,827,192 Unrestricted 2,315,636 3,246,984 4,551,136 4,600,639
Total primary government net assets 20,228,798$ 18,725,565$ 17,807,357$ 18,872,690$

55
FY 2005/06 FY 2006/07 FY 2007/08 FY 2008/09 FY 2009/10 FY 2010/11
249,177$ 1,362,413$ 1,467,040$ 1,229,916$ 689,786$ 1,346,607$ - - - - - 178,382
12,224,193 42,677,444 28,106,773 37,265,160 45,287,115 51,323,184 12,473,370$ 44,039,857$ 29,573,813$ 38,495,076$ 45,976,901$ 52,848,173$
27,042,048$ 47,945,807$ 72,537,461$ 98,580,060$ 106,601,704$ 21,322,728 5,301,289 1,778,889 2,332,524 4,062,157 - -
17,159,298 21,142,003 17,991,644 (9,329,497) (36,226,944) 16,410,223 49,502,635$ 70,866,699$ 92,861,629$ 93,312,720$ 70,374,760$ 37,732,951$
27,291,225$ 49,308,220$ 74,004,501$ 99,809,976$ 107,291,490$ 22,669,335$ 5,301,289 1,778,889 2,332,524 4,062,157 - 178,382
29,383,491 63,819,447 46,098,417 27,935,663 9,060,171 67,733,407 61,976,005$ 114,906,556$ 122,435,442$ 131,807,796$ 116,351,661$ 90,581,124$

Valley Metro Regional Public Transportation Authority Changes in Net Assets Last Ten Fiscal Years (accrual basis of accounting)
56
FY 2001/02 FY 2002/03 FY 2003/04 FY 2004/05ExpensesGovernmental activities:
Regional planning:Long range 212,391$ 367,279$ 167,057$ 162,287$ Short range 256,925 274,302 242,945 145,690 Capital 307,518 118,161 163,818 236,219 Program support 29,746 43,722 53,199 171,169
Transportation demand management:Trip reduction 853,216 820,699 784,056 931,196 Ridesharing 608,955 589,798 656,311 514,977 Other programs 497,885 294,016 267,869 486,102
Regional customer services:Marketing - - - - Call center - - - - Other programs - - - -
Administration:Executive director’s office 262,172 226,215 238,134 400,777 Communications & government relations 162,556 207,283 247,948 161,979 Finance & management services 87,255 91,684 106,305 293,648
Community funded transportation 1,000,000 51,652 51,652 51,652 Capital outlay 134,200 94,589 90,972 180,099
Total governmental activities expenses 4,412,819 3,179,400 3,070,266 3,735,795
Business-type activities:Transit service operations 28,475,928 30,011,849 30,650,723 34,834,292 Regional customer services 5,010,019 4,229,972 4,710,645 5,123,118 Light rail transit 16,765,586 5,033,179 2,982,701 3,667,400
Total business-type activities expenses 50,251,533 39,275,000 38,344,069 43,624,810
Total primary government expenses 54,664,352$ 42,454,400$ 41,414,335$ 47,360,605$

57
FY 2005/06 FY 2006/07 FY 2007/08 FY 2008/09 FY 2009/10 FY 2010/11
187,496$ 403,337$ 316,147$ 292,509$ 308,339$ 101,121$ 322,430 558,664 735,888 317,886 358,149 1,063,291 197,256 164,722 224,767 154,523 106,185 113,073 534,285 1,298,591 1,113,474 1,183,750 1,049,353 997,203
865,290 719,854 819,553 897,234 1,052,649 909,742 645,052 594,549 592,460 561,620 504,614 590,062 326,903 385,257 373,833 424,091 250,976 42,633
- 2,578,094 3,110,366 2,810,408 2,585,192 2,201,863 - 3,087,948 3,599,018 3,807,893 3,896,440 3,833,319 - 1,623,744 1,857,934 2,129,063 2,015,543 1,960,196
514,158 1,712,451 1,033,066 1,111,340 1,128,667 1,284,141 207,304 - - - - - 549,635 260,965 908,275 799,503 750,461 682,197
- 715,001 - - - - - - - - - -
4,349,809 14,103,177 14,684,781 14,489,820 14,006,568 13,778,841
38,578,007 60,090,164 96,796,902 99,625,805 93,074,466 90,336,819 5,767,760 - - - - -
16,909,968 63,225,727 65,243,366 70,492,629 60,704,307 66,140,185 61,255,735 123,315,891 162,040,268 170,118,434 153,778,773 156,477,004
65,605,544$ 137,419,068$ 176,725,049$ 184,608,254$ 167,785,341$ 170,255,845$
(Continued)

Valley Metro Regional Public Transportation Authority Changes in Net Assets (Continued) Last Ten Fiscal Years (accrual basis of accounting)
58
FY 2001/02 FY 2002/03 FY 2003/04 FY 2004/05
Program revenuesGovernmental activities:
Charges for services -$ 3,370$ 32,501$ 49,642$ Operating grants and contributions 2,486,448 2,259,396 1,949,879 2,288,916 Capital grants and contributions 122,392 94,488 92,140 172,438
Total governmental activities program revenues 2,608,840 2,357,254 2,074,520 2,510,996
Business-type activities:Charges for services
Transit service operations:Local & express bus service 11,474,892 14,423,963 15,487,044 18,135,892 Paratransit service 4,603,962 4,623,029 4,640,901 5,344,925 Vanpool service 319,875 594,796 534,764 526,891 Other activities 53,288 56,957 70,001 49,550
Regional customer services 4,683,109 3,997,064 4,378,852 4,962,128 Light rail transit 5,323,908 2,569,035 2,982,701 3,667,400
Operating grants and contributions 13,324,905 4,108,637 1,834,067 5,140,813 Capital grants and contributions 5,374,355 609,542 820,223 387,845
Total business-type activities program revenues 45,158,294 30,983,023 30,748,553 38,215,444 Total primary government program revenues 47,767,134$ 33,340,277$ 32,823,073$ 40,726,440$
Net (Expense)/RevenueGovernmental activities (1,803,979)$ (822,146)$ (995,746)$ (1,224,799)$ Business-type activities (5,093,239) (8,291,977) (7,595,516) (5,409,366)
Total primary government net expense (6,897,218)$ (9,114,123)$ (8,591,262)$ (6,634,165)$
General Revenues and Other Changes in Net Assets
Governmental activities:Sales taxes 1,941,168$ 2,587,302$ 3,071,725$ 1,154,022$ Interest earnings 167,272 64,528 83,977 103,981 Other income - 21,603 966 1,047 Transfers in (out) (789,672) (1,828,543) (1,139,423) -
Total governmental activities 1,318,768 844,890 2,017,245 1,259,050
Business-type activities:Sales taxes 5,400,322 4,914,755 4,516,066 6,559,344 Interest earnings 45,490 22,702 320 2,774 Other income 16,775 - - - Transfers in (out) 789,672 1,828,543 1,139,423 -
Total business-type activities: 6,252,259 6,766,000 5,655,809 6,562,118 Total primary government 7,571,027$ 7,610,890$ 7,673,054$ 7,821,168$
Change in net assets:Governmental activities (485,211)$ 22,744$ 1,021,499$ 34,251$ Business-type activities 1,159,020 (1,525,977) (1,939,707) 1,152,752
Total primary government net expense 673,809$ (1,503,233)$ (918,208)$ 1,187,003$

59
FY 2005/06 FY 2006/07 FY 2007/08 FY 2008/09 FY 2009/10 FY 2010/11
75,295$ 25,046$ -$ -$ 150,353$ 189,000$ 2,358,485 2,494,611 2,062,602 2,632,463 2,055,931 2,286,930
48,382 198,777 - - - -
2,482,162 2,718,434 2,062,602 2,632,463 2,206,284 2,475,930
18,963,733 20,131,861 19,861,844 19,936,194 15,849,887 9,811,268 4,075,963 2,118,843 2,043,104 3,029,151 2,408,268 2,431,467
692,342 685,743 844,115 926,245 864,663 318,945 182,809 36,729 - - - 2,611,481
3,376,143 - - - - - 5,209,939 5,565,540 6,421,524 8,614,280 8,130,261 8,201,600 1,186,038 642,313 1,421,891 2,609,156 2,607,770 2,144,496
17,286,134 19,041,093 16,237,008 40,555,599 14,996,556 8,289,329
50,973,101 48,222,122 46,829,486 75,670,625 44,857,405 33,808,586
53,455,263$ 50,940,556$ 48,892,088$ 78,303,088$ 47,063,689$ 36,284,516$
(1,867,647)$ (11,384,743)$ (12,622,179)$ (11,857,357)$ (11,800,284)$ (11,302,911)$ (10,282,634) (75,093,769) (115,210,782) (94,447,809) (108,921,368) (122,668,418) (12,150,281)$ (86,478,512)$ (127,832,961)$ (106,305,166)$ (120,721,652)$ (133,971,329)$
55,084,706$ 134,235,260$ 130,490,779$ 113,297,696$ 103,722,510$ 107,111,118$ 124,312 1,664,357 2,503,935 36,310 231,398 79,874
- - 142,810 75,176 73,531 233,357 (44,329,950) (92,948,387) (134,981,389) (92,630,562) (84,745,330) (89,250,166) 10,879,068 42,951,230 (1,843,865) 20,778,620 19,282,109 18,174,183
- - - - - - 44,578 945,155 536,116 34,862 587,487 215,800
- 2,564,291 1,688,207 2,233,476 650,591 560,643 44,329,950 92,948,387 134,981,389 92,630,562 84,745,330 89,250,166 44,374,528 96,457,833 137,205,712 94,898,900 85,983,408 90,026,609 55,253,596$ 139,409,063$ 135,361,847$ 115,677,520$ 105,265,517$ 108,200,792$
9,011,421$ 31,566,487$ (14,466,044)$ 8,921,263$ 7,481,825$ 6,871,272$ 34,091,894 21,364,064 21,994,930 451,091 (22,937,960) (32,641,809) 43,103,315$ 52,930,551$ 7,528,886$ 9,372,354$ (15,456,135)$ (25,770,537)$
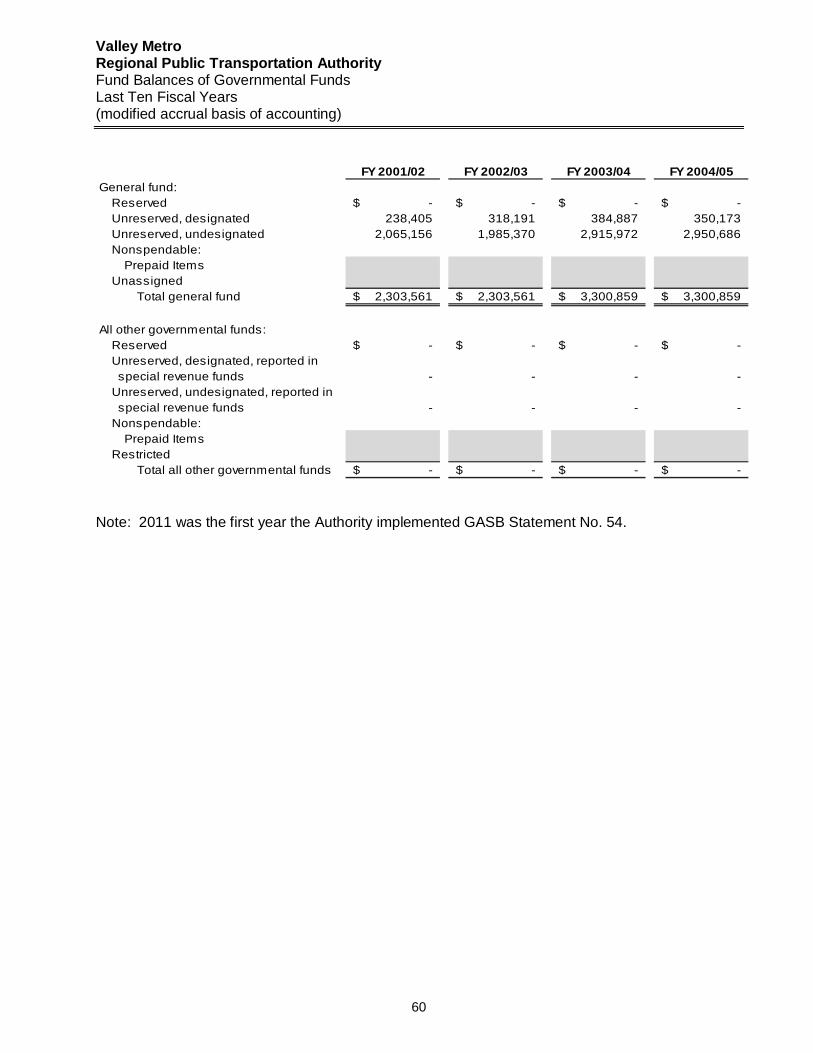
Valley Metro Regional Public Transportation Authority Fund Balances of Governmental Funds Last Ten Fiscal Years (modified accrual basis of accounting)
60
FY 2001/02 FY 2002/03 FY 2003/04 FY 2004/05General fund:
Reserved -$ -$ -$ -$ Unreserved, designated 238,405 318,191 384,887 350,173 Unreserved, undesignated 2,065,156 1,985,370 2,915,972 2,950,686 Nonspendable:
Prepaid ItemsUnassigned
Total general fund 2,303,561$ 2,303,561$ 3,300,859$ 3,300,859$
All other governmental funds:Reserved -$ -$ -$ -$ Unreserved, designated, reported in special revenue funds - - - - Unreserved, undesignated, reported in special revenue funds - - - - Nonspendable:
Prepaid ItemsRestricted
Total all other governmental funds -$ -$ -$ -$ Note: 2011 was the first year the Authority implemented GASB Statement No. 54.

61
FY 2005/06 FY 2006/07 FY 2007/08 FY 2008/09 FY 2009/10 FY 2010/11
-$ -$ -$ -$ -$ 649,225 1,002,229 233,480 755,184 837,880
1,638,892 1,433,788 2,888,105 2,882,500 3,852,887
6,797$ 52,164,648
2,288,117$ 2,436,017$ 3,121,585$ 3,637,684$ 4,690,767$ 52,171,445$
-$ -$ -$ -$ -$
- - - - - - 21,059,001 410,974 - -
9,936,076 19,182,426 25,218,669 34,382,659 41,434,228
3,372$ 175,010
9,936,076$ 40,241,427$ 25,629,643$ 34,382,659$ 41,434,228$ 178,382$
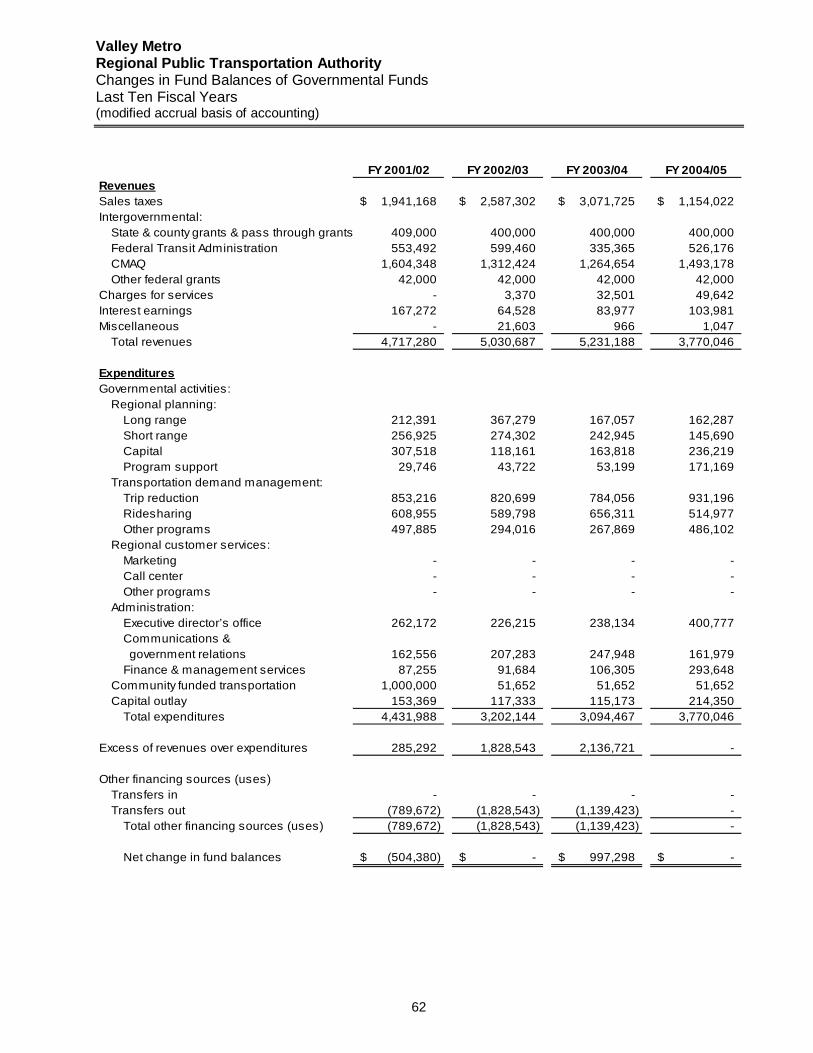
Valley Metro Regional Public Transportation Authority Changes in Fund Balances of Governmental Funds Last Ten Fiscal Years (modified accrual basis of accounting)
62
FY 2001/02 FY 2002/03 FY 2003/04 FY 2004/05RevenuesSales taxes 1,941,168$ 2,587,302$ 3,071,725$ 1,154,022$ Intergovernmental:
State & county grants & pass through grants 409,000 400,000 400,000 400,000 Federal Transit Administration 553,492 599,460 335,365 526,176 CMAQ 1,604,348 1,312,424 1,264,654 1,493,178 Other federal grants 42,000 42,000 42,000 42,000
Charges for services - 3,370 32,501 49,642 Interest earnings 167,272 64,528 83,977 103,981 Miscellaneous - 21,603 966 1,047
Total revenues 4,717,280 5,030,687 5,231,188 3,770,046
ExpendituresGovernmental activities:
Regional planning: Long range 212,391 367,279 167,057 162,287 Short range 256,925 274,302 242,945 145,690 Capital 307,518 118,161 163,818 236,219 Program support 29,746 43,722 53,199 171,169
Transportation demand management:Trip reduction 853,216 820,699 784,056 931,196 Ridesharing 608,955 589,798 656,311 514,977 Other programs 497,885 294,016 267,869 486,102
Regional customer services: Marketing - - - - Call center - - - - Other programs - - - -
Administration: Executive director’s office 262,172 226,215 238,134 400,777 Communications & government relations 162,556 207,283 247,948 161,979 Finance & management services 87,255 91,684 106,305 293,648
Community funded transportation 1,000,000 51,652 51,652 51,652 Capital outlay 153,369 117,333 115,173 214,350
Total expenditures 4,431,988 3,202,144 3,094,467 3,770,046
Excess of revenues over expenditures 285,292 1,828,543 2,136,721 -
Other financing sources (uses) Transfers in - - - - Transfers out (789,672) (1,828,543) (1,139,423) -
Total other financing sources (uses) (789,672) (1,828,543) (1,139,423) -
Net change in fund balances (504,380)$ -$ 997,298$ -$
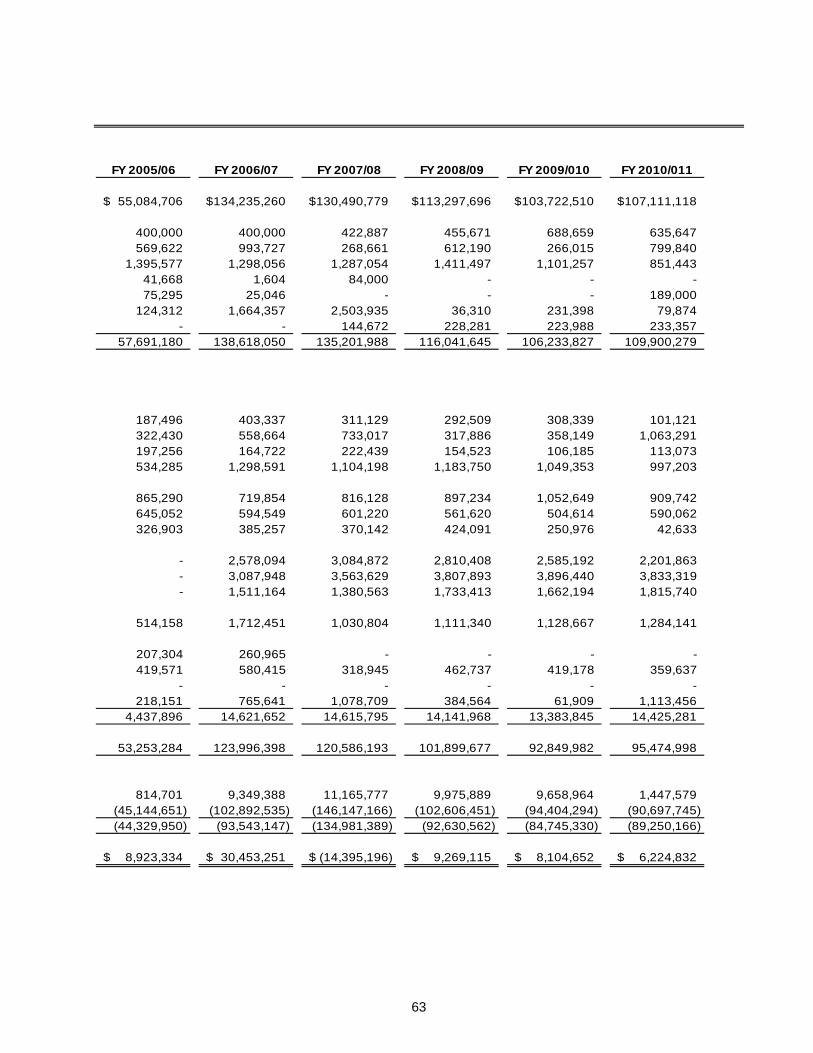
63
FY 2005/06 FY 2006/07 FY 2007/08 FY 2008/09 FY 2009/010 FY 2010/011
55,084,706$ 134,235,260$ 130,490,779$ 113,297,696$ 103,722,510$ 107,111,118$
400,000 400,000 422,887 455,671 688,659 635,647 569,622 993,727 268,661 612,190 266,015 799,840
1,395,577 1,298,056 1,287,054 1,411,497 1,101,257 851,443 41,668 1,604 84,000 - - - 75,295 25,046 - - - 189,000
124,312 1,664,357 2,503,935 36,310 231,398 79,874 - - 144,672 228,281 223,988 233,357
57,691,180 138,618,050 135,201,988 116,041,645 106,233,827 109,900,279
187,496 403,337 311,129 292,509 308,339 101,121 322,430 558,664 733,017 317,886 358,149 1,063,291 197,256 164,722 222,439 154,523 106,185 113,073 534,285 1,298,591 1,104,198 1,183,750 1,049,353 997,203
865,290 719,854 816,128 897,234 1,052,649 909,742 645,052 594,549 601,220 561,620 504,614 590,062 326,903 385,257 370,142 424,091 250,976 42,633
- 2,578,094 3,084,872 2,810,408 2,585,192 2,201,863 - 3,087,948 3,563,629 3,807,893 3,896,440 3,833,319 - 1,511,164 1,380,563 1,733,413 1,662,194 1,815,740
514,158 1,712,451 1,030,804 1,111,340 1,128,667 1,284,141
207,304 260,965 - - - - 419,571 580,415 318,945 462,737 419,178 359,637
- - - - - - 218,151 765,641 1,078,709 384,564 61,909 1,113,456
4,437,896 14,621,652 14,615,795 14,141,968 13,383,845 14,425,281
53,253,284 123,996,398 120,586,193 101,899,677 92,849,982 95,474,998
814,701 9,349,388 11,165,777 9,975,889 9,658,964 1,447,579 (45,144,651) (102,892,535) (146,147,166) (102,606,451) (94,404,294) (90,697,745) (44,329,950) (93,543,147) (134,981,389) (92,630,562) (84,745,330) (89,250,166)
8,923,334$ 30,453,251$ (14,395,196)$ 9,269,115$ 8,104,652$ 6,224,832$

Valley Metro Regional Public Transportation Authority Sales Tax Revenues by Component Last Ten Fiscal Years (accrual basis of accounting)
64
FY 2001/02 FY 2002/03 FY 2003/04 FY 2004/05
Governmental activitiesRegional area road funds 1,941,168$ 2,587,302$ 3,071,725$ 1,154,022$ Public transportation funds - - - -
Total governmental activities sales taxes 1,941,168$ 2,587,302$ 3,071,725$ 1,154,022$
Business-type activitiesRegional area road funds 5,400,322$ 4,914,755$ 4,516,066$ 6,559,344$ Public transportation funds - - - -
Total business-type activities sales taxes 5,400,322$ 4,914,755$ 4,516,066$ 6,559,344$
Primary governmentRegional area road funds 7,341,490$ 7,502,057$ 7,587,791$ 7,713,366$ Public transportation funds - - - -
Total primary government sales taxes 7,341,490$ 7,502,057$ 7,587,791$ 7,713,366$
(1) With the implementation of GASB Statement #34 in FY 2002, activities related to transit service operations, light rail transit and regional customer services were changed from general governmental to proprietary (business-type). Therefore, the functional expenditures listed for FY 2000/01 and earlier include the activities of these functions as part of general governmental, and the activities listed for FY 2001/02 and later exclude these activities from general governmental. As a result, most revenue categories will be greater for FY 2000/01 and prior years and should not be used as comparative data against FY 2001/02 activity and beyond. (2) With the implementation of the Public Transportation sales tax in January 2006, several changes to sales tax distributions were made. The regional area road fund sales tax distribution was reduced to one-half of the amount distributed in prior years. The collections of sales taxes under the new statute are distributed 33.3% to the Authority on a monthly basis. During FY 2005/06, only six months of collections of the Public Transportation sales tax were reported.

65
FY 2005/06 (2) FY 2006/07 (2) FY 2007/08 (2) FY 2008/09 (2) FY 2009/10 (2) FY 2010/11 (2)
3,938,570$ 4,047,593$ 4,167,168$ 4,277,292$ 4,371,192$ 4,422,559$ 51,146,136 130,187,667 126,323,611 109,020,404 99,351,318 102,688,559 55,084,706$ 134,235,260$ 130,490,779$ 113,297,696$ 103,722,510$ 107,111,118$
-$ -$ -$ -$ -$ -$ - - - - - - -$ -$ -$ -$ -$ -$
3,938,570$ 4,047,593$ 4,167,168$ 4,277,292$ 4,371,192$ 4,422,559$ 51,146,136 130,187,667 126,323,611 109,020,404 99,351,318 102,688,559 55,084,706$ 134,235,260$ 130,490,779$ 113,297,696$ 103,722,510$ 107,111,118$

Valley Metro Regional Public Transportation Authority Maricopa County Transportation Excise Tax Revenue Distributions Last Ten Fiscal Years (in thousands)
66
FY 2001/02 FY 2002/03 FY 2003/04 FY 2004/05 FY 2005/06 (2)
Regional area road fundsFreeways 260,222$ 261,219$ 281,012$ 309,092$ 292,487$ Regional Public Transportation Authority / Maricopa Association 7,341 7,502 7,588 7,713 7,877 of Governments (1)Arterial streets - - - - 16,127
Total regional area road fund distributions 267,563 268,721 288,600 316,805 316,491
Public transportation funds - - - - 51,146
Total Maricopa County transportation excise tax revenue distributions 267,563$ 268,721$ 288,600$ 316,805$ 367,637$
Source: The Maricopa County Transportation Excise Tax Year-End Report prepared by the Arizona Department of
Transportation, Financial Management Services, Office of Financial Planning. Note: The Maricopa County Transportation Excise Tax, often referred to as the “1/2 cent sales tax,” is levied upon
business activities in Maricopa County, including retail sales, contracting, utilities, rental of real and personal property, restaurant and bar receipts, and other activities. Under Proposition 300 (passed by the voters in 1985 becoming effective on January 1, 1986), the transportation excise tax revenues are deposited in the Maricopa County Regional Area Road Fund (RARF) which is administered by the Arizona Department of Transportation. The revenues deposited into the RARF account are the principal sources of funding for the Regional Freeway System in Maricopa County and the Regional Public Transportation Authority and are dedicated through December 31, 2005. In November 2004, Maricopa County’s voters approved Proposition 400, Maricopa County Transportation Excise Tax, which became effective on January 1, 2006, and extends the 1/2 cent sales tax for another 20 years through December 31, 2025. The sales tax extension will be used for construction of new freeways, widening of existing freeways and highways, improvements to the arterial street system, regional bus service and high-capacity transit services such as light rail. The collections of the Maricopa County Transportation Excise Tax are as follows: Freeways 56.2%, Public Transportation Fund 33.3%, and Arterial Streets 10.5%.
(1) The Authority received a portion of the RARF excise tax funds for transit costs through December 31, 2005.
On January 1, 2006 these funds are distributed evenly to the Authority and the Maricopa Association of Governments to be used for administrative and planning purposes per Proposition 400. These funds are netted from the Freeway funds.
(2) Distributions are a mix of both Proposition 300 and Proposition 400 collections.

Valley Metro Regional Public Transportation Authority Maricopa County Transportation Excise Tax Revenue Distributions Last Ten Fiscal Years (in thousands)
67
FY 2006/07 (2) FY 2007/08 FY 2008/09 FY 2009/10 FY 2010/11
213,119$ 205,576$ 176,235$ 159,604$ 165,321$
8,095 8,334 8,555 8,742 8,845
41,050 39,832 34,376 31,327 32,379 262,264 253,742 219,166 199,673 206,545
130,188 126,324 109,020 99,351 102,689
392,452$ 380,066$ 328,186$ 299,024$ 309,234$

(This page intentionally left blank)

Valley Metro Regional Public Transportation Authority Maricopa County Transportation Excise Tax Revenue Collections by Category Last Ten Fiscal Years (in thousands)
68
Rental Fiscal Retail Restaurant Rental Real Personal Year Sales Contracting Utilities and Bar Property Property Other Total
2001/02 131,393$ 41,218$ 18,432$ 21,748$ 24,529$ 13,928$ 16,315$ 267,563$ 2002/03 133,922 38,894 18,485 22,646 25,747 12,834 16,193 268,721 2003/04 144,817 43,524 19,980 24,807 27,163 12,631 15,678 288,600 2004/05 158,179 52,325 20,813 27,191 29,310 12,624 16,363 316,805 2005/06 (1) 182,378 64,822 23,600 30,656 32,949 13,923 19,309 367,637 2006/07 (1) 187,817 73,864 26,697 33,073 36,398 15,053 19,550 392,452 2007/08 (1) 177,845 66,046 28,630 33,021 38,605 15,111 20,808 380,066 2008/09 (1) 153,681 46,865 28,510 30,763 37,757 13,470 17,140 328,186 2009/10 (1) 143,205 28,953 29,385 30,558 35,825 11,983 19,115 299,024 2010/11 (1) 152,003 28,012 29,511 31,729 35,731 11,606 20,643 309,235
Source: The Maricopa County Transportation Excise Tax Year-End Report, prepared by the Arizona Department of
Transportation, Financial Management Services, Office of Financial Planning. Note: The Maricopa County Transportation Excise Tax, often referred to as the “1/2 cent sales tax,” is levied upon business
activities in Maricopa County, including retail sales, contracting, utilities, rental of real and personal property, restaurant and bar receipts, and other activities. Under Proposition 300 (passed by the voters in 1985 becoming effective on January 1, 1986), the transportation excise tax revenues are deposited in the Maricopa County Regional Area Road Fund (RARF) which is administered by the Arizona Department of Transportation. The revenues deposited into the RARF account are the principal sources of funding for the Regional Freeway System in Maricopa County and the Regional Public Transportation Authority and are dedicated through December 31, 2005. In November 2004, Maricopa County’s voters approved Proposition 400, Maricopa County Transportation Excise Tax, which became effective on January 1, 2006, and extends the 1/2 cent sales tax for another 20 years through December 31, 2025. The sales tax extension will be used for construction of new freeways, widening of existing freeways and highways, improvements to the arterial street system, regional bus service and high-capacity transit services such as light rail. The collections of the Maricopa County Transportation Excise Tax are as follows: Freeways 56.2%, Public Transportation Fund 33.3%, and Arterial Streets 10.5%.
Note: Information for individual taxpayers is confidential, and state statutes prohibit releasing the information. (1) Fiscal year collections are a mix of both Proposition 300 and Proposition 400 collections. Revenue Category Definitions: Retail Sales Includes retail sales of automobiles, durable goods and other general merchandise, apparel,
building materials, furniture and other tangible personal property. The tax on food was repealed in July 1980.
Contracting Includes prime contracting and dealership of manufactured buildings and owner-builder
operations. Utilities Includes producing and/or furnishing to consumers electricity, natural or artificial gas, and water. Restaurant and Bar Includes operations of restaurants and drinking establishments. Rental of Real Property
Includes leasing or renting real property, hotels and motels.
Rental of Personal Property
Includes leasing or renting tangible personal property such as leased vehicles and construction equipment.
Other Includes intrastate transportation of persons, freight or operations of property, intrastate
telecommunication services, intrastate operation of pipelines for oil or natural or artificial gas, job printing, engraving, embossing and publication, publication of newspapers, magazines and other periodicals, operations of amusement places and miscellaneous other revenues.

Valley Metro Regional Public Transportation Authority Arizona Transaction Privilege Tax Excise Tax Rates by Category Last Ten Fiscal Years
69
FY 2001/02 FY 2002/03 FY 2003/04 FY 2004/05 FY 2005/06
Retail salesPercent of Total Maricopa County Transaction Privilege Tax Collections 49.1100% 49.8400% 50.1800% 49.9300% 49.9300%Transaction Privilege Tax Rate 5.0000% 5.0000% 5.0000% 5.0000% 5.0000%Transportation Excise Tax Rate 0.5000% 0.5000% 0.5000% 0.5000% 0.5000%
ContractingPercent of Total Maricopa County Transaction Privilege Tax Collections 15.4000% 14.4700% 15.0800% 16.5200% 16.5200%Transaction Privilege Tax Rate 5.0000% 5.0000% 5.0000% 5.0000% 5.0000%Transportation Excise Tax Rate 0.5000% 0.5000% 0.5000% 0.5000% 0.5000%
Rental of Real Property (including hotels and motels) (1) Percent of Total Maricopa County Transaction Privilege Tax Collections 9.1700% 9.5800% 9.0500% 9.2500% 9.2500%Transaction Privilege Tax Rate 1.8200% 1.8200% 1.8200% 1.8200% 1.8200%Transportation Excise Tax Rate 0.5120% 0.5120% 0.5120% 0.5120% 0.5120%
Restaurants and BarsPercent of Total Maricopa County Transaction Privilege Tax Collections 8.1300% 8.4300% 8.6000% 8.5800% 8.5800%Transaction Privilege Tax Rate 5.0000% 5.0000% 5.0000% 5.0000% 5.0000%Transportation Excise Tax Rate 0.5000% 0.5000% 0.5000% 0.5000% 0.5000%
UtilitiesPercent of Total Maricopa County Transaction Privilege Tax Collections 6.8900% 6.8800% 6.9200% 6.5700% 6.5700%Transaction Privilege Tax Rate 5.0000% 5.0000% 5.0000% 5.0000% 5.0000%Transportation Excise Tax Rate 0.5000% 0.5000% 0.5000% 0.5000% 0.5000%
Rental of Personal PropertyPercent of Total Maricopa County Transaction Privilege Tax Collections 5.2100% 4.7800% 4.3800% 3.9800% 3.9800%Transaction Privilege Tax Rate 5.0000% 5.0000% 5.0000% 5.0000% 5.0000%Transportation Excise Tax Rate 0.5000% 0.5000% 0.5000% 0.5000% 0.5000%
CommunicationsPercent of Total Maricopa County Transaction Privilege Tax Collections 3.7300% 3.4500% 3.3400% 3.2000% 3.2000%Transaction Privilege Tax Rate 5.0000% 5.0000% 5.0000% 5.0000% 5.0000%Transportation Excise Tax Rate 0.5000% 0.5000% 0.5000% 0.5000% 0.5000%
AmusementsPercent of Total Maricopa County Transaction Privilege Tax Collections 1.1200% 1.1100% 1.0600% 1.0500% 1.0500%Transaction Privilege Tax Rate 5.0000% 5.0000% 5.0000% 5.0000% 5.0000%Transportation Excise Tax Rate 0.5000% 0.5000% 0.5000% 0.5000% 0.5000%
Publishing and PrintingPercent of Total Maricopa County Transaction Privilege Tax Collections 0.7000% 0.7000% 0.6300% 0.6100% 0.6100%Transaction Privilege Tax Rate 5.0000% 5.0000% 5.0000% 5.0000% 5.0000%Transportation Excise Tax Rate 0.5000% 0.5000% 0.5000% 0.5000% 0.5000%
OtherPercent of Total Maricopa County Transaction Privilege Tax Collections 0.5600% 0.7600% 0.7600% 0.3100% 0.3100%Transaction Privilege Tax Rate 5.0000% 5.0000% 5.0000% 5.0000% 5.0000%Transportation Excise Tax Rate 0.5000% 0.5000% 0.5000% 0.5000% 0.5000%
MiningPercent of Total Maricopa County Transaction Privilege Tax Collections 0.0000% 0.0000% 0.0000% 0.0000% 0.0000%Transaction Privilege Tax Rate 3.1250% 3.1250% 3.1250% 3.1250% 3.1250%Transportation Excise Tax Rate 0.3125% 0.3125% 0.3125% 0.3125% 0.3125%
Source: The Maricopa County Transportation Excise Tax Year-End Report for the applicable fiscal year prepared by the
Arizona Department of Transportation, Financial Management Services, Office of Financial Planning. (1) In 1990 and 1993, legislation reduced the transaction privilege tax rate for real property rentals; however, for
transportation excise tax purposes, the rate was retained at its prior level.

70
FY 2006/07 FY 2007/08 FY 2008/09 FY 2009/10 FY 2010/11
47.8600% 46.8000% 46.8300% 46.8300% 49.1600%5.0000% 5.0000% 5.0000% 5.0000% 5.0000%0.5000% 0.5000% 0.5000% 0.5000% 0.5000%
18.8200% 17.4000% 14.2800% 14.2800% 9.0600%5.0000% 5.0000% 5.0000% 5.0000% 5.0000%0.5000% 0.5000% 0.5000% 0.5000% 0.5000%
9.2700% 10.1000% 11.5000% 11.5000% 11.5500%1.8200% 1.8200% 1.8200% 1.8200% 1.8200%0.5120% 0.5120% 0.5120% 0.5120% 0.5120%
8.4300% 8.7000% 9.3700% 9.3700% 10.2600%5.0000% 5.0000% 5.0000% 5.0000% 5.0000%0.5000% 0.5000% 0.5000% 0.5000% 0.5000%
6.8000% 7.5000% 8.6900% 8.6900% 9.5400%5.0000% 5.0000% 5.0000% 5.0000% 5.0000%0.5000% 0.5000% 0.5000% 0.5000% 0.5000%
3.8400% 4.0000% 4.1000% 4.1000% 3.7500%5.0000% 5.0000% 5.0000% 5.0000% 5.0000%0.5000% 0.5000% 0.5000% 0.5000% 0.5000%
2.9300% 3.3000% 2.9900% 2.9900% 3.2700%5.0000% 5.0000% 5.0000% 5.0000% 5.0000%0.5000% 0.5000% 0.5000% 0.5000% 0.5000%
1.0600% 1.1000% 1.1900% 1.1900% 1.1800%5.0000% 5.0000% 5.0000% 5.0000% 5.0000%0.5000% 0.5000% 0.5000% 0.5000% 0.5000%
0.5300% 0.5000% 0.4900% 0.4900% 0.5200%5.0000% 5.0000% 5.0000% 5.0000% 5.0000%0.5000% 0.5000% 0.5000% 0.5000% 0.5000%
0.4600% 0.6000% 0.5600% 0.5600% 1.7100%5.0000% 5.0000% 5.0000% 5.0000% 5.0000%0.5000% 0.5000% 0.5000% 0.5000% 0.5000%
0.0000% 0.0000% 0.0000% 0.0000% 0.0000%3.1250% 3.1250% 3.1250% 3.1250% 3.1250%0.3125% 0.3125% 0.3125% 0.3125% 0.3125%

(This page intentionally left blank)

Valley Metro Regional Public Transportation Authority Transportation Excise Tax Revenue Bonds Bond Coverage Last Three Fiscal Years
71
FiscalYear Principal Interest Total
PledgedRevenue Coverage
2009 -$ -$ -$ 109,020,404$ N/A2010 - 5,259,888 5,259,888 99,351,318 18.89 2011 2,265,000 5,245,318 7,510,318 102,688,559 13.67
Note 1: On June 30, 2009, the Authority raised $100,075,000 on bonds issued secured by its portion of the
Transportation Excise Tax revenues collected by the Arizona Department of Revenue. Note 2: The pledged revenues of the Authority represent future sales taxes to be collected and used to repay the debt
outstanding.
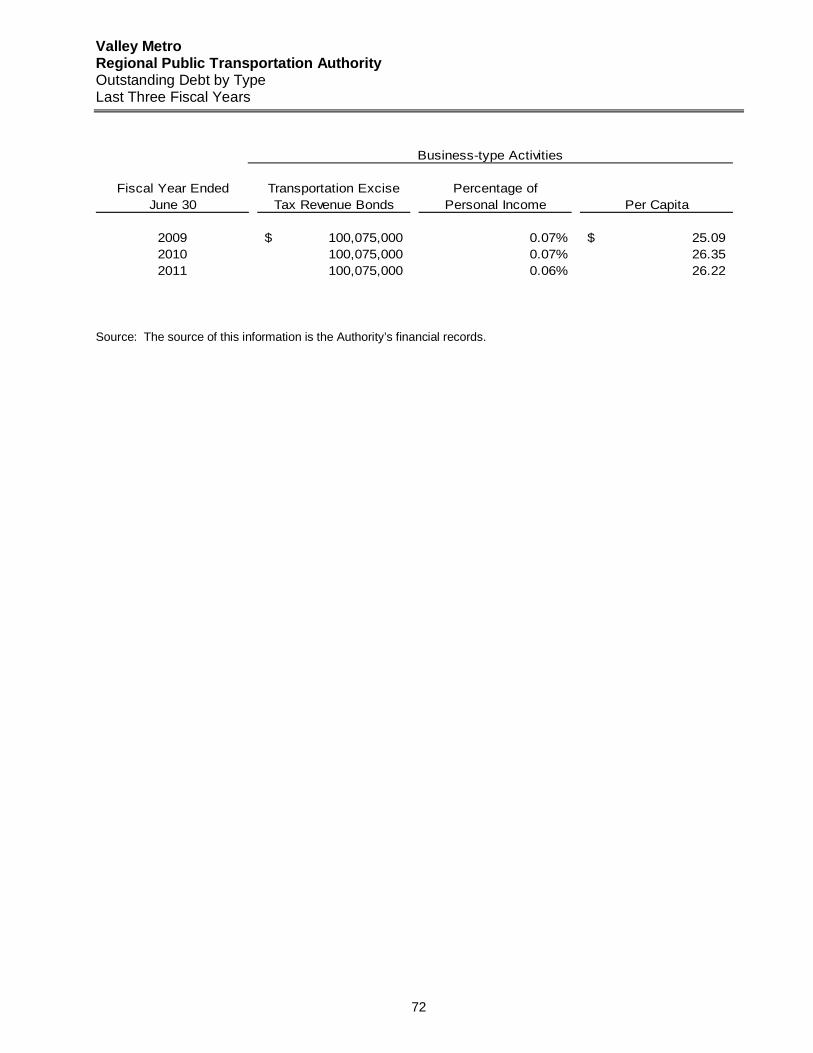
Valley Metro Regional Public Transportation Authority Outstanding Debt by Type Last Three Fiscal Years
72
Fiscal Year Ended Transportation Excise Percentage ofJune 30 Tax Revenue Bonds Personal Income Per Capita
2009 100,075,000$ 0.07% 25.09$ 2010 100,075,000 0.07% 26.35 2011 100,075,000 0.06% 26.22
Business-type Activities
Source: The source of this information is the Authority’s financial records.

Valley Metro Regional Public Transportation Authority Transportation Excise Tax Revenue Bonds Debt Service Revenue and Cost Per Capita Last Three Fiscal Years
73
MaricopaFiscal Total County Cost RevenueYear Principal Interest Cost Revenue Population (1) Per Capita Per Capita
2009 -$ -$ -$ 109,020,404$ 3,987,942$ -$ 27$ 2010 - 5,259,888 5,259,888 99,351,318 4,115,811 1 24 2011 2,265,000 5,245,318 7,510,318 102,688,559 3,817,117 2 27
(1) Source: Maricopa Association of Governments, Resident Population Estimates Documentation

Valley Metro Regional Public Transportation Authority Regional Population Statistics Last Ten Fiscal Years
74
FY 2001/02 (1) FY 2002/03 (1) FY 2003/04 (1) FY 2004/05 (1) FY 2005/06 (1)
Maricopa County 3,192,125 3,296,250 3,406,170 3,537,630 3,648,545Avondale 40,445 47,610 54,200 60,490 66,110Buckeye N/A N/A N/A N/A N/AChandler 186,875 194,390 209,140 221,555 231,785El Mirage 11,915 20,645 25,550 28,420 29,630Gilbert 122,360 133,640 151,975 165,325 178,000Glendale 224,970 227,495 231,150 234,225 236,030Goodyear (3) N/A N/A N/A N/A N/AMesa 414,075 427,550 435,380 448,845 452,355Peoria 117,200 122,655 126,815 132,805 137,285Phoenix 1,344,775 1,365,675 1,390,830 1,421,450 1,452,825Queen Creek (3) N/A N/A N/A N/A N/AScottsdale 209,960 214,090 218,095 221,980 223,835Surprise (3) 38,400 45,125 51,885 64,210 78,265Tempe 159,435 159,425 159,905 161,420 160,735 (1) Source: Maricopa Association of Governments, Resident Population Estimates Documentation (2) Source: U.S. Census (3) Data for fiscal years prior to membership of the Authority was not available. The Regional Public Transportation Authority (“Authority”) was established in 1985 to develop a regional transit plan and to develop and operate a regional transit system in Maricopa County, Arizona. The Authority is governed by a sixteen-member Board of Directors consisting of a member of the Maricopa County Board of Supervisors, and the mayors (or their designees) of the cities of Avondale, Chandler, El Mirage, Glendale, Goodyear, Mesa, Peoria, Phoenix, Scottsdale, Surprise, Tempe and Tolleson and the towns of Buckeye, Gilbert and Queen Creek. Any municipality in Maricopa County may join the Authority and have one elected official serve on the Board of Directors by committing a portion of its local transportation assistance funds to local public transportation. State legislation designates that 100% of the proceeds from the Arizona State Lottery received by participating municipalities with 300,000 or more in population, known as local transportation assistance funds, must be expended for public transportation in the respective municipalities to maintain a position on the Authority’s Board of Directors. For all other municipalities, the requirement is 33.3% for cities with a population between 60,000 and 300,000 and 75% for cities with less than 60,000 population. Local transportation assistance funds (“LTAF”) and minimum public transportation expenditures for participating municipalities for the last ten years are on the LTAF statistics table.

75
FY 2006/07 (1) FY 2007/08 (1) FY 2008/09 (1) FY 2009/10 (1) FY 2010/11 (1)
3,792,675 3,907,492 3,987,942 4,023,331 3,817,11772,210 75,256 76,648 76,900 76,238
N/A N/A 50,143 52,764 50,876235,450 241,205 244,376 245,087 236,123
32,605 33,583 33,647 33,610 31,797185,030 203,656 214,820 217,521 208,453243,540 246,076 248,435 249,197 226,721
49,720 55,954 59,436 61,916 65,275451,360 456,344 459,682 461,102 439,041145,135 151,541 155,557 158,709 154,065
1,505,265 1,538,568 1,561,485 1,575,423 1,445,63218,690 21,363 23,329 24,926 26,361
237,120 240,126 242,337 243,501 217,38598,140 104,895 108,761 109,482 117,517
165,890 167,871 172,641 174,833 161,719

(This page intentionally left blank)

Valley Metro Regional Public Transportation Authority Top Ten Employers for Maricopa County Current Fiscal Year and Nine Years Prior
76
Percentage of Percentage ofTotal County Total County
Employer Employees Rank Employment Employees Rank Employment
State of Arizona 52,420 1 3.22% 59,348 1 3.82%Wal-Mart Stores, Inc. 31,280 2 1.92% 13,800 6 0.89%Banner Health Systems 27,431 3 1.68% 13,973 4 0.90%City of Phoenix 16,375 4 1.01% 12,917 7 0.83%Wells Fargo & Company 14,000 5 0.86%Maricopa County 12,996 6 0.80% 13,860 5 0.89%Apollo Group Inc. 12,299 7 0.76%Arizona State University 12,043 8 0.74%Honeywell Aerospace 10,145 9 0.62% 17,500 2 1.13%Bank of America 10,000 10 0.61%Motorola 15,500 3 1.00%The Kroger Co. 9,837 8 0.63%US Postal Service - Arizona District 9,756 9 0.63%Raytheon Missile Systems 9,700 10 0.62%Total for Principal Employers 198,989 12.22% 176,191 11.34%
Total Employment in Maricopa County As of June 30 1,628,700 1,552,400
2011 2002
Source: The Business Journal, Book of Lists Workforce Informer Arizona at www.workforce.az.gov for total employed in Maricopa County.

Valley Metro Regional Public Transportation Authority Local Transportation Assistance Funds Last Ten Fiscal Years
77
FY 2001/2002 FY 2002/2003 FY 2003/2004 FY 2004/2005Avondale
Local transportation assistance funds received 203,685 220,818 252,589 277,421 Minimum local expenditures required 152,764 165,614 189,442 208,066 Percentage required 75.0% 75.0% 75.0% 75.0%
Buckeye (1) Local transportation assistance funds received N/A N/A N/A N/AMinimum local expenditures required N/A N/A N/A N/APercentage required N/A N/A N/A N/A
ChandlerLocal transportation assistance funds received 1,002,340 1,020,285 1,031,314 1,072,387 Minimum local expenditures required 334,113 340,095 343,771 357,462 Percentage required 33.3% 33.3% 33.3% 33.3%
El MirageLocal transportation assistance funds received 43,192 65,053 109,530 130,312 Minimum local expenditures required 32,394 48,790 82,148 97,734 Percentage required 75.0% 75.0% 75.0% 75.0%
GilbertLocal transportation assistance funds received 622,681 668,051 709,012 778,323 Minimum local expenditures required 207,560 222,684 236,337 259,441 Percentage required 33.3% 33.3% 33.3% 33.3%
GlendaleLocal transportation assistance funds received 1,242,059 1,228,273 1,206,948 1,186,391 Minimum local expenditures required 414,020 409,424 402,316 395,464 Percentage required 33.3% 33.3% 33.3% 33.3%
Goodyear (1) Local transportation assistance funds received NA NA NA NAMinimum local expenditures required NA NA NA NAPercentage required NA NA NA NA
MesaLocal transportation assistance funds received 2,249,873 2,260,734 2,268,317 2,233,853 Minimum local expenditures required 2,249,873 2,260,734 2,268,317 2,233,853 Percentage required 100.0% 100.0% 100.0% 100.0%
PeoriaLocal transportation assistance funds received 616,116 639,879 650,732 650,326 Minimum local expenditures required 205,372 213,293 216,911 216,775 Percentage required 33.3% 33.3% 33.3% 33.3%
PhoenixLocal transportation assistance funds received 7,498,747 7,342,097 7,245,430 7,138,976 Minimum local expenditures required 7,498,747 7,342,097 7,245,430 7,138,976 Percentage required 100.0% 100.0% 100.0% 100.0%
Queen Creek (1) Local transportation assistance funds received NA NA NA NAMinimum local expenditures required NA NA NA NAPercentage required NA NA NA NA
ScottsdaleLocal transportation assistance funds received 1,150,630 1,146,323 1,135,830 1,119,229 Minimum local expenditures required 383,543 382,108 378,610 373,076 Percentage required 33.3% 33.3% 33.3% 33.3%
Surprise (1) (2) Local transportation assistance funds received N/A N/A 239,405 265,383 Minimum local expenditures required N/A N/A 179,554 88,373 Percentage required N/A N/A 75.0% 33.3%
TempeLocal transportation assistance funds received 800,415 870,471 845,811 821,152 Minimum local expenditures required 266,805 290,157 281,937 273,717 Percentage required 33.3% 33.3% 33.3% 33.3%
TollesonLocal transportation assistance funds received N/A N/A N/A N/AMinimum local expenditures required N/A N/A N/A N/APercentage required N/A N/A N/A N/A
Source: State of Arizona, Office of the Treasurer
(1) Data for fiscal years prior to membership of the Authority was not available.
(2) Percentages of proceeds designated for expenditures have been revised according to the reported population starting FY2004/05.
The Regional Public Transportation Authority (“Authority”) was established in 1985 to develop a regional transit plan and to develop and operate a regional transit system in Maricopa County, Arizona. The Authority is governed by a sixteen-member Board of Directors consisting of a member of the Maricopa County Board of Supervisors, and the mayors (or their designees) of the cities of Avondale, Chandler, El Mirage, Glendale, Goodyear, Mesa, Peoria, Phoenix, Scottsdale, Surprise, Tempe and Tolleson and the towns of Buckeye, Gilbert and Queen Creek. Any municipality in Maricopa County may join the Authority and have one elected official serve on the Board of Directors by committing a portion of its local transportation assistance funds to local public transportation.
State legislation designates that 100% of the proceeds received by participating municipalities with 300,000 or more in population from the Arizona State Lottery, known as local transportation assistance funds, must be expended for public transportation in the respective municipalities to maintain a position on the Authority’s Board of Directors. For all other municipalities, the requirement is 33.3% for cities with a population between 60,000 and 300,000 and 75% for cities with less than 60,000 population. Local transportation assistance funds (“LTAF”) and minimum public transportation expenditures for participating municipalities for the last ten years are shown above.
(3) Funding was eliminated in March 2010.

Valley Metro Regional Public Transportation Authority Local Transportation Assistance Funds (Continued) Last Ten Fiscal Years
78
FY 2005/2006 FY 2006/2007 FY 2007/2008 FY 2008/2009 FY 2009/2010 FY 2010/2011 (3)
299,299 317,127 331,478 318,231 185,086 - 99,667 105,603 110,382 105,971 61,634 -
33.3% 33.3% 33.3% 33.3% 33.3% 0.0%
N/A N/A N/A 171,121 121,083 - N/A N/A N/A 128,341 90,812 - N/A N/A N/A 75.0% 75.0% 0.0%
1,096,287 1,111,863 1,080,826 1,019,970 590,108 - 365,064 370,250 359,915 339,650 196,506 -
33.3% 33.3% 33.3% 33.3% 33.3% 0.0%
140,622 142,134 149,672 142,011 81,249 - 105,467 106,600 112,254 106,508 60,937 -
75.0% 75.0% 75.0% 75.0% 75.0% 0.0%
818,025 853,858 849,374 861,189 518,737 - 272,402 284,335 282,842 286,776 172,739 -
33.3% 33.3% 33.3% 33.3% 33.3% 0.0%
1,158,998 1,132,226 1,117,962 1,040,568 599,909 - 385,946 377,031 372,281 346,509 199,770 -
33.3% 33.3% 33.3% 33.3% 33.3% 0.0%
NA 197,755 228,238 236,610 143,523 - NA 148,316 171,179 177,458 107,642 - NA 75.0% 75.0% 75.0% 75.0% 0.0%
2,220,987 2,169,928 2,071,953 1,929,717 1,110,018 - 2,220,987 2,169,928 2,071,953 1,929,717 1,110,018 -
100.0% 100.0% 100.0% 100.0% 100.0% 0.0%
657,162 658,598 666,237 640,826 375,639 - 218,835 219,313 221,857 213,395 125,088 -
33.3% 33.3% 33.3% 33.3% 33.3% 0.0%
7,033,839 6,969,140 6,909,870 6,506,059 3,770,600 - 7,033,839 6,969,140 6,909,870 6,506,059 3,770,600 -
100.0% 100.0% 100.0% 100.0% 100.0% 0.0%
NA 76,224 85,796 91,884 57,536 - NA 57,168 64,347 68,913 43,152 - NA 75.0% 75.0% 75.0% 75.0% 0.0%
1,098,399 1,073,727 1,088,492 1,015,408 585,184 - 365,767 357,551 362,468 338,131 194,866 -
33.3% 33.3% 33.3% 33.3% 33.3% 0.0%
317,703 375,434 450,508 443,564 262,631 - 105,795 125,019 150,019 147,707 87,456 -
33.3% 33.3% 33.3% 33.3% 33.3% 0.0%
798,826 771,039 761,513 709,867 416,885 - 266,009 256,756 253,584 236,386 138,823 -
33.3% 33.3% 33.3% 33.3% 33.3% 0.0%
N/A N/A N/A N/A 16,500 - N/A N/A N/A N/A 12,375 - N/A N/A N/A N/A 75.0% 0.0%

Valley Metro Regional Public Transportation Authority Demographic and Economic Statistics Last Ten Fiscal Years
79
Fiscal Income (1,2) Per Capita Median School UnemploymentYear Population (1,2) (in thousands) Income (1,2) Age (1,3) Enrollment (4) Rate (5)
2011 3,817,117 135,393,497$ 27,185$ 34.8 684,028 8.3%2010 4,115,811 152,216,281 36,983 36.8 684,510 8.8%2009 3,987,942 147,912,041 37,090 33.6 683,966 8.1%2008 3,907,492 143,729,512 36,783 33.7 732,146 4.2%2007 3,792,675 139,665,253 36,825 33.4 707,771 3.5%2006 3,648,545 134,339,487 36,820 33 689,411 3.6%2005 3,537,630 120,716,738 34,124 33 652,333 4.1%2004 3,498,587 110,278,789 31,521 33 626,461 4.4%2003 3,388,711 101,378,940 29,917 33 600,577 5.2%2002 3,293,441 96,998,974 29,452 33 565,517 5.6%
(1) Calendar year (2) Source: Arizona Workforce Informer, Labor Market Information, for Maricopa County
Population for fiscal years 2005 through 2010 are estimates from the Department of Economic Security. Personal income for fiscal years 2008 through 2010 were not available. The income amounts provided are estimates based on a 2.91% growth rate.
(3) For years through 2000, median age is based on the 1990 U.S. Census. For 2001 through 2008, median age is
based on the 2000 U.S. Census. For 2009 and 2010, median age is from Maricopa Association of Governments Human Services Coordination Transportation Plan, 2009 Update.
(4) Source: Arizona Department of Education, Research and Evaluation Section. School enrollment is based on the
census at the start of the school year. (5) Maricopa County Labor Force and NonFarm Employment.

Valley Metro Regional Public Transportation Authority Full-time Equivalent Employees (FTE) by Function/Program Last Ten Fiscal Years
80
2002 2003 2004 2005 2006 2007 2008 2009 2010 2011Function/ProgramGovernmental activities:
Regional planning 3.58 4.45 4.59 4.54 7.91 7.88 8.13 8.03 8.1 7.7Transportation demand management 10.25 10.25 10.25 10.25 10.25 9 10.5 10 10 9Regional customer services - - 4.72 4.67 4.2 71.5 74.6 78.24 78.26 72.85Administration 7.8 7.9 7.9 8.9 14.75 20.1 22.2 22.2 22.2 20.4
Total governmental activities FTE 21.63 22.6 27.46 28.36 37.11 108.5 115.4 118.5 118.6 110.0
Business-type activities: Transit service operations 6.09 6.4 4.54 4.64 4.89 10.52 8.57 8.53 8.44 10.05Light rail transit (1) 21.28 31 33 42 47 51 58 92 96 84
Total business-type activities FTE 27.37 37.4 37.54 46.64 51.89 61.52 66.57 100.5 104.4 94.05
Total primary government FTE 49.00 60.00 65.00 75.00 89.00 170.00 182.00 219.00 223.00 204.00
Source: Adopted Valley Metro Operating Budgets for the applicable years. (1) Light rail transit staff are employees of the Authority and report to the Valley Metro Rail, Inc. Board of Directors.

Valley Metro Regional Public Transportation Authority Operating Indicators by Program – Fixed Route System Last Ten Fiscal Years
81
FY 2000/2001 FY 2001/2002 FY 2002/2003 FY 2003/2004 FY 2004/2005Fixed Route System (1)
City of Phoenix Transit SystemTotal boardings 31,897,150 34,642,732 37,543,692 40,427,904 42,909,890 Revenue miles 12,525,236 14,498,806 16,479,011 16,956,333 17,420,722 Revenue hours 801,069 941,752 1,089,891 1,115,462 1,146,819 Operating cost $ 65,946,654 $ 76,314,996 $ 90,376,532 $ 93,661,178 $ 89,543,836 Operating cost per boarding $ 2.07 $ 2.20 $ 2.41 $ 2.32 $ 2.09 Farebox recovery ratio 33.5% 25.5% 23.0% 24.8% 27.0%
Regional Public Transportation Authority (2)Total boardings 4,179,015 4,979,305 5,688,992 6,503,504 6,203,696 Revenue miles 4,702,350 4,727,196 4,799,475 4,971,133 4,379,307 Revenue hours 320,533 321,379 379,892 375,171 276,517 Operating cost $ 15,585,768 $ 17,271,336 $ 17,059,807 $ 18,200,836 $ 16,445,778 Operating cost per boarding $ 3.73 $ 3.47 $ 3.00 $ 2.80 $ 2.65 Farebox recovery ratio 18.3% 16.3% 19.7% 18.3% 23.1%
City of TempeTotal boardings 3,201,550 3,865,511 4,906,953 4,813,237 4,805,598 Revenue miles 3,302,089 3,730,509 3,814,559 3,826,195 3,797,053 Revenue hours 246,388 350,657 267,347 314,932 311,852 Operating cost $ 12,028,529 $ 12,485,395 $ 13,110,640 $ 14,864,954 $ 15,738,112 Operating cost per boarding $ 3.76 $ 3.23 $ 2.67 $ 3.09 $ 3.27 Farebox recovery ratio 13.9% 17.2% 20.6% 18.2% 17.3%
City of Glendale - Luke Link (3)Total boardings 35,978 36,404 51,246 70,823 93,024 Revenue miles 103,338 89,650 106,326 131,400 139,789 Revenue hours 5,530 3,876 4,630 7,088 7,962 Operating cost $ 245,369 $ 136,565 $ 163,768 $ 228,160 $ 218,243 Operating cost per boarding $ 6.82 $ 3.75 $ 3.20 $ 3.22 $ 2.35 Farebox recovery ratio 10.1% 22.3% 30.5% 20.9% 26.8%
Total f ixed route systemTotal boardings 39,313,693 43,523,952 48,190,883 51,815,468 54,012,208 Revenue miles 20,633,013 23,046,161 25,199,371 25,885,061 25,736,871 Revenue hours 1,373,520 1,617,664 1,741,760 1,812,653 1,743,150 Operating cost $ 93,806,320 $ 106,208,292 $ 120,710,747 $ 126,955,128 $ 121,945,969 Operating cost per boarding $ 2.39 $ 2.44 $ 2.50 $ 2.45 $ 2.26 Farebox recovery ratio 28.4% 23.0% 22.3% 23.1% 25.2%
Source: Reports prepared by the Regional Public Transportation Authority (RPTA): Performance Management Analysis System for fiscal years 2001 through 2007. Annual Transit Performance Report for fiscal years beginning FY 2008. (1) Fixed route systems are comprised of various operators and contractors of service in Maricopa County; as the
regional authority, the Regional Public Transportation Authority in its role compiles and reports on system efficiency and effectiveness performance indicators.
(2) The Regional Public Transportation Authority statistics include the City of Mesa fixed route system and the City
of Scottsdale fixed route system that were separately managed through fiscal year 2004 and fiscal year 2001, respectively.
(3) NA - City of Glendale did not run a fixed route. Note: Information for fiscal year 2010-11 was not available at the time the CAFR was drafted.
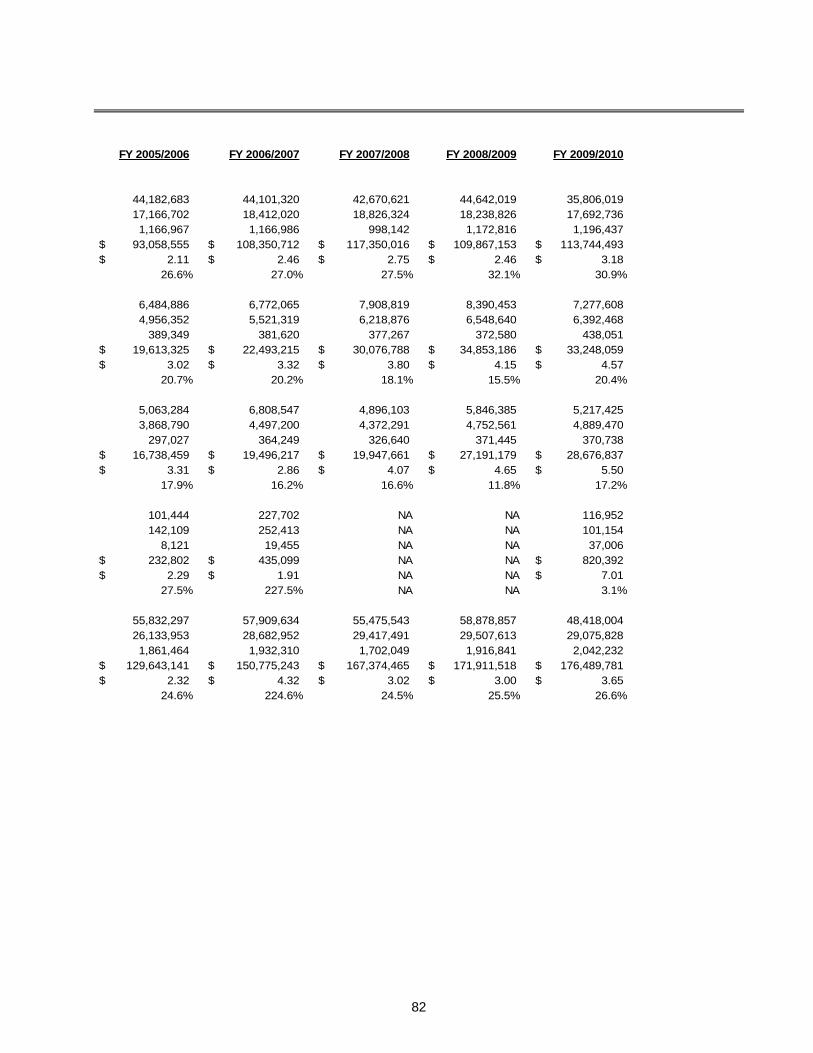
82
FY 2005/2006 FY 2006/2007 FY 2007/2008 FY 2008/2009 FY 2009/2010
44,182,683 44,101,320 42,670,621 44,642,019 35,806,019 17,166,702 18,412,020 18,826,324 18,238,826 17,692,736 1,166,967 1,166,986 998,142 1,172,816 1,196,437
$ 93,058,555 $ 108,350,712 $ 117,350,016 $ 109,867,153 $ 113,744,493 $ 2.11 $ 2.46 $ 2.75 $ 2.46 $ 3.18
26.6% 27.0% 27.5% 32.1% 30.9%
6,484,886 6,772,065 7,908,819 8,390,453 7,277,608 4,956,352 5,521,319 6,218,876 6,548,640 6,392,468
389,349 381,620 377,267 372,580 438,051 $ 19,613,325 $ 22,493,215 $ 30,076,788 $ 34,853,186 $ 33,248,059 $ 3.02 $ 3.32 $ 3.80 $ 4.15 $ 4.57
20.7% 20.2% 18.1% 15.5% 20.4%
5,063,284 6,808,547 4,896,103 5,846,385 5,217,425 3,868,790 4,497,200 4,372,291 4,752,561 4,889,470
297,027 364,249 326,640 371,445 370,738 $ 16,738,459 $ 19,496,217 $ 19,947,661 $ 27,191,179 $ 28,676,837 $ 3.31 $ 2.86 $ 4.07 $ 4.65 $ 5.50
17.9% 16.2% 16.6% 11.8% 17.2%
101,444 227,702 NA NA 116,952 142,109 252,413 NA NA 101,154
8,121 19,455 NA NA 37,006 $ 232,802 $ 435,099 NA NA $ 820,392 $ 2.29 $ 1.91 NA NA $ 7.01
27.5% 227.5% NA NA 3.1%
55,832,297 57,909,634 55,475,543 58,878,857 48,418,004 26,133,953 28,682,952 29,417,491 29,507,613 29,075,828 1,861,464 1,932,310 1,702,049 1,916,841 2,042,232
$ 129,643,141 $ 150,775,243 $ 167,374,465 $ 171,911,518 $ 176,489,781 $ 2.32 $ 4.32 $ 3.02 $ 3.00 $ 3.65
24.6% 224.6% 24.5% 25.5% 26.6%

Valley Metro Regional Public Transportation Authority Operating Indicators by Program – Dial-a-Ride System Last Ten Fiscal Years
83
Dial-a-Ride System (1)Phoenix Dial-a-Ride
Total boardings 237,886 270,493 333,860 369,791 393,053 Revenue miles 2,961,140 3,238,681 3,687,477 3,901,614 4,084,991 Revenue hours 191,525 230,951 255,922 262,372 274,099 Operating cost $ 6,909,752 $ 9,462,730 $ 10,385,900 $ 11,150,114 $ 12,375,324 Operating cost per boarding $ 29.05 $ 34.98 $ 31.11 $ 30.15 $ 31.49 Farebox recovery ratio 6.4% 5.2% 4.9% 4.8% 4.0%
Phoenix Reserve-a-RideTotal boardings 203,616 193,986 162,760 153,697 152,631 Revenue miles 567,565 550,850 540,282 540,388 518,616 Revenue hours 50,909 51,559 47,155 50,754 47,282 Operating cost $ 2,442,020 $ 2,589,906 $ 2,689,066 $ 2,757,131 $ 2,853,105 Operating cost per boarding $ 11.99 $ 13.35 $ 16.52 $ 17.94 $ 18.69 Farebox recovery ratio 2.6% 3.3% 3.2% 3.1% 2.7%
East Valley Dial-a-RideTotal boardings 266,624 252,441 240,879 222,736 223,130 Revenue miles 1,952,587 1,995,550 1,371,852 2,048,542 1,622,795 Revenue hours 115,673 116,884 117,217 111,514 118,032 Operating cost $ 4,524,032 $ 4,772,217 $ 5,076,798 $ 4,963,617 $ 5,338,924 Operating cost per boarding $ 16.97 $ 18.90 $ 21.08 $ 22.28 $ 23.93 Farebox recovery ratio 8.0% 7.6% 7.0% 6.5% 6.6%
Maricopa County STSTotal boardings 141,541 124,822 106,395 103,533 105,342 Revenue miles 634,593 455,897 732,376 730,180 523,119 Revenue hours 45,553 56,251 70,238 67,836 41,189 Operating cost $ 1,653,677 $ 1,379,719 $ 1,587,982 $ 1,534,951 $ 3,249,859 Operating cost per boarding $ 11.68 $ 11.05 $ 14.93 $ 14.83 $ 30.85 Farebox recovery ratio 4.3% 4.5% 1.1% 1.0% 0.4%
Sun Cities Area TransitTotal boardings 61,317 60,400 60,345 61,147 58,069 Revenue miles 222,535 218,313 226,194 229,917 254,897 Revenue hours 18,847 17,998 19,226 20,015 22,648 Operating cost $ 617,129 $ 656,655 $ 671,365 $ 671,410 $ 714,915 Operating cost per boarding $ 10.06 $ 10.87 $ 11.13 $ 10.98 $ 12.31 Farebox recovery ratio 25.3% 22.9% 22.4% 22.7% 21.3%
FY 2000/2001 FY 2001/2002 FY 2002/2003 FY 2003/2004 FY 2004/2005
Source: Reports prepared by the Regional Public Transportation Authority: Performance Management Analysis System for fiscal years 2001 through 2007. Annual Transit Performance Report for fiscal years beginning FY 2008. (1) Dial-a-ride systems are comprised of various operators and contractors of service in Maricopa County; as the
regional authority, the Regional Public Transportation Authority in its role compiles and reports on system efficiency and effectiveness performance indicators.
NR Not reported Note: Information for fiscal year 2010-11 was not available at the time the CAFR was drafted.

84
415,733 410,838 391,420 396,474 353,674 4,276,365 NA 4,806,031 4,064,584 3,675,478
285,137 287,882 292,601 295,057 283,686 $ 12,452,214 $ 13,655,624 $ 14,759,075 $ 14,991,465 $ 14,749,818 $ 29.95 $ 33.24 $ 37.71 $ 37.81 $ 41.70
5.0% 4.7% 4.1% 4.2% 7.3%
NR NR NR NR NRNR NR NR NR NRNR NR NR NR NRNR NR NR NR NRNR NR NR NR NRNR NR NR NR NR
220,153 226,050 240,424 262,364 248,462 1,796,728 NA NA 2,090,445 2,123,274
121,607 126,131 131,842 137,604 129,168 $ 6,596,249 $ 7,685,324 $ 8,461,088 $ 9,760,107 $ 9,322,558 $ 29.96 $ 34.00 $ 35.19 $ 37.20 $ 37.52
5.2% 5.0% 4.6% 4.1% 4.9%
100,243 91,082 87,134 35,488 NR913,009 NA NA 362,525 NR56,585 49,524 47,511 24,641 NR
$ 3,312,076 $ 3,368,464 $ 3,350,837 $ 256,574 NR$ 33.04 $ 36.98 $ 38.46 $ 7.23 NR
0.3% 0.0% 0.0% 0.0% NR
57,091 45,612 34,924 27,652 30,509 230,472 NA NA 109,741 120,305 21,802 16,526 12,974 13,081 30,509
$ 689,473 $ 697,877 $ 560,024 $ 610,581 $ 558,965 $ 12.08 $ 15.30 $ 16.04 $ 22.08 $ 18.32
23.5% 18.0% 22.0% 17.4% 18.6%
FY 2005/2006 FY 2006/2007 FY 2007/2008 FY 2008/2009 FY 2009/2010
(Continued)

Valley Metro Regional Public Transportation Authority Operating Indicators by Program – Dial-a-Ride System (Continued) Last Ten Fiscal Years
85
Dial-a-Ride System (1)Glendale Dial-a-Ride
Total boardings 66,536 76,622 81,768 86,132 87,831 Revenue miles 281,461 316,961 376,504 387,531 386,587 Revenue hours 20,718 22,662 25,782 26,252 29,554 Operating cost $ 1,442,170 $ 1,807,835 $ 2,074,611 $ 2,255,038 $ 2,247,156 Operating cost per boarding $ 21.68 $ 23.59 $ 25.37 $ 26.18 $ 25.58 Farebox recovery ratio 5.4% 4.9% 4.7% 4.7% 5.0%
Peoria Dial-a-RideTotal boardings 33,540 32,176 30,399 29,258 33,805 Revenue miles 169,360 196,224 189,984 158,456 153,805 Revenue hours 8,352 9,457 9,276 7,920 8,258 Operating cost $ 598,195 $ 624,322 $ 727,770 $ 738,683 $ 827,786 Operating cost per boarding $ 17.84 $ 19.40 $ 23.94 $ 25.25 $ 24.49 Farebox recovery ratio 6.1% 5.4% 5.0% 4.5% 4.0%
El Mirage Dial-a-RideTotal boardings 2,054 1,204 1,103 1,061 1,558 Revenue miles 12,698 6,020 9,172 7,230 10,017 Revenue hours 2,080 750 1,834 NR NROperating cost $ 88,592 $ 93,178 $ 93,632 $ 76,813 $ 70,459 Operating cost per boarding $ 43.13 $ 77.39 $ 84.89 $ 72.40 $ 45.22 Farebox recovery ratio 1.7% 1.5% 0.9% 1.0% 1.7%
Surprise Dial-a-RideTotal boardings 5,777 7,775 7,094 7,387 8,181 Revenue miles 38,834 45,800 43,716 48,768 68,291 Revenue hours 2,726 2,818 3,881 4,891 5,016 Operating cost $ 77,418 $ 105,800 $ 162,931 $ 185,646 $ 283,624 Operating cost per boarding $ 13.40 $ 13.61 $ 22.97 $ 25.13 $ 34.67 Farebox recovery ratio 8.5% 6.2% 4.6% 4.3% 3.5%
Total Dial-a-Ride SystemTotal boardings 1,018,891 1,019,919 1,024,603 1,034,742 1,063,600 Revenue miles 6,840,773 7,024,296 7,177,557 8,052,626 7,623,118 Revenue hours 456,383 509,330 550,531 551,554 546,078 Operating cost $ 18,352,985 $ 21,492,362 $ 23,470,055 $ 24,333,403 $ 27,961,152 Operating cost per boarding $ 18.01 $ 21.07 $ 22.91 $ 23.52 $ 26.29 Farebox recovery ratio 6.7% 6.0% 5.4% 5.2% 4.5%
FY 2000/2001 FY 2001/2002 FY 2002/2003 FY 2003/2004 FY 2004/2005
Source: Reports prepared by the Regional Public Transportation Authority: Performance Management Analysis System for fiscal years 2001 through 2007. Annual Transit Performance Report for fiscal years beginning FY 2008. (1) Dial-a-ride systems are comprised of various operators and contractors of service in Maricopa County; as the
regional authority, the Regional Public Transportation Authority in its role compiles and reports on system efficiency and effectiveness performance indicators.
NR Not reported Note: Information for fiscal year 2010-11 was not available at the time the CAFR was drafted.

86
89,055 84,132 88,638 92,381 89,808 390,561 NA NA 408,986 411,136 29,594 29,448 30,642 30,594 29,927
$ 2,387,554 $ 2,446,602 $ 2,878,740 $ 2,431,098 $ 2,430,543 $ 26.81 $ 29.08 $ 32.48 $ 26.32 $ 27.06
4.6% 3.3% 3.8% 4.4% 4.3%
42,560 45,790 40,122 38,978 32,921 159,903 NA NA 212,812 158,846
9,975 12,663 14,875 14,567 13,218 $ 927,312 $ 1,045,445 $ 1,239,982 $ 1,239,982 $ 1,109,380 $ 21.79 $ 22.83 $ 30.91 $ 31.81 $ 33.70
5.1% 4.5% 3.2% 3.1% 2.9%
1,466 1,947 1,131 1,459 NR12,284 NA NA NA NR1,613 1,820 1,764 1,680 NR
$ 74,023 $ 99,256 $ 97,262 $ 102,139 NR$ 50.49 $ 50.98 $ 86.00 $ 70.01 NR
2.0% 3.7% 2.3% 2.9% NR
12,578 17,339 20,075 19,336 22,151 86,045 NA NA 79,989 83,761 6,554 8,037 8,698 7,918 8,561
$ 367,093 $ 506,921 $ 589,469 $ 644,740 $ 591,150 $ 29.19 $ 29.24 $ 29.36 $ 33.34 $ 26.69
3.5% 3.6% 3.7% 3.0% 3.8%
938,879 922,790 903,868 874,132 777,525 7,865,367 NA NA 7,329,082 6,572,800
532,887 532,031 540,907 524,842 478,158 $ 26,805,994 $ 29,505,513 $ 31,936,477 $ 30,057,041 $ 28,762,414 $ 28.55 $ 31.97 $ 35.33 $ 34.39 $ 36.99
4.9% 4.4% 4.1% 4.3% 6.2%
FY 2005/2006 FY 2006/2007 FY 2007/2008 FY 2008/2009 FY 2009/2010

Valley Metro Regional Public Transportation Authority Operating Indicators by Program – Shuttle / Circulator System Last Nine Fiscal Years
87
Shuttle/Circulator SystemCity of Phoenix (1)
Total boardings 437,421 770,348 747,351 794,945 Revenue miles 361,830 604,325 577,579 601,547 Revenue hours 26,505 40,480 37,636 38,156 Operating cost $ 1,058,452 $ 1,619,238 $ 1,435,044 $ 2,386,820 Operating cost per boarding $ 2.42 $ 2.10 $ 1.92 $ 3.00 Farebox recovery ratio 0.0% 0.0% 0.0% 0.0%
City of Tempe (2) Total boardings 1,222,122 1,445,714 1,705,025 1,999,795 Revenue miles 601,509 441,587 487,780 475,609 Revenue hours 61,681 30,949 40,149 39,831 Operating cost $ 1,995,345 $ 1,517,734 $ 1,771,216 $ 1,835,387 Operating cost per boarding $ 1.63 $ 1.05 $ 1.04 $ 0.92 Farebox recovery ratio 0.0% 0.0% 0.0% 0.0%
City of Scottsdale (3) (4)Total boardings 42,456 49,498 52,599 92,139 Revenue miles 30,060 33,129 37,272 57,696 Revenue hours 4,676 4,683 6,185 8,167 Operating cost $ 290,066 $ 308,684 $ 377,726 $ 547,764 Operating cost per boarding $ 6.83 $ 6.24 $ 7.18 $ 5.94 Farebox recovery ratio 0.0% 0.0% 0.0% 0.0%
City of Glendale (5) Total boardings 51,180 54,093 59,692 82,569 Revenue miles 66,784 78,895 93,794 100,295 Revenue hours 8,055 6,361 7,897 8,301 Operating cost $ 267,801 $ 185,407 $ 203,149 $ 144,934 Operating cost per boarding $ 5.23 $ 3.43 $ 3.39 $ 1.76 Farebox recovery ratio 4.6% 5.7% 5.9% 11.0%
Regional Public Transportation Authority (6) Total boardings N/A N/A N/A N/ARevenue miles N/A N/A N/A N/ARevenue hours N/A N/A N/A N/AOperating cost N/A N/A N/A N/AOperating cost per boarding N/A N/A N/A N/AFarebox recovery ratio N/A N/A N/A N/A
Total Shuttle/Circulator SystemTotal boardings 1,753,179 2,319,653 2,564,667 2,969,448 Revenue miles 1,060,183 1,157,936 1,196,425 1,235,147 Revenue hours 100,917 82,473 91,867 94,455 Operating cost $ 3,611,664 $ 3,631,063 $ 3,787,135 $ 4,914,905 Operating cost per boarding $ 2.06 $ 1.57 $ 1.48 $ 4.20 Farebox recovery ratio N/A N/A N/A N/A
FY 2001/2002 FY 2002/2003 FY 2003/2004 FY 2004/2005
Source: Reports prepared by the Regional Public Transportation Authority: Performance Management Analysis System for fiscal years 2001 through 2007. Annual Transit Performance Report for fiscal years beginning FY 2008.
(1) City of Phoenix - Alex, Dart, Dash, Deer Run, Durango Shuttle, Mart & Smart; prior to FY 07-08 included only Dash and Alex.
(2) City of Tempe - FLASH, Orbit-Earth, Jupiter, Mars, Mercury, Neighborhood FLASH & Venus; prior to FY 07-08 included only FLASH, Neighborhood FLASH.
(3) City of Scottsdale - Neighborhood Trolley and Downtown Trolley; prior to FY 07-08 included only Roundup.
(4) City of Scottsdale did not track revenue miles for FY 07-08.
(5) City of Glendale - GUS 7 Luke Link
(6) RPTA- BUZZ
Note: Information for fiscal year 2010-11 was not available at the time the CAFR was drafted.
N/A – Indicates information is not applicable.

Valley Metro Regional Public Transportation Authority Operating Indicators by Program – Shuttle / Circulator System Last Nine Fiscal Years
88
766,676 735,941 1,799,974 2,599,292 2,643,678 580,884 580,080 1,614,317 1,960,474 1,609,412 36,923 36,710 79,529 118,173 99,367
$ 1,812,780 $ 1,889,393 $ 7,173,722 $ 9,626,975 $ 7,306,773 $ 2.36 $ 2.57 $ 3.99 $ 3.70 $ 2.76
0.0% 0.0% 0.1% 0.0% 0.0%
2,034,656 1,616,729 2,456,646 3,307,223 3,660,543 479,595 482,538 1,613,904 2,105,878 1,819,126 48,794 52,379 150,171 206,964 194,057
$ 1,954,659 $ 2,091,895 $ 6,833,012 $ 11,414,395 $ 10,070,159 $ 0.96 $ 1.29 $ 2.78 $ 3.45 $ 2.75
0.0% 0.0% 0.0% 0.0% 0.0%
125,435 274,961 384,000 572,925 652,230 80,489 219,861 - 439,307 358,482 14,025 33,828 48,240 48,648 37,006
$ 953,477 $ 1,887,546 $ 2,400,000 $ 2,627,403 N/A$ 7.60 $ 6.86 $ 6.25 $ 4.59 N/A
0.0% 0.0% 0.0% 0.0% N/A
96,258 97,681 110,941 113,382 116,952 96,838 NR 110,005 98,760 104,154 7,969 NR 8,858 8,735 12,412
$ 158,442 NR $ 176,574 $ 668,581 $ 820,392 $ 1.65 NR $ 1.59 $ 5.90 $ 7.01
10.3% NR 16.3% 3.6% 3.1%
N/A N/A N/A 80,133 200,504 N/A N/A N/A 60,795 105,935 N/A N/A N/A 5,755 8,726 N/A N/A $ N/A $ 319,570 $ 547,823 N/A N/A $ N/A $ 3.99 $ 2.73 N/A N/A N/A 0.0% 0.0%
3,023,025 2,725,312 4,751,561 6,672,955 7,273,907 1,237,806 1,282,479 3,338,226 4,665,213 3,997,109
107,711 122,917 286,798 388,275 351,567 $ 4,879,358 $ 5,868,834 $ 16,583,308 $ 24,656,925 $ 18,745,147 $ 1.61 $ 2.15 $ 3.49 $ 3.88 $ 2.58
N/A N/A 0.2% 0.1% N/A
FY 2007/2008 FY 2008/2009 FY 2009/2010FY 2005/2006 FY 2006/2007

Valley Metro Regional Public Transportation Authority Capital Asset Statistics by Function/Program Revenue Vehicles for Transit Service Operations Last Ten Fiscal Years
89
Fiscal Local and Paratransit /Year Express Bus Dial-a-Ride Vanpool
2001/02 72 63 NA2002/03 80 67 NA2003/04 80 62 NA2004/05 133 61 2502005/06 181 57 3032006/07 172 75 3082007/08 192 76 3472008/09 257 76 4212009/10 251 111 3762010/11 242 80 376
Source: National Transit Data Base (NTD) (1999/00-2007/08) FAS GOV 100 Asset Accounting (2008/09-current) (1) For years FY98 through FY04, the NTD reported numbers included vans that were owned by the contractor; thus,
those assets are not reported.
Single Audit Section The Single Audit Section includes the Authority’s schedule of expenditures of federal awards, and the independent auditors’ reports on internal controls and compliance with applicable laws and regulations.


Valley Metro Regional Public Transportation Authority Supplementary Schedule of Expenditures of Federal Awards Fiscal Year Ended June 30, 2011
90
CFDA Pass-Through Pass-Through AwardsFederal Grantor Agency and Program Title Number Grantor Identifying Number Expended
Department of Transportation
Federal Transit AdministrationUrbanized Area Formula (Section 5307) 20.507 City of Phoenix AZ-90-X070 $ 57,691 Urbanized Area Formula (Section 5307) 20.507 City of Phoenix AZ-90-X074 166,941 Urbanized Area Formula (Section 5307) 20.507 City of Phoenix AZ-90-X080 211,019 Urbanized Area Formula (Section 5307) 20.507 City of Phoenix AZ-90-X103 1,544,641 Urbanized Area Formula (Section 5307)-ARRA 20.500 City of Phoenix AZ-96-X002 4,504,513 Total Federal Transit Cluster 6,484,805
New Freedoms (Section 5317) 20.521 City of Phoenix AZ-57-X001 213,440 New Freedoms (Section 5317) 20.521 City of Phoenix AZ-57-X008 172,324 New Freedoms (Section 5317) 20.521 City of Phoenix AZ-57-X009 455,864 New Freedoms (Section 5317) 20.521 City of Phoenix AZ-57-X012 228,095 Job Access/Reverse Commute -JARC (Section 5316) 20.516 City of Phoenix AZ-37-X011 99,375 Job Access/Reverse Commute -JARC (Section 5316) 20.516 City of Phoenix AZ-37-X017 97,394 Total Transit Service Program Cluster 1,266,492
FHWA Transfer Funds (STP/CMAQ) 20.205 City of Phoenix AZ-90-X080 254,256 FHWA Transfer Funds (STP/CMAQ) 20.205 City of Phoenix AZ-95-0004 368,031 State Rural Area Formula (Section 5311) Gila Bend 20.509 ADOT AZ-18-X038 65,662 State Rural Area Formula (Section 5311) Wickenburg 20.509 ADOT AZ-18-X041 379,903 State Rural Area Formula (Section 5311) ARRA 20.509 ADOT AZ-85-X001 24,400
Total Federal Transit Administration 8,843,549
Federal Highway AdministrationCongestion Mitigation and Air Quality Improvement Program Funds: Regional Ridesharing Program 20.205 MAG 413 227,368 Regional Ridesharing Program 20.205 MAG 413 362,694 Trip Reduction Program 20.205 Maricopa County C-85-10-021-3-01 58,673 Trip Reduction Program 20.205 Maricopa County C-85-11-006-3-00 202,709 Trip Reduction Program 20.205 Maricopa County C-85-11-004-3-00 255,000
1,106,444 Transportation Enhancement Funds: Regional Bicycle & Pedestrian Safety 20.200 ADOT JPA 08-0851 94,138 Regional Bicycle Safe Routes to School 20.200 ADOT JPA 08-083-1 76,176 Regional Bicycle Bike Pedal Safety 20.200 ADOT JPA 10-0421 210,333
380,647
Total Federal Highway Administration 1,487,091
Total Expenditures of Federal Awards $ 10,330,640

Valley Metro Regional Public Transportation Authority Notes to Supplementary Schedule of Expenditures of Federal Awards Fiscal Year Ended June 30, 2011
91
1. General The Schedule of Expenditures of Federal Awards presents the activity of all federal award programs of the Regional Public Transportation Authority (the “Authority”). All federal awards received are passed through the City of Phoenix, Arizona Department of Transportation (ADOT), Maricopa County and Maricopa Association of Governments (MAG). Federal financial award activities are reported in the special revenue and enterprise funds in the Authority’s fund financial statements.
2. Basis of Accounting and Reporting Entity The accompanying Schedule of Expenditures of Federal Awards is presented using a basis of accounting that is consistent with the basic financial statements, as is described in Note 1 of the Authority’s basic financial statements. The Authority, for purposes of the Schedule of Expenditures of Federal Awards, includes all funds of the primary government as defined by Governmental Accounting Standards Board Statement No. 14, The Financial Reporting Entity.
3. Catalog of Federal Domestic Assistance (CFDA) Numbers The program titles and CFDA numbers were obtained from the 2011 Catalog of Federal Domestic Assistance.
4. Period of Award There is no specified time period in which the grant award must be spent.

Page 92
REPORT ON INTERNAL CONTROL OVER FINANCIAL REPORTING AND ON COMPLIANCE AND OTHER MATTERS BASED ON AN AUDIT OF
FINANCIAL STATEMENTS PERFORMED IN ACCORDANCE WITH GOVERNMENT AUDITING STANDARDS
Board of Directors Valley Metro Regional Public Transportation Authority We have audited the financial statements of the governmental activities, the business-type activities, and each major fund of Valley Metro Regional Public Transportation Authority as of and for the year ended June 30, 2011, which collectively comprise Valley Metro Regional Public Transportation Authority’s basic financial statements and have issued our report thereon dated February 27, 2012, which was modified as to consistency because of the implementation of Governmental Accounting Standards Board Statement No. 54. We conducted our audit in accordance with auditing standards generally accepted in the United States of America and the standards applicable to financial audits contained in Government Auditing Standards, issued by the Comptroller General of the United States. Internal Control Over Financial Reporting Management of Valley Metro Regional Public Transportation Authority is responsible for establishing and maintaining effective internal control over financial reporting. In planning and performing our audit, we considered Valley Metro Regional Public Transportation Authority’s internal control over financial reporting as a basis for designing our auditing procedures for the purpose of expressing our opinions on the financial statements, but not for the purpose of expressing an opinion on the effectiveness of Valley Metro Regional Public Transportation Authority’s internal control over financial reporting. Accordingly, we do not express an opinion on the effectiveness of Valley Metro Regional Public Transportation Authority’s internal control over financial reporting. Our consideration of internal control over financial reporting was for the limited purpose described in the preceding paragraph of this section and was not designed to identify all deficiencies in internal control over financial reporting that might be significant deficiencies or material weaknesses and, therefore there can be no assurance that all deficiencies, significant deficiencies, or material weaknesses have been identified. However, as described in the accompanying schedule of findings and questioned costs we identified a certain deficiency in internal control over financial reporting that we consider to be a material weakness.
10120 N. Oracle Road, Tucson, Arizona 85704Tel: (520) 742-2611 Fax: (520) 742-2718
HEINFELD, MEECH & CO., P.C.CERTIFIED PUBLIC ACCOUNTANTS
Hein
feld, Meech & Co.th
1986-2011
25Anniversary

Page 93
A deficiency in internal control exists when the design or operation of a control does not allow management or employees, in the normal course of performing their assigned functions, to prevent, or detect and correct misstatements on a timely basis. A material weakness is a deficiency, or combination of deficiencies, in internal control such that there is a reasonable possibility that a material misstatement of the entity’s financial statements will not be prevented, or detected and corrected on a timely basis. We consider the deficiency described in the accompanying schedule of findings and questioned costs as item 2011-1 to be a material weakness. Compliance and Other Matters As part of obtaining reasonable assurance about whether Valley Metro Regional Public Transportation Authority’s financial statements are free of material misstatement, we performed tests of its compliance with certain provisions of laws, regulations, contracts, and grant agreements, noncompliance with which could have a direct and material effect on the determination of financial statement amounts. However, providing an opinion on compliance with those provisions was not an objective of our audit, and accordingly, we do not express such an opinion. The results of our tests disclosed no instances of noncompliance or other matters that are required to be reported under Government Auditing Standards. Valley Metro Regional Public Transportation Authority’s response to the finding identified in our audit is described in the accompanying schedule of findings and questioned costs. We did not audit Valley Metro Regional Public Transportation Authority’s response and, accordingly, we express no opinion on it. This report is intended solely for the information and use of management, the Board of Directors, others within the entity, federal awarding agencies, and pass-through entities and is not intended to be and should not be used by anyone other than these specified parties. HEINFELD, MEECH & CO., P.C. Certified Public Accountants February 27, 2012

Page 94
REPORT ON COMPLIANCE WITH REQUIREMENTS THAT COULD HAVE A DIRECT AND MATERIAL EFFECT
ON EACH MAJOR PROGRAM AND ON INTERNAL CONTROL OVER COMPLIANCE IN ACCORDANCE WITH OMB CIRCULAR A-133
Independent Auditors’ Report
Board of Directors Valley Metro Regional Public Transportation Authority Compliance We have audited Valley Metro Regional Public Transportation Authority’s compliance with the types of compliance requirements described in the OMB Circular A-133 Compliance Supplement that could have a direct and material effect on each of Valley Metro Regional Public Transportation Authority’s major federal programs for the year ended June 30, 2011. Valley Metro Regional Public Transportation Authority’s major federal programs are identified in the summary of auditors’ results section of the accompanying schedule of findings and questioned costs. Compliance with the requirements of laws, regulations, contracts, and grants applicable to each of its major federal programs is the responsibility of Valley Metro Regional Public Transportation Authority’s management. Our responsibility is to express an opinion on Valley Metro Regional Public Transportation Authority’s compliance based on our audit. We conducted our audit of compliance in accordance with auditing standards generally accepted in the United States of America; the standards applicable to financial audits contained in Government Auditing Standards, issued by the Comptroller General of the United States; and OMB Circular A-133, Audits of States, Local Governments, and Non-Profit Organizations. Those standards and OMB Circular A-133 require that we plan and perform the audit to obtain reasonable assurance about whether noncompliance with the types of compliance requirements referred to above that could have a direct and material effect on a major federal program occurred. An audit includes examining, on a test basis, evidence about Valley Metro Regional Public Transportation Authority’s compliance with those requirements and performing such other procedures as we considered necessary in the circumstances. We believe that our audit provides a reasonable basis for our opinion. Our audit does not provide a legal determination of Valley Metro Regional Public Transportation Authority’s compliance with those requirements. In our opinion, Valley Metro Regional Public Transportation Authority complied, in all material respects, with the compliance requirements referred to above that could have a direct and material effect on each of its major federal programs for the year ended June 30, 2011.
10120 N. Oracle Road, Tucson, Arizona 85704Tel: (520) 742-2611 Fax: (520) 742-2718
HEINFELD, MEECH & CO., P.C.CERTIFIED PUBLIC ACCOUNTANTS
Hein
feld, Meech & Co.th
1986-2011
25Anniversary

Page 95
Internal Control Over Compliance Management of Valley Metro Regional Public Transportation Authority is responsible for establishing and maintaining effective internal control over compliance with the requirements of laws, regulations, contracts, and grants applicable to federal programs. In planning and performing our audit, we considered Valley Metro Regional Public Transportation Authority’s internal control over compliance with the requirements that could have a direct and material effect on a major federal program to determine the auditing procedures for the purpose of expressing our opinion on compliance and to test and report on internal control over compliance in accordance with OMB Circular A-133, but not for the purpose of expressing an opinion on the effectiveness of internal control over compliance. Accordingly, we do not express an opinion on the effectiveness of Valley Metro Regional Public Transportation Authority’s internal control over compliance. A deficiency in internal control over compliance exists when the design or operation of a control over compliance does not allow management or employees, in the normal course of performing their assigned functions, to prevent, or detect and correct, noncompliance with a type of compliance requirement of a federal program on a timely basis. A material weakness in internal control over compliance is a deficiency, or combination of deficiencies, in internal control over compliance, such that there is a reasonable possibility that material noncompliance with a type of compliance requirement of a federal program will not be prevented, or detected and corrected, on a timely basis. Our consideration of internal control over compliance was for the limited purpose described in the first paragraph of this section and was not designed to identify all deficiencies in internal control over compliance that might be deficiencies, significant deficiencies or material weaknesses. We did not identify any deficiencies in internal control over compliance that we consider to be material weaknesses, as defined above. Schedule of Expenditures of Federal Awards We have audited the financial statements of the governmental activities, the business-type activities, and each major fund, of Valley Metro Regional Public Transportation Authority as of and for the year ended June 30, 2011, and have issued our report thereon dated February 27, 2012, which was modified as to consistency because of the implementation of Governmental Accounting Standards Board Statement No. 54. Our audit was performed for the purpose of forming opinions on the financial statements that collectively comprise Valley Metro Regional Public Transportation Authority’s basic financial statements. The accompanying schedule of expenditures of federal awards is presented for purposes of additional analysis as required by OMB Circular A-133, and is not a required part of the basic financial statements. Such information is the responsibility of management and was derived from and relates directly to the underlying accounting and other records used to prepare the financial statements. The information has been subjected to the auditing procedures applied in the audit of the financial statements and certain additional procedures, including comparing and reconciling such information directly to the underlying accounting and other records used to prepare the financial statements or to the financial statements themselves, and other additional procedures in accordance with auditing standards generally accepted in the United States of America. In our opinion, the schedule of expenditures of federal awards is fairly stated in all material respects in relation to the financial statements taken as a whole.

Page 96
This report is intended solely for the information and use of management, the Board of Directors, others within the entity, federal awarding agencies and pass-through entities and is not intended to be and should not be used by anyone other than these specified parties. HEINFELD, MEECH & CO., P.C. Certified Public Accountants February 27, 2012

VALLEY METRO REGIONAL PUBLIC TRANSPORTATION AUTHORITY SCHEDULE OF FINDINGS AND QUESTIONED COSTS
YEAR ENDED JUNE 30, 2011
Page 97
SUMMARY OF AUDITORS’ RESULTS Financial Statements Type of auditors’ report issued: Unqualified Internal control over financial reporting:
Material weakness(es) identified? X yes no Significant deficiency(ies) identified? yes X none reported
Noncompliance material to financial statements noted? yes X no Federal Awards Internal control over major programs:
Material weakness(es) identified? yes X no Significant deficiency(ies) identified? yes X none reported
Type of auditors’ report issued on compliance for major
programs:
Unqualified Any audit findings disclosed that are required to be reported in
accordance with section 510(a) of OMB Circular A-133?
yes X no Identification of major programs: CFDA Numbers Name of Federal Program or Cluster 20.500, 20.507 Federal Transit Cluster 20.516, 20.521 Transit Services Program Cluster 20.200 Highway Research and Development Program Dollar threshold used to distinguish between Type A and Type
B programs:
$309,919 Auditee qualified as low-risk auditee? X yes no

VALLEY METRO REGIONAL PUBLIC TRANSPORTATION AUTHORITY SCHEDULE OF FINDINGS AND QUESTIONED COSTS
YEAR ENDED JUNE 30, 2011
Page 98
FINDINGS RELATED TO FINANCIAL STATEMENTS REPORTED IN ACCORDANCE WITH GOVERNMENT AUDITING STANDARDS Reference Number: 2011-1 Type of Finding: Material weakness Description: Insufficient internal controls over financial reporting and the schedule of expenditures of federal awards CRITERIA The Authority’s management is responsible for establishing and maintaining internal controls that include controls for the generally accepted accounting principles (GAAP) basis financial statements issued by the Authority. The Authority’s system of internal controls must extend beyond the general ledger and the supporting schedules prepared by the Authority; rather it must also include controls over the GAAP basis financial statements. In addition, OMB Circular A-133 requires proper presentation of federal awards in the Schedule of Expenditures of Federal Awards. CONDITION/CONTEXT Management requested outside consultants prepare a draft of the financial statements, including related note disclosures. The outsourcing of these services is not unusual and is a result of management's cost benefit decision to rely on the accounting expertise of the consultants. The Authority's management did not have adequate internal control procedures in place over the financial statements issued by the Authority using the basis of accounting required by GAAP. In addition, the Authority’s internal controls over federal reporting for the Schedule of Expenditures of Federal Awards did not include a review process to ensure that Catalog of Federal Domestic Assistance (CFDA) numbers are correct. EFFECT Audit adjustments were necessary to properly state account balances, transaction classifications, and related note disclosures. In addition, incorrect presentation of a program CFDA number resulted in an understatement of expenditures; as a result, the program cluster was not audited as a major federal program as required in the prior year. CAUSE The Authority's limited resources contribute to difficulties in establishing controls over financial reporting at the financial statement level. In addition, a clerical error was made on the Schedule of Expenditures and Federal Awards.

VALLEY METRO REGIONAL PUBLIC TRANSPORTATION AUTHORITY SCHEDULE OF FINDINGS AND QUESTIONED COSTS
YEAR ENDED JUNE 30, 2011
Page 99
FINDINGS RELATED TO FINANCIAL STATEMENTS REPORTED IN ACCORDANCE WITH GOVERNMENT AUDITING STANDARDS (Concl’d) Reference Number: 2011-1 RECOMMENDATION The Authority must design and implement effective internal control procedures to ensure the financial statements and related notes are complete and free from material misstatements and misclassification. Specifically, the Authority should use checklists to aid in the review of the financial statements and related notes to the financial statements. The Authority's personnel should obtain additional training to increase their understanding of the GAAP basis financial statements drafted by the consulting firm as well as the related adjusting entries and reclassifications notated throughout the audit of the Authority's financial statements. In addition, the Authority must design and implement effective internal control procedures to ensure the federal reporting and presentation of the Schedule of Expenditures of Federal Awards and related notes are free from material misstatements and misclassification. Such controls should include a review of the Schedule of Expenditures and Federal Awards to include verification of CFDA numbers. VIEWS OF RESPONSIBLE OFFICIALS AND PLANNED CORRECTIVE ACTIONS The Authority concurs with this recommendation and will implement a checklist to aid in the review of the financial statements. As budget allows, personnel will obtain ongoing training to increase their understanding of the GAAP basis financial statements. In addition, we have asked the Federal grantee to include in the Intergovernmental agreements verification of CFDA numbers for all future grants.

VALLEY METRO REGIONAL PUBLIC TRANSPORTATION AUTHORITY SUMMARY SCHEDULE OF PRIOR AUDIT FINDINGS
YEAR ENDED JUNE 30, 2011
Page 100
Status of Federal Award Findings and Questioned Costs Reference Number: 2010-1 Program Name: Federal Transit Cluster CFDA Nos.: 20.500, 20.507 Status: Corrected.

101 N 1st Avenue, Suite1100 • Phoenix, Arizona 85003
602-262-7433 • www.ValleyMetro.org