Embed Size (px)
Citation preview

FOURTH QUARTER AND FISCAL YEAR 2017 EARNINGS PRESENTATIONJuly 20, 2017

2
Forward-Looking Statements
This presentation contains certain forward‐looking statements.Such forward‐looking statements are subject to various risks anduncertainties, including the conditions of the children’s book andeducational materials markets and acceptance of the Company’sproducts in those markets, as well as other risks and factorsidentified from time to time in the Company’s filings with theSecurities and Exchange Commission. Actual results could differmaterially from those currently anticipated.

3
Regulation G
Today’s comments include references to certain non‐GAAPfinancial measures as defined in Regulation G. Thereconciliation of these non‐GAAP financial measures with therelevant GAAP financial information and other informationrequired by Regulation G is provided in the Company’s earningsrelease, which is posted on the Company’s investor relationswebsite at investor.scholastic.com.

4
Dick Robinson
Chief Executive Officer, Presidentand Chairman

Fiscal 2017 Highlights
5
• Solid 2017 with strong Trade publishing and market share growth in Education
• Harry Potter and the Cursed Child, Parts One and Two – the year’s best selling book across all genres
• Revenues +4% to $1.74 billion; +5% excluding foreign exchange
• Full year operating margins improved in all three segments
• Full year operating results met or exceeded guidance:
Metric Actual GuidanceRevenue $1.74 billion $1.7 ‐ $1.8 billionEPS, ex. one‐times $1.83 $1.60 ‐ $1.70Free Cash Flow $48.8 million $40 ‐$50 million

• A three‐year plan to drive future growth and profitability as we approach our 100th Anniversary in October 2020
• Reduce operating costs by simplifying business processes
• Expand revenue opportunities with more targeted marketing and sales initiatives
• Lower technology costs through single enterprise architecture
• Improve real‐time visibility to product movement, leading to operations and fulfillment savings
• Expected to substantially increase operating income in fiscal ‘19, ‘20 and ‘21 through revenue improvements and cost reductions
Scholastic 2020
6

Scholastic Reach in Schools
7

Key Business Overview - Education
8
Education
• Executing strategy to deliver a complete Pre‐K to 6 core literacy program to districts and schools – expanding opportunities beyond historical focus on supplemental materials
• Substantially expanded curriculum publishing programs, field organization and suite of digital subscription products
• Deepen foundational skills focus, while building on highly successful classroom magazines
• Significant opportunity to take larger share of Pre‐K to 6 education market in the U.S. as a substitute for basal textbooks
Key Business Overview – Children’s Books
9
Children’s Book Publishing and Distribution
• Improving Book Fairs revenue per fair in most profitable segments by using more robust business analytics to right‐size fair types and target growth opportunities in higher demographic markets
• Simplified Book Clubs program, eliminating the single grade offers to focus on traditionally successful multi‐grade offerings – teachers to have access to a wider range of titles
• Trade returning to normal levels after 2017’s successful new Harry Potter releases with focus on new books in bestselling series like Dog Man, Wings of Fire, and Jedi Academy

Key Business Overview – International
10
International
• No new Harry Potter titles in Canada or Export, but expect increased growth in Asia as we strengthen our management and sales teams
• Greater emphasis on expanding our international education business in both mature and emerging markets with key products including: LitProTM; Learner; BookflixTM/TrueflixTM; PR1METM Mathematics, Classroom Libraries, and others
• International trade publishing continues to grow throughout the region
• High single‐digit growth in Asia expected in each of the next three years

Real Estate Update
11
• New workspace redefines Scholastic and complements the Scholastic 2020 plan
• Bright office environment, new technology, refreshed feeling to the workspace – will bring most of NY‐based staff together in one building upon completion in December
• Completing agreement with LVMH’s Sephora unit – one of the world’s most successful retailers – to occupy the newly designed retail space at 557 Broadway through 2033, when it becomes available next year

12
Maureen O’Connell
Executive Vice President,Chief Administrative Officer and CFO

13
Income Statement
1. In the twelve months ended May 31, 2017, the Company recognized pretax exit costs related to its software distribution business in Australia of $0.5.2. In the three and twelve months ended May 31, 2017, the Company recognized pretax severance expense as part of cost reduction programs of $4.6 and $12.9, respectively. In the three and
twelve months ended May 31, 2016, the Company recognized pretax severance expense as part of cost reduction programs of $5.2 and $9.5, respectively. In the twelve months ended May 31, 2016, the Company recognized a pretax charge related to a warehouse optimization project in the Company's book fairs operations of $1.5 and pretax transaction costs of $0.4.
3. In the three and twelve months ended May 31, 2017, the Company recognized a pretax impairment charge related to certain website development assets of $5.7 and certain legacy prepublication assets of $1.1. In the three and twelve months ended May 31, 2016, the Company recognized a pretax impairment charge related to legacy building improvements of $7.5. In the twelve months ended May 31, 2016, the Company recognized pretax impairment charges related to certain legacy prepublication assets of $6.9.
4. In the twelve months ended May 31, 2016, the Company recognized a pretax gain on sale of investment of $2.2 related to an investment in China.
As One‐Time Excluding As One‐Time Excluding As One‐Time Excluding As One‐Time ExcludingReported Items One‐Time Items Reported Items One‐Time Items Reported Items One‐Time Items Reported Items One‐Time Items
Revenues $499.6 $499.6 $513.8 $513.8 $1,741.6 $1,741.6 $1,672.8 $1,672.8
Cost of goods sold 1 213.2 ‐ 213.2 212.7 212.7 814.5 (0.5) 814.0 762.3 762.3
Selling, general and administrative expenses 2 203.6 (4.6) 199.0 223.2 (5.2) 218.0 781.7 (12.9) 768.8 777.3 (11.4) 765.9
Bad debt expense 1.7 1.7 3.4 3.4 11.0 11.0 12.3 12.3
Depreciation and amortization 10.1 10.1 8.6 8.6 38.7 38.7 38.9 38.9
Asset impairments 3 6.8 (6.8) ‐ 7.5 (7.5) ‐ 6.8 (6.8) ‐ 14.4 (14.4) ‐
Total operating costs and expenses 435.4 (11.4) 424.0 455.4 (12.7) 442.7 1,652.7 (20.2) 1,632.5 1,605.2 (25.8) 1,579.4
Operating income (loss) $64.2 $11.4 $75.6 $58.4 $12.7 $71.1 $88.9 $20.2 $109.1 $67.6 $25.8 $93.4
Other expense (income) ‐ ‐ ‐ ‐ ‐ ‐ ‐ ‐
Interest expense, net ‐ ‐ 0.3 0.3 1.0 1.0 1.1 1.1
(Gain) loss on investments 4 ‐ ‐ ‐ ‐ ‐ ‐ (2.2) (2.2)
Provision (benefit) for income taxes 24.6 4.4 29.0 23.2 5.1 28.3 35.4 7.8 43.2 24.7 10.3 35.0
Earnings (loss) from continuing operations $39.6 $7.0 $46.6 $34.9 $7.6 $42.5 $52.5 $12.4 $64.9 $44.0 $15.5 $59.5
Earnings (loss) from discontinued operations, net of tax (0.2) (0.2) (0.9) (0.9) (0.2) (0.2) (3.5) (3.5)
Net Income (loss) $39.4 $7.0 $46.4 $34.0 $7.6 $41.6 $52.3 $12.4 $64.7 $40.5 $15.5 $56.0
Earnings (loss) per diluted share from continuing operations 1.11 0.20 1.31 1.00 0.22 1.22 1.48 0.35 1.83 1.26 0.44 1.70
Earnings (loss) per diluted share from discontinued operations, net of tax (0.01) (0.01) (0.03) (0.03) (0.01) (0.01) (0.10) (0.10)
Earnings (loss) per diluted share 1.10 0.20 1.30 0.97 0.22 1.19 1.47 0.35 1.82 1.16 0.44 1.60
In $ Millions (except per share) Fiscal Year to Date 2016Fiscal Year to Date 2017Fourth Quarter 2017 Fourth Quarter 2016

14
Segment Results
1. In the twelve months ended May 31, 2016, the Company recognized a pretax charge related to a warehouse optimization project in the Company's book fairs operations of $1.5.2. In the three and twelve months ended May 31, 2017, the Company recognized a pretax impairment charge associated with certain legacy prepublication assets of $1.1. In the twelve months ended
May 31, 2016, the Company recognized a pretax impairment charge associated with certain legacy prepublication assets of $6.9.3. In the three and twelve months ended May 31, 2017, the Company recognized pretax severance expense as part of cost reduction programs of $0.7 and $0.9, respectively. In the twelve months
ended May 31, 2017, the Company recognized pretax exit costs related to its software distribution business in Australia of $0.5. In the three and twelve months ended May 31, 2016, the Company recognized pretax severance expense as part of cost reduction programs of $0.7 and $0.9, respectively.
4. In the three and twelve months ended May 31, 2017, the Company recognized a pretax impairment charge related to certain website development assets of $5.7. In the three and twelve months ended May 31, 2017, the Company recognized pretax severance expense as part of cost reduction programs of $3.9 and $12.0, respectively. In the three and twelve months ended May 31, 2016, the Company recognized a pretax impairment charge related to legacy building improvements of $7.5 and pretax severance expense as part of cost reduction programs of $4.5 and $8.6, respectively. In the twelve months ended May 31, 2016, the Company recognized pretax transaction costs of $0.4.
As One‐Time Excluding As One‐Time Excluding As One‐Time Excluding As One‐Time ExcludingReported Items One‐Time Items Reported Items One‐Time Items Reported Items One‐Time Items Reported Items One‐Time Items
Children's Book Publishing and Distribution
Revenue
Book Clubs $59.5 $59.5 $67.9 $67.9 $235.8 $235.8 $268.8 $268.8
Book Fairs 180.0 180.0 186.1 186.1 508.4 508.4 520.4 520.4
Consolidated Trade 43.3 43.3 45.7 45.7 307.9 307.9 211.7 211.7
Total revenue 282.8 282.8 299.7 299.7 1,052.1 1,052.1 1,000.9 1,000.9
Operating income (loss) 1 51.9 ‐ 51.9 58.0 ‐ 58.0 143.1 ‐ 143.1 120.6 1.5 122.1
Operating margin 18.4% 18.4% 19.4% 19.4% 13.6% 13.6% 12.0% 12.2% Education
Revenue 126.3 126.3 113.0 113.0 312.7 312.7 299.7 299.7
Operating income (loss) 2 42.9 1.1 44.0 39.1 ‐ 39.1 50.7 1.1 51.8 42.8 6.9 49.7
Operating margin 34.0% 34.8% 34.6% 34.6% 16.2% 16.6% 14.3% 16.6%
International
Revenue 90.5 90.5 101.1 101.1 376.8 376.8 372.2 372.2
Operating income (loss) 3 2.2 0.7 2.9 4.3 0.7 5.0 18.7 1.4 20.1 11.4 0.9 12.3
Operating margin 2.4% 3.2% 4.3% 4.9% 5.0% 5.3% 3.1% 3.3%
Overhead expense 4 $32.8 ($9.6) $23.2 $43.0 ($12.0) $31.0 $123.6 ($17.7) $105.9 $107.2 ($16.5) $90.7
Operating income (loss) $64.2 $11.4 $75.6 $58.4 $12.7 $71.1 $88.9 $20.2 $109.1 $67.6 $25.8 $93.4
In $ Millions (except per share)Fiscal Year to Date 2016Fourth Quarter 2017 Fiscal Year to Date 2017Fourth Quarter 2016

Capital Investment Update
15
• FY2017 Capital Expenditures included:
• $30.6 million for strategic technology upgrades and initiatives as part of our multi‐year transformational technology investment program
• $20.6 million to redesign and commence upgrades on our headquarters building (of the two‐year $65‐$70 million budget for this project)
• Technology investments – enabling us to better use customer data analytics, simplify our business practices, communicate more effectively with customers, and leverage our investments across all business groups
• Real estate investments – creating a workplace that integrates scalable technology to increase capacity and improve productivity; and free up higher value Broadway‐facing retail space
16
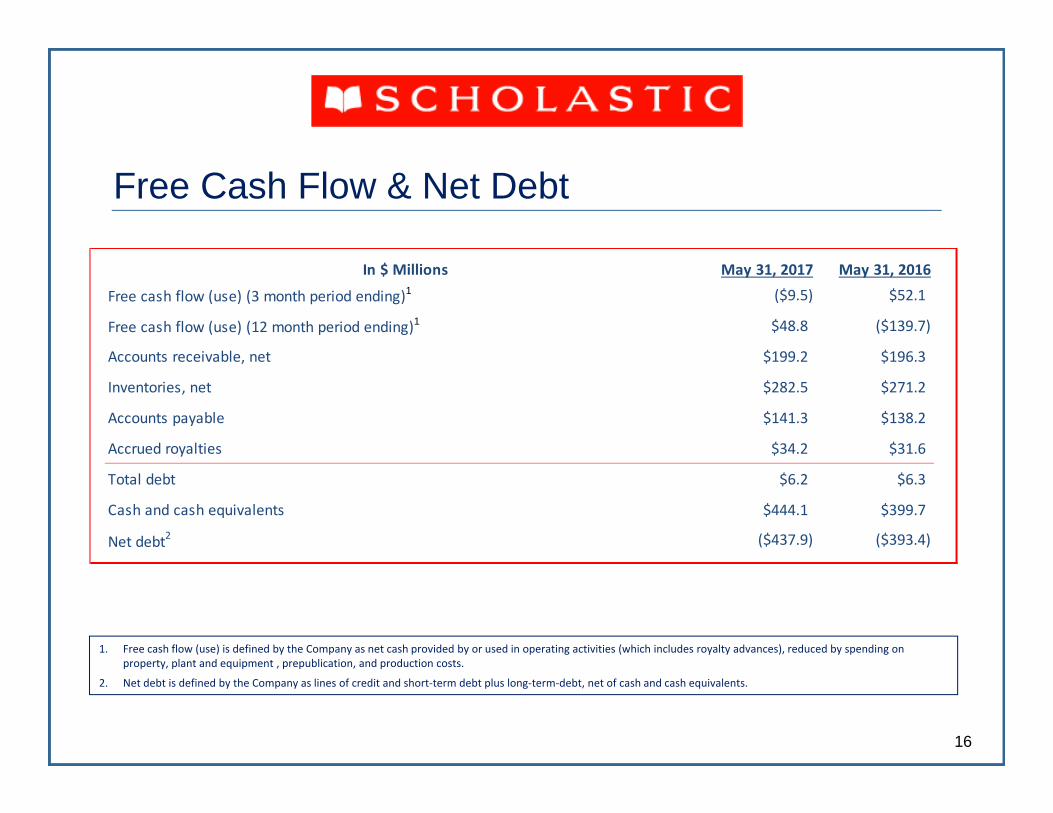
Free Cash Flow & Net Debt
1. Free cash flow (use) is defined by the Company as net cash provided by or used in operating activities (which includes royalty advances), reduced by spending on property, plant and equipment , prepublication, and production costs.
2. Net debt is defined by the Company as lines of credit and short‐term debt plus long‐term‐debt, net of cash and cash equivalents.
In $ Millions May 31, 2017 May 31, 2016
Free cash flow (use) (3 month period ending)1 ($9.5) $52.1
Free cash flow (use) (12 month period ending)1 $48.8 ($139.7)
Accounts receivable, net $199.2 $196.3
Inventories, net $282.5 $271.2
Accounts payable $141.3 $138.2
Accrued royalties $34.2 $31.6
Total debt $6.2 $6.3
Cash and cash equivalents $444.1 $399.7
Net debt2 ($437.9) ($393.4)

Fiscal 2018 Overview
17
• Scholastic 2020 will align our investments in strategic technology, facilities, people and content, and will create a performance management structure and system for change that will drive higher revenues and reduce costs in 2019, 2020 and 2021
• Projecting lower operating income due to the absence of new Harry Potter titles, which helped drive a 45% increase in trade revenues in 2017; expect double digit growth in OI, ex. Harry Potter in 2018
• Continuing planned investments in strategic technology and facilities
• Construction spend will exceed 2017 levels due in part to the timing of payments and the scheduled completion of the project
• Expect technology spend to be higher as we have begun the upgrades to our Oracle ERP system for financial management, manufacturing, transportation and logistics.
• Expect free cash use of $10 ‐ $20 million with CapEx of $90 ‐$100 million

18
Fiscal 2018 Outlook
Metric Guidance
Revenue $1.65 ‐ $1.7 billion
Earnings from Continuing Operations 1 $1.20 ‐ $1.30 per diluted share
Free Cash Use $10 ‐ $20 million
Capital Expenditures $90 ‐ $100 million
Prepublication/Production Spending $30 ‐ $40 million
1. Outlook for EPS and operating income excludes severance and other one‐time items associated with restructuring actions, as well as non‐cash, non‐operating items.

Fiscal 2018 Outlook – Key Elements
19
• Children’s Books• Trade revenue return to more normal levels after strong 2017 Harry Potter
performance
• Exciting market opportunities with Harry Potter’s 20th anniversary in the fall of 2018
• Expect low‐ to mid‐single digit revenue growth in clubs and fairs
• Education• Plan to grow revenues in Pre‐K to 6 balanced literacy program and capture
increased market share for core literacy curriculum, guided and leveled reading, classroom books and professional services
• Anticipate revenue growth in the mid‐single digits
• International• Revenue is expected to be level with the past year, with growth in most countries,
offset by a return to more typical levels in Canada and Export after last year’s gains driven by new Harry Potter titles
• Expect enhanced sales force in Asia to lead to growth in direct sales in that region

20
Questions & Answers
Participants
• Richard Robinson
• Maureen O’Connell
• Judy Newman, School Book Clubs and E‐Commerce

21