Embed Size (px)
Citation preview

First Half Year 2012 Results – Analyst presentation24 August 2012

2
Forward-looking statement
This document contains statements of a forward-looking nature, based on currently available plans
and forecasts. Given the dynamics of the markets and the environments of the 31 countries in which
Vopak renders logistics services, the company cannot guarantee the accuracy and completeness of
forward-looking statements.
Unforeseen circumstances include, but are not limited to, exceptional income and expense items,
unexpected economic, political and foreign exchange developments, and possible changes to IFRS
reporting rules.
Statements of a forward-looking nature issued by the company must always be assessed in the
context of the events, risks and uncertainties of the markets and environments in which Vopak
operates. These factors could lead to actual results being materially different from those expected.
HY1 2012 results 24 August 2012

3
Contents
Achievements
Business environment and strategy update
Business performance
Results per division
Investments and financing
Outlook
HY1 2012 results 24 August 2012
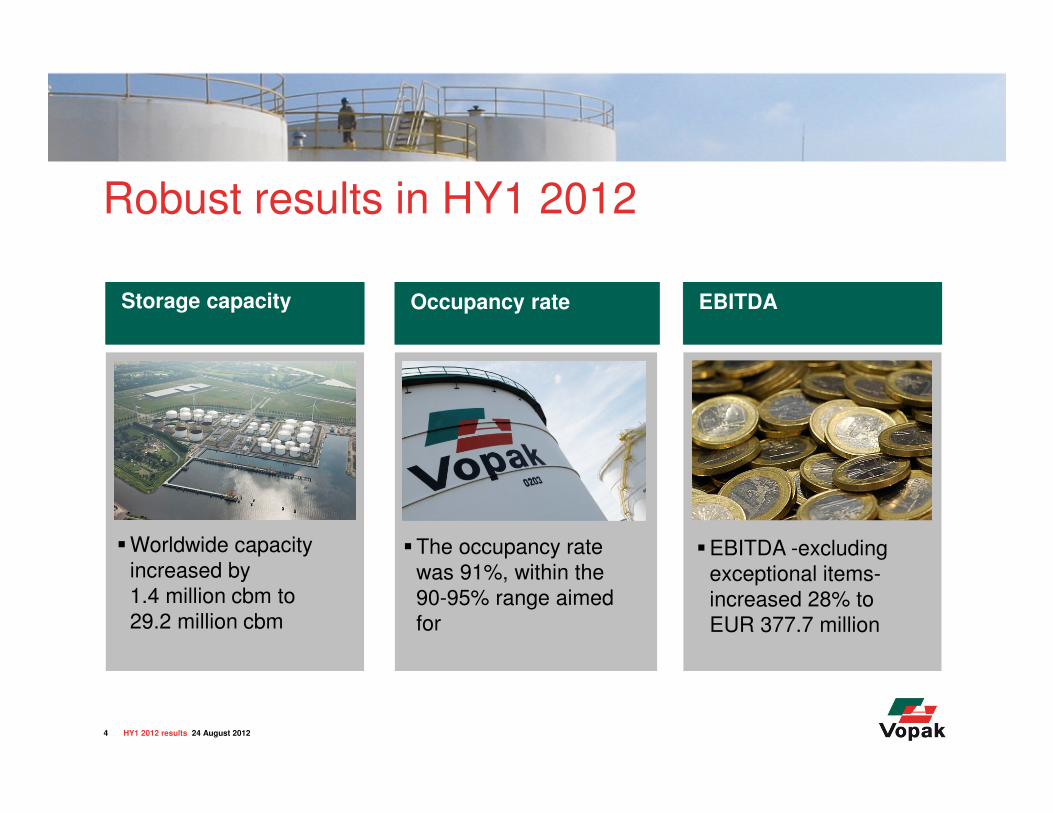
Robust results in HY1 2012
4
EBITDAOccupancy rateStorage capacity
�Worldwide capacity
increased by
1.4 million cbm to
29.2 million cbm
�The occupancy rate
was 91%, within the
90-95% range aimed
for
�EBITDA -excluding
exceptional items-
increased 28% to
EUR 377.7 million
HY1 2012 results 24 August 2012

Personal and process safety
5
-50%
HY1 2012
0.6
HY1 2011
1.2
HY1 2010
1.8
The lost time injury rate (LTIR) Total injuries leading to lost time per million hours worked
by own employees and contractors
-11%
HY1 2012
2.5
HY1 2011
2.8
HY1 2010
3.7
Process Incidents
Number of incidents
Total Injury RateTotal injuries per million hours worked by own employees
-25%
HY1 2012
66
HY1 2011
88
HY1 2010
63
HY1 2012 results 24 August 2012

6
Contents
Achievements
Business environment and strategy update
Business performance
Results per division
Investments and financing
Outlook
HY1 2012 results 24 August 2012

Global product trends drive Vopak’s markets
Oil products Chemical products Biofuels & VegoilsLNG
� Global crude oil
trade business
� Europe’s gasoline
surplus and deficit
for middle distillates
� Closures of some
less competitive
refineries in the
Atlantic Basin
� Increasing demand
in Asia and lower
demand in Europe
� Feedstock
advantage in Middle
East
� Gulf re-emerges due
to shale gas
� Flows between US-
Brazil-Europe-Asia
� Market is expected to
grow
� Impact of annual
harvest and
regulatory
uncertainties
� A globalizing natural
gas market with new
business models
� LNG growth due to
imbalances, security
of supply and
environmental push
7 HY1 2012 results 24 August 2012
Assets Coryton Houston VlaardingenSmall scale LNG
Example of growth project

8
Focused strategy and disciplined execution
Customer LeadershipOperational Excellence
Our Sustainability Foundation
• Excellent People
• Health and Safety
Our ability to construct,
operate and maintain
our terminals to
deliver our service at
competitive costs
Our ability to create
a relationship
with our customers
Our ability to find or
identify the right location
for our terminals
Growth Leadership
• Environment Care
• Responsible Partner
HY1 2012 results 24 August 2012

Global products trends resulting in company growth through healthy demand for storage capacity Capacity developments
In mln cbm
* Including net change at various terminals (including decommissioning).** Including the acquisition of the assets of the former Coryton refinery (UK) by means of a strategic consortium.
+5.3**
+1.4
31-12-2014
34.5
Acquisition
0.5
New terminals
3.8
Expansions
1.0
30-06-2012
29.2
Acquisition
0.1
New terminals
0.1
Expansions*
1.2
31-12-
2011
27.8
HY1 2012 results 24 August 2012 9

10
A’dam Westpoort 2 (100%)
582,000 cbm; oil products
Tianjin Lingang (50%)
95,300 cbm; chemicals
Note: Above examples not representative of all projects completed in HY1 2012.
Zhangjiagang (100%)
55,600 cbm; chemicals
Gothenburg (100%)
60,000 cbm; oil products
Commissioned
Acquired
Fujairah (33.3%)
611,000 cbm; oil products
HY1 2012 results 24 August 2012
Projects commissioned HY1 2012Storage capacity increased by 1.4 million cbm
Commissioned
(Joint Venture)

11
Under construction
Pengerang (44%)
1,278,000 cbm; oil products
Europoort (100%)
400,000 cbm; oil products
Eemshaven (50%)
660,000 cbm; oil products
Hainan (49%)
1,350,000 cbm; oil products
Algeciras (80%)
403,000 cbm; oil products
* Including the acquisition of the assets of the former Coryton refinery (UK) by means of a strategic consortium. Note: Above examples not representative of all projects under construction.
Assets Coryton (33.3%)
500,000 cbm; oil products
HY1 2012 results 24 August 2012
Acquired (Joint Venture)
Various projects under constructionTotal storage capacity under construction 5.3 million cbm*
Under construction
(Joint Venture)

Strengthening competitive position of services to our customers
12 HY1 2012 results 24 August 2012
Sa
fety
Eff
icie
nc
y

Vopak expects to achieve
its 2013 outlook of
EUR 725-800 million
EBITDA in 2012

It is Vopak’s ambition to realize an EBITDA of
EUR 1 billion in 2016The year of 400 years of
entrepreneurship

15
Contents
Achievements
Business environment and strategy update
Business performance
Results per division
Investments and financing
Outlook
HY1 2012 results 24 August 2012

Robust results in HY1 2012
16
HY1 2012
91
HY1 2011
92
2010
93
2009
94
2008
95
2007
96
2006
94
Occupancy rate
In percent
90-95%
28.3
2008
27.1
2007
21.8
2006
21.2
+3.7
HY1 2012
29.2
HY1 2011
25.5
2010
28.8
2009
Storage capacity
In mln cbm
2011
+28%
HY1 2012
377.7
598.2 636.0
297.3513.4
295.3
340.7300.9
2009 20102008
429.3
2007
369.5
2006
314.1
EBITDA Development*
In EUR mln
* Excluding exceptional items; including net result from Joint VenturesHY1 2012 results 24 August 2012

17
Financial performance is fuelled by different value drivers
Occupancy improvements
2003-06 2007-09 2010-2011 2012 >
Operational efficiency gains
Capacity expansion
PresentNear PastPastPresent/
Future
Playing field between 90 - 95%
HY1 2012 results 24 August 2012

18
Q2
90
Q1
93
Q4
94
Q3
93
Q2
93
Q1
92
Q4
92
Q3Q2
93
Q1
93
Q4
9293
Q3
93
Q2
95
Q1
95
Q4
95
Q3
94
Q2
95
Q1
96
’07
96
’06
94
’05
92
’04
84
Occupancy rate
In percent
90-95%
Healthy occupancy rates between 90-95%
2008 2009 2010 2011 2012
HY1 2012 results 24 August 2012

Vopak is well positioned to maintain healthy EBIT(DA) margins
19
EBIT(DA) Margin*
In percent
Focus on logistic efficiency improvements for our clients
has led to increased EBIT(DA) margins
* Excluding exceptional items; excluding net result from Joint Ventures.
EBIT Margin
EBITDA Margin
HY1 2012 results 24 August 2012
0
10
20
30
40
50
2004 2005 2006 2007 2008 2009 2010 2011 2012HY1 2012

20
Development of storage capacity
34.5
21.4
13.1
2013
32.7
20.9
11.8
2012
30.0
20.4
9.6
HY1 2012
29.2
20.4
8.8
2011
27.8
19.7
8.1
2010
28.8
18.3
10.5
2009
+5.3*+1.4
+7.9
2014
28.3
18.1
10.2
2008
27.1
17.5
9.6
2007
21.8
16.7
5.1
2006
21.2
15.8
5.4
2005
20.4
15.5
4.9
2004
20.2
15.1
5.1
2003
19.9
15.1
4.8
Storage capacity
In mln cbm
Subsidiaries
Joint Ventures
* Including the acquisition of the assets of the former Coryton refinery (UK) by means of a strategic consortium.
Note: for the Joint Ventures 100% of the storage capacity is included.HY1 2012 results 24 August 2012

Solid financial performance
21
EBIT*
In EUR million 648.1
+16%
HY1 2012HY1 2011
561.1
Revenues
In EUR million
* Including net result from Joint Ventures.** Attributable to holders of ordinary shares; including net result from Joint Ventures.Note: Excluding exceptional items.
279.9
+28%
HY1 2012HY1 2011
217.9
Earnings per share**
In EUR169.5
+37%
HY1 2012HY1 2011
123.5
Net profit**
In EUR million1.33
+37%
HY1 2012HY1 2011
0.97
HY1 2012 results 24 August 2012

All regions contribute to the 16% revenue increase
22
+19%
HY1 2012
78.4
HY1 2011
65.9
North America
Note: Revenues in EUR millions.
223.6
HY1 2012HY1 2011
185.7
+20%
Netherlands
+16%
174.1
HY1 2012HY1 2011
150.3
Asia
+11%
51.7
HY1 2012HY1 2011
46.5
Latin America
+7%
HY1 2012HY1 2011
110.6 117.8
EMEA
HY1 2012 results 24 August 2012
648.1
+16%
HY1 2011 HY1 2012
561.1
Revenues

EBIT excluding exceptional items increased by 28% to EUR 279.9 million
23
EBIT excl. exceptional items 217.9
Exceptional gain (loss) 117.5
EBIT incl. exceptional items 335.4
Net result Joint Ventures 167.2
Operating profit 168.2
279.9
0.0
279.9
56.6
223.3
HY1 2011
In EUR mln
HY1 2012
In EUR mln
Delta
In percent
33%
-66%
-17%
28%
Net profit excl. exceptional items* 123.5 169.5 37%
HY1 2012 results 24 August 2012
* Attributable to holders of ordinary shares.

Except from Latin America, all regions contribute to the 28% EBIT increase
24
HY1 2012
19.8
HY1 2011
16.9
+17%
North America
+38%
HY1 2012
94.2
HY1 2011
68.2
Netherlands
+15%
HY1 2012
107.2
HY1 2011
93.6
Asia
-7%
HY1 2012
12.7
HY1 2011
13.7
Latin America
+14%
HY1 2012
52.3
HY1 2011
45.7
EMEA
HY1 2012 results 24 August 2012
+28%
HY1 2012
279.9
HY1 2011
217.9
EBIT
Global LNG
HY1 2012
10.7
HY1 2011
-3.6
Note: EBIT in EUR million; excluding exceptional items; including net result from Joint Ventures

Net result of Joint Ventures increases with 34%, mainly due to Global LNG
25
0.0
HY1 2012
-100%*
1.2
HY1 2011
North America
0.6
HY1 2012
+20%
0.5
HY1 2011
Netherlands
+3%
HY1 2012
15.815.3
HY1 2011
Asia
+67%
HY1 2012
0.3
HY1 2011
0.5
Latin America
HY1 2012
26.4
HY1 2011
25.9
+2%
EMEA
HY1 2012 results 24 August 2012
56.6
+34%
HY1 2012HY1 2011
42.2
Net result of JVs
Global LNG
HY1 2012
13.4
HY1 2011
-1.0
* Due to the sale of Vopak’s 20% equity stake in BORCO (Bahamas).Note: Net result Joint Ventures in EUR million; Excluding exceptional items.

26
Revenues
HY1 2012
648.1
+16%
HY1 2011
561.1
Revenues Subsidiaries
HY1 2012
830.1
+21%685.9
HY1 2011
EBITDAEBITDASubsidiaries and net result from Joint Ventures
* Vopak consolidated including proportional consolidation of joint ventures in tank storage activities.Note: In million EUR; Excluding exceptional items.
HY1 2012
377.7
+28%295.3
HY1 2011
438.2
+34%
HY1 2012
327.7
HY1 2011
HY1 2012 results 24 August 2012
IFRS equity accounting Proportionate consolidation*
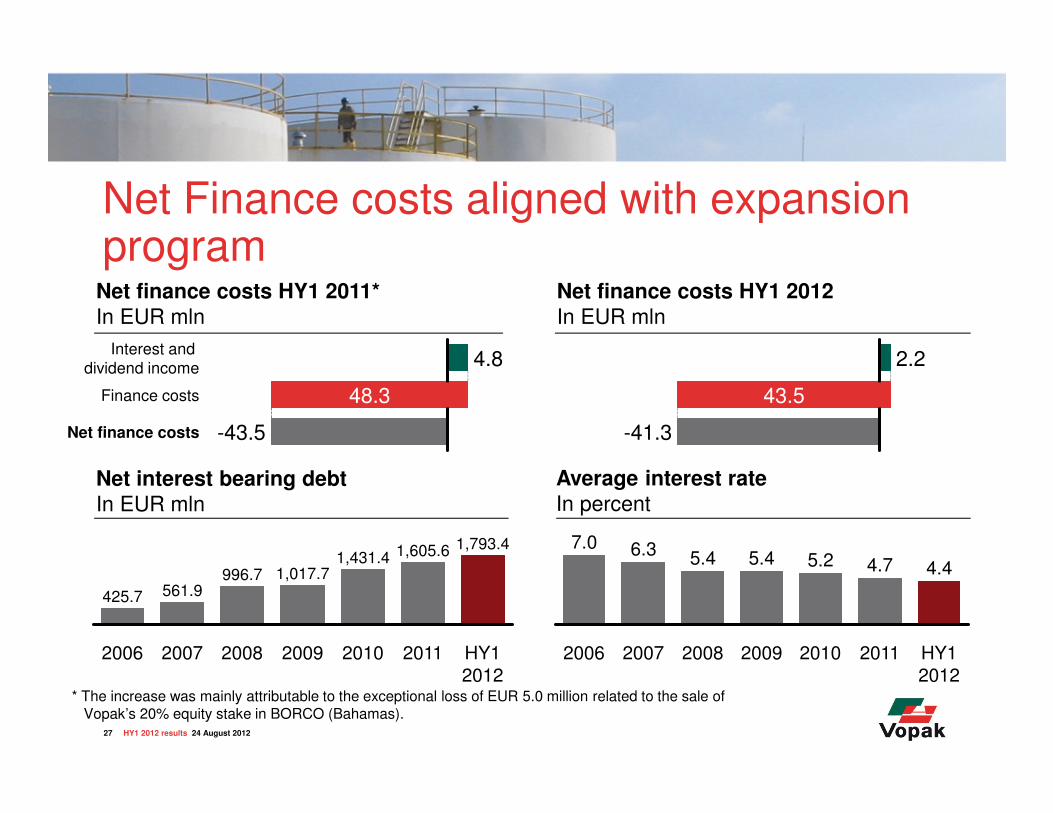
Net Finance costs aligned with expansion program
27
-43.5Net finance costs
4.8
48.3Finance costs
Interest and
dividend income
Net finance costs HY1 2011*
In EUR mln
43.5
-41.3
2.2
4.4
HY1 2012
2011
4.7
2010
5.2
2009
5.4
2008
5.4
2007
6.3
2006
7.0
Average interest rate
In percent
1,431.4
2010
1,605.6
20112009
1,017.7
2008
996.7
2007
561.9
2006
425.7
HY1 2012
1,793.4
Net interest bearing debt
In EUR mln
Net finance costs HY1 2012
In EUR mln
* The increase was mainly attributable to the exceptional loss of EUR 5.0 million related to the sale of Vopak’s 20% equity stake in BORCO (Bahamas).
HY1 2012 results 24 August 2012

Effective tax rate HY1 2012
28
Effective Tax Rate
In percent
+49%30.3
45.2
HY1 2012HY1 2011
TaxIn EUR mln
0.018.9 18.9
HY1 2012HY1 2011
8.9
10.0
� In 2011, EUR 108.5 million of book
gain on the sale of our 20% equity
stake in BORCO (Bahamas) was
exempted for tax purposes
� Excluding exceptional items, the
effective tax rate for HY1 2011
amounted to 18.9%
HY1 2012 results 24 August 2012

Sources and uses of cash in HY1 2012
29
Net Cash position
30/06/2012*
-9.7
FX
1.3
Other
financing
activities
210.9
Dividend
paid in
cash**
110.1
Derivatives
settlement
9.9
Disposals
19.2
Invest-
ments
296.6
Tax paid
20.9
Net finance
costs paid
34.7
Gross
operating
cash flow
298.1
Net Cash position 1/1/2012*
-67.0
Consolidated Statement of Cash Flows
In EUR mln
* Including bank overdrafts.** Including dividend paid in cash on financing preference shares.
HY1 2012 results 24 August 2012

FX translation-effect on EBIT
30 HY1 2012 results 24 August 2012
Total 2.3
Non allocated 0.0
Latin America 0.2
North America 1.6
Asia 2.2
EMEA (1.7)
2009In EUR mln
25.9
(0.8)
3.2
2.6
17.4
3.5
2010In EUR mln
2.6
0.1
(0.7)
(1.6)
5.4
(0.6)
2011In EUR mln
10.0
(0.3)
0.1
1.1
8.2
0.9
HY1 2012In EUR mln

Consequences IAS 19 Employee BenefitsEffect on comparative figures 2012 as a result of application amendment in 2013
31
Total effect on Equity attributableto owners of parent at 30 June 2012 -167.0
Net result recognized through
statement of income in HY1 20121.5
Total recognized directly in equitythrough Other comprehensive income -168.5
Income tax 31.7
Actuarial gains and losses
in HY1 2012123.9
Income tax 31.1
Actuarial gains and losses
at 1 January 2012107.4
Total effect on equityIn EUR mln
HY1 2012 results 24 August 2012
� Removal 10% corridor approach
(higher volatility in net pension
liability)
� Weighted average discount rate
reduced from 4.68% to 4.26%*
� Only service and net finance
cost in P&L (rest of changes in
other comprehensive income)
� Change of discount rate for the
expected returns on plan assets
(generally lower rate than used
under current IAS 19)* From 31 December 2011 to 30 June 2012.

32
Contents
Achievements
Business environment and strategy update
Business performance
Results per division
Investments and financing
Outlook
HY1 2012 results 24 August 2012

33
Q2 2012
48.3
Q1 2012
45.9
Q4 2011
46.2
Q3 2011
41.9
Q2 2011
34.7
Q1 2011
33.5
EBIT*
In EUR million
* Including net result from Joint Ventures; excluding exceptional items.
Storage capacityIn mln cbm
Occupancy rateIn percent
Netherlands- New oil storage capacity came on stream in Amsterdam Westpoort- Lower occupancy rates in crude and gasoil storage
HY1 2012 results 24 August 2012
HY1 2012HY1 2011
185.7 +20%223.6
9093-3pp
HY1 2012HY1 2011 HY1 2012HY1 2011
7.2 +22%8.8
RevenuesIn EUR million
+38%

34
28.2
Q2 2012Q1 2012
24.1
Q4 2011
23.3
Q3 2011
23.9
Q2 2011
23.3
Q1 2011
22.4
* Including net result from Joint Ventures; excluding exceptional items.
EMEA- New oil storage capacity came on stream in Fujairah- Lower occupancy rates at chemical terminals in Belgium
HY1 2012 results 24 August 2012
Storage capacityIn mln cbm
Occupancy rateIn percent
HY1 2012HY1 2011
110.6 117.8+7% 8890
-2pp
HY1 2012HY1 2011
9.0+10%
HY1 2012HY1 2011
8.2
EBIT*
In EUR million
RevenuesIn EUR million
+14%

35
Q2 2012Q1 2012
53.6
Q4 2011
46.7
Q3 2011
45.0 53.6
Q2 2011
46.2
Q1 2011
47.4
* Including net result from Joint Ventures; excluding exceptional items.
Asia- Continuous growth in Asia- Currency translation gain of EUR 8.2 million on EBIT
HY1 2012 results 24 August 2012
Storage capacityIn mln cbm
Occupancy rateIn percent
+16%150.3174.1
HY1 2012HY1 2011
95950pp
HY1 2012HY1 2011
+7%6.8
HY1 2012
7.3
HY1 2011
EBIT*
In EUR million
RevenuesIn EUR million
+15%

36
9.2
Q2 2012Q1 2012
10.6
Q4 2011
8.9
Q3 2011
8.0
Q2 2011
7.1
Q1 2011
9.8
North America- Higher occupancy rates - Improvements in markets for biofuels and chemicals
HY1 2012 results 24 August 2012
Storage capacityIn mln cbm
Occupancy rateIn percent
+19%
HY1 2012HY1 2011
65.978.4
9691+5pp
HY1 2012HY1 2011
0%2.3
HY1 2012HY1 2011
2.3
* Including net result from Joint Ventures; excluding exceptional items.
EBIT*
In EUR million
RevenuesIn EUR million
+17%

37
Q2 2012
5.3
Q1 2012
7.4
Q4 2011
7.5
Q3 2011
7.0
Q2 2011
6.4
Q1 2011
7.3
* Including net result from Joint Ventures; excluding exceptional items.
Latin America- New chemical storage capacity came on stream in Mexico- Lower occupancy rates in Brazil
HY1 2012 results 24 August 2012
Storage capacityIn mln cbm
Occupancy rateIn percent
51.7+11%
HY1 2012HY1 2011
46.5 8892-4pp
HY1 2012HY1 2011
1.00%
HY1 2012HY1 2011
1.0
EBIT*
In EUR million
RevenuesIn EUR million
-7%
38
Contents
Achievements
Business environment and strategy update
Business performance
Results per division
Investments and financing
Outlook
HY1 2012 results 24 August 2012

Capital disciplined growth: Total investments
39
~775-900
2,108
HY2 2012-
2014
~400
2009-
HY1 2012
1,514
2006-2008
Total Investments 2006-2014
In million EUR
Sustaining Capex**
* Yearly sustaining Capex is EUR 150-200 million. ** Including remaining equity share in Joint Ventures; excluding our part of Capex related to the upgrading of
the assets of the former Coryton refinery (UK).Note: Total Capex related to 4.8 mln cbm under construction is ~EUR 1.5 bln.
Expansion Capex*
~375-500297
711
565535
800
446
268
HY1
2012
201120102009200820072006
Total investments 2006-HY1 2012
In million EUR
HY1 2012 results 24 August 2012

Capital disciplined growth: Strategic finance
40
0
1
2
3
4
5
2011
2.65
2010
3.75
2.63
2009
2.23
2008
2.54
2007
1.71
2006
1.61
2005
1.76
2004
2.20
2003*
2.42
HY1 2012
2.70
Net senior debt : EBITDA ratio
* Based on Dutch GAAP.Note: Private placements and syndicated revolving credit facility per year-end 2011.
Maximum Ratio under current US PP program
Maximum Ratio under other PP programs and
syndicated revolving credit facility
Access to Capital Markets
�Syndicated Revol-
ving Credit Facility (EUR 1.2 billion)
�SGD and JPY
Private Placements(SGD 435 million and JPY 20 billion)
�US Private
Placements (EUR 856.7 million)
HY1 2012 results 24 August 2012

41
Contents
Achievements
Business environment and strategy update
Business performance
Results per division
Investments and financing
Outlook
HY1 2012 results 24 August 2012

Outlook assumptions
Note: width of the boxes do not represent actual percentages.42
~x% Share of EBIT
Solid
Oil products Chemicals Biofuels & Vegoils LNG
Robust
~60%
Steady Solid
<1%
Mixed
~17.5-20%
Industrial terminals
~12.5% ~7.5-10%
2011
~60-65% ~2.5-5%~17.5-20% ~7.5-10% ~5-7.5%
2013
HY1 2012 results 24 August 2012

Vopak expects to achieve its 2013 outlook of EUR 725-800 million EBITDA in 2012
43
377.7
2012
725-800
2011
636.0
2010
598.2
2009
513.4
2008
429.3
2007
369.5
2006
314.1
2005
262.5
2004
231.8
2013
725-800
EBITDA Development and outlookIn EUR million
Note: Excluding exceptional items; including net result from Joint Ventures
Historical results
Outlook
HY1 2012 results 24 August 2012

It is Vopak’s ambition to realize an EBITDA of
EUR 1 billion in 2016The year of 400 years of
entrepreneurship

Royal Vopak
Westerlaan 10 Tel: +31 10 4002911
3016 CK Rotterdam Fax: +31 10 4139829
The Netherlands www.vopak.com