Embed Size (px)
Citation preview

PHYSICAL REVIEW D 1 DECEMBER 1996VOLUME 54, NUMBER 11
0556
Finite temperature transitions in lattice QCD with Wilson quarks: Chiral transitionsand the influence of the strange quark
Y. Iwasaki, K. Kanaya, and S. KayaInstitute of Physics and Center for Computational Physics, University of Tsukuba, Ibaraki 305, Japan
S. SakaiFaculty of Education, Yamagata University, Yamagata 990, Japan
T. YoshieInstitute of Physics and Center for Computational Physics, University of Tsukuba, Ibaraki 305, Japan
~Received 23 May 1996; revised manuscript received 17 July 1996!
The nature of finite temperature transitions in lattice QCD with Wilson quarks is studied near the chiral limitfor the cases of two, three, and six flavors of degenerate quarks (NF52, 3, and 6! and also for the case ofmassless up and down quarks and a light strange quark (NF5211). Our simulations mainly performed onlattices with the temporal direction extensionNt54 indicate that the finite temperature transition in the chirallimit ~chiral transition! is continuous~or at most very weakly first order! for NF52, while it is of first order forNF53 and 6. We find that the transition is of first order for the case of massless up and down quarks and thephysical strange quark where we obtain a value ofmf /mr consistent with the physical value. This result isdifferent from the previous result with staggered quarks atNt54 which suggests that the transition in the realworld is a crossover. Since the deviation from the continuum limit is large in both studies atNt54, acalculation with largerNt or with an improved action would be needed in order to obtain a definite conclusionabout the nature of the QCD transition. We also discuss the phase structure at zero temperature as well as thatat finite temperatures.@S0556-2821~96!00823-5#
PACS number~s!: 12.38.Gc, 11.15.Ha, 11.30.Rd, 12.38.Mh
d
e
I. INTRODUCTION
One of the major goals of numerical studies in latticQCD is to determine the nature of the transition from thigh temperature quark-gluon-plasma phase to the low teperature hadron phase, which is supposed to occur atearly stage of the Universe and possibly at heavy ion cosions. It is, in particular, crucial to know whether the transtion is a first order phase transition or a smooth transiti~second order phase transition or crossover! to understandthe evolution of the Universe.
The determination of the order of the transition for thcase of degenerateNF flavors is an important step toward thunderstanding of the nature of the QCD transition in the rworld. We can compare the numerical results for varionumber of flavors with theoretical predictions based on tstudy of the effectives model @1,2#. In order to investigatewhat really happens in nature, we have to ultimately stuthe effect of the strange quark together with those of almmassless up and down quarks, because the critical tempture is of the same order of magnitude as the strange qumass.
In this article we investigate finite temperature transitioin lattice QCD using the Wilson formalism for quarks fovarious numbers of flavors (NF52, 3, and 6! near the chirallimit and also for the case of massless up and down quaand a light strange quark (NF5211). Most simulations offinite temperature QCD were performed with staggerquarks. However, because the Wilson formalism of fermioon the lattice is the only known formalism which possesselocal action for any number of flavors, it is important t
54-2821/96/54~11!/7010~22!/$10.00
ehem-thelli-i-on
eeealushe
dyostera-ark
nsr
rks
ednss ao
investigate the finite temperature transition with Wilsonquarks and compare the results with those for staggerequarks.
In Sec. II, we define our action and coupling parameters.Because chiral symmetry is explicitly broken on the lattice inthe Wilson formalism, we first define the chiral limit forWilson quarks and give a brief survey of the phase structurein Sec. III. Our simulation parameters are summarized inSec. IV. Numerical results for the chiral limit are summa-rized in Sec. V. We then discuss, in Sec. VI, problems andcaveats which appear in a study of the finite temperaturetransition with Wilson quarks when performed on latticesavailable with the present power of computers. Section VIIdeals with the transition in the chiral limit~chiral transition!in the degenerate cases ofNF52, 3, and 6. In Sec. VIII, westudy the influence of the strange quark on the QCD transi-tion both in the degenerateNF53 case and in a more real-istic case of massless up and down quarks with a massivstrange quark,NF5211. We finally conclude in Sec. IX.Preliminary reports are given in@3–5#.
II. ACTION AND COUPLING PARAMETERS
We use the standard one-plaquette gauge action
Sg52
g2(P ReTr~UP! ~1!
and the Wilson quark action@6#
7010 © 1996 The American Physical Society

t
z
l
,
54 7011FINITE TEMPERATURE TRANSITIONS IN LATTICE . . .
Sq52(f51
NF
(n,m
c f~n!D~Kf ,n,m!c f~m!, ~2!
D~K,n,m!5dn,m2K(m
$~12gm!Un,mdn1m,m
1~11gm!Um,m† dm1m,n%, ~3!
whereg is the bare coupling constant andK is the hoppingparameter. In the case of degenerateNF flavors, lattice QCDcontains two parameters: the gauge coupling consb56/g2 and the hopping parameterK. In the nondegeneratecase, the number of the hopping parameters isNF .
We denote the linear extension of a lattice in the tempodirection byNt and the lattice spacing bya.
III. BRIEF SURVEY OF PHASE STRUCTURE
In the Wilson formalism of fermions on the lattice, chirasymmetry is explicitly broken by the Wilson term even fovanishing bare quark mass@6#. The lack of chiral symmetrycauses much conceptual and technical difficulties in numcal simulations and physics interpretation of data. Therefbefore going into a discussion of the details of data aanalyses, we give a brief survey of the phase structure attemperature as well as that at finite temperatures@7,8#, in-cluding the results presented in this article.
A. Quark mass and PCAC relation
We first define the quark mass through an axial-vecWard identity@9,10#
2mq^ 0uPup~pW 50!&52mp^ 0uA4up~pW 50!&, ~4!
whereP is the pseudoscalar density andA4 the fourth com-ponent of the local axial vector current.„Note that we haveabsorbed a multiplicative normalization factor into the denition of the quark massmq , because this convention is suficient for our later study. We also note that there is anternative definition of the quark mass replacingmp with,e.g.,@12exp(2mpa)#/a, which gives a quark mass identicawith the above within the order ofa. …
FIG. 1. Pion screening mass squaredmp2a2 and twice the quark
mass 2mqa for NF52 atb50 on an 8231034 lattice. Errors aresmaller than the size of symbols. Solid curves are the resultsstrong coupling calculation, Eq.~6!.
ant
ral
lr
eri-orendero
tor
fi-f-al-
l
In general, Ward-Takahashi identities derived from chirasymmetry have corrections ofO(a) @9#. In the particularform of Eq. ~4!, we have absorbed theO(a) corrections inthe definition ofmq or, equivalently, in the value ofKc dis-cussed in the next subsection. Of course, theO(a) correc-tions in Eq.~4! with the other state vectors or in other Ward-Takahashi identities cannot be removed with this definitionof mq .
With this definition of quark mass, the PCAC~partiallyconserved axial-vector current! relation
mp2}mq , ~5!
which is expected to be satisfied near the continuum limitwas numerically first verified within numerical uncertaintiesfor the quenched QCD at zero temperature in@10,11# andsubsequently for various cases including QCD withNF52in @3,12–16#. It should be noted that the PCAC relation issatisfied not only in the continuum limit,b5`, but alsoeven in the strong coupling limit,b50: The result of thestrong coupling expansion without quark loops@12#,
cosh~mpa!511~1216K2!~124K2!
4K2~2212K2!,
2mqa5mpa4K2sinh~mpa!
124K2cosh~mpa!, ~6!
gives the relationmp2}mq at smallmq . Our numerical data
for NF52 at b50 agree well with these formulas withinerrors1 as shown in Fig. 1. We note that, if
^ 0uA4up~pW 50!&}mp ~7!
is satisfied for smallmq as is the case both forb50 andb5`, then the definition~4! implies that the PCAC relation~5! is exact. It should be also noted that Eq.~7! holds whenEuclidean invariance is recovered@10#.
Equation~4! implies that whenmq50, eithermp50 or
1In Ref. @12#, agreement between Eq.~6! and numerical data inthe confining phase is shown also for the caseNF518. Ther me-son mass, the nucleon mass, and theD mass also agree with corre-sponding strong coupling mass formulas.
of a
FIG. 2. Schematic graph for the chiral limit lineKc defined bymq50 ormp50 at T50 in the coupling parameter space (b,K).Also plotted are the curves wheremq50 andmp50 at finiteNt ,wheremp is the pion screening mass. See text for discussions.
7012 54IWASAKI, KANAYA, KAYA, SAKAI, AND YOSHIE´
TABLE I. Table of job parameters forNF52 simulations performed on an 8231034 lattice. Data marked with a dagger (†) are takenfrom our previous simulation@13# performed on an 8232034 lattice. The column ‘‘Algo.’’ is for the algorithm used for update (H or RwhereH is for the hybrid Monte Carlo algorithm andR is for theR algorithm! and for quark matrix inversion~CR or CG!. Ninv is an averagenumber of iterations needed for the quark matrix inversion. Errors forNinv are in most cases about 1%. The last column is for the initial andfinal phases (c is the low temperature confining phase,d is the high temperature deconfining phase, andm is the mix state!, whereparentheses mean that the system is not completely thermalized.
b K Dt t tot t therm Algo. Ninv Phase
0 0.2 0.02 1132 500 H-CR 37 c0 0.21 0.01 1005 500 H-CR 48 c0 0.22 0.01 1041 500 H-CR 45 c0 0.23 0.01 700 500 H-CR 95 c2 0.24 0.01 8 R-CG ;4000 d→(c)3 0.18 0.01 250 100 H-CR 37 c3 0.19 0.01 150 100 H-CR 35 c3 0.2 0.01 160 100 H-CR 48 c3 0.2352 0.01 16 R-CG ;4000 d→(c)3.5 0.175 0.01 160 100 H-CR 27 c3.5 0.185 0.01 160 100 H-CR 34 c3.5 0.195 0.01 160 100 H-CR 46 c3.5 0.2295 0.01 15 R-CG ;3500 d→(c)3.8 0.225 0.01 15 R-CG .3000 d→(c)3.9 0.224 0.01 22 R-CG .3000 d→(c)4 0.17 0.02 1650 500 H-CR 15 c4 0.18 0.02 2188 1000 H-CR 18 c4 0.19 0.02 1550 500 H-CR 23 c4 0.2226 0.002 50 24 H-CG 1054 d4.1 0.2211 0.005 92 50 H-CG 781 d4.2 0.2195 0.005 206 100 H-CG 430 d4.3 0.165 0.02 520 320 H-CR 23 c4.3 0.175 0.01 490 290 H-CR 28 c4.3 0.185 0.01 400 200 H-CR 39 c4.3 0.205 0.008 460 250 H-CR 250 d→c4.3 0.207 0.005 16 H-CG c4.3 0.207 0.005 30 H-CG d→(c)4.3 0.208 0.005 38 H-CG c4.3 0.208 0.005 45 H-CG d→(c)4.3 0.21 0.005 150 50 H-CG 820 d4.3 0.218 0.01 196 100 H-CG 338 d4.5 0.16 0.02 500 300 H-CR 25 c4.5 0.17 0.01 580 300 H-CR 34 c4.5 0.18 0.01 530 300 H-CR 42 c4.5 0.195 0.01 310 100 H-CR 92 c4.5 0.2 0.005 175 135 H-CR 280 c4.5 0.202 0.008 700 300 H-CG 473 d4.5 0.205 0.01 190 100 H-CG 314 d4.5 0.2143 0.01 197 100 H-CG 209 d5 0.14 0.02 500 300 H-CR 17 c5 0.15 0.02 520 300 H-CR 20 c5 0.16 0.02 600 300 H-CR 24 c5 0.17 0.01 540 300 H-CR 41 d→c5 0.18 0.01 640 200 H-CG 169 c→d5 0.19 0.01 720 300 H-CG 132 d5 0.1982 0.01 761 300 H-CG 118 c→d5.25 0.1 0.01 520 300 H-CR 12 c5.25 0.11 0.01 600 300 H-CR 13 c5.25 0.12 0.01 600 300 H-CR 15 c5.25 0.13 0.01 560 300 H-CR 17 c

54 7013FINITE TEMPERATURE TRANSITIONS IN LATTICE . . .
TABLE I. ~Continued!.
b K Dt t tot t therm Algo. Ninv Phase
5.25 0.14 0.01 580 300 H-CR 20 c5.25 0.15 0.01 520 300 H-CR 25 c5.25 0.155 0.01 520 300 H-CR 31 d→c5.25 0.16 0.01 540 300 H-CR 39 d→c5.25 0.165 0.01 600 300 H-CG 121 d5.25 0.175 0.01 610 300 H-CG 118 d5.25 0.18 0.01 640 300 H-CG 111 d5.5† 0.15 0.025 2500 800 H-CR 17 d5.5† 0.16 0.025 1572 500 H-CR 37 d5.5† 0.1615 0.025 1532 500 H-CR 43 d5.5† 0.163 0.025 1458 500 H-CR 53 d6 0.15 0.01 427 200 H-CG 73 d6 0.1524 0.01 230 150 H-CG 78 d6 0.155 0.01 427 200 H-CG 80 d6 0.16 0.01 400 200 H-CG 83 d10 0.13 0.01 351 200 H-CG 48 d10 0.14 0.01 400 200 H-CG 78 d10 0.15 0.01 338 200 H-CG 60 d
e
-
^ 0uA4up(pW 50)&50. This further implies, when we definthe pion decay constantfp by
^ 0uA4up~pW 50!&5mp f p , ~8!
that whenmq50, eithermp50 or f p50 is satisfied. Notethat f p50 is the relation which should be satisfied whechiral symmetry is restored, and thatmp50 is the relationwhen chiral symmetry is spontaneously broken, both inchiral limit. It might be emphasized that although the actidoes not possess chiral symmetry, either relationmp50 orf p50 holds in the massless quark limit when the quark mis defined by Eq.~4!. In particular, in the confining phasemp50 whenmq50 and vice versa.
B. Definition of the chiral limit and phase structureat zero temperature
We identify the chiral limit as the limit where the quarmass vanishes at zero temperature. This defines a chiralline Kc in the (b,K) plane, which is a curve fromK.1/4 atb50 to K51/8 at b5`. See Fig. 2. In the following wealso discuss alternative identifications of the chiral limWhen clear specification is required, we denote thisKc asKc(mq).
Let us denote a line where the pion mass vanishes attemperature byKc(mp
2 ). This line is the critical line of thetheory because the partition function has singularities thAs discussed in the previous subsection, we expectKc(mq) andKc(mp
2 ) are identical for smallNF . It should be,however, noted that theKc(mq) line is conceptually differentfrom theKc(mp
2 ) line: If quarks are not confined and chirasymmetry is not spontaneously broken, there is noKc(mp
2 )line. In fact, for the case ofNF>7, theKc(mq) line belongsto the deconfining phase andmp remains nonzero there —i.e., there is noKc(mp
2 ) line around theKc(mq) line, at leastfor smallb @12#.
e
n
theon
ass,
klimit
it.
zero
ere.that
l
As a statistical system on the lattice, QCD with Wilsonquarks is well defined also in the region above theKc line.Some time ago, Aoki@17# proposed and numerically verifiedthat the critical lineKc(mp
2 ) ~for small NF) can be inter-preted as a second order phase transition line between thparity-conserving phase and a parity-violating phase. Thisinterpretation is useful in understanding the existence of sin-gularities of the partition function. Once its existence is es-tablished, various properties of hadrons can be investigatedin the parity-conserving phase. In particular, even with theWilson term, various amplitudes near the chiral limit do sat-isfy Ward-Takahashi identities derived from chiral symmetryto the corrections ofO(a). Therefore, although the actiondoes not have chiral symmetry, the concept of the spontaneous breakdown of chiral symmetry is phenomenologicallyvery useful. Because our main interest is to study the physi-cal properties of hadrons in the continuum limit, it is impor-tant to study these axial Ward-Takahashi identities and esti-mate the magnitude of theO(a) corrections from the Wilsonterm in the physical quantities.
We have defined theKc line by the vanishing point ofmq at zero temperature, because this line corresponds tomassless QCD.~Numerical results forKc are given in Sec.V.! In this connection, however, it should be noted that therenecessarily are ambiguities ofO(a) off the continuum limitfor lines in the (b,K) plane which give the same theory inthe continuum limit. This is true also for massless QCD:Instead of the conditionmp50, we may fix other quantitiessuch asmr /mN , which will lead to a line different from theKc line. Of course, the continuum limit is not affected bytheseO(a) ambiguities. We, however, would like to stressthat the definition we have taken for theKc is conceptuallynatural and useful for the reasons given in Sec. III A.
C. Phase structure at finite temperatures
The temperature on a lattice with the linear extension inthe temporal directionNt is given byT51/Nta. On a lattice

s
7014 54IWASAKI, KANAYA, KAYA, SAKAI, AND YOSHIE´
with a fixedNt , a finite temperature transition or crossovfrom the low temperature regime to the high temperaturegime occurs at some hopping parameter whenb is fixed.This defines a curveKt in the (b,K) plane. In this paper, forsimplicity, we use the term ‘‘transition’’ for both genuinephase transitions and sharp crossovers, unless explispecified. At finite temperatures we denote the screenpion mass bymp and sometimes we call it simply the piomass, and similarly for other hadron screening masses.quark mass at finite temperatures is defined through Eq.~4!with mp the screening pion mass, and similarly forfp
through Eq.~8!. Note that, with these definitions ofmp andf p , the discussions given in Sec. III A hold also at finitemperatures.
One of the fundamental problems is whether the fintemperature transition lineKt does cross the chiral limit lineKc , where we define theKc line by the vanishing point ofmq at zero temperature~cf. Sec. III B!. If the Kt line doesnot cross theKc line, it means that there is no chiral limit inthe low temperature confining phase. Therefore it is natuto expect that it does cross. However, as first noted by Fugita et al. @18#, it is not easy to confirm this: TheKt linecreeps deep into the strong coupling region. In this papershow that theKt line indeed crosses the chiral lineKc atb;3.9–4.0 atNt54 andb;4.0–4.2 atNt56 for the caseof NF52. ~For previous reports see Refs.@3,4#.!
Because theKc line describes the massless QCD, widentify the crossing point of theKc andKt lines as the pointof the finite temperature transition of the massless QCD, ithe chiral transition point.@We will discuss laterO(a) am-biguities in the definition of the chiral limit at finite temperatures which come from the lack of chiral symmetry.#
Numerical studies show that, in the confining phase,pion screening mass vanishes, for a fixedb, at the hoppingparameter which approximately equals the chiral limitKc .On the other hand, in the deconfining phase, the pion screing mass is of order of twice the lowest Matsubara frequen2p/Nt in the chiral limit. Therefore, in the deconfiningphase, the system is not singular even on theKc line.
Recently, Aoki et al. @19# investigated a critical linewhere the screening pion mass vanishes at finite temptures, which we denote byKc(mp
2 ;TÞ0). Based on analyticstudies of the two-dimensional~2D! Gross-Neveu model andnumerical results in lattice QCD withNF52, they showedthat theKc(mp
2 ;TÞ0) line starting fromK.1/4 at b50
TABLE II. The same as Table I forNF52 simulations per-formed on a 12336 lattice.
b K Dt t tot t therm Algo. Ninv Phase
4.2 0.2195 0.00125 56 30 H-CG 1119 d4.3 0.2183 0.002 138 40 H-CG 863 d4.4 0.2163 0.005 160 30 H-CG 678 d4.5 0.2143 0.008 130 80 H-CG 505 d5 0.1982 0.01 224 100 H-CG 160 d5.02 0.16 0.01 560 300 H-CR 27 c5.02 0.17 0.01 560 300 H-CR 36 c5.02 0.18 0.01 180 100 H-CG 143 c5.02 0.18 0.01 210 100 H-CG 529 d
erre
citlyingnThe
te
ite
ralku-
we
e
.e.,
-
the
en-cy
era-
sharply turns back upwards~to largerK region! at finite b.The lower part of theKc(mp
2 ;TÞ0) line is almost identicalwith theKc(mp
2 ) line up to the sharp turning point, while theanalytic results of the 2D Gross-Neveu model suggest thatthey slightly differ from each other, probably withO(a). SeeFig. 2.
The nonexistence of theKc(mp2 ;TÞ0) line in the large
b region is consistent with the previous results that the pionscreening massmp does not vanish in the deconfining phasealong the chiral lineKc . The slight shift of theKc(mp
2 ;TÞ0) line from theKc(mp
2 ) line in the confining phase wasobserved also in our previous study@3,4# ~see also Sec. V!.This slight shift of theKc(mp
2 ;TÞ0) line means thatmp isnot rigorously zero on theKc(mp
2 ) line in the confiningphase at finite temperatures. This small pion screening mason theKc line in the confining phase is caused by a chiralsymmetry violation due to the Wilson term and should be ofO(a).
Similarly to theKc(mp2 ;TÞ0) line, we define the line
Kc(mq ;TÞ0) where the quark mass vanishes at finite tem-peratures. When we follow the lineKc(mq ;TÞ0) fromb50, it is first identical with theKc(mp
2 ;TÞ0) line. Theline Kc(mq ;TÞ0) passes through the turning point of theKc(mp
2 ;TÞ0) line and runs into the largerb region, wheref p starts to vanish instead ofmp on theKc(mq ;TÞ0) line.See Fig. 2. This suggests that the turning point which is theboundary betweenf p50 andmp50 is the finite temperaturetransition point. This further implies that the transition lineKt touches the turning point of theKc(mp
2 ;TÞ0) line andmoves upwards in the (b,K) plane. This observation is notin accord with the argument by Aokiet al. @19# that there isa small gap between theKc(mp
2 ;TÞ0) andKt lines.We have identified the crossing point of theKc andKt
lines as the chiral transition point. In connection with theO(a) ambiguities of the line for massless QCD in the cou-pling parameter space mentioned in Sec. III B, there areO(a) ambiguities also in the definition of the chiral transi-tion. Therefore, one may alternatively identify the sharpturning point of theKc(mp
2 ;TÞ0) line as the chiral transi-tion point. The property of the chiral transition in the con-tinuum limit is, of course, not affected by theseO(a) ambi-guities.
D. Characteristics for Wilson quarks
Let us summarize several characteristic properties of thephase diagram of QCD which originate from the explicit
TABLE III. The same as Table I forNF52 on an 83310 lat-tice. Data marked with a dagger (†) are taken from Ref.@13# ob-tained on an 83320 lattice.
b K Dt t tot t therm Algo. Ninv Phase
4.5 0.16 0.02 500 300 H-CR 23 c4.5 0.17 0.01 540 300 H-CR 29 c4.5 0.18 0.01 540 300 H-CR 35 c5.5† 0.15 0.025 2050 1000 H-CR 8 c5.5† 0.155 0.02 1600 500 H-CR 23 c6 0.1524 0.01 230 150 H-CG 78 d

54 7015FINITE TEMPERATURE TRANSITIONS IN LATTICE . . .
TABLE IV. The same as Table I forNF53 on an 8231034 lattice.
b K Dt t tot t therm Algo. Ninv Phase
2.5 0.2381 0.01 8 R-CG ;2300 d→(c)2.7 0.2369 0.01 10 R-CG ;2300 d→(c)2.8 0.2364 0.01 12 R-CG .1900 d→(c)2.9 0.2358 0.01 28 R-CG ;2300 d→(c)3 0.205 0.01 280 170 R-CR 64 c3 0.205 0.01 202 100 R-CR 64 c3 0.215 0.01 190 100 R-CR 117 c3 0.225 0.005 75 R-CR ;563 d→(c)3 0.23 0.0025 18 R-CG d→(c)3 0.2352 0.01 23 R-CG ;2300 m→(c)3 0.2352 0.01 68 R-CG ;2300 c→(c)3 0.2352 0.01 159 100 R-CG 851 d3.1 0.2341 0.01 160 50 R-CG 650 d3.2 0.2329 0.01 114 50 R-CG 556 d3.2 0.2329 0.01 169 100 R-CG 504 d4 0.18 0.01 520 300 R-CR 35 c4 0.19 0.01 520 300 R-CR 47 c4 0.2 0.01 391 200 R-CR 84 d→c4 0.205 0.01 320 200 R-CG 351 d4 0.21 0.01 308 200 R-CG 247 d4 0.2226 0.01 320 200 R-CG 188 d4.5 0.16 0.01 500 300 R-CR 25 c4.5 0.17 0.01 542 300 R-CR 30 c4.5 0.18 0.01 545 300 R-CR 40 d→c4.5 0.185 0.01 534 300 R-CR 51 d→c4.5 0.186 0.01 301 150 R-CR 56 c4.5 0.1875 0.01 191 100 R-CR 82 c4.5 0.1875 0.01 181 100 R-CG 248 d4.5 0.189 0.01 207 100 R-CG 214 d4.5 0.19 0.01 336 200 R-CG 200 d4.5 0.2 0.01 394 200 R-CG 158 d4.5 0.205 0.01 190 R-CG 142 d4.5 0.2143 0.01 101 R-CG 132 d5 0.13 0.01 313 150 R-CR 49 c5 0.14 0.01 275 150 R-CR 20 c5 0.15 0.01 310 150 R-CR 22 c5 0.16 0.01 324 150 R-CR 27 c5 0.165 0.01 373 150 R-CR 65 c5 0.165 0.01 202 150 R-CG 48 d→c5 0.166 0.01 120 R-CG d→(c)5 0.166 0.01 264 150 R-CR 35 c5 0.167 0.01 145 R-CR c→(d)5 0.167 0.01 187 100 R-CG 155 d5 0.17 0.01 291 150 R-CG 119 d5.5 0.1 0.01 652 150 R-CR 13 c5.5 0.11 0.01 505 150 R-CR 15 c5.5 0.12 0.01 571 250 R-CR 16 c5.5 0.125 0.01 695 250 R-CR 17 c→m5.5 0.1275 0.01 676 100 R-CR 18 d5.5 0.13 0.01 364 150 R-CR 18 c→d5.5 0.135 0.01 174 100 R-CR 20 d→d5.5 0.14 0.01 296 100 R-CR 23 d6 0.08 0.01 355 100 R-CG 23 d6 0.09 0.01 194 100 R-CG 27 d6 0.1 0.01 320 100 R-CG 33 d6 0.11 0.01 270 100 R-CG 41 d6 0.12 0.01 244 100 R-CG 51 d6 0.135 0.01 180 100 R-CG 72 d

yi
-
i
-
7016 54IWASAKI, KANAYA, KAYA, SAKAI, AND YOSHIE´
chiral symmetry violation of the Wilson term. They are insharp contrast with those of staggered quarks where at leapart of chiral symmetry is preserved.
~i! In the coupling parameter space, the location of thpoint wheremp50 in the confining phase is not protected bchiral symmetry off the continuum limit. Therefore, the chral limit Kc , defined bymq50 or mp50 at zero tempera-ture, is different from the bare massless limitK51/8 exceptat b5`.
~ii ! As a statistical system on the lattice, QCD with Wilson quarks is well defined also in the region above theKcline. At zero temperature, theKc line is a second order tran-sition line between the conventional parity-conserving phaat K,Kc and a parity-violating phase atK.Kc @17#.
~iii ! At finite temperatures, the critical lineKc(mp2 ;T
Þ0) where the screening pion mass vanishes is not a lfrom K.1/4 at b50 to an end at some finiteb, but itsharply turns back toward largerK region at the finiteb @19#.
~iv! Although the major part of the effects from the Wilson term can be absorbed by the shift ofKc from K51/8,
TABLE V. The same as Table I forNF53 on a 12334 lattice.
b K Dt t tot t therm Algo. Ninv Phase
4 0.2 0.01 198 100 R-CR 82 c4 0.202 0.01 273 100 R-CR 101 c4 0.203 0.01 229 100 R-CR 117 c4 0.203 0.01 63 R-CG d→(c)4 0.204 0.01 219 100 R-CG 152 c4 0.204 0.01 169 100 R-CG 449 d4 0.205 0.01 93 R-CG c→(d)4 0.205 0.01 192 100 R-CG 380 d4 0.21 0.01 203 100 R-CG 272 d4.5 0.18 0.01 282 100 R-CR 40 c4.5 0.186 0.01 230 100 R-CR 56 c4.5 0.1875 0.01 1040 369 R-CR 74 c4.5 0.1875 0.01 1072 100 R-CG 264 d4.5 0.189 0.01 183 100 R-CG 230 d4.5 0.19 0.01 196 100 R-CG 219 d4.7 0.17 0.01 307 100 R-CR 32 c4.7 0.175 0.01 225 100 R-CR 38 c4.7 0.178 0.01 232 100 R-CG 117 d→c4.7 0.179 0.01 335 100 R-CR 48 c4.7 0.179 0.01 253 R-CG d→(c)4.7 0.1795 0.01 1035 100 R-CR 50 c4.7 0.1795 0.01 1073 100 R-CG 236 d4.7 0.18 0.01 299 100 R-CG 228 d4.7 0.18 0.01 410 R-CG c→(d)5 0.165 0.01 203 100 R-CR 33 c5 0.166 0.01 574 200 R-CR 35 c5 0.166 0.01 405 R-CG/CR d→(c)5 0.16625 0.01 570 200 R-CR 37 c→m5 0.16625 0.01 545 200 R-CR 47 d→m5 0.1665 0.01 502 R-CR c→(d)5 0.1665 0.01 611 200 R-CR 75 d5 0.167 0.01 475 250 R-CR 53 d5 0.168 0.01 419 100 R-CR 104 d5 0.169 0.01 164 100 R-CG 163 d5 0.17 0.01 231 100 R-CG 166 d
st a
e
-
se
ne
there still exist additional smallO(a) effects which are re-lated to the chiral symmetry violation. In particular, the lo-cation of the point wheremp50 in the confining phaseslightly depends onNt @19#. The continuum limit is not af-fected by theseO(a) effects.
IV. SIMULATION PARAMETERS
In this article we mainly perform simulations on latticeswith the temporal direction extensionNt54. The spatial
TABLE VI. The same as Table I forNF56 on an 8231034lattice.
b K Dt t tot t therm Algo. Ninv Phase
0 0.2 0.01 32 20 R-CR 38 c0 0.21 0.01 32 20 R-CR 49 c0 0.22 0.01 33 18 R-CR 67 c0 0.235 0.01 40 20 R-CR 155 c0.1 0.2495 0.01 11 R-CG .5000 d→(c)0.2 0.249 0.01 11 R-CG .5000 d→(c)0.2 0.24936 0.01 23 R-CG .10000 d→(c)0.3 0.2485 0.01 16 R-CG .5000 m→(c)0.3 0.2485 0.01 9 R-CG .5000 m→(c)0.3 0.2485 0.01 27 R-CG 600 d0.3 0.249 0.01 16 .5000 m→(c)0.4 0.248 0.01 20 10 R-CG 500 d0.5 0.23 0.01 6 R-CG d→(c)0.5 0.235 0.01 6 R-CG d→(c)0.5 0.24 0.01 6 R-CG d→(c)0.5 0.245 0.01 53 R-CG ;1400 d→c0.5 0.2475 0.01 25 15 R-CG 445 d1 0.2 0.01 113 50 R-CR 42 c1 0.21 0.01 104 50 R-CR 60 c1 0.22 0.01 115 55 R-CR 80 c1 0.225 0.01 267 100 R-CR 126 c1 0.23 0.01 293 100 R-CR 192 c1 0.235 0.01 40 R-CG d→c1 0.235 0.005 112 60 R-CG 970 c1 0.235 0.005 19 R-CG d→(c)1 0.237 0.005 42 R-CG d1 0.237 0.005 49 R-CG c→(d)1 0.238 0.005 28 R-CG 440 d1 0.24 0.005 108 40 R-CG 325 d1 0.245 0.01 114 60 R-CG 306 d2 0.24 0.01 18 R-CG 162 d4 0.22 0.01 15 R-CG 88 d4.5 0.15 0.01 71 61 R-CR 21 c4.5 0.16 0.01 38 28 R-CR 27 c4.5 0.165 0.01 60 50 R-CR 32 c4.5 0.165 0.01 60 R-CR d→(c)4.5 0.166 0.01 277 267 R-CR 36 d→c4.5 0.167 0.01 193 183 R-CR 36 c4.5 0.167 0.01 159 149 R-CR 105 d4.5 0.168 0.01 152 R-CG c→(d)4.5 0.17 0.01 73 R-CG c→(d)4.5 0.18 0.01 41 31 R-CG 115 c→d4.5 0.19 0.01 38 28 R-CG 92 c→d4.5 0.2143 0.01 181 150 R-CG 87 d

54 7017FINITE TEMPERATURE TRANSITIONS IN LATTICE . . .
sizes are 82310 and 123. To study theNt dependence for theNF52 case, we also make simulations onNt56 and 8 lat-tices. Simulations on anNt58 lattice are performed also forthe case ofNF5211. When the hadron spectrum is calculated, the lattice is duplicated in a direction of lattice size 1or 12. We use an antiperiodic boundary condition for quarkin the t direction and periodic boundary conditions otherwise.
We generate gauge configurations forNF52 by the hy-brid Monte Carlo~HMC! algorithm @20# with a moleculardynamics time stepDt chosen in such a way that the acceptance rate is about~80 – 90!%. ForNF>3 andNF5211 weuse the hybridR algorithm @21# with Dt50.01, unless oth-erwise stated. We fix the time length of each molecular dnamics evolution tot51. TheR algorithm introduces errorsof O(Dt2), while the HMC algorithm is exact. As reportedrecently also for staggered quarks@22#, we note that step sizeerrors with theR algorithm are large in the confining phasenear the chiral limit. In the immediate vicinity of the chiraltransition, we observe step size errors also in the deconfinphase where a largeDt can even push the phase into theconfining phase, as reported previously with staggerquarks @23#. In these cases, we apply a sufficiently smaDt so that the results for physical quantities become stabfor a change ofDt.
The inversion of the quark matrix is done by the minimaconjugate residual~CR! method with the incomplete LU
TABLE VII. The same as Table I forNF5211 on an8231034 lattice. The molecular-dynamics time step isDt50.01. Simulations are performed with theR algorithm for up-dating configurations and with the CG method for quark matriinversions.
b Kud Ks t tot t therm Ninvud Ninv
s Phase
3.2 0.2329 0.2043 15 ;3000 ;250 d→(c)3.4 0.2306 0.2026 20 ;3000 ;290 d→(c)3.5 0.2295 0.2017 9 ;3000 ;260 m→(c)3.5 0.2295 0.2017 553 100 862 394 d3.6 0.2281 0.2006 153 100 622 344 d3.7 0.2267 0.1692 20 ;2500 ;100 d→(c)3.8 0.2254 0.1684 47 ;2500 ;93 d→(c)3.9 0.224 0.1677 12 ;2500 ;93 m→(c)3.9 0.224 0.1677 760 100 797 135 d4 0.2226 0.1669 159 100 521 137 d4 0.2226 0.1964 167 100 235 201 d4.3 0.218 0.1643 159 100 229 130 d5.5 0.163 0.15 376 208 119 97 d
TABLE VIII. The same as Table VII forNF5211 on an8231034 lattice. Simulations are performed with theR algorithmfor updating configurations and with the CG method for quark matrix inversions.
b Kud Ks t tot t therm Ninvud Ninv
s Phase
3.9 0.224 0.1677 14 ;3000 ;93 m→(c)3.9 0.224 0.1677 398 100 999 139 d4 0.2226 0.1669 396 100 636 141 d
-0s-
-
y-
ing
edllle
l
~lower triangle matrix–upper triangle matrix! precondition-ing @24# or the conjugate gradient~CG! method without pre-conditioning. We find that the CR method is efficient in theconfining phase when it is not very close to the chiral limitand also in the deconfining phase at largeb and smallK. Inother cases we use the CG method. The convergence condi-tion for the norm of the residual r isAir i2/(12V)<4.531027 (1.031028) for configurationgenerations~hadron measurements!, whereV is the latticevolume. We also check that the relative changes of the quarkpropagator at several test points on thex and t axes aresmaller than 1023 for the last iteration of the matrix inver-sion steps:u(Gn2Gn21)/Gnu<1023 where n denotes thelast iteration. In the HMC calculations, we check that the
x
-
TABLE IX. The same as Table VII forNF5211 on an83310 lattice. Simulations are performed with theR algorithm forupdating configurations and with the CR method for quark matrixinversions.
b Kud Ks t tot t therm Ninvud Ninv
s Phase
3.5 0.195 0.2017 196 100 46 58 c3.5 0.2 0.2017 164 50 57 59 c3.5 0.205 0.2017 166 50 74 61 c3.5 0.21 0.2017 158 40 109 64 c
FIG. 3. Physical quantities forNF52 at b55.0 on an8231034 lattice ~open squares!: ~a! pion screening mass squaredmp2a2 and twice the quark mass 2mqa, ~b! the plaquette and the
Polyakov loop. Plotted together are the data by the MILC Collabo-ration on an 823203Nt lattice withNt54 ~filled squares!, 6 ~tri-angles!, and 8 ~diamonds! @16#. The finite temperature transitionKt obtained by the MILC data locates atK50.177–0.178(1/K55.62–5.65! for Nt54.

a
fC
.
n
7018 54IWASAKI, KANAYA, KAYA, SAKAI, AND YOSHIE´
difference of the action after molecular dynamic evolutionis sufficiently small with this convergence condition.
The statistics is in general totallyt5 several hundreds.The initial configuration is taken from a thermalized onesimilar simulation parameters when such a configurationavailable. In most cases, the plaquette and the Polyakov loare measured every simulation time unit and the hadrspectrum is calculated everydt510 ~or less depending onthe total statistics!. When the value ofb is small the fluctua-tions of the physical quantities are small@12#, and thereforewe think the lattice sizes and the statistics are sufficientour purpose to determine the global phase structure of Qat finite temperature. Errors are estimated by the singelimination jackknife method.
Simulation parameters are summarized in Tables I–IX
TABLE X. The chiral limit Kc for NF52 determined on an8231034 lattice. The results forb53.0–4.5 are determined bymp50 andmq50, wheremp is the pion screening mass and valueof mp
2 andmq in the confining phase are linearly extrapolated i1/K. The results forb56.0 and 10.0 are determined from an interpolation ofmq in the deconfining phase.
b Kc(mp2 ) Kc(mq)
3.0 0.235~1! 0.230~1!
3.5 0.230~1! 0.226~1!
4.0 0.223~1! 0.218~4!
4.3 0.218~1! 0.214~1!
4.5 0.214~1! 0.210~1!
6.0 0.1564~1!
10.0 0.1396~1!
FIG. 4. The same as Fig. 3 atb54.5 on 823103Nt lattices,whereNt54 ~squares!, 6 ~triangles!, and 8~diamonds!. The finitetemperature transitionKt locates at K50.200 – 0.202 (1/K54.95 – 5.0! for Nt54.
s
tisopon
orDle-
V. NUMERICAL RESULTS FOR Kc
As discussed in Sec. III B, the chiral limitKc is definedby the vanishing point ofmq at zero temperature. Onestraightforward way to determine numerically the chiral limitat a fixed value ofb is to calculate the quark mass throughEq. ~4! at several hopping parameters and extrapolate themto its vanishing point in terms of a linear function of 1/K. Wedenote theKc thus determined byKc(mq). Because we ex-pect the PCAC relation~5! to hold also at finiteb, we mayalternatively calculateKc by the vanishing point ofmp usinga linear extrapolation ofmp
2 in 1/K. We denote thisKc byKc(mp
2 ).On finite temperature lattices, it was previously shown
that the value of the quark mass at a given (b,K) does notdepend on whether the system is in the deconfining or con-fining phase atb55.85 in the quenched QCD@14# and atb55.5 for theNF52 case@13#. This enables us to determinethe chiral limit, for these values ofb, alternatively by thevanishing point ofmq at finite temperatures. Strictly speak-ing there are systematic errors which come from finiteNt , asmentioned earlier. On the other hand, in the deconfiningphase, one is able to perform simulations around theKc lineas discussed later; i.e., we can determineKc without an ex-trapolation which usually leads to a considerable amount ofsystematic errors. Therefore, the determination ofKc frommq in the deconfining phase is useful in particular at largeb.
s
-
TABLE XI. The chiral limit Kc at b54.5 determined bymp50 andmq50, wheremp is the pion screening mass and valuesof mp
2 andmq in the confining phase are linearly extrapolated in1/K using data from K50.16–0.18 for NF52 and 3 andK50.15–0.165 forNF56 @becauseKt50.167(1) forNF56 atNt54#. The spatial lattice size is 82310.
Nt54 Nt58NF Kc(mp
2 ) Kc(mq) Kc(mp2 ) Kc(mq)
2 0.214~1! 0.210~1! 0.212~1! 0.209~1!
3 0.210~1! 0.204~1!
6 0.205~2! 0.200~1!
TABLE XII. Finite temperature transitionKt for NF52, 3, and6 obtained on an 8231034 lattice @data with an asterisk (*) ob-tained on a 12334 lattice#. For NF52 at b55.0, the data by theMILC Collaboration @16# give a more precise value of0.177–0.178 forKt ~cf. Fig. 3!.
NF52 NF53 NF56b Kt b Kt b Kt
4.3 0.207–0.210 3.0 . 0.230 0.5 0.245–0.24754.5 0.200–0.202 4.0 0.200–0.205 1.0 0.235–0.2375.0 0.170–0.180 4.5 0.186–0.189 4.5 0.166–0.1685.25 0.160–0.165 4.5* 0.186–0.189
4.7* 0.179–0.1805.0 0.166–0.1675.0* 0.166–0.16655.5 0.125–0.130

54 7019FINITE TEMPERATURE TRANSITIONS IN LATTICE . . .
TABLE XIII. Results of the plaquette, the Polyakov loop, the pion screening mass, twice the quark mass,and ther meson screening mass forNF52 obtained on an 8231034 lattice. Data marked with a dagger(†) are taken from Ref.@13# obtained on an 8232034 lattice.
b K Plaquette Polyakov mpa 2mqa mra
0 0.2 0.0088~1! 0.0367~3! 1.441~3! 0.715~2! 1.542~25!0 0.21 0.0109~1! 0.0449~3! 1.272~4! 0.552~3! 1.405~34!0 0.22 0.0134~1! 0.0548~32! 1.086~3! 0.400~2! 1.300~37!0 0.23 0.0161~2! 0.0681~10! 0.871~5! 0.253~2! 1.074~65!3 0.18 0.2174~3! 0.0252~13! 1.554~7! 0.808~5! 1.631~44!3 0.19 0.2201~2! 0.0361~7! 1.376~7! 0.621~5! 1.473~48!3 0.2 0.2247~3! 0.0454~14! 1.179~5! 0.437~3! 1.342~61!3.5 0.175 0.2587~3! 0.0268~12! 1.606~5! 0.848~5! 1.679~24!3.5 0.185 0.2624~3! 0.0333~13! 1.408~7! 0.649~4! 1.532~31!3.5 0.195 0.267~4! 0.0436~13! 1.211~7! 0.461~4! 1.392~43!4 0.17 0.3034~1! 0.0249~2! 1.623~3! 0.874~2! 1.688~5!4 0.18 0.3079~1! 0.0318~2! 1.426~3! 0.659~2! 1.523~6!4 0.19 0.3141~1! 0.0408~2! 1.207~4! 0.458~2! 1.367~14!4 0.2226 0.4002~7! 0.1328~24! 0.831~35! -0.074~11!4.1 0.2211 0.4300~4! 0.1345~20! 0.997~41! -0.100~9! 1.07~44!4.2 0.2195 0.4445~6! 0.1535~29! 1.254~32! -0.081~9! 2.12~36!4.3 0.165 0.3319~2! 0.0220~7! 1.663~7! 0.920~5! 1.715~21!4.3 0.175 0.3367~2! 0.0293~8! 1.463~7! 0.696~5! 1.546~22!4.3 0.185 0.3440~2! 0.0404~8! 1.242~6! 0.485~3! 1.379~24!4.3 0.205 0.3732~3! 0.0736~8! 0.647~8! 0.094~3!4.3 0.21 0.4286~4! 0.1369~12! 0.755~74! -0.026~9!4.3 0.218 0.4661~4! 0.1790~18! 1.413~13! -0.083~9! 1.784~55!4.5 0.16 0.3524~2! 0.0209~7! 1.732~6! 0.997~4! 1.782~8!4.5 0.17 0.3580~2! 0.0282~6! 1.520~6! 0.760~4! 1.595~1!4.5 0.18 0.3656~2! 0.0384~7! 1.298~5! 0.534~4! 1.423~8!4.5 0.195 0.3856~3! 0.0590~9! 0.882~11! 0.201~4! 1.145~38!4.5 0.2 0.4007~6! 0.0807~19! 0.696~24! 0.090~5!4.5 0.202 0.4591~3! 0.1643~9! 1.135~36! -0.072~8!4.5 0.205 0.4752~3! 0.1809~17! 1.421~18! -0.128~27! 1.738~43!4.5 0.2143 0.4949~3! 0.2137~16! 1.552~10! -0.034~8! 1.746~19!5 0.14 0.4095~2! 0.0128~7! 2.046~5! 1.379~5! 2.072~6!5 0.15 0.4148~2! 0.0217~7! 1.801~12! 1.093~1! 1.828~19!5 0.16 0.4215~2! 0.0301~7! 1.551~8! 0.805~6! 1.604~1!5 0.17 0.4351~2! 0.0409~8! 1.279~6! 0.522~5! 1.394~12!5 0.18 0.5174~2! 0.2250~8! 1.430~13! -0.086~9! 1.637~11!5 0.19 0.5378~1! 0.2580~7! 1.686~11! -0.096~8! 1.861~8!5 0.1982 0.5473~1! 0.2789~6! 1.717~5! 0.029~5! 1.837~7!5.25 0.1 0.4426~2! 0.0018~8! 2.934~5! 2.508~5! 2.937~6!5.25 0.11 0.4446~2! 0.0041~5! 2.681~10! 2.191~8! 2.687~11!5.25 0.12 0.4472~2! 0.0085~7! 2.423~7! 1.867~7! 2.433~8!5.25 0.13 0.4502~2! 0.0140~7! 2.184~8! 1.563~6! 2.200~9!5.25 0.14 0.4556~2! 0.0213~7! 1.941~4! 1.263~4! 1.970~5!5.25 0.15 0.4635~3! 0.0305~9! 1.657~12! 0.939~9! 1.709~14!5.25 0.155 0.4746~3! 0.0499~12! 1.495~6! 0.756~6! 1.563~7!5.25 0.16 0.4846~3! 0.0678~11! 1.324~9! 0.570~7! 1.397~12!5.25 0.165 0.5307~2! 0.2241~10! 1.351~9! 0.173~9! 1.468~12!5.25 0.175 0.5513~2! 0.2695~8! 1.531~12! -0.136~18! 1.696~10!5.25 0.18 0.5589~1! 0.2861~8! 1.696~6! -0.160~6! 1.853~7!5.5† 0.15 0.5530~2! 0.2413~7! 1.486~6! 0.512~1! 1.528~8!5.5† 0.16 0.5662~2! 0.2815~5! 1.415~7! 0.103~5! 1.490~7!5.5† 0.1615 0.5677~2! 0.2863~8! 1.441~5! 0.048~6! 1.513~9!5.5† 0.163 0.5699~1! 0.2905~8! 1.438~8! -0.016~4! 1.506~8!6 0.15 0.6122~2! 0.3456~10! 1.469~7! 0.233~5! 1.510~8!6 0.1524 0.6131~3! 0.3478~16! 1.467~7! 0.142~8! 1.514~7!6 0.155 0.6157~2! 0.3555~9! 1.480~5! 0.042~7! 1.529~9!6 0.16 0.6188~2! 0.3607~9! 1.534~6! -0.120~6! 1.594~8!10 0.13 0.7853~1! 0.6126~11! 1.496~6! 0.447~2! 1.491~6!10 0.14 0.7865~1! 0.6157~8! 1.439~8! -0.010~4! 1.437~9!10 0.15 0.7873~1! 0.6230~8! 1.591~2! -0.427~6! 1.598~3!
7020 54IWASAKI, KANAYA, KAYA, SAKAI, AND YOSHIE´
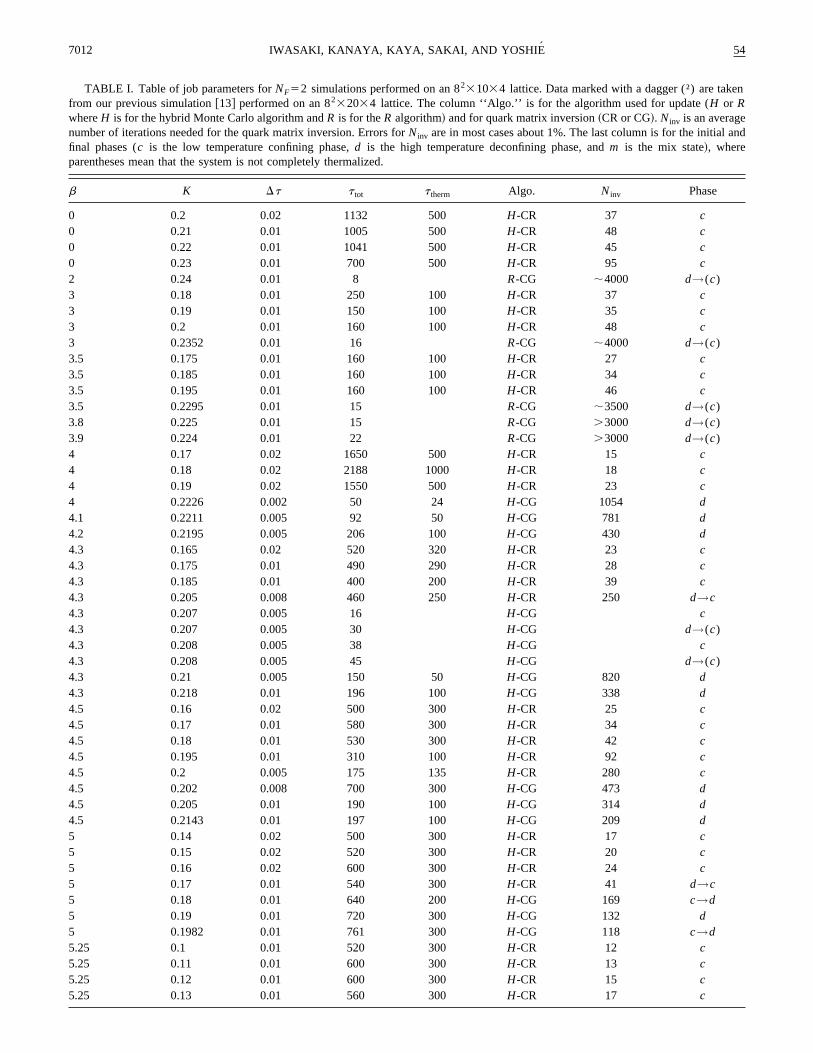
TABLE XIV. The same as Table XIII forNF52 on a 12336 lattice.
b K Plaquette Polyakov mpa 2mqa mra
4.2 0.2195 0.4410~3! 0.0067~12! 0.897~50! -0.082~11!4.3 0.2183 0.4593~2! 0.0054~6! 1.070~62! -0.111~21!4.4 0.2163 0.4742~1! 0.0098~7! 1.241~28! -0.105~8! 1.677~52!4.5 0.2143 0.4889~2! 0.0071~10! 1.371~11! -0.058~9! 1.604~31!5 0.1982 0.5455~1! 0.0831~10! 1.638~7! 0.044~9! 1.749~8!
5.02 0.16 0.4256~1! 0.0023~4! 1.542~5! 0.800~4! 1.605~6!
5.02 0.17 0.4384~1! 0.0041~3! 1.242~6! 0.508~4! 1.343~11!5.02 0.18c 0.4696~1! 0.0102~5! 0.710~10! 0.149~5! 0.986~29!5.02 0.18d 0.5180~2! 0.0399~9! 0.923~47! -0.164~18! 1.40~16!
At small b region (b&5.3) where we mainly performsimulations in this work,mq in the deconfining phase doenot agree with that in the confining phase. Therefore,proportionality betweenmq in the deconfining phase anmp2 in the confining phase is lost, contrary to the caseb*
5.5 discussed above. This behavior is seen in Figs. 3 anwhere physical quantities forNF52 at b55.0 and 4.5, re-spectively, are shown. As we discuss in Sec. VI, we interpthis unexpected phenomenon atb&5.3 in the deconfiningphase as a lattice artifact.
In the confining phase, on the other hand, the proportiality betweenmq andmp
2 is well satisfied for all values ofb @3,12–16#. We also find thatmq andmp are almost inde-pendent ofNt in the confining phase. See Fig. 4 forNF52 atb54.5. Therefore we can calculateKc approximately alsoby the vanishing point ofmq , Kc(mq), or that of mp
2 ,Kc(mp
2 ), in the confining phase atT.0.The numerical results forKc for NF52 obtained by vari-
ous groups@3,13,25–29# are plotted in Fig. 5 together withfinite temperature transition lines discussed in the followisections. The values ofKc show a slight dependence~at mostof the order of 0.01! on the choice ofKc(mq) or Kc(mp
2 ),which can be probably attributed to the systematic errorsthe extrapolation ofmp
2 andmq in2 1/K, because, as discussed above, we expect thatKc(mq) andKc(mp
2 ) are iden-
2The range of the quark mass value we use in this article forextrapolation to determine theKc is mainly about 0.2–0.5 in latticeunits in the confining phase. As seen from Fig. 5,mp
2 and mq
sometimes show slightly convex curves in 1/K. In such cases, achoice of the fit range at smallermq will lead to slightly smallervalues forKc .
sthed
d 4,
ret
on-
ng
in-
tical. The values ofKc(mp2 ) for NF52 for variousb ’s are
listed in Table X. We estimate the systematic errors due tothe extrapolation are of the same order as the differencesbetweenKc(mq) andKc(mp
2 ).TheNt dependence ofKc atb54.5 are listed in Table XI.
The NF dependence is also given. We find that the differ-ences due toNF andNt are of the same order of magnitudeas the difference betweenKc(mq) andKc(mp
2 ).To summarize this section, we note that although the chi-
ral limit is defined by the vanishing point ofmq at zerotemperature, there are several practically useful ways to de-termineKc : Kc(mq) andKc(mp
2 ) atT50 and in the confin-ing phase, andKc(mq) in the deconfining phase. They allgive the same results within present numerical errors.
VI. FINITE TEMPERATURE TRANSITIONAND PROBLEMS WITH WILSON QUARKS
The location of the finite temperature phase transitionKtis identified by a sudden change of physical observables suchas the plaquette, the Polyakov line, and screening hadronmasses.~A more precise determination of the location willbe given by the maximum point of the susceptibility of aphysical quantity such as the Polyakov loop. However, ourstatistics is not high enough for it.! See Figs. 3 and 4 for thecase ofNF52 at b55.0 and 4.5. Our numerical results ofKt are summarized in Table XII. Results ofKt for NF52 atNt54 and 6 obtained by us and other groups@16,26,29–31#are compiled in Fig. 5.~Results forNF53 will be discussedin Sec. VIII.!
We expect, at least near the continuum limit, that as thequark mass increases from the chiral limit, the transition be-comes weaker with the quark mass and it becomes strong
the
TABLE XV. The same as Table XIII forNF52 on an 83310 lattice. Data marked with a dagger (†) aretaken from Ref.@13# obtained on an 83320 lattice.
b K Plaquette Polyakov mpa 2mqa mra
4.5 0.16 0.3522~1! 0.0010~7! 1.731~7! 0.999~5! 1.779~20!4.5 0.17 0.3574~1! 0.0004~6! 1.513~5! 0.759~4! 1.588~19!4.5 0.18 0.3649~1! 0.0023~6! 1.281~5! 0.529~3! 1.398~18!5.5† 0.15 0.5377~3! 0.0073~1! 1.115~16! 0.542~6! 1.167~19!5.5† 0.155 0.5481~3! 0.0081~2! 0.807~35! 0.308~14! 0.874~39!6 0.1524 0.6131~3! 0.3478~16! 0.837~19! -0.003~4! 0.881~22!

is
a
d
d
tm
i
w
s
54 7021FINITE TEMPERATURE TRANSITIONS IN LATTICE . . .
again when the quark mass is heavy enough to recoverfirst order transition of the SU~3! gauge theory. The MILCCollaboration performed a systematic study of the transitat variousK andb and found that, contrary to expectationwhen we decreaseK from the chiral limitKc on anNt54lattice, the Kt transition becomes once very strongK.0.18 and becomes weaker again at smallerK @16#. On alattice withNt56 they even found a first order transition aK50.17–0.19@29#.
Looking at the phase diagram shown in Fig. 5 closely, wnote that theKt lines initially deviate from theKc line andthen approach theKc line at b;4.8 and K;0.18 forNt54 and atb;4.8–5.2 andK;0.17 – 0.19 forNt56,contrary to the naive expectation that they monotonouslyviate from theKc line. The points where strong transitionoccur are just in the region where theKt lines approach theKc line. Therefore, it is plausible that the strong transitionintermediate values ofK is a result of lattice artifacts causeby this unusual relation of theKt and Kc lines @7#. Thisunusual relation is probably due to the sharp bend ofKc line atb.5.0 which is caused by the crossover phenoenon between weak and strong coupling regions of QCOur recent study indeed shows that, with an improved lattaction, the distance between the theKc andKt lines becomesmonotonically large when we decreaseK and, correspond-ingly, theKt transition becomes rapidly weak as we decreaK from the chiral limit@32#. Also the unexpectedNt depen-dence ofmq in the deconfining phase at smallb, discussed inthe previous section, is removed with the same improvlattice action.
The appearance of the lattice artifacts implies thathave to be cautious when we try to derive the conclusionsthe continuum limit from the numerical results at finiteb.We also note thatNt54 is far from the continuum limit andtherefore we should take with reservation, in particulaquantitative values in physical units which are quoted in tfollowing. We, however, note that the PCAC relationmp
2
}mq expected from chiral symmetry in the confining phais well satisfied even in the strong coupling region and thefore we expect that qualitative features of the chiral tran
FIG. 5. Phase diagram forNF52. Solid symbols are forKc
determined by mp50 and mq50. Open symbols are forKt(Nt54) and other symbols such as crosses except solid onesfor Kt(Nt56). Circles are our data. Lines are to guide the eye.
the
on,
t
t
e
e-s
at
he-D.ce
se
ed
ein
r,he
ere-si-
tion such as the order of the transition are not affected bylattice artifacts. We certainly have to check in the future thatthe conclusions in this article are also satisfied when an im-proved action is adopted.
VII. NUMERICAL RESULTS FOR CHIRAL TRANSITIONS
As discussed in Sec. III C, the chiral transition can bestudied along theKc line at the crossing point of theKt andKc lines, which we denote as the chiral transition pointbct . We first address ourselves to the problem of whetherthe chiral limit of the finite temperature transition exists atall. We then study the order of the chiral transition.
In a previous paper@12# we showed that, whenNF>7,there is a bulk first order phase transition atb50 whichseparates the confining phase at smallK from a deconfiningphase near the chiral limit atK51/4. This implies that theKt line does not cross theKc line at finiteb for anyNt . Onthe other hand, whenNF<6, the chiral limit belongs to theconfining phase atb50, which implies that there is a cross-ing point somewhere at finiteb for the caseNF<6.
A. On-Kc method
In order to identify the crossing pointbct and study theorder of the chiral transition there, we take the strategy ofperforming simulations on theKc line starting from a valueof b in the deconfining phase and reducingb. We call thismethod the ‘‘on-Kc’’ simulation method. The number of it-erations,Ninv , needed for the quark matrix inversion, in gen-
are
FIG. 6. Molecular-dynamics time history ofNinv for NF52 ontheKc line obtained on an 8231034 lattice.
FIG. 7. The pion screening mass squaredmp2a2 for NF52 on
theKc line obtained on 8231034 and 12336 lattices.

7022 54IWASAKI, KANAYA, KAYA, SAKAI, AND YOSHIE´
TABLE XVI. The same as Table XIII forNF53 on an 8231034 lattice.
b K Plaquette Polyakov mpa 2mqa mra
3 0.205 0.2402~2! 0.0779~7! 1.049~4! 0.334~2! 1.223~18!3 0.215 0.2501~3! 0.1002~12! 0.820~4! 0.180~1! 1.247~67!3 0.225 0.2635~6! 0.1266~24!3 0.2352d 0.3546~6! 0.1718~16! 0.988~30! -0.066~5!
3.1 0.2341 0.3743~3! 0.1812~12! 1.084~21! -0.069~4! 1.53~26!3.2 0.2329 0.3889~2! 0.1850~10! 1.192~19! -0.077~7! 1.52~22!4 0.18 0.3176~2! 0.0508~7! 1.405~7! 0.638~5! 1.497~14!4 0.19 0.3297~2! 0.0669~7! 1.179~8! 0.424~5! 1.346~17!4 0.2 0.3486~3! 0.0978~8! 0.899~9! 0.206~5! 1.193~50!4 0.205 0.4465~5! 0.2102~11! 1.313~4! -0.056~30! 1.77~18!4 0.21 0.4674~3! 0.2341~11! 1.542~10! -0.057~11! 1.760~20!4 0.2226 0.4944~2! 0.2637~12! 1.552~5! 0.009~4! 1.689~6!
4.5 0.16 0.3598~2! 0.0334~7! 1.717~5! 0.979~5! 1.768~6!
4.5 0.17 0.3691~2! 0.0459~6! 1.497~5! 0.732~3! 1.575~9!
4.5 0.18 0.3835~2! 0.0641~7! 1.250~6! 0.478~4! 1.385~14!4.5 0.185 0.3954~2! 0.0812~8! 1.094~8! 0.340~5! 1.281~15!4.5 0.186 0.4025~3! 0.0927~10! 1.070~9! 0.299~5! 1.267~23!4.5 0.1875c 0.4129~6! 0.1094~15! 1.023~6! 0.250~8! 1.287~34!4.5 0.1875d 0.4867~6! 0.2343~17! 1.394~44! -0.078~7! 1.636~55!4.5 0.189 0.4964~4! 0.2492~15! 1.502~19! -0.114~14! 1.696~23!4.5 0.19 0.5012~3! 0.2560~11! 1.580~10! -0.118~12! 1.788~18!4.5 0.2 0.5232~2! 0.2852~11! 1.693~5! 0.010~6! 1.814~8!
4.5 0.205 0.5318~3! 0.2957~13!4.5 0.2143 0.5433~4! 0.3183~27!5 0.13 0.4102~2! 0.0138~6! 2.257~10! 1.647~76! 2.271~10!5 0.14 0.4163~2! 0.0223~9! 2.036~7! 1.373~6! 2.063~8!
5 0.15 0.4243~3! 0.0319~9! 1.790~7! 1.077~6! 1.830~10!5 0.16 0.4382~3! 0.0522~10! 1.515~9! 0.763~8! 1.586~12!5 0.165 0.4533~3! 0.0798~10! 1.359~12! 0.574~12! 1.444~16!5 0.166 0.4697~4! 0.1247~17! 1.340~13! 0.491~14! 1.447~12!5 0.167 0.5141~4! 0.2369~17! 1.379~11! 0.185~17! 1.488~17!5 0.17 0.5297~3! 0.2698~11! 1.473~10! 0.003~19! 1.586~11!5.5 0.1 0.5011~2! 0.0185~7! 2.846~5! 2.413~5! 2.849~5!
5.5 0.11 0.5052~3! 0.0283~10! 2.551~7! 2.055~7! 2.557~8!
5.5 0.12 0.5145~3! 0.0516~15! 2.253~9! 1.679~8! 2.262~10!5.5 0.125 0.5216~3! 0.0837~16! 2.104~4! 1.495~5! 2.116~5!
5.5 0.1275 0.5276~3! 0.1226~16! 2.031~4! 1.392~4! 2.046~4!
5.5 0.13 0.5384~3! 0.1872~13! 1.950~5! 1.254~4! 1.967~6!
5.5 0.135 0.5453~4! 0.2141~24! 1.814~8! 1.056~6! 1.836~8!
5.5 0.14 0.5521~2! 0.2413~13! 1.672~4! 0.843~4! 1.696~5!
6 0.08 0.5963~2! 0.2582~13! 3.312~5! 2.993~4! 3.313~5!
6 0.09 0.5971~3! 0.2745~15! 2.982~5! 2.591~4! 2.984~5!
6 0.1 0.5984~2! 0.2829~13! 2.647~4! 2.182~4! 2.649~4!
6 0.11 0.5987~2! 0.2874~15! 2.344~5! 1.799~4! 2.347~5!
6 0.12 0.6024~2! 0.3063~15! 2.046~11! 1.401~9! 2.051~12!6 0.135 0.6076~3! 0.3346~16!
seeude
hether-rd
eral, provides a good indicator for discriminating the decofining phase from the confining phase@14,33#. The use ofNinv as an indicator is extremely useful on theKc line, be-causeNinv is enormously large on theKc line in the confin-ing phase, while it is of order several hundreds in the decofining phase. Therefore there is a sudden drastic changeNinv across the boundary of the two phases. This differenis due to the fact that there are zero modes aroundKc in the
n-
n-ofce
confining phase, while none exists in the deconfining pha@12,33,34#: We have checked this difference for the existencof zero modes in various cases discussed below and conclthat the difference ofNinv is not a numerical artifact.
In the deconfining phase on theKc line, we measurephysical observables such as the Polyakov loop, tplaquette, and hadron screening masses, as usual, aftermalization. From the behavior of physical quantities towa

54 7023FINITE TEMPERATURE TRANSITIONS IN LATTICE . . .
TABLE XVII. The same as Table XIII forNF53 on a 12334 lattice.
b K Plaquette Polyakov mpa 2mqa mra
4 0.2 0.3479~2! 0.0945~8! 0.910~6! 0.207~3! 1.139~26!4 0.202 0.3541~2! 0.1053~6! 0.859~4! 0.174~2! 1.129~25!4 0.203 0.3580~2! 0.1104~7! 0.836~5! 0.154~2! 1.139~30!4 0.204c 0.3684~2! 0.1270~8! 0.809~9! 0.119~2! 1.077~79!4 0.204d 0.4378~3! 0.2030~9!
4 0.205 0.4486~2! 0.2102~7!
4 0.21 0.4679~2! 0.2322~8!
4.5 0.18 0.3828~1! 0.0645~5! 1.252~5! 0.479~3! 1.378~9!
4.5 0.186 0.4014~2! 0.0921~7! 1.070~7! 0.304~4! 1.266~12!4.5 0.1875c 0.4138~2! 0.1115~4! 1.032~6! 0.244~3! 1.257~14!4.5 0.1875d 0.4870~1! 0.2353~3! 1.430~10! -0.079~5! 1.674~14!4.5 0.189 0.4945~3! 0.2457~10! 1.556~7! -0.097~7! 1.753~13!4.5 0.19 0.5007~2! 0.2525~7! 1.586~9! -0.114~7! 1.829~16!4.7 0.17 0.3986~1! 0.0536~4! 1.417~6! 0.647~5! 1.505~8!
4.7 0.175 0.4076~2! 0.0661~7! 1.286~6! 0.513~4! 1.405~9!
4.7 0.178 0.4185~3! 0.0814~7! 1.190~8! 0.408~4! 1.328~13!4.7 0.179 0.4234~2! 0.0905~7! 1.147~6! 0.369~3! 1.312~9!
4.7 0.1795c 0.4275~1! 0.0976~3! 1.144~4! 0.350~3! 1.310~7!
4.7 0.1795d 0.4968~1! 0.2360~4! 1.393~7! -0.004~7! 1.597~9!
4.7 0.18 0.4995~3! 0.2399~7! 1.381~15! 0.003~13! 1.596~16!5 0.165 0.4538~3! 0.0786~10! 1.357~4! 0.569~4! 1.446~5!
5 0.166 0.4630~2! 0.1017~7! 1.318~6! 0.513~3! 1.424~7!
5 0.16625 0.4791~2! 0.1454~7! 1.312~4! 0.428~3! 1.419~6!
5 0.1665 0.5031~2! 0.2086~8! 1.349~6! 0.280~5! 1.463~6!
5 0.167 0.5151~3! 0.2377~8! 1.384~7! 0.178~8! 1.495~9!
5 0.168 0.5193~2! 0.2478~5! 1.401~5! 0.134~5! 1.516~5!
5 0.169 0.5263~2! 0.2609~10! 1.421~17! 0.062~8! 1.537~19!5 0.17 0.5294~2! 0.2686~8! 1.432~10! 0.020~7! 1.564~9!
r
t
bct , we are able to study the nature of the chiral transitioIn the confining phase, on the other hand, it is hard to mathe system on theKc line thermalized due to the enormouslylargeNinv we encounter in the configuration generation. Ithis case, we only obtain at most bounds for several physicquantities by measuring the molecular dynamic time evol
FIG. 8. Phase diagram forNF52 and 3. Solid symbols are forKc(mp
2 ) andKc(mq). Open symbols are forKt(Nt54) for NF52and open circles with cross forNF53. Circles are our data. On theKt line for NF53, clear two-state signals are observed atb<4.7both on 8231034 and 12334 lattices. Lines are to guide the eye.
n.ke
nalu-
tion of them starting a hot state or a mix state. Although it isunsatisfactory that we cannot obtain expectation values fophysical quantities in the confining phase, the on-Kc methodis very powerful in identifying the critical point because thedifference between the two phases is clear already with shortime histories. We also check that the crossing point thusdetermined is consistent with a linear extrapolation of theline Kt toward the chiral limit.
B. Chiral transition for NF52
For the case of QCD with two flavors, studies of an ef-fectives model@1,2# imply that the order of the chiral tran-
FIG. 9. Time history ofNinv for NF53 on theKc line obtainedon an 8231034 lattice.
i
a
e
7024 54IWASAKI, KANAYA, KAYA, SAKAI, AND YOSHIE´
sition depends on the the strength of the UA~1! anomaly termat the transition temperature. When the strength is zero,of first order. However, if the strength of the anomaly termthe effectives model is nonzero at the starting point ofrenormalization transformation, it is likely that the effectivaction is attracted to aO(4) symmetric fixed point under arenormalization group transformation@35#. Therefore, it isplausible that the chiral transition is of second order.
Our main results of the measurements forNF52 are sum-marized in Tables XIII–XV.
Let us first discuss the results atNt54. In order to con-firm the existence of the crossing point, we take the larg~farthest! values of Kc for on-Kc simulations, that is,
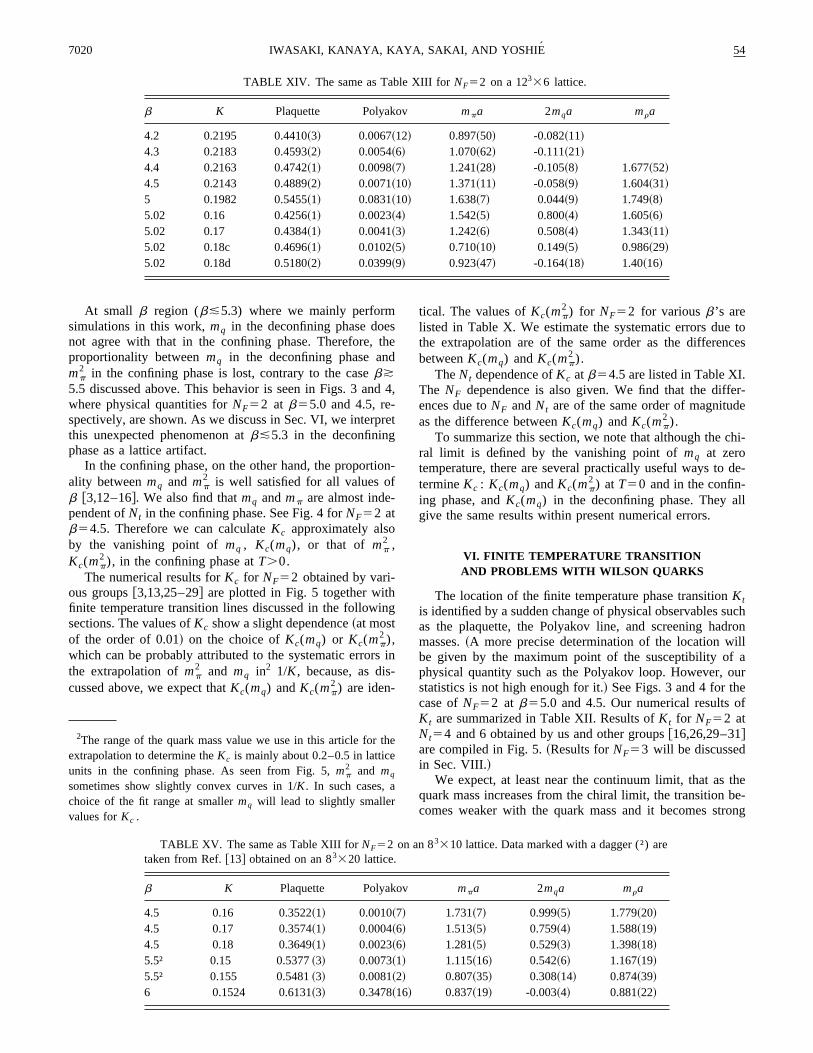
FIG. 10. Pion screening mass squaredmp2a2 for NF53 on the
Kc line obtained on an 8231034 lattice.
t isin
e
st
Kc(mp2 ) for NF52 in Table X and interpolated ones. As
discussed previously,Kc(mp2 ) in general depend on the value
of Nt . However, the differences between those on theNt54 and 8 lattices are within numerical uncertainties asshown Table XI. Therefore, we take the stringent conditionto verify the existence of the crossing point, taking the far-thest values ofKc .
When we take into account the structure ofKc(mp2 ;T
Þ0) that it sharply turns back at finiteb, we may hit theupper part of it by taking the largest values ofKc for the on-Kc method. This, however, does not affect the conclusionthat theKt line crosses theKc line. Our estimates for thevalue ofbct in this case will be slightly underestimated~cf.
FIG. 11. Time history ofNinv for NF56 on theKc line obtainedon an 8231034 lattice.
TABLE XVIII. The same as Table XIII forNF56 on an 8431034 lattice.
b K Plaquette Polyakov mpa 2mqa mra
0 0.2 0.0286~5! 0.1208~32! 1.422~7! 0.687~2! 1.524~23!0 0.21 0.0362~6! 0.1567~20! 1.248~4! 0.514~4! 1.384~27!0 0.22 0.0412~6! 0.1971~32! 1.064~9! 0.360~9! 1.227~47!0 0.235 0.0566~6! 0.2632~24! 0.777~5! 0.160~1! 1.157~86!0.3 0.2485d 0.2229~9! 0.3109~19! 1.040~5! -0.037~4!
0.4 0.248 0.2364~12! 0.3112~28! 1.079~16! -0.042~5!
0.5 0.2475 0.2540~8! 0.3060~26! 1.157~6! -0.063~3!
1 0.2 0.0976~3! 0.1313~14! 1.364~4! 0.615~4! 1.494~7!
1 0.21 0.1075~3! 0.1634~12! 1.170~5! 0.438~2! 1.332~15!1 0.22 0.1197~4! 0.2099~13! 0.984~3! 0.281~2! 1.217~19!1 0.225 0.1251~2! 0.2385~8! 0.888~4! 0.211~1! 1.201~28!1 0.23 0.1262~2! 0.2595~7! 0.797~3! 0.154~1! 1.218~47!1 0.235 0.1633~6! 0.3035~16! 0.725~6! 0.078~2! 1.11~23!1 0.24 0.2944~5! 0.3032~47! 1.261~7! -0.044~6! 1.586~38!1 0.245 0.3207~3! 0.2988~15! 1.314~12! -0.058~7! 1.717~82!4.5 0.15 0.3690~3! 0.0493~17! 1.909~11! 1.200~8! 1.945~34!4.5 0.16 0.3879~5! 0.0822~23! 1.668~10! 0.908~10! 1.728~41!4.5 0.165 0.4013~7! 0.1083~33! 1.551~7! 0.765~3! 1.641~36!4.5 0.166 0.4171~13! 0.1394~29!4.5 0.167 0.4177~4! 0.1317~18!4.5 0.167 0.5024~3! 0.3034~30!4.5 0.168 0.5156~6! 0.3256~26!4.5 0.17 0.5295~14! 0.3448~28! 1.554~12! -0.041~23!4.5 0.18 0.5677~4! 0.3964~27! 1.799~5! -0.116~10!4.5 0.19 0.5889~5! 0.4237~24! 1.803~6! 0.167~7!
4.5 0.2143 0.6202~3! 0.4666~19! 1.616~6! 0.156~10! 1.641~8!

iw
s
r
54 7025FINITE TEMPERATURE TRANSITIONS IN LATTICE . . .
Fig. 2!. This comment applies also forNF53 and 6.We first perform on-Kc simulations by theR algorithm to
identify the crossing point, because it is very time consumto perform simulations with the HMC algorithm due to a loacceptance rate on theKc line in the confining phase. Wefind that whenb>4.0, Ninv stays around several hundredwhile for b<3.9 it increases witht and exceeds severathousands~see Fig. 6!, and in accordance with this behaviothe plaquette, the Polyakov loop, and the pion screenmassmp decrease rapidly toward those in the confininphase. Therefore we identify the crossing point atbct;3.9 –4.0. Thisbct is consistent with a linear extrapolation of thKt line as is shown in Fig. 5.
Then we repeat on-Kc simulations by the HMC algorithmfor b>4.0 in order to measure physical observables. T
FIG. 12. Pion screening mass squaredmp2a2 for NF56 on the
Kc line obtained on an 8231034 lattice.
FIG. 13. Physical quantities forNF53 at b54.0 on8231034 ~open squares! and 12334 ~solid diamonds! lattices:~a!pion screening mass squaredmp
2a2 and twice the quark mass2mqa, ~b! the plaquette and the Polyakov loop. The finite tempeture transitionKt locates atK.0.204 (1/K.4.90).
ng
,lringg
e
he
time histories forNinv atb>4.0 plotted in Fig. 6 are obtainedwith the HMC algorithm, which are similar to those with theR algorithm. TheDt should be taken small nearbct in orderto keep the acceptance rate reasonably high~for b54.0, 4.1,and 4.2 we useDt50.002, 0.005, and 0.005 to get accep-
a-
FIG. 14. The same as Fig. 13 atb54.5. The finite temperaturetransitionKt locates atK.0.1875 (1/K.5.33).
FIG. 15. The same as Fig. 13 atb54.7 obtained on a 12334lattice. The finite temperature transitionKt locates atK.0.1795(1/K.5.57).

7026 54IWASAKI, KANAYA, KAYA, SAKAI, AND YOSHIE´
tance rates 0.91, 0.79, and 0.93, respectively!.The value ofmp2 thus obtained decreases smoothly toward zero as the
ral transition is approached and is consistent with zero atestimatedbct ~see Fig. 7!.
FIG. 16. The same as Fig. 13 atb55.0: ~a! Pion screeningmass squaredmp
2a2 and twice the quark mass 2mqa, ~b! thePolyakov loop. The finite temperature crossoverKt locates atK.0.166– 0.1665 (1/K.6.01–6.02!.
FIG. 17. The same as Fig. 13 atb55.5 obtained on an8231034 lattice. The finite temperature crossoverKt locates atK.0.125–0.130 (1/K.7.7–8.0!.
chi-the
We find no two-state signals aroundbct . This is in sharpcontrast with theNF53 and 6 cases where we find cleartwo-state signals atbct , as discussed below. This, togetherwith the vanishingmp
2 towardbct , suggests that the chiraltransition forNF52 is continuous~second order or cross-over!, although the possibility of a very weakly first ordertransition is not excluded. A finite size scaling study wouldbe needed to determine the order of the transition reliably.
The results from on-Kc simulations on theNt56 latticeare similar to those on theNt54 lattice. The estimated tran-sition point isbct; 4.0–4.2. The value ofmp
2 listed in Table
FIG. 18. Time history of the plaquette forNF53 at ~a!b54.7 and~b! 5.0 on a 12334 lattice.
FIG. 19. Ther meson screening massmra and twice the quarkmass 2mqa in the confining phase as a function of 1/K21/Kc .Open symbols are forNF52, b53.0, 3.5, 4.0, 4.3, and 4.5 on an8231034 lattice. Solid symbols are forNF53, b54.0, 4.5, and4.7 on 8231034 and 12334 lattices. The value ofKc(b) forNF52 is used. Horizontal errors are from those forKc with takinginto account the difference due to definitions, either the vanishingpoint ofmp
2 or mq .

54 7027FINITE TEMPERATURE TRANSITIONS IN LATTICE . . .
TABLE XIX. Results of the plaquette, the Polyakov loop, the pion screening mass, ther meson screeningmass, and thef meson screening mass forNF5211 obtained on an 8231034 lattice.
b Kud Ks Plaquette Polyakov mpa mra mfa
3.5d 0.2295 0.2017 0.3909~2! 0.178~1! 0.991~19! 1.432~33!3.6 0.2281 0.2006 0.4119~6! 0.189~1! 1.182~21!3.9d 0.224 0.1677 0.4173~2! 0.170~1! 1.003~29! 1.527~7!
4 0.2226 0.1669 0.4403~5! 0.189~2! 1.254~27! 1.774~93! 1.534~23!4 0.2226 0.1964 0.4761~4! 0.244~2! 1.526~7! 1.713~6! 1.810~19!4.3 0.218 0.1643 0.4902~4! 0.246~2! 1.535~8! 1.699~12! 1.520~10!5.5 0.163 0.15 0.5801~2! 0.328~1! 1.487~10! 1.569~12! 1.532~9!
-
XIV and plotted in Fig. 7, again decreases toward zerob approachesbct . For Nt518 with the spatial size182324, we previously found that the transition isbct;4.5–5.0 @3#. Although the spatial size is not largenough, this result suggests that the shift ofbct with Nt isvery slow.
C. Chiral transition for NF53
The main results of measurements forNF53 are summa-rized in Tables XVI and XVII. The phase diagram fNF53 obtained from our simulations atb54.0, 4.5, 4.7, 5.0,and 5.5 is shown in Fig. 8. We find that theKt line linearlyapproaches theKc line. In order to confirm the existence othe crossing point by on-Kc simulations, we take the large~farthest! Kc , that is,Kc(mp
2 ), for NF52 at b ’s we havestudied, since this is the most stringent condition forexistence ofbct . We use them and interpolated valueson-Kc simulations here. ForNF56 discussed in the nexsubsection, we interpolate these values ofKc withKc50.25 at b50. Note that the differences ofKc’s forNF52, 3, and 6 are of the same magnitude of numeruncertainties ofKc .
Figure 9 showsNinv as a function of the moleculardynamics timet for several values ofb ’s. When b>3.1,Ninv is of order of several hundreds, while whenb<2.9,Ninv shows a rapid increase witht. At b53.0 we see a cleatwo-state signal depending on the initial condition: For astart,Ninv is quite stable around;800 and the pion screeninmass squaredmp
2 is large (;1.0). On the other hand, formix start,Ninv shows a rapid increase witht and exceeds2000 in t;20, and in accordance with this,mp
2 decreaseswith t.
The value ofmp2 is plotted in Fig. 10. Atb53.0 we have
two values formp2 depending on the initial configuration
The larger one obtained for the hot start is of order 1which is a smooth extrapolation of the values atb;3.1– 3.2.The smaller one is an upper bound formp
2 for the mix start.We note that the result ofbct;3.0 is consistent with an
extrapolation ofKt points listed in Table XII as is shown i
as
ate
or
fst
thefort
ical
-
rhotga
.
.0,
n
Fig. 8. ~The nature of the transitionKt off the chiral limit isdiscussed in Sec. VIII.! Thus we identify the crossing pointat bct;3.0(1).With the clear two-state signal we concludethat the chiral transition is of first order forNF53.
D. Chiral transition for NF 5 6
Our previous study atb50 @12# shows that forNF57there is no crossing point of theKc and Kt lines and thatNF56 is the largest number of flavors for which a crossingpoint exists. The main results of measurements forNF56are summarized in Table XVIII. The overall features of thetransition obtained from numerical simulations forNF56are very similar to those forNF53 except for the location ofbct , which moves to a smallerb as expected. Figure 11shows thatNinv on theKc line stays at several hundreds forb>0.4 and for a hot start atb50.3. On the other hand,Ninv grows rapidly witht and exceeds 5000 forb<0.2 andfor a mix start atb50.3. In accordance with this, we havetwo values ofmp
2 atb50.3 ~cf. Fig. 12!. Therefore we iden-tify the crossing point atbct;0.3(1) and conclude that thechiral transition is of first order forNF56. Thisbct is con-sistent with a linear extrapolation of theKt line ~cf. TableXII !.
For QCD withNF>3, Pisarski and Wilczek predicted afirst order chiral transition from a renormalization groupstudy of an effectives model@1#. Our results forNF53 and6 are consistent with their prediction.
VIII. INFLUENCE OF THE STRANGE QUARK
In the previous section, we have seen that the chiral transition is consistent with a second order transition forNF52, while it is of first order forNF>3, both in accor-dance with theoretical expectations. Off the chiral limit, weexpect that the first order transition forNF>3 smoothensinto a crossover at sufficiently largemq . In this way thenature of the transition sensitively depends onNF andmq .Therefore, in order to study the nature of the transition in thereal world, we should include the strange quark properly
TABLE XX. The same as Table XIX forNF5211 obtained on a 12334 lattice.
b Kud Ks Plaquette Polyakov mpa mra mfa
3.9d 0.224 0.1677 0.4180~2! 0.169~1! 1.078~29! 1.518~8!
4 0.2226 0.1669 0.4407~1! 0.190~1! 1.270~9! 1.702~54! 1.509~6!

7028 54IWASAKI, KANAYA, KAYA, SAKAI, AND YOSHIE´
TABLE XXI. The same as Table XIX forNF5211 obtained on an 83310 lattice.
b Kud Ks Plaquette Polyakov mpa mra mfa
3.5 0.195 0.2017 0.2814~2! 0.001~1! 1.150~4! 1.305~8! 1.198~10!3.5 0.2 0.2017 0.2851~2! 0.003~1! 1.023~3! 1.218~12! 1.194~13!3.5 0.205 0.2017 0.2891~2! 0.003~1! 0.899~4! 1.114~18! 1.172~15!3.5 0.21 0.2017 0.2935~2! 0.003~1! 0.748~4! 1.084~42! 1.179~16!
whose massms is of the same order of magnitude as thtransition temperatureTc.100–200 MeV.
In a numerical study we are able to vary the mass ofstrange quark. Assuming that the chiral transition is of sond order forNF52 ~i.e., ms5`), when the mass of thestrange quark is reduced from infinity to zero with up andown quarks fixed to the chiral limit, the nature of the trasition must change from second order to first order at soquark massms* . This point atms* is a tricritical point @2#.The crucial question is whether the physical strange qumass is larger or smaller thanms* . Studies with an effectivelinear s model suggest a crossover for the case of realisquark masses in a mean field approximation and in a la1/NF approximation @36,37#, while the possibility of aweakly first order transition is not excluded when numericerrors in the calculation of basic parameters are taken iaccount@37#.
A. NF53
Let us first discuss the case of the degenerateNF53:Ku5Kd5Ks[K. As we have already discussed the chirtransition previously, we are mainly interested in the trantion for the massive quarks. In order to find the transitipoints we perform simulations atb54.0, 4.5, 4.7, 5.0, and5.5. The results for physical quantities are plotted in Fig13–17. The transition points identified by a sudden chanof physical observables are given in Table XII and plottedFig. 8. We note that theKt line for NF53 atNt54 locatessufficiently far from the points where theKc line bends rap-idly. This situation is quite different from theNF52 casewhere the unusual relation between theKt line andKc linecauses the lattice artifacts. Therefore, we expect that thlattice artifacts are small in theNF53 case.
In the previous section we have seen that the transitioof first order in the chiral limitKc50.235 atb53.0 forNF53. For phenomenological applications, it is importantestimate the critical value of the quark massmq
crit up to which
e
theec-
dn-me
ark
ticrge
alnto
alsi-on
s.gein
ese
n is
to
the first order phase transition persists.We observe clear two state signals atb 5 4.0, 4.5, and
4.7, while for b55.0 and 5.5 no such signals have beenseen: The simulation time history of the plaquette atb54.7 on a 12334 lattice is plotted in Fig. 18~a!. The con-fining and deconfining phases coexist over 1000 trajectoriesatK50.1795 and, in accordance with this, we find two-statesignals also in other observables such as the plaquette andthe pion screening massmp ~cf. Fig. 15!. From them weconclude that the transition atK50.1795(5) andb54.7 isfirst order. On the other hand, the time history of theplaquette atb55.0 shown in Fig. 18~b! suggests that thetransition is a crossover there.
At the transition point ~in the confining phase! ofb54.7 the value of mqa is 0.175~2! andmp /mr50.873(6). Theresults of the hadron spectrum in therange ofb53.0–4.7 forNF52 and 3~cf. Fig. 19! indicatethat the inverse lattice spacinga21 estimated from thermeson mass is almost independent ofb in this range anda21;0.8 GeV.~Hereafter we usea21 determined frommr
in the chiral limit.! Therefore we obtain a bound on the criti-cal quark mass mq
crit*140 MeV or, equivalently,(mp /mr)
crit>0.873(6). It should be noted that the physicalstrange quark mass determined frommf51020 MeV, usingthe data shown in Fig. 19, turns out to bems;150 MeV inthis b range with our definition of the quark mass.
We note that these values for the critical quark mass aremuch larger than those with staggered quarks wheremqcrita50.025–0.075 @38,39# (mq
crit;10–40 MeV usinga21;0.5 GeV atb55.2 forNF52 @40#! which means that(mp /mr)
crit.0.42 – 0.58~using the results of meson massesfor NF54 atb55.2 @41#, because the data forNF53 are notavailable!.
B. NF5211
Now let us discuss a more realistic case of massless upand down quarks and a light strange quark (NF5211). The
TABLE XXII. Hopping parameters forNF5211 simulations performed on 8231034 and 12334lattices.Kud for u andd quarks is set to be equal toKc andKs for s quarks is chosen so thatms'150 MeVand 400 MeV in the left and right columns, respectively.
ms'150 MeV ms'400 MeVb Kud Ks b Kud Ks
3.2 0.2329 0.2043 3.7 0.2267 0.16923.4 0.2306 0.2026 3.8 0.2254 0.16843.5 0.2295 0.2017 3.9 0.2240 0.16773.6 0.2281 0.2006 4.0 0.2226 0.16694.0 0.2226 0.1964 4.3 0.2180 0.1643

54 7029FINITE TEMPERATURE TRANSITIONS IN LATTICE . . .
main results of measurements are summarized in TabXIX–XXI. Our strategy to study the phase structure is simlar to that applied in Sec. VII for the investigation of thchiral transition in the degenerate quark mass cases, wwe called the on-Kc method. We set the value of masses fthe up and down quarksmud to zero (Kud5Kc), fix thestrange quark massms to some value, and make simulationstarting from a value ofb in the deconfining phase and reducing the value ofb. Whenu andd quarks are masslessthe number of iterations,Ninv , needed for the quark matrixinversion ~for u and d quarks! is enormously large in theconfining phase, while it is of order of several hundredsthe deconfining phase. The values which we take forKc aregiven in Table XXII. They are the vanishing point of extrapolatedmp
2 for NF52 and interpolated ones. We havused those forNF52, because we have the most data in thcase, and the difference between that forNF52 and 3 is ofthe same order of magnitude as the difference due todefinition ofKc ~cf. discussions in Sec. VII!.
FIG. 20. Time history of~a! Ninv and ~b! the plaquette forms;150 MeV on an 8231034 lattice.
FIG. 21. Time history of the plaquette forms;400 MeV on a12334 lattice.
lesi-ehichor
s-,
in
-eis
the
We study two cases ofms;150 MeV and 400 MeV.From the value ofa21;0.8 GeV and an empirical rulemqa.(2/3)(1/K21/Kc) satisfied forNF52 and 3 in thebregion we have studied~cf. Fig. 19!, we get the values forKs shown in Table XXII.
In order to confirm that our choice of parameters for thecasems;150 MeV is really close to the physical values, wehave also made a zero temperature spectroscopy calculationfor theNF5211 case atb53.5 on an 83310 lattice. Keep-ing Ks50.2017 (ms;150 MeV!, we varyKud from 0.195 to0.210 in steps of 0.005. Taking the chiral limit ofKud , weobtain a215903(38) MeV from the r meson [email protected](36) atKc50.2227, whereKc is determined bya linear extrapolation ofmp
2a2 in terms of 1/K#. The mass of
FIG. 22. Pion screening mass squaredmp2a2 versus b for
ms.0, 150, and 400 MeV withmud.0. Solid and open symbolsare for 8231034 and 12334 lattices, respectively.
FIG. 23. Order of the finite temperature QCD transition atNt54 in the (mud ,ms) plane. First order signals are observed at thepoints marked with solid circles, while no clear two-state signalsare found at the points with open circles. The second order transi-tion line is suggested@42# to deviate from the vertical axis asmud
}(ms*2ms)5/2 below ms* . The values of quark mass in physical
units are computed usinga21 determined frommr : a21;0.8 GeV
for b<4.7 and;1.0(1.8) GeV forb55.0(5.5). The real worlddetermined by the value ofmf /mr andmp /mr corresponds to thepoint marked with a star. It should be noted that the continuum limitis still far onNt54 lattices. See Sec. VIII for more detailed discus-sions and caveats on the values of the quark mass in physical unitsand the identification of the physical point.

-
.
7030 54IWASAKI, KANAYA, KAYA, SAKAI, AND YOSHIE´
thef meson at the simulation point turns out to be 1.03~5!GeV which should be compared with the physical value 1.GeV. Thus the hopping parameter chosen forms;150 MeVcorresponds to the physical strange quark mass, in this seAs far as we consider the meson sector the numerical resfor the mass ratio do not differ so much from the physicvalues. However, we emphasize one caveat here. Tnucleonr mass ratiomN /mr turns out to be 2.0~1! which isthe same as the result 2.0 in the strong coupling limit andmuch larger than the physical value 1.22. This implies thb53.5 is far from the continuum limit.
The simulation time history ofNinv on the 82310 spatial
lattice is plotted in Fig. 20~a! for the case of 150 MeV. Whenb>3.6, Ninv is of order of several hundreds, while wheb<3.4, Ninv shows a rapid increase witht. At b53.5 wesee a clear two-state signal depending on the initial contion: For a hot start,Ninv is quite stable around 900 andmp
2 islarge (;1.0 in lattice units!. On the other hand, for a mixstart,Ninv shows a rapid increase witht and exceeds 2500 int;10, and in accordance with this, the plaquette andmp
2
decreases witht as shown in Fig. 20~b! for the plaquette. Forthe case of 400 MeV a similar clear two-state signal is oserved atb53.9 both on the 82310 and 123 spatial lattices~cf. Fig. 21!. The values ofmp
2 versusb are plotted in Fig.22 together with those in the case of degenerateNF53 onthe Kc line. At b53.5 for the case of 150 MeV and ab53.9 for the case of 400 MeV, we have two values fomp2 depending on the initial configuration. The larger ones
order 1.0 are for hot starts, while the smaller ones are upbounds for mix starts. These results imply thatms**400MeV in our normalization for quark masses.
Following the Columbia group@39#, we summarize ourresults about the nature of the QCD transition atNt54 as afunction ofmud andms in Fig. 23, together with theoreticalexpectations@1,2,42# assuming that the chiral transition is osecond order forNF52. Clearly the point which correspondsto the physical values of the up, down, and strange quamasses measured bymf /mr andmp /mr exists in the rangeof the first order transition. If this situation persists in thcontinuum limit, the transition for the physical quark massis of first order.
The Columbia group studied the influence of the stranquark for the case of staggered quarks@39#. Their resultshows that no transition occurs atmua5mda50.025,msa50.1 (mu5md;12 MeV, ms;50 MeV usinga21;0.5 GeV!. Their zero temperature values formK /mr
andmp /mr obtained at this simulation point suggest that thvalue forms is smaller than its physical value and those fomu andmd are larger than their physical values. This impliethat the transition in the real world is also a crossover, unlethe second order transition line, which has a sharpmud de-pendence nearms* as shown in Fig. 23@42#, crosses betweenthe physical point and the simulation point.
Although both staggered and Wilson simulations givphase structures qualitatively consistent with theoretical epectations@1,2,42#, we note that Wilson quarks tend to givelarger values for critical quark masses~measured bymf /mr etc.! than those with staggered quarks. This leadsthe difference in the conclusions about the nature of tphysical transition. However, since the deviation from th
02
nse.ultsalhe
isat
n
di-
b-
trofper
f
rk
ees
ge
isrsss
ex-
tohee
continuum limit is large in both the studies atNt54, wecertainly should make a calculation with largerNt @43# orusing an improved action@32# to get closer to the continuumlimit and to obtain a definite conclusion about the nature ofthe QCD transition. With Wilson quarks using the standardgauge action, however,Nt should be enormously large(>18) @3# in order to avoid the lattice artifacts discussed inSec. VI. Improvement of the lattice action will be essentialespecially for Wilson quarks.
IX. CONCLUSIONS
We have studied the nature of finite temperature transi-tions near the chiral limit for various numbers of flavors(NF52, 3, and 6! and also for the case of massless up anddown quarks and a light strange quark (NF5211), mainlyon lattices withNt54, using the Wilson formalism of quarkson the lattice.
We have found evidence suggesting that the chiral transi-tion is continuous~at most very weakly first order! forNF52, while it is of first order forNF53 and 6. Theseresults are in accordance with theoretical predictions basedon universality@1,2#. Our results with Wilson quarks are alsoconsistent with those with staggered quarks@44#.
Our results for QCD with a strange quark as well as upand down quarks obtained onNt54 lattices are summarizedin Fig. 23. Clearly, the point which corresponds to the physi-cal values of the up, down, and strange quark masses measured bymf /mr andmp /mr , marked with star in Fig. 23,exists in the range of first order transition. If this situationpersists in the continuum limit, the transition for the physicalquark masses is of first order.
On the other hand, the previous result by the Columbiagroup @39# at Nt54 with staggered quarks suggests that thetransition in the real world is a crossover. We have foundthat Wilson quarks tend to give larger values for criticalquark masses~measured, for example, bymf /mr andmp /mr) than those with staggered quarks. This leads to thedifference in the conclusions about the nature of the physicaltransition. Because the deviation from the continuum limit islarge on theNt54 lattices in both studies, we certainlyshould make a calculation with largerNt or with an im-proved action@32# in order to get closer to the continuumlimit and to obtain a definite conclusion about the nature ofthe physical QCD transition, by resolving the discrepancybetween Wilson and staggered quarks for the conclusionsStudies with an improved gauge action and the Wilson quarkaction are in progress.
ACKNOWLEDGMENTS
The simulations have been performed with HITACS820/80 at the National Laboratory for High Energy Physics~KEK!, Fujitsu VPP500/30 at the Science Information Pro-cessing Center of the University of Tsukuba, and HITACH6080-FP12 at the Center for Computational Physics of theUniversity of Tsukuba. We would like to thank members ofKEK for their hospitality and strong support and we alsothank Sinya Aoki and Akira Ukawa for valuable discussions.This project was in part supported by the Grants-in-Aid ofMinistry of Education, Science and Culture~Nos.07NP0401, 07640375, and 07640376!.
54 7031FINITE TEMPERATURE TRANSITIONS IN LATTICE . . .
@1# R. Pisarski and F. Wilczek, Phys. Rev. D29, 338 ~1984!.@2# F. Wilczek, Int. J. Mod. Phys. A7, 3911~1992!; K. Rajagopal
and F. Wilczek, Nucl. Phys.B399, 395 ~1993!.@3# Y. Iwasaki, K. Kanaya, S. Sakai, and T. Yoshie´, in Lattice ’92,
Proceedings of the International Symposium, Amsterdam, TNetherlands, edited by J. Smit and P. van Baal@Nucl. Phys. B~Proc. Suppl.! 30, 327 ~1993!#; in Lattice ’93, Proceedings ofthe International Symposium, Dallas, Texas, edited byDraperet al. @ibid. 34, 314 ~1994!#.
@4# Y. Iwasaki, K. Kanaya, S. Sakai, and T. Yoshie´, Z. Phys. C71,337 ~1996!.
@5# Y. Iwasaki, K. Kanaya, S. Kaya, S. Sakai, and T. Yoshie´, Z.Phys. C71, 343 ~1996!; in Lattice ’94, Proceedings of theInternational Symposium, Bielefeld, Germany, edited byKarschet al. @Nucl. Phys. B~Proc. Suppl.! 42, 499~1995!#; K.Kanaya, Prog. Theor. Phys. Suppl.120, 25 ~1995!.
@6# K.G. Wilson, inNew Phenomena in Subnuclear Physics, ed-ited by A. Zichichi ~Plenum, New York, 1977!.
@7# Y. Iwasaki, inLattice ’94 @5#, p. 96.@8# K. Kanaya, inLattice ’95, Proceedings of the Internationa
Symposium, Melbourne, Australia, edited by T. D. Kievet al.@Nucl. Phys. B~Proc. Suppl.! 47, 144 ~1996!#.
@9# M. Bochicchio, L. Maiani, G. Martinelli, G. Rossi, and MTesta, Nucl. Phys.B262, 331 ~1985!.
@10# S. Itoh, Y. Iwasaki, Y. Oyanagi, and T. Yoshie´, Nucl. Phys.B274, 33 ~1986!.
@11# L. Maiani and G. Martinelli, Phys. Lett. B178, 265 ~1986!.@12# Y. Iwasaki, K. Kanaya, S. Sakai, and T. Yoshie´, Phys. Rev.
Lett. 69, 21 ~1992!.@13# Y. Iwasaki, K. Kanaya, S. Sakai, and T. Yoshie´, Phys. Rev.
Lett. 67, 1494~1991!.@14# Y. Iwasaki, T. Tsuboi, and T. Yoshie´, Phys. Lett. B220, 602
~1989!.@15# D. Daniel, R. Gupta, G. W. Kilcup, A. Patel, and S. R. Sharp
Phys. Rev. D46, 3130~1992!.@16# C. Bernardet al., Phys. Rev. D49, 3574~1994!.@17# S. Aoki, Phys. Rev. D30, 2653 ~1984!; Phys. Rev. Lett.57,
3136 ~1986!; Nucl. Phys.B314, 79 ~1989!; in QCD on Mas-sively Parallel Computers, Proceedings of the Japan-GermaSeminar, edited by A. Nakamura, K. Kanaya, and F. Kars@Prog. Theor. Phys. Suppl.122, ~1996!#.
@18# M. Fukugita, S. Ohta, and A. Ukawa, Phys. Rev. Lett.57,1974 ~1986!.
@19# S. Aoki, A. Ukawa, and T. Umemura, Phys. Rev. Lett.76, 873~1996!; in Lattice ’95 @8#, 511.
@20# S. Duane, A. D. Kennedy, B. J. Pendleton, and D. RowePhys. Lett. B195, 216 ~1987!.
@21# S. Gottlieb, W. Liu, D. Toussaint, R. L. Renken, and R. LSugar, Phys. Rev. D35, 2531~1987!.
he
T.
F.
l
.
e,
nch
th,
.
@22# T. Blum, L. Karkkainen, D. Toussaint, and S. Gottlieb, Phys.Rev. D51, 5153~1995!.
@23# F. R. Brownet al., Phys. Rev. D46, 5655~1992!.@24# Y. Oyanagi, Comput. Phys. Commun.42, 333 ~1986!; S. Itoh,
Y. Iwasaki, Y. Oyanagi, and T. Yoshie´, Nucl. Phys.B274, 33~1986!.
@25# M. Fukugita, Y. Oyanagi, and A. Ukawa, Phys. Lett. B203,145 ~1988!.
@26# A. Ukawa, in Lattice ’88, Proceedings of the InternationalSymposium, Batavia, Illinois, edited by A. S. Kronfeld and P.B. Mackenzie@Nucl. Phys. B~Proc. Suppl.! 9, 463 ~1989!#.
@27# R. Guptaet al., Phys. Rev. D44, 3272~1991!.@28# K. M. Bitar et al., Phys. Rev. D49, 3546~1994!.@29# C. Bernardet al., Phys. Rev. D46, 4741~1992!; in Lattice ’93
@3#, p. 324; T. Blumet al., Phys. Rev. D50, 3377~1994!.@30# R. Guptaet al., Phys. Rev. D40, 2072;~1989!.@31# K. Bitar et al., Phys. Lett. B234, 333~1990!; Phys. Rev. D43,
2396 ~1991!.@32# Y. Iwasaki, K. Kanaya, S. Sakai, and T. Yoshie´, in Lattice ’94,
p. 502; Y. Iwasaki, K. Kanaya, S. Kaya, S. Sakai, and T.Yoshie, in Lattice ’95,p. 515; Y. Iwasaki, K. Kanaya, S. Kaya,and T. Yoshie´, University of Tsukuba Report No. UTHEP-344, hep-lat/9609022, 1996~unpublished!.
@33# R. Gupta, G. Guralnik, G. Kilcup, A. Patel, and S. Sharpe,Phys. Rev. Lett.57, 2621~1986!.
@34# S. Itoh, Y. Iwasaki, and T. Yoshie´, Phys. Rev. D36, 527~1986!.
@35# A. Ukawa, inPhenomenology and Lattice QCD, Proceedingsof the Uehling Summer School, Seattle, Washington, 1993,edited by G. Kilcup and S. Sharpe~World Scientific, Sin-gapore, 1995!.
@36# H. Meyer-Ortmanns, H.-J. Pirne, and A. Patko´s, Phys. Lett. B295, 255~1992!; Int. J. Mod. Phys. C3, 993~1992!; S. Gavin,A. Gocksch, and R. D. Pisarski, Phys. Rev. D49, R3079~1994!; D. Metzger, H. Meyer-Ortmanns, and H.-J. Pirner,Phys. Lett. B321, 66 ~1994!; 328, 547~E! ~1994!.
@37# H. Meyer-Ortmanns and B.-J. Schaefer, Phys. Rev. D53, 6586~1996!.
@38# R. V. Gavai and F. Karsch, Nucl. Phys.B261, 273 ~1985!; R.V. Gavai, J. Potvin, and S. Sanielevici, Phys. Rev. Lett.58,2519 ~1987!.
@39# F. R. Brownet al., Phys. Rev. Lett.65, 2491~1990!.@40# For a review, see A. Ukawa, inLattice ’92 @3#, p. 3.@41# K. D. Born et al., Phys. Rev. D40, 1653~1989!.@42# K. Rajagopal, inQuark-Gluon Plasma 2, edited by R. Hwa
~World Scientific, Singapore, 1995!.@43# J. B. Kogut, D. K. Sinclair, and K. C. Wang, Phys. Lett. B263,
101 ~1991!.@44# For recent reviews see Kanaya@8#; C. DeTar, inLattice ’94
@5#, p. 73; F. Karsch, inLattice ’93 @3#, p. 63.


![Pion-Nucleon Scattering and the NN CouplingConstant in the ...Chiral models, such as the cloudy bag models [4], contain pions in additions to quarks, and therefore also contain elementary](https://img.dokumen.tips/doc/110x75/5ff9e2f54f2fc0639c435f4f/pion-nucleon-scattering-and-the-nn-couplingconstant-in-the-chiral-models-such.jpg)


![Chiral Perturbation Theory for Lattice QCDinspirehep.net/record/1338236/files/baer.pdf · [5] Chiral perturbation theory for staggered sea quarks and Ginsparg-Wilsonvalencequarks,](https://img.dokumen.tips/doc/110x75/5e6d7176f30da1321d183fb3/chiral-perturbation-theory-for-lattice-5-chiral-perturbation-theory-for-staggered.jpg)