Embed Size (px)
Citation preview
R E S EARCH ART I C L E
PUBL I C HEALTH
1Information Technology University, Lahore 54000, Pakistan. 2Computer Science and En-gineering, New York University, New York, NY 11201, USA. 3Courant Institute of Mathe-matical Sciences, New York University, New York, NY 10012, USA. 4Center for Technologyand Economic Development, NYU Abu Dhabi, Abu Dhabi PO Box 129188, United ArabEmirates. 5Computer Science and Engineering, University of Washington, Seattle, WA98195, USA. 6Punjab Information Technology Board, Lahore 54000, Pakistan.*Corresponding author. Email: [email protected]
Abdur Rehman et al. Sci. Adv. 2016; 2 : e1501215 8 July 2016
2016 © The Authors, some rights reserved;
exclusive licensee American Association for
the Advancement of Science. Distributed
under a Creative Commons Attribution
NonCommercial License 4.0 (CC BY-NC).
10.1126/sciadv.1501215
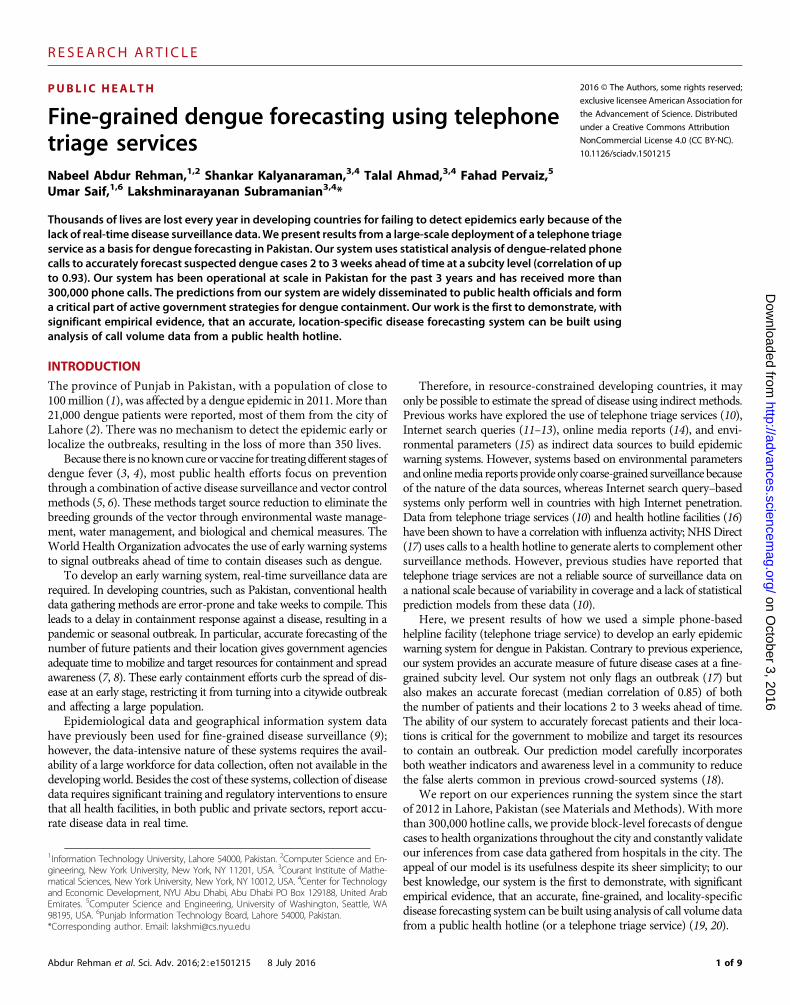
Fine-grained dengue forecasting using telephonetriage services
Nabeel Abdur Rehman,1,2 Shankar Kalyanaraman,3,4 Talal Ahmad,3,4 Fahad Pervaiz,5Umar Saif,1,6 Lakshminarayanan Subramanian3,4*
Dow
nload
Thousands of lives are lost every year in developing countries for failing to detect epidemics early because of thelack of real-time disease surveillance data.We present results from a large-scale deployment of a telephone triageservice as a basis for dengue forecasting in Pakistan. Our system uses statistical analysis of dengue-related phonecalls to accurately forecast suspected dengue cases 2 to 3 weeks ahead of time at a subcity level (correlation of upto 0.93). Our system has been operational at scale in Pakistan for the past 3 years and has received more than300,000 phone calls. The predictions from our system are widely disseminated to public health officials and forma critical part of active government strategies for dengue containment. Our work is the first to demonstrate, withsignificant empirical evidence, that an accurate, location-specific disease forecasting system can be built usinganalysis of call volume data from a public health hotline.
e
on October 3, 2016http://advances.sciencem
ag.org/d from
INTRODUCTION
The province of Punjab in Pakistan, with a population of close to100million (1), was affected by a dengue epidemic in 2011.More than21,000 dengue patients were reported, most of them from the city ofLahore (2). There was no mechanism to detect the epidemic early orlocalize the outbreaks, resulting in the loss of more than 350 lives.
Because there isnoknowncureor vaccine for treatingdifferent stagesofdengue fever (3, 4), most public health efforts focus on preventionthrough a combination of active disease surveillance and vector controlmethods (5, 6). These methods target source reduction to eliminate thebreeding grounds of the vector through environmental waste manage-ment, water management, and biological and chemical measures. TheWorld Health Organization advocates the use of early warning systemsto signal outbreaks ahead of time to contain diseases such as dengue.
To develop an early warning system, real-time surveillance data arerequired. In developing countries, such as Pakistan, conventional healthdata gathering methods are error-prone and take weeks to compile. Thisleads to a delay in containment response against a disease, resulting in apandemic or seasonal outbreak. In particular, accurate forecasting of thenumber of future patients and their location gives government agenciesadequate time tomobilize and target resources for containment and spreadawareness (7, 8). These early containment efforts curb the spread of dis-ease at an early stage, restricting it from turning into a citywide outbreakand affecting a large population.
Epidemiological data and geographical information system datahave previously been used for fine-grained disease surveillance (9);however, the data-intensive nature of these systems requires the avail-ability of a large workforce for data collection, often not available in thedevelopingworld. Besides the cost of these systems, collection of diseasedata requires significant training and regulatory interventions to ensurethat all health facilities, in both public and private sectors, report accu-rate disease data in real time.
Therefore, in resource-constrained developing countries, it mayonly be possible to estimate the spread of disease using indirect methods.Previous works have explored the use of telephone triage services (10),Internet search queries (11–13), online media reports (14), and envi-ronmental parameters (15) as indirect data sources to build epidemicwarning systems. However, systems based on environmental parametersandonlinemedia reports provideonly coarse-grained surveillance becauseof the nature of the data sources, whereas Internet search query–basedsystems only perform well in countries with high Internet penetration.Data from telephone triage services (10) and health hotline facilities (16)have been shown to have a correlation with influenza activity; NHSDirect(17) uses calls to a health hotline to generate alerts to complement othersurveillance methods. However, previous studies have reported thattelephone triage services are not a reliable source of surveillance data ona national scale because of variability in coverage and a lack of statisticalprediction models from these data (10).
Here, we present results of how we used a simple phone-basedhelpline facility (telephone triage service) to develop an early epidemicwarning system for dengue in Pakistan. Contrary to previous experience,our system provides an accurate measure of future disease cases at a fine-grained subcity level. Our system not only flags an outbreak (17) butalso makes an accurate forecast (median correlation of 0.85) of boththe number of patients and their locations 2 to 3 weeks ahead of time.The ability of our system to accurately forecast patients and their loca-tions is critical for the government to mobilize and target its resourcesto contain an outbreak. Our prediction model carefully incorporatesboth weather indicators and awareness level in a community to reducethe false alerts common in previous crowd-sourced systems (18).
We report on our experiences running the system since the startof 2012 in Lahore, Pakistan (see Materials andMethods). With morethan 300,000 hotline calls, we provide block-level forecasts of denguecases to health organizations throughout the city and constantly validateour inferences from case data gathered from hospitals in the city. Theappeal of our model is its usefulness despite its sheer simplicity; to ourbest knowledge, our system is the first to demonstrate, with significantempirical evidence, that an accurate, fine-grained, and locality-specificdisease forecasting system can be built using analysis of call volume datafrom a public health hotline (or a telephone triage service) (19, 20).
1 of 9

R E S EARCH ART I C L E
on October 3, 2016
http://advances.sciencemag.org/
Dow
nloaded from
RESULTS
Figure 1 shows the baseline data used in our analysis. Figure 1Ahighlightsthe high correlation between the number of dengue patients reported inhospitals and the rawnumber of “dengue symptom inquiry” calls receivedat the health hotline in Lahore for the years 2012–2013. In the data shownin Fig. 1A, the number of calls “lead” the number of patients. Although thenumber of calls aggregated at the city level has a strong correlationwith thenumber of cases during the year 2012 as shown in fig. S1, we observe thattheir relative variations across time and across different towns were notuniform. Hence, calls cannot be used alone to predict the number of casesand additional parameters, such as awareness level and climate conditionsneeded to be incorporated in the model. Figure S1 shows the cross-correlation values between suspected cases reported from hospitals andthe number of calls received at the health hotline for the city of Lahoreduring 2012. Figure 1 (B and C) shows that 7 of 10 towns in Lahorefollow a similar pattern: the relative amount of calls received from atown exhibits similar variations to the relative number of patients re-ported from the same town.
Althoughour baseline analysis shows a correlationbetween call volumedata and disease cases, the calling patterns of citizens are naturallydependent on the level of awareness about the telephone triage service.This is visible inFig. 1A.During the first peakof cases in2013, the awarenesscampaign activities are low, resulting in a lower number of calls beingreceived at the healthhotline. In contrast, during the secondpeakof casesin 2013, the awareness campaign activities are high, resulting in a higher
Abdur Rehman et al. Sci. Adv. 2016; 2 : e1501215 8 July 2016
number of hotline calls. Previous studies that used data from alternativedata sources did not incorporate this aspect; however, for public hotlineservices, it must be explicitly incorporated to address the inaccuracies in-troduced by variable levels of awareness across towns. Furthermore, pre-vious studies that reportedweak results (10) from the use of triage servicefor epidemic detection only relied on call volumedata and ignored otherfactors, such as weather conditions. Because temperature, precipitation,and humidity are critical tomosquito survival, reproduction, and develop-ment andcan influencemosquitopresence andabundance, ourmodel alsoincorporates city-level weather data (21).
Our dengue forecasting system is based on an ensemble model anduses the random forest learning algorithm. We predict log(S(w + 2,l))using C(w,l), A(w,l), H(w), T(w), R(w), where S(w + 2,l) is the suspectedcases reported during the second week after week w from town l; C(w,l)and A(w,l) are the number of calls received by health hotline and thenumber of awareness campaigns carried out in weekw in town l, respec-tively; andH(w), T(w), and R(w) are the average humidity, average tem-perature, and average rainfall duringweekw in the city (seeMaterials andMethods). The estimatedmodel showed that the number of calls was themost important feature to forecast log-suspected cases, followed byaverage temperature (see Table 1). The estimates generated obtaineda good fit with log-suspected cases reported from the government hos-pitals, with amedian rootmean square error (RMSE) of 0.80 (minimum,0.52; maximum, 1.1; n = 10 towns) and a median correlation of 0.85(minimum, 0.80; maximum, 0.93; n = 10 towns). Figure 2 shows the
Fig. 1. Trends in call volume and suspected dengue cases measured during 2012 and 2013. (A) Time series of calls (red), suspected dengue cases(black), and awareness campaigns (green points). Scale normalized by dividing by individualmaximum values. The x-axis label is in week of the year. (B) Densitymap of calls across towns in Lahore. (C) Density map of cases across towns in Lahore. The lightest shade represents the least number, and the darkest shaderepresents the highest number. The legend is normalized by the maximum value. Lat, latitude; long, longitude.
2 of 9

R E S EARCH ART I C L E
on October 3, 2016
http://advances.sciencemag.org/
Dow
nloaded from
model forecasts for 2012 and 2013 across all the towns in Lahore. In Pa-kistan, towns are the second smallest administrative units. Towns in La-hore have a median area of 57 km2 (minimum, 24; maximum, 516; n =10 towns).
To highlight the value added to the current model by the addition ofdata about the number of patients, the log(S(w,l)) term was introducedin the predictors. A similar methodology was used to estimate the denguecases 2 weeks in the future (see Materials and Methods). The estimates gen-erated from the newmodel obtained a median RMSE of 0.63 (minimum,0.50; maximum, 0.82; n = 10 towns) and a median correlation of 0.88(minimum, 0.80; maximum, 0.94; n = 10 towns), with log-suspected casesreported from the government hospitals as shown in Fig. 3.
Estimates for dengue cases 3weeks in the future, denoted log(S(w+ 3,l)),were also generated using a similar methodology. Estimates from themodelwithout data about thenumber of patients as a predictor obtained amedianRMSEof 0.80 (minimum, 0.54;maximum, 1.1;n=10 towns) andamediancorrelationof0.84 (minimum,0.77;maximum,0.91;n=10towns),whereas estimates from the model incorporating data about the number ofpatients as a predictor obtained a median RMSE of 0.67 (minimum, 0.53;maximum, 0.87;n=10 towns) and amedian correlation of 0.86 (minimum,0.77;maximum, 0.93; n = 10 towns). Figures S2 and S3 show forecasts fromboth models across all 10 towns.
Table 1 shows importance values for each of the predictors used in the2-week forecast ensemble model. Because fivefold cross-validation wasperformed, each value is an average of the five values respective to eachof the five models. Calculating variable importance in an ensemblemodel is difficult because the importance of a variable may be due toits interaction with other variables. In the random forest algorithm, In-cNodePurity for a variable is the total decrease in node impurities fromsplitting on the variable, averaged over all trees. This is done by mea-suring the residual sum of squares. The first column in Table 1 containsthe importance values of predictorswhen the complete data set was usedin designing the ensemble model. The second column in Table1 contains the importance values of predictors when the data of Julyto November (the monsoon season) were used. Both models suggestthat call volume is the most important predictor of the suspected denguecases. The relative importance of call volume toweatherparameters ishigherduring the dengue activity season. The relative importance of awareness cam-paignactivities increases indengue activity season, suggesting that both thenumber of awareness campaigns starts to increase during the dengue sea-sonwhen cases start to appear. The effect of awareness campaigns on othervariables, specifically calling patterns of people, also becomes more signifi-cant during the dengue season.
Abdur Rehman et al. Sci. Adv. 2016; 2 : e1501215 8 July 2016
We compare the predictive power of the random forest model with ageneralized linear model at both a city- and a subcity-level granularity. Forboth these models, we used the same training methodology as the randomforest (see Materials and Methods) and considered call volume data at thecorresponding granularity (city or subcity level). We note that reliableweather parameters are only available at the city level. At the city-levelgranularity, table S1 compares the individual predictive power of weatherparameters and call volume data in estimating the number of suspecteddengue cases 2 weeks in the future (on a log scale). The RMSE results sug-gest that the random forest model significantly outperformed the generalizedlinear model in predicting future dengue cases. Moreover, the best estimationsfor the future dengue cases weremade by themodels that incorporated allthe variables as opposed to those that used only a subset of the variables. Inaddition, themodels trainedusing the combinationof calls and awarenesslevel data provide a better estimation of future dengue cases than thosetrained using weather parameter data.
At a subcity granularity (town), we fit log-suspected cases of 2 weeksin the future using a generalized linear model. The estimates generatedfrom this model obtained a median RMSE of 1.11 (minimum, 0.96; maxi-mum, 1.53; n = 10 towns) and a median correlation of 0.55 (minimum,0.30; maximum, 0.71; n = 10 towns), with log-suspected cases reportedfrom the government hospitals as shown in fig. S4. In comparison, therandom forest model yields significantly lower RMSE values and signif-icantly higher correlation than the linear models.
Finally, we compare the predictive power of a subcity-level modelbased entirely on weather parameter data with our original model. Log-suspected cases of 2 weeks in the future for each town were fit separatelyusing a random forest model. The estimates generated from the modelobtained a median RMSE of 1.14 (minimum, 0.84; maximum, 1.35; n =10 towns) andamedian correlationof 0.51 (minimum, 0.26;maximum, 0.65;n=10towns),with log-suspectedcases reported fromthegovernment hospi-tals as shown in fig. S5.These results show thatweatherparameterdata alonedo not have enough predictive power to provide good dengue forecasts.
Deployment of a live systemOur phone-based dengue surveillance system described in this paper hasbeen successfully deployed in collaborationwith the government of PunjabinPakistan, and the results arewidely disseminated through the disease ac-tivity dashboard used by public health officials. A web service API callretrieves data from the backenddatabase andperforms statistical analysesoffline throughbatchmodeonaweeklybasis tomakepredictionsof2weeksin the future. To incorporate the changes in behavior of citizens callingin, each week with the addition of newer data, the model is retrained toincorporate the changes in behavior of users. The predictions are thengenerated on the basis of the newly trained model.
Figure 4 shows the different snapshots of the health hotline interfaceused by the operators and public health officials. The activity dashboardhelps them visualize quickly and evaluate the towns that are most vulner-able to an increase in suspected cases and thereby effectively allocate fieldworkers who perform targeted containment activity. Field workers in Punjabare equipped with smartphones by the government. A smartphone applica-tion developed by the government of Punjab allows field workers to geo-tagthe location and type of containment activity they have performed. Thishelps government officials ensure that the allocated task has indeed beenfulfilled by the field worker. It also helps the officials visualize the locationsof the activities and allocate additional workforce if required. Moreover,during the weekly denguemeetings, headed by the chairman of the Punjabgovernment, the health officials of the most vulnerable towns are required
Table 1. Random forest importance weights for parameters of themodel trained over the total year and season (July to November).
Parameter
Average IncNodePurityTotal
SeasonCalls
424.34 172.08Awareness
274.28 158.41Rainfall
123.14 50.89Humidity
287.40 81.65Temperature
349.38 137.613 of 9

R E S EARCH ART I C L E
on October 3, 2016
http://advances.sciencemag.org/
Dow
nloaded from
Fig. 2. Town-wise predictions of log-suspected cases from the ensemble model based on calls and weather data. Suspected dengue cases (black)and predictions from the model (red).
Abdur Rehman et al. Sci. Adv. 2016; 2 : e1501215 8 July 2016 4 of 9

R E S EARCH ART I C L E
on October 3, 2016
http://advances.sciencemag.org/
Dow
nloaded from
Fig. 3. Town-wise predictions of log-suspected cases from the ensemble model based on calls, cases, and weather data. Suspected dengue cases(black) and predictions from the model (red).
Abdur Rehman et al. Sci. Adv. 2016; 2 : e1501215 8 July 2016 5 of 9

R E S EARCH ART I C L E
on October 3, 2016
http://advances.sciencemag.org/
Dow
nloaded from
Fig. 4. Punjab Health Hotline Reporting System. (A) Interface used by operators to lodge complaints. (B) Interface used by officials to view com-plaints. (C) Types of complaints being lodged in the system. (D) Front-end interface of our dengue cases prediction system.
Abdur Rehman et al. Sci. Adv. 2016; 2 : e1501215 8 July 2016 6 of 9

R E S EARCH ART I C L E
to present a detailed report on their efforts to contain the disease in theirtowns. The predictions from our system are widely disseminated to publichealth officials and form a critical part of active government strategies fordengue containment. Since the introduction of these containment strategies,we have witnessed a reduction in the number of confirmed dengue pa-tients in Lahore from 21,000 in 2011 to just 257 in 2012 and 1600 in 2013.
on October 3, 2016
http://advances.sciencemag.org/
Dow
nloaded from
DISCUSSION
On thebasis of the results, we conclude that call volumedata froma simplehotline facility combinedwithwidely available city-levelweather data canserve as a goodpredictor of future suspected dengue cases at a fine-grainedsubcity level. Surprisingly, addingdata about thenumber of patients into theexistingmodel has amarginal effect in improving the prediction accuracy.The addition of data about the number of patients only provides im-provement in capturing the true peak of dengue activity during the highdengue activity season. The appeal of ourmodel is its usefulness despite itssheer simplicity; a simple phone-based health hotline can be used to forecastthe number of patients at a subcity location granularity 2 to 3weeks aheadof time.
Setting up ahealthhotline to support disease surveillancemechanismshas several advantages. The health hotline facility currently operational iscost-effective, making it ideal for resource-constrained environments indeveloping countries, suchasPakistan.Telephone triage–based surveillancesystems also allow governments to identify disease activity at subcitygranularities, leading to effective utilization of their limited health fieldworkers for targeted containment. The forecasts generated from such asystem can become a substitute to the paper-based patient report data inoutbreak detection systems, which may take weeks to compile. Thehealthhotline canbe easily extended tomonitormultiple diseaseswithoutany substantial increase in allocation of resources; the current health hot-line deployed inPakistan is also beingused tomonitor polio disease cases.Finally, health hotlines can provide an easy and centralized interface togather patient reports from hospitals.
Despite the extensiveutility of the calls toahealthhotline, systemsbasedon call volume have to address several challenges carefully. First, the callsto the health hotline included in our analysis are not exclusively made bydengue patients; patients suffering from diseases with similar symptoms,suchasmalaria, can contribute to an increase in call volume.Therefore, it isimportant to devise criteria carefully for identifying calls pertaining to atarget disease.Moreover, the use of a healthhotline largely depends on theamount of awareness present in a community about the health hotline.Hence, regular awareness campaignsare essential topromote thecontinuoususe of the health hotline. These awareness campaigns are often in the formof radio and television (TV) commercials, banner postings, and awarenessgroupmeetings. At the same time, as in ourmodel, the level of awarenessneeds tobe incorporated separately in thedisease forecastingmodels.Giventhe fact that patients who suffer from a particular strain of dengue virus be-come immune to it, we assume thatmost of the callers to the healthhotlineare first-time callers. The same cannot be said about diseases that are reoc-curring in the same individuals.Hence, further studies need to be carried outto find the exact relation between the increase in awareness level in an indi-vidual or a community and the decrease in thenumber of calls to thehealthhotline. Nevertheless, we suggest continuous retraining of the model withthe latest data sets to account for changes in unknownvariables over time.Last, calling patterns within a city for individual localities may vary becauseof the difference in socioeconomic conditions of the inhabitants. Given that
Abdur Rehman et al. Sci. Adv. 2016; 2 : e1501215 8 July 2016
the socioeconomic data of inhabitants are generally not available in devel-oping countries, we recommend training separatemodels for each locality.
In summary, ourworkdemonstrateshowaresource-constraineddevel-oping country, such as Pakistan, can effectively use a health hotline–basedsystem to provide accurate dengue case forecasts, at fine-grained gran-ularities, 2 to 3 weeks ahead of time. On the basis of our deployment ex-periences over a 3-year timeperiod,wehave observed the direct impact ofthe hotline system. Our system has helped public health officials to takeearly actions to contain the spread of the disease and provide hospitalsan early warning of dengue cases in their vicinity. We believe that thissystem can also be used for a broad array of diseases beyond dengue andcan easily be replicated in other developing countries at low costs.
MATERIALS AND METHODS
Health hotlineIn response to the 2011 outbreak in Lahore, the provincial government inPunjab, Pakistan launched amultipronged effort to combat the epidemicand improve its surveillance and rapid response system. A phone-baseddisease helpline systemwas introduced, and a toll-free numberwaswidelypublicized through TV and radio advertisements. There are up to 100 op-erators during an outbreak period dedicated to serving up to 5000 calls aday. Since the inception of the system in September 2011, more than300,000 calls have been fieldedby the system.Callers use the health hotlineto inquire if the symptoms they are having are the symptoms for denguedisease. If this is the case, the first responder guides them to thenearest hos-pitals and provides a brief description of the tests to be conducted and bedavailability in the hospitals. In addition, callers can request insecticide sprayat homes or in neighborhoods. The helpline has also been used to reportsewage leaks, stagnant water accumulation, and overcharging for hospi-tal treatment. The first responders assign a category to each call. These re-quests are used by public health workers to prioritize sanitation andgarbage collection drives. The health hotline is accessible throughout theyear to serve as an informationportal and to collect real-time citizen feed-back. The operators of the health hotline are trained bymedical personnelwith detailed instructions to handle calls andmanuals to identify symp-toms of dengue. During the dengue season, doctors are also available atthe health hotline, and the operators are instructed to forward the callsto the doctors in case of any ambiguity.
Awareness campaignsAs part of the initiative, the health workers in the government of Punjabwere tasked to visit neighborhoods and spread awareness about denguefever. Awareness seminars are carried out in mosques, schools, and othercommunity settings to inform the general public about the symptoms,spread, and prevention of dengue. The health hotline number is widelydisseminated during these seminars as ameans to discuss symptoms orto inquire about bed availability in hospitals, if someone is suspected ofhaving dengue. Although these seminars are carried out throughout theyear, their frequency increases during the high dengue activity season.Records for each awareness seminar are kept by the government for futureallocation of workers to spread awareness in a given town.
Hospitals and definition of casesDuring the dengue outbreak, the government institutionalized a regimewhere any patient suspected of dengue is sent to a public sector hospitalfor further tests and treatment. These public sector hospitals fromLahore
7 of 9

R E S EARCH ART I C L E
on October 3, 2016
http://advances.sciencemag.org/
Dow
nloaded from
admitted dengue patients in specialized dengue wards and are accessibleto the general public. The government placed three computer operators ineach hospital to enter the data of dengue patients in a centralized patienttracking system. Criteria were devised by the Dengue Expert AdvisoryGroup (DEAG) in Pakistan to identify suspected dengue patients so theycould be referred for laboratory tests. According to the criteria, if a patientshows three or more of the following symptoms, the patient will bemarked as a “suspected dengue case.”These symptoms include fever of2 to 10 days, retro-orbital pain,myalgia, arthralgia/severe backache, rash,bleedingmanifestations (epistaxis, hematemesis, bloody stools,menorrhagia,and hemoptysis), abdominal pain, decreased urinary output despite ade-quate fluid intake, and irritability in infants.
MethodsFor our analysis, we used data from the Punjab government’s toll-freehealth hotline service. A single call unit, included in our analysis, is definedas the call received at the health hotline, categorized by the operator as adengue symptoms inquiry call. The location of the caller is based on the in-formation either provided by the caller or inferred by the first responderusing the address given by the caller. The operators are also allowed tomarka call as irrelevant; these calls were excluded from our analysis. Dengueawareness campaigns data were recorded from the health hotline. Asingle awareness activity unit is defined as a dengue awareness seminarcarried out by a health worker from the government and reported at thehealth hotline.Weather data used in our analysis were retrieved from thePunjabmeteorologicaldepartment.Unlike the calls andawareness leveldata,which are available at subcity location granularity, only coarse-grained city-levelweatherparameterdatawere available. Finally, thenumberof suspecteddengue case data was retrieved from all public sector hospitals in Lahorebetween 2012 and 2013. A suspected dengue patient is defined as a pa-tient who shows symptoms of dengue and is referred for a standardizedlaboratory test by the doctor. The location of the patient is determined onthe basis of the residence address provided by the patient at the hospital.
Our dengue forecasting system is based on an ensemble model. Weuse call volume data divided across 10 towns in the city of Lahore.Widelyavailable city-level weather parameters, specifically humidity, rainfall,and temperature, are used in the model to incorporate the seasonalityof diseases such as dengue (21). Finally, because health hotline awarenessamong citizens can affect calling patterns, our system treats awareness asa separate parameter using the number of recorded hotline publicity ac-tivities in a given time period as proxy. It is important to highlight thatprevious systems, suchasGoogle FluTrends andNHSDirect, that purelyuse query volume data for prediction,may generate inaccurate estimatesof anoutbreakbecause they fail to incorporate critical awareness level datain theirmodel (18). Awareness level can be defined as the likelihood thata personwill use an alternative source, such as a search engine or a healthhotline, to inquire about symptoms of a disease at a given time of a year.Specific to searchqueries, this canvary for several reasons; if a newdisease-related drug is introduced in themarket or if a celebrity gets infectedwitha disease, people are more likely to search online about the disease, con-tributing to an increase in searches. This leads to an overestimation ofdisease activity, which is a common problem in previous systems (18).Hence, awareness level data need to be incorporated in themodel to caterfor varying population interest in the alternative data source.Moreover, itis also important to note that although an increase in search queries andinternet awareness can be a result of a wide range of factors, increasingawarenessof ahealthhotline is largelydependenton thepublicity it receivesduring the awareness campaigns. Because these awareness campaigns and
Abdur Rehman et al. Sci. Adv. 2016; 2 : e1501215 8 July 2016
their locations can be easily monitored, they can be easily accounted for inour model. Finally, the suspected dengue case data were taken from thehospitals in Punjab to serve as the response variable in our model.Our ensemble model uses the random forest learning algorithm. The
choice to use a random forest–based learning algorithm was largelyguided by the advantages over linear regression/classification methods.Given the nonlinearity observed in the data, the random forest algorithmsignificantly mitigates the possibility of overfitting by using an ensemblecollectionof decision trees and randomizing over features used in trainingeach individual decision tree (see Fig. 1 and fig. S4). Random forests alsoallowfor easy interpretabilityof thevariable importanceof features.Althoughother more sophisticated models, such as gradient-boosted decision trees,were viable alternatives, the performance gains we achieved using ran-dom forests combined with the convenience of training and deploymentinto our online outbreak detection system led us to favor random forests.Between 1 January 2012 and 31 December 2013, data from the city of
Lahore were recorded from the mentioned sources. Weekly counts foreach town were computed separately. Weekly aggregates of 2 years for10 towns generated a total of 1030 points. To validate our hypothesis, weperformed, fivefold cross-validation. The data points were split into fiverandomly selected nonoverlapping folds, each containing 206 points. Aregion-independent random forest model of regression trees comprising500 trees and three-node sampling was trained using four folds and va-lidated on theheld-out fold. Theprocesswas repeated until each fold hadbeenvalidated.Theperformanceof themodelswas evaluatedusingRMSEand correlationvalues. Thiswasdone to capture the efficiencyof themodelin forecasting the exact values andcapturingvariations in peaks and lows ofthe predicted values.
SUPPLEMENTARY MATERIALSSupplementary material for this article is available at http://advances.sciencemag.org/cgi/content/full/2/7/e1501215/DC1fig. S1. Cross-correlation between suspected incidences reported at hospitals and callsreceived at the health hotline in Lahore for the year 2012.fig. S2. Town-wise predictions of 3-week log-suspected incidence forecast from ensemblemodel based on calls and weather data.fig. S3. Town-wise predictions of 3-week log-suspected incidence forecast from ensemblemodel based on calls, cases, and weather data.fig. S4. Town-wise predictions of 2-week log-suspected incidence forecast from generalizedlinear model based on calls and weather data.fig. S5. Town-wise predictions of 2-week log-suspected incidence forecast from location-dependent ensemble model based on weather data.table S1. RMSE values between predicted and actual number of log-suspected cases forvarious models trained on coarse-grained city-level data set.
REFERENCES AND NOTES1. Population Profile Punjab | Population Welfare Department (Population Profile Punjab |
Population Welfare Department), www.pwd.punjab.gov.pk/population_profile [accessedSeptember 1, 2015].
2. M. A. Khan, E. M. Ellis, H. A. Tissera, M. Y. Alvi, F. F. Rahman, F. Masud, A. Chow, S. Howe,V. Dhanasekaran, B. R. Ellis, D. J. Gubler, Emergence and diversification of dengue 2 cosmo-politan genotype in Pakistan, 2011. PLOS One 8, e56391 (2013).
3. C. Ash, Dangerous dengue provocation. Sci. Signal. 3, ec145 (2010).4. National Institute of Allergy and Infectious Diseases, Dengue fever treatment; www.niaid.nih.
gov/topics/denguefever/understanding/pages/treatment.aspx [accessed September 1, 2015].5. World Health Organization, Planning social mobilization and communication for dengue
fever prevention and control; www.who.int/tdr/publications/documents/planning_dengue.pdf [accessed September 1, 2015].
6. Centers for Disease Control and Prevention, Dengue symptoms and treatment; www.cdc.gov/dengue/symptoms/ [accessed September 1, 2015].
8 of 9

R E S EARCH ART I C L E
http://advances.sciD
ownloaded from
7. N. M. Ferguson, D. A. T. Cummings, S. Cauchemez, C. Fraser, S. Riley, A. Meeyai,S. Iamsirithaworn, D. S. Burke, Strategies for containing an emerging influenza pandemicin Southeast Asia. Nature 437, 209–214 (2005).
8. I. M. Longini Jr., A. Nizam, S. Xu, K. Ungchusak, W. Hanshaoworakul, D. A. T. Cummings,M. E. Halloran, Containing pandemic influenza at the source. Science 309, 1083–1087 (2005).
9. V. Racloz, R. Ramsey, S. Tong, W. Hu, Surveillance of dengue fever virus: A review ofepidemiological models and early warning systems. PLOS Negl. Trop. Dis. 6, e1648 (2012).
10. W. K. Yih, K. S. Teates, A. Abrams, K. Kleinman, M. Kulldorff, R. Pinner, R. Harmon, S. Wang,R. Platt, Telephone triage service data for detection of influenza-like illness. PLOS One 4,e5260 (2009).
11. J. Ginsberg, M. H. Mohebbi, R. S. Patel, L. Brammer, M. S. Smolinski, L. Brilliant, Detectinginfluenza epidemics using search engine query data. Nature 457, 1012–1014 (2009).
12. E. H. Chan, V. Sahai, C. Conrad, J. S. Brownstein, Using web search query data to monitordengue epidemics: A new model for neglected tropical disease surveillance. PLOS Negl.Trop. Dis. 5, e1206 (2011).
13. B. M. Althouse, Y. Y. Ng, D. A. T. Cummings, Prediction of dengue incidence using searchquery surveillance. PLOS Negl. Trop. Dis. 5, e1258 (2011).
14. C. C. Freifeld, K. D. Mandl, B. Y. Reis, J. S. Brownstein, HealthMap: Global infectious diseasemonitoring through automated classification and visualization of internet media reports.J. Am. Med. Inform. Assoc. 15, 150–157 (2008).
15. S. Hales, N. de Wet, J. Maindonald, A. Woodward, Potential effect of population and climatechanges on global distribution of dengue fever: An empirical model. Lancet 360, 830–834 (2002).
16. A. Doroshenko, D. Cooper, G. Smith, E. Gerard, F. Chinemana, N. Verlander, A. Nicoll, Evaluationof syndromic surveillance based on National Health Service Direct derived data–England andWales. Morb. Mortal. Wkly. Rep. 54, 117–122 (2005).
17. D. L. Cooper, G. Smith, M. Baker, F. Chinemana, N. Verlander, E. Gerard, V. Hollyoak,R. Griffiths, National symptom surveillance using calls to a telephone health advice service—United Kingdom, December 2001–February 2003.Morb. Mortal. Wkly. Rep. 53, 179–183 (2004).
18. D. R. Olson, K. J. Konty, M. Paladini, C. Viboud, L. Simonsen, Reassessing Google Flu Trendsdata for detection of seasonal and pandemic influenza: A comparative epidemiologicalstudy at three geographic scales. PLOS Comput. Biol. 9, e1003256 (2013).
19. S. Runge‐Ranzinger, P. J. McCall, A. Kroeger, O. Horstick, Dengue disease surveillance: Anupdated systematic literature review. Trop. Med. Int. Health 19, 1116–1160 (2014).
20. B. M. Althouse, S. V. Scarpino, L. A. Meyers, J. W. Ayers, M. Bargsten, J. Baumbach,J. S. Brownstein, L. Castro, H. Clapham, D. A. T. Cummings, S. Del Valle, S. Eubank,
Abdur Rehman et al. Sci. Adv. 2016; 2 : e1501215 8 July 2016
G. Fairchild, L. Finelli, N. Generous, D. George, D. R. Harper, L. Hébert-Dufresne,M. A. Johansson, K. Konty, M. Lipsitch, G. Milinovich, J. D. Miller, E. O. Nsoesie,D. R. Olson, M. Paul, P. M. Polgreen, R. Priedhorsky, J. M. Read, I. Rodríguez-Barraquer,D. J. Smith, C. Stefansen, D. L. Swerdlow, D. Thompson, A. Vespignani, A. Wesolowski, En-hancing disease surveillance with novel data streams: Challenges and opportunities. EPJData Sci. 4, 17 (2015).
21. Centers for Disease Control and Prevention, www.cdc.gov/Dengue/entomologyEcology/climate.html [accessed September 1, 2015].
Acknowledgments: We thank the government of Punjab and the Punjab Information TechnologyBoard for initiating this project and providing funding and logistical support for this project. We thankthe Pakistan Meteorological Department for sharing the weather data sets. Funding: N.A.R. and T.A.were supported as research assistants by Information Technology University, Pakistan, and New YorkUniversity (NYU) during the course of this project.We thank theNYUAbuDhabi Research Institute andthe Center for Technology and Economic Development (CTED) at NYU Abu Dhabi for providingfunding support for L.S., T.A., and S.K. in this project. S.K. was also partially supported as a postdoctoralfellow by an NSF grant. F.P. is supported on a doctoral fellowship by the University of Washington.Author contributions: T.A., F.P., N.A.R., and U.S. worked closely with the Punjab Information Technol-ogy Board to deploy the system, collect the data, and disseminate the results. N.A.R., S.K., L.S., andU.S. designed the study, methods, data analysis, and results. N.A.R., L.S., U.S., and S.K. wrote themanuscript. L.S. and U.S. guided the project and edited themanuscript.Competing interests: Theauthors declare that they have no competing interests. Data andmaterials availability: All data,at an aggregated level, needed to evaluate the conclusions in the paper are present in the paperand/or the Supplementary Materials. Environmental data is publicly available in PakistanMeteoro-logical department’s website. Call volume data, awareness campaign data, and dengue cases dataare the property of the government of Punjab, Pakistan. Under the agreement with the govern-ment of Punjab, these data sets may be requested from the authors.
Submitted 1 September 2015Accepted 15 June 2016Published 8 July 201610.1126/sciadv.1501215
Citation: N. Abdur Rehman, S. Kalyanaraman, T. Ahmad, F. Pervaiz, U. Saif, L. Subramanian,Fine-grained dengue forecasting using telephone triage services. Sci. Adv. 2, e1501215 (2016).
en
9 of 9
on October 3, 2016
cemag.org/

doi: 10.1126/sciadv.15012152016, 2:.Sci Adv
(July 8, 2016)Fahad Pervaiz, Umar Saif and Lakshminarayanan Subramanian Nabeel Abdur Rehman, Shankar Kalyanaraman, Talal Ahmad,servicesFine-grained dengue forecasting using telephone triage
this article is published is noted on the first page. This article is publisher under a Creative Commons license. The specific license under which
article, including for commercial purposes, provided you give proper attribution.licenses, you may freely distribute, adapt, or reuse theCC BY For articles published under
. hereAssociation for the Advancement of Science (AAAS). You may request permission by clicking for non-commerical purposes. Commercial use requires prior permission from the American
licenses, you may distribute, adapt, or reuse the articleCC BY-NC For articles published under
http://advances.sciencemag.org. (This information is current as of October 3, 2016):The following resources related to this article are available online at
http://advances.sciencemag.org/content/2/7/e1501215.fullonline version of this article at:
including high-resolution figures, can be found in theUpdated information and services,
http://advances.sciencemag.org/content/suppl/2016/07/05/2.7.e1501215.DC1 can be found at: Supporting Online Material
http://advances.sciencemag.org/content/2/7/e1501215#BIBL 3 of which you can access for free at: cites 16 articles,This article
trademark of AAAS otherwise. AAAS is the exclusive licensee. The title Science Advances is a registered York Avenue NW, Washington, DC 20005. Copyright is held by the Authors unless statedpublished by the American Association for the Advancement of Science (AAAS), 1200 New
(ISSN 2375-2548) publishes new articles weekly. The journal isScience Advances
on October 3, 2016
http://advances.sciencemag.org/
Dow
nloaded from