Embed Size (px)
Citation preview

Findings PresentationApril 29,2015
Parks and Recreation Master Plan Meridian, Idaho

Process Demographics Survey Results Level of Service Key Issues Reoccurring Themes Preliminary Recommendations Q & A
Agenda

Process Start-up Community Input
Focus Groups Stakeholder Meeting MindMixer Survey
GRASP Inventory Level of Service Analysis Findings Presentation Visioning Workshop Operational & Maintenance Analysis
Program & Other Service Provider Analysis Organizational Analysis
Draft Plan & Presentation Final Plan & Presentation
City of Meridian, IdahoParks and Recreation Master PlanProject Timeline 2014 - 2015
Tasks and Key Meetings Months
D J F M A M J J A S
I. Strategic Kick-Off and Determination of Critical Success Factors X
Task 1: Department Values, Vision and Mission X X
II. Inventory and Level of Service Analysis
Task 2: Park Classification System X X
Task 3: Inventory X X
Task 4: Level of Service Recommendations X X
III. Public Engagement Process (Task 5) X X X
Statistically-Valid Survey X X
IV. Recommendations and Strategic Goals (Task 6) X X X
V. Strategic Action and Implementation Plan (Task 7) X X
VI. Staffing and Organization (Task 8) X X
VII. Urban Forestry Management Strategy (Task 9) X X
VIII. Pathways Plan (Task 10) X X
IX. Park Conceptual Design (Task 11) X X
X. Draft and Final Plans, Presentations, and Deliverables X

Focus Group Summary
125 Participants in8 Focus Groups8 Interviews1 Town Hall Meeting

Demographics
Summary Demographics 2014
Population 82,814
Number of Households 27,883
Avg. Household Size 2.96
Median Age 33.58
Median Household Income $59,969
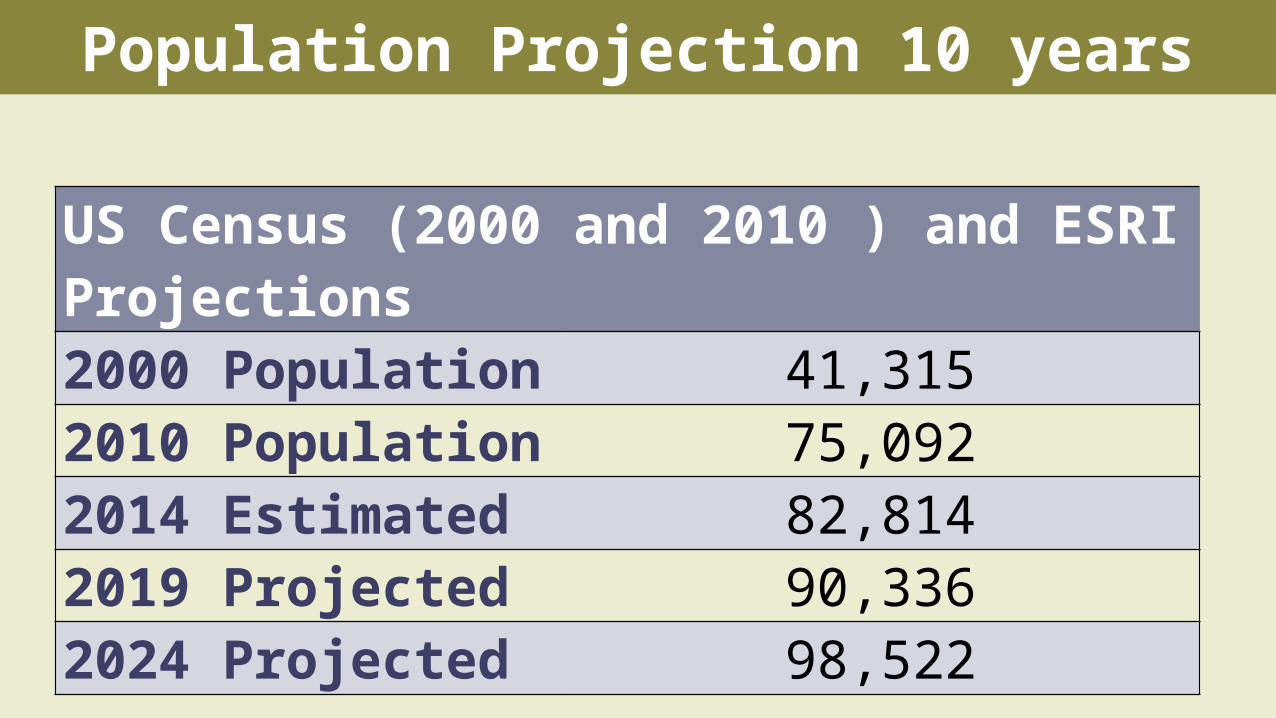
Population Projection 10 years
US Census (2000 and 2010 ) and ESRI Projections 2000 Population 41,3152010 Population 75,0922014 Estimated 82,8142019 Projected 90,3362024 Projected 98,522

Population Projection by Age
0 - 4 5 - 9 10 - 14 15 - 19 20 - 24 25 - 34 35 - 44 45 - 54 55 - 64 65 - 74 75 - 84 85+0.0%
2.0%
4.0%
6.0%
8.0%
10.0%
12.0%
14.0%
16.0%
18.0%
201020142019

Survey Results
3,500 Random Sample Surveys mailed March 20, 2015Open Link online survey released April 6, 2015As of April 20, 2015Mailed survey responses 700 (20%)Open Link survey response 379Total responses 1,079

Paper/Web Invite Open Link
0% 10% 20% 30% 40%
Percent of Respondents
0% 20% 40% 60%
Percent of Respondents
Age
Under 35
35-44
45-54
55-64
65-74
75 or over
Marital Status
Single, no children
Couple, no children
Single with children at home
Couple with children at home
Single, children no longer at home
Couple, children no longer at home
Household Income
Under $25,000
$25,000-49,999
$50,000-74,999
$75,000-99,999
$100,000-149,999
$150,000-199,999
$200,000-249,999
$250,000 or more
16%
25%
24%
21%
14%
1%
2%
9%
12%
24%
35%
18%
36%
8%
28%
4%
14%
9%
16%
1%
61%
7%
9%
6%
2%
2%
5%
17%
19%
26%
20%
9%
3%
3%
9%
25%
24%
22%
13%
1%
Demographic Profile
AveragePaper/Web InviteOpen Link 46.2
60.0
AveragePaper/Web InviteOpen Link $99,686
$81,613

Paper/Web Invite Open Link
0% 20% 40% 60%
Percent of Respondents
0% 10% 20% 30% 40%
Percent of Respondents
How long haveyou lived in theMeridian area?
Less than a year
1
2 - 3
4 - 10
11 - 20
21 or more
In which area ofthe city do youlive?
South (south of I-84)
Central (between I-84 and CherryLane/Fairview Ave.)
Northwest (west of Meridian Rd.and north of Cherry Lane)
Northeast (east of Meridian Rd.and north of Fairview Ave.)
Other
32%
43%
23%
2%
1%
0%
14%
32%
37%
7%
3%
7%
0%
4%
5%
38%
53%
14%
23%
32%
12%
19%
Length of Time in Meridian and Area of Residence
AveragePaper/Web InviteOpen Link 11.9
20.2

0% 10% 20% 30% 40% 50% 60% 70% 80% 90% 100%
Percent of Respondents
Importance of Local Parks andRecreation Opportunities
1 - Not at allimportant
2
3 - Neutral
4
5 - Veryimportant
Registered forClasses/Programs in Last 12Months
Yes
No
Rate the Service You Received 1 - Poor
2
3 - Average
4
5 - Excellent
1%5%
1%4%
7%19%
28%33%
63%38%
34%10%
66%90%
0%5%
0%2%
8%8%
42%40%
49%46%
Class/Program Participation and Ratings
Paper/Web InviteOpen Link
AveragePaper/Web InviteOpen Link 4.5
3.9
AveragePaper/Web InviteOpen Link 4.4
4.2

Paper/Web Invite Open Link
0% 10% 20% 30% 40% 50% 60%
Percent of Respondents
0% 20% 40% 60% 80%
Percent of Respondents
Settlers Park
Julius M. Kleiner Memorial Park
Storey Park
Tully Park
Bear Creek Park
Gordon Harris Park
City Hall Plaza
Renaissance Park
Generations Plaza
Community Center
Centennial Park
Heroes Park
Chateau Park
8th Street Park
Heritage Middle School Ball Fields
Jabil Fields
Champion Park
Seasons Park 1%
1%
2%
2%
2%
3%
3%
5%
5%
6%
7%
10%
12%
22%
30%
50%
51%
54%
1%
4%
3%
12%
2%
7%
14%
1%
8%
5%
8%
3%
4%
17%
28%
26%
59%
79%
Please identify the three facilities/parks you use most often:

0% 10% 20% 30% 40% 50% 60% 70% 80%
Percent of Respondents
Pathways/Trails
Picnic Shelters
Playgrounds
Community/Recreation Center
Swimming Pools/Aquatic Facilities
Athletic Fields
Indoor Gym Space
Ball Fields
Outdoor Basketball Courts
Dog Parks
Splash Pads
Tennis Courts
Rodeo Grounds
76%10%
69%13%
63%19%
53%21%
52%24%
39%33%
38%34%
37%35%
34%39%
34%45%
33%38%
31%40%
14%58%
Importance of Facilities Operated by Meridian PRD - Invitation Sample Only% 4 & 5 (Important) vs. % 1 & 2 (Not Important)
Percent 4 & 5 (Important)Percent 1 & 2 (Not Important)

0% 5% 10% 15% 20% 25% 30% 35% 40% 45% 50% 55% 60%
Percent of Respondents
Senior Programs
Youth Sports
Family Programs (all ages)
Adult Programs (Non-Sports)
Youth Progams (Non-Sports)
Outdoor Adventure Programs
Teen Programs
Youth Camps
Adult Sports
55%
23%
51%
27%
50%
23%
44%
24%
43%
30%
41%
26%
38%
34%
33%
37%
31%
34%
Importance of Programs Operated by Meridian PRD - Invitation Sample Only% 4 & 5 (Important) vs. % 1 & 2 (Not Important)
Percent 4 & 5 (Important)Percent 1 & 2 (Not Important)

Paper/Web Invite Open Link
1 2 3 4 5
Average Rating
1 2 3 4 5
Average Rating
Pathways/Trails
Picnic Shelters
Playgrounds
Community/Recreation Center
Senior Programs
Swimming Pools/Aquatic Facilities
Family Programs (all ages)
Youth Sports
Adult Programs (Non-Sports)
Outdoor Adventure Programs
Youth Progams (Non-Sports)
Athletic Fields
Indoor Gym Space
Teen Programs
Ball Fields
Youth Camps
Splash Pads
Adult Sports
Outdoor Basketball Courts
Dog Parks
Tennis Courts
Rodeo Grounds
4.1 4.4
3.8 4.1
3.7 4.1
3.4 3.8
3.4 3.2
3.4 3.7
3.3 3.7
3.3 4.0
3.2 3.3
3.2 3.7
3.1 3.7
3.0 3.8
3.0 3.5
2.9 3.5
2.9 3.3
2.8 3.3
2.8 3.4
2.8 3.6
2.8 3.1
2.8 3.2
2.7 3.0
2.1 2.1
Importance of Facilities and Programs Operated by Meridian PRD Average Rating (1=Not at all Important, 5=Very Important)

0% 10% 20% 30% 40% 50% 60% 70% 80%
Percent of Respondents
Playgrounds
Ball Fields
Picnic Shelters
Athletic Fields
Splash Pads
Pathways/Trails
Outdoor Basketball Courts
Tennis Courts
Community/Recreation Center
Swimming Pools/Aquatic Facilities
Dog Parks
Rodeo Grounds
Indoor Gym Space
77%
4%
71%
6%
69%
6%
69%
6%
51%
15%
50%
19%
50%
13%
48%
15%
47%
22%
45%
24%
39%
36%
35%
36%
35%
34%
Needs Met by Facilities Operated by Meridian PRD - Invitation Sample Only% 4 & 5 (Needs Met) vs. % 1 & 2 (Needs Unmet)
Percent 4 & 5 (Needs Met)Percent 1 & 2 (Needs Unmet)

0% 5% 10% 15% 20% 25% 30% 35% 40% 45% 50% 55% 60% 65%
Percent of Respondents
Youth Sports
Youth Progams(Non-Sports)
Senior Programs
Youth Camps
Family Programs (all ages)
Teen Programs
Adult Sports
Adult Programs(Non-Sports)
Outdoor AdventurePrograms
62%
8%
55%
9%
53%
15%
51%
14%
51%
15%
51%
17%
50%
13%
46%
16%
40%
22%
Needs Met by Programs Operated by Meridian PRD - Invitation Sample Only% 4 & 5 (Needs Met) vs. % 1 & 2 (Needs Unmet)
Percent 4 & 5 (Needs Met)Percent 1 & 2 (Needs Unmet)

Paper/Web Invite Open Link
1 2 3 4 5
Average Rating
1 2 3 4 5
Average Rating
Playgrounds
Ball Fields
Picnic Shelters
Athletic Fields
Youth Sports
Youth Progams (Non-Sports)
Senior Programs
Splash Pads
Family Programs (all ages)
Outdoor Basketball Courts
Youth Camps
Pathways/Trails
Adult Sports
Teen Programs
Tennis Courts
Adult Programs (Non-Sports)
Community/Recreation Center
Swimming Pools/Aquatic Facilities
Outdoor Adventure Programs
Dog Parks
Indoor Gym Space
Rodeo Grounds
4.1 4.0
3.9 3.8
3.9 3.9
3.9 3.8
3.7 3.6
3.6 3.5
3.6 3.3
3.5 3.6
3.5 3.3
3.5 3.5
3.5 3.4
3.5 3.4
3.5 3.4
3.5 3.2
3.5 3.7
3.4 3.2
3.4 3.2
3.3 3.1
3.3 3.1
3.1 2.7
3.0 2.8
3.0 2.9
Needs Met by Facilities/Programs Operated by Meridian PRD Average Rating (1=Not at all, 5=Completely)
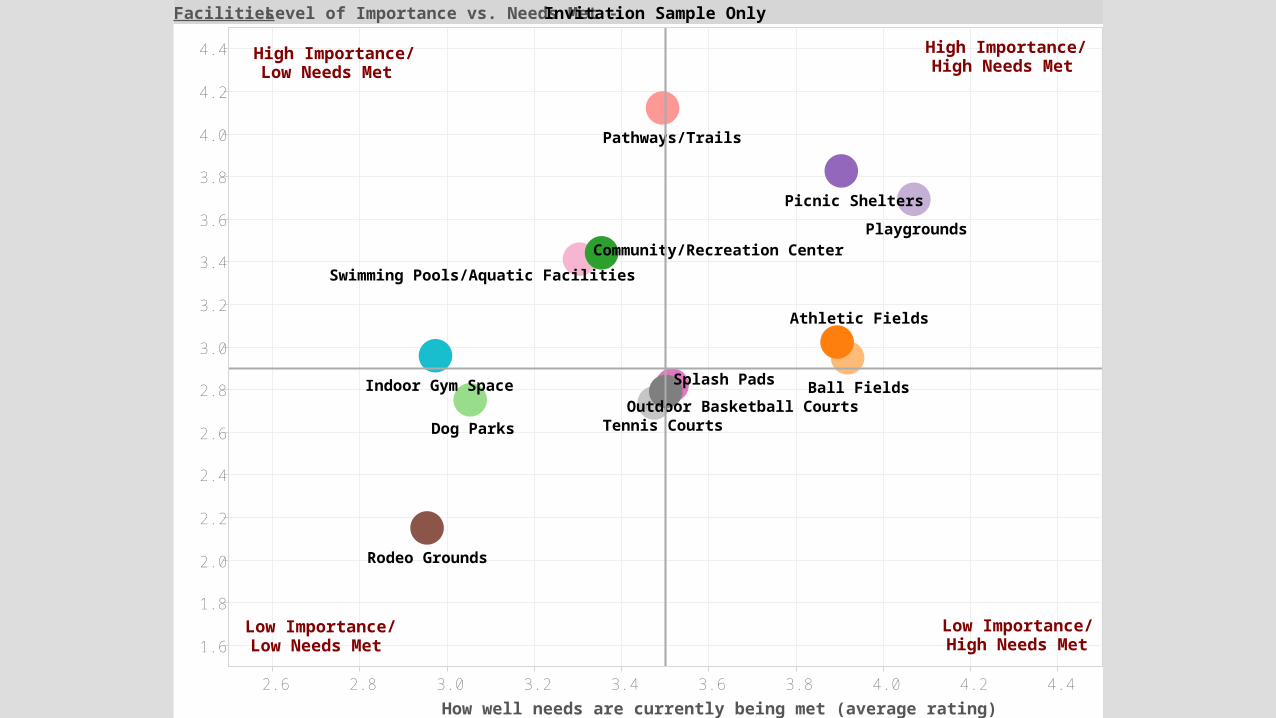
2.6 2.8 3.0 3.2 3.4 3.6 3.8 4.0 4.2 4.4
How well needs are currently being met (average rating)
1.6
1.8
2.0
2.2
2.4
2.6
2.8
3.0
3.2
3.4
3.6
3.8
4.0
4.2
4.4
Importance to household (average rating)
Tennis Courts
Swimming Pools/Aquatic Facilities
Splash Pads
Outdoor Basketball Courts
Community/Recreation Center
Athletic Fields
Rodeo Grounds
Playgrounds
Picnic Shelters
Pathways/Trails
Indoor Gym Space
Dog Parks
Ball Fields
High Importance/Low Needs Met
High Importance/High Needs Met
Low Importance/Low Needs Met
Low Importance/High Needs Met
Facilities: Level of Importance vs. Needs Met - Invitation Sample Only

3.0 3.2 3.4 3.6 3.8 4.0
How well needs are currently being met (average rating)
2.5
2.6
2.7
2.8
2.9
3.0
3.1
3.2
3.3
3.4
3.5
Importance to household (average rating)
Senior Programs
Outdoor Adventure Programs
Family Programs (all ages)
Adult Programs (Non-Sports)
Youth Sports
Youth Progams (Non-Sports)
Youth Camps
Teen Programs
Adult Sports
High Importance/Low Needs Met
Low Importance/Low Needs Met
High Importance/High Needs Met
Low Importance/High Needs Met
Programs: Level of Importance vs. Needs Met - Invitation Sample Only

Paper/Web Invite Open Link
0% 10% 20% 30% 40%
Percent of Respondents
0% 10% 20% 30% 40%
Percent of Respondents
Pathway connectivity
Safety and security
Family-oriented activities
Maintenance of parks and facilities
Aquatic facilities/programming
Developing new parks in under-served areas
Promoting healthy, active lifestyles
Community-wide special events
Land preservation/acquisition
Expanded classes and programs for all ages
Balance of organized sports and passive park facilities
Accessibility
Customer service
Volunteer opportunities
Public art and landscaped areas
Leveraging partnerships 0%
1%
1%
1%
1%
3%
4%
4%
5%
5%
7%
8%
9%
9%
14%
26%
0%
1%
0%
0%
1%
4%
3%
3%
2%
4%
9%
7%
4%
15%
5%
35%
Number One Issue that Parks and Recreation Should Focus on Improving
0% 5% 10% 15% 20% 25% 30% 35% 40% 45% 50% 55%
Percent of Respondents
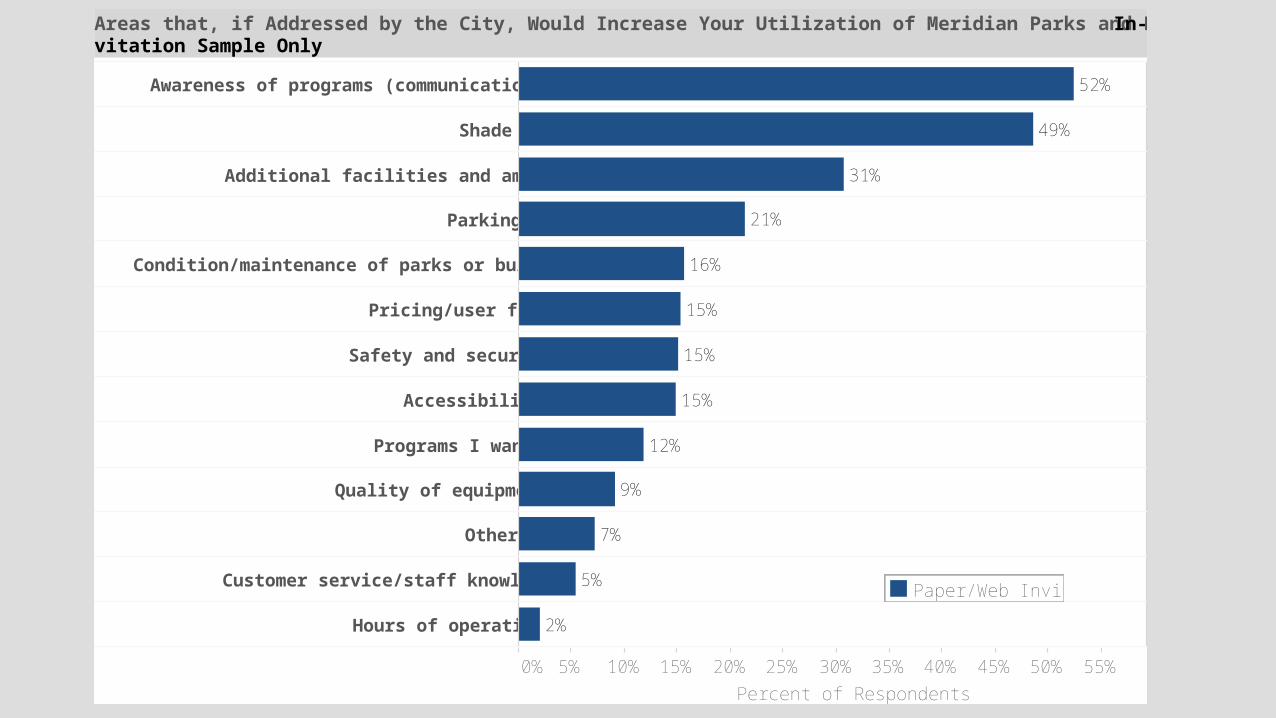
Awareness of programs (communications)
Shade
Additional facilities and amenities
Parking
Condition/maintenance of parks or buildings
Pricing/user fees
Safety and security
Accessibility
Programs I want
Quality of equipment
Other
Customer service/staff knowledge
Hours of operation
52%
49%
31%
21%
16%
15%
15%
15%
12%
9%
7%
5%
2%
Areas that, if Addressed by the City, Would Increase Your Utilization of Meridian Parks and Recreation Facilities - In-vitation Sample Only
Paper/Web Invite

0% 10% 20% 30% 40% 50% 60% 70% 80%
Percent of Respondents
Pathways & Trails
Shade Structures in Parks
Improved Park Amenities
Community/ Recreation Center
Indoor Aquatics Facility
Playgrounds
Performing Arts Center
Lights for Outdoor Athletic Facilities
Fishing Ponds
Exercise Stations along Trails in Parks
Public Art in the Parks
Dog Parks
New Parks
Outdoor Athletic Fields/Courts
Fieldhouse/Gymnasium Space
Parking at Recreational Facilities
Splash Pads
Ice Rink
Disc Golf
Rodeo/Equestrian Facility
Pickleball Courts
76%9%
67%11%
59%11%
56%15%
54%19%
52%14%
43%22%
40%23%
39%26%
38%30%
36%31%
36%37%
32%26%
30%27%
30%27%
29%21%
28%36%
26%41%
22%34%
14%52%
12%45%
Importance of Indoor and Outdoor Facilities to be Added, Expanded, or Improved - Invitation Sample Only% 4 & 5 (Important) vs. % 1 & 2 (Not Important)
Percent 4 & 5 (Important)Percent 1 & 2 (Not Important)

Paper/Web Invite Open Link
1 2 3 4 5
Average Rating
1 2 3 4 5
Average Rating
Pathways & Trails
Shade Structures in Parks
Improved Park Amenities
Community/ Recreation Center
Indoor Aquatics Facility
Playgrounds
Performing Arts Center
Lights for Outdoor Athletic Facilities
Fishing Ponds
Parking at Recreational Facilities
Exercise Stations along Trails in Parks
New Parks
Outdoor Athletic Fields/Courts
Public Art in the Parks
Fieldhouse/Gymnasium Space
Other Indoor or Outdoor Facilities
Dog Parks
Splash Pads
Disc Golf
Ice Rink
Pickleball Courts
Rodeo/Equestrian Facility
4.0 4.3
3.8 4.1
3.6 3.8
3.5 3.7
3.5 3.8
3.5 3.8
3.2 3.2
3.1 3.8
3.1 3.0
3.1 3.7
3.0 3.3
3.0 3.8
3.0 3.7
3.0 3.0
3.0 3.4
2.9 2.6
2.9 3.1
2.8 3.3
2.7 2.9
2.6 2.8
2.4 2.6
2.3 2.1
Importance of Indoor and Outdoor Facilities to be Added, Expanded, or ImprovedAverage Rating (1=Not at all Important, 5=Very Important)

0% 10% 20% 30% 40%
Percent of Respondents
Pathways & trails
Indoor aquatics facility
Shade structures in parks
Community/recreation center
Improved park amenities
Dog parks
Performing arts center
Fishing ponds
New parks
Playgrounds
Outdoor athletic fields/courts
Exercise stations along trails in parks
Public Art in the Parks
Ice rink
Lights for outdoor athletic facilities
Fieldhouse/gymnasium space
Disc golf
Parking at recreational facilities
Rodeo/equestrian facility
Splash pads
Pickleball courts
11%15%20%
16%
5%
9%
3%
5%
8%
6%
3%
5%
4%
2%
2%
3%
2%
3%
2%
8%
9%
9%
6%
7%
6%
4%
5%
4%
3%
3%
3%
3%
2%
6%
9%6%
9%
4%
9%
6%
2%
6%
4%
3%
3%
Top 3 Most Important Priorities for Addition/Expansion/Improvement in Meridian - Invitation Sample Only
Highest PrioritySecond PriorityThird Priority

0% 10% 20% 30% 40% 50% 60% 70% 80%
Percent of Respondents
Community events (festivals, parades, outdoor concerts)
Fitness and wellness programs
Senior programs
Adult programs (non-sports)
Swim lessons/aquatic programs
Cooking/enrichment classes
Volunteer opportunities
Family programs
Performing Arts Programs
Arts programs
Athletic leagues - youth
Outdoor Adventure Programs
Summer camps - youth
Youth sports camps
After school programs
Athletic leagues - adult
Youth programs (non-sports)
Teen programs
Intergenerational programs
Adaptive Recreation Programs 6%
8%
12%
14%
14%
14%
17%
19%
21%
21%
24%
31%
31%
34%
34%
36%
44%
49%
56%
69%
Please indicate whether your household has a need for the following programs: - Invitation Sample Only
Paper/Web Invite

0% 5% 10% 15% 20% 25% 30% 35% 40% 45%
Percent of Respondents
Community events (festivals, parades, outdoor concerts)
Senior programs
Fitness and wellness programs
Swim lessons/aquatic programs
Adult programs (non-sports)
Performing Arts Programs
Family programs
Volunteer opportunities
Athletic leagues - youth
Cooking/enrichment classes
Outdoor Adventure Programs
Arts programs
No second or third issue listed
No second priority listed
Summer camps - youth
No third priority listed
Athletic leagues - adult
Youth programs (non-sports)
Youth sports camps
Teen programs
After school programs
Intergenerational programs
Adaptive Recreation Programs
13%
14%
11%
10%
19%
20%
11%
12%
7%
4%
8%
3%
8%
5%
2%
7%
6%
3%
2%
2%
6%
7%
6%
7%
6%
3%
5%
2%
4%
7%
3%
5%
8%
3%
9%3%
4%
4%
8%
2%
2%
2%
Top 3 Most Important Programs to Household - Invitation Sample Only
Most Important ProgramSecond Most Important ProgramThird Most Important Program

0% 10% 20% 30% 40% 50% 60% 70%
Percent of Respondents
Local media
Meridian Parks and Recreation ActivityGuide
E-mail from the City
Internet/website
Social networking
School flyers
At the recreation facilities/program location
Word of mouth
Other
63%
35%
50%
46%
44%
71%
42%
46%
17%
38%
14%
17%
10%
9%
10%
11%
5%
3%
Preferred Methods of Receiving Parks and Recreation Information (Select all that apply)
Paper/Web InviteOpen Link

Current Facility Fees Current Program Fees
0% 10% 20% 30% 40% 50% 60% 70%
Percent of Respondents
0% 10% 20% 30% 40% 50% 60% 70%
Percent of Respondents
Fees are underpricedfor the value received
Fees are acceptable forthe value received
Fees are too high forthe value received
Don't know/unsure
1%
2%
1%
2%
28%
49%
27%
56%
7%
7%
7%
8%
64%
42%
65%
34%
How do you feel about the current program and facility fees charged directly to you by Meridian PRD?
Paper/Web InviteOpen Link

$0 $2 $4 $6 $8 $10 $12 $14 $16 $18 $20
Value
Add more pathways
Make improvements and/or renovateand maintain existing park facilities
Expand aquatics
Add new parks
Expand programs and activities
Recreation center, including gym spaceand related activities
New or expanded Community Center
Add outdoor athletic fields and courts
Other enhancements
Provide more City-wide special events
$19$17
$17$11
$15$14
$11$9
$8$6
$10$8
$6$6
$13$6
$5$7
$5$6
If you had $100 to spend on parks and recreation facilities, services, and/or programs, how would you allocate that$100 across the following categories? - Average Amount Allocated
Paper/Web InviteOpen Link

Level of Service Analysis

Inventory & Assessment
Visited and Assessed 22 Meridian Parks
217 different Components 10 Indoor Facilities
Meridian Community Center Senior Center City Hall 6 School Gyms (discounted) YMCA Homecourt (discounted)
9 Alternative Providers WARD, Boise Parks, Schools (Joint Use)
58 Components
Located and Assumed Scoring HOA’s components (typically pools,
playgrounds, courts or turf/fields) 64 Components
Schools (Discounted Assumed Scores for Elementary and Middle)
63 Components
Located High Schools
Included 21.8 miles of Trails 13 miles of Micro Paths

Inventory & Assessment

Inventory & Assessment
Data Collected in GIS Displayed in data sheets Map for each park

Inventory & AssessmentSummary of Initial Assessment
High quality, well maintained parks Well distributed parks Definite distinction between
“Community Parks” and “Neighborhood Parks”
Some parks especially “Neighborhood Parks” lack unique or identifiable character
Great restroom standards Trail system is disconnected Quality of HOA Parks and other
Alternative Providers vary greatly Schools are important but limited
access

Not all parks are created equal…

Grasp® Analysis

Overall Level of Service
• 1 mile access • Premium within ½ mile

Level of Service Analysis• Access to a
“Typical Neighborhood Park” (Champion Park or Renaissance Park) and a Trail

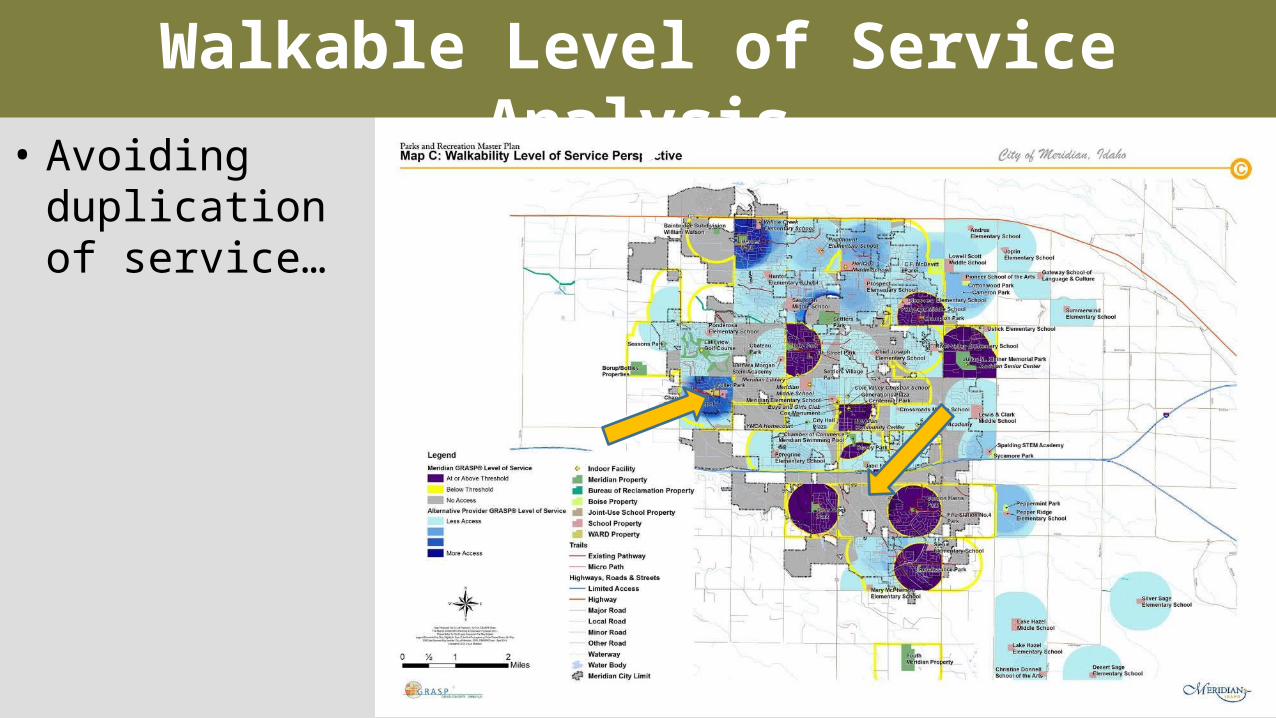
Level of Service Analysis
• Avoiding duplication of service…

Level of Service Analysis
• If we aren’t providing enough… are there other providers?

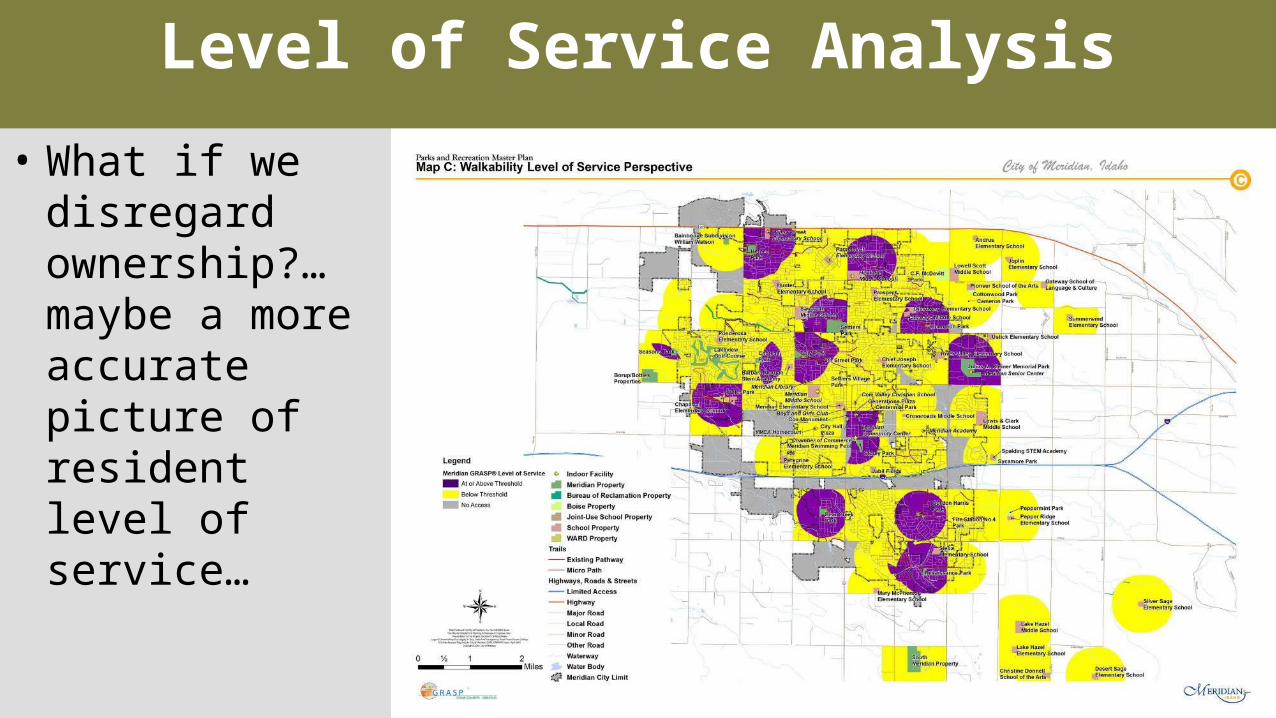
Level of Service Analysis
• What if we disregard ownership?… maybe a more accurate picture of resident level of service…

Overall Level of Service Findings Wide variety of well distributed recreational opportunities
Overall level of service is high if accessed by an automobile
Over 75% of Meridian above threshold when considering all providers
Alternative providers are an important supplement to Meridian’s “Neighborhood” level of service

Walkable Level of Service• 15 minute walkable access

Walkable Level of Service Analysis• Access to a
“Typical Neighborhood Park” (Champion Park or Renaissance Park) and a Trail
Walkable Level of Service Analysis
• Avoiding duplication of service…

Level of Service Analysis
• If we aren’t providing enough… are there other providers?
Level of Service Analysis
• What if we disregard ownership?… maybe a more accurate picture of resident level of service…

Walkable Level of Service Findings
No Service Below Threshold At or Above Threshold $60,000
$65,000
$70,000
$75,000
$80,000
$85,000
$90,000
$95,000
$100,000
$105,000
$67,332 $69,573
$79,254
North 2014 Average Household Income
No Service Below Threshold At or Above Threshold $60,000
$65,000
$70,000
$75,000
$80,000
$85,000
$90,000
$95,000
$100,000
$105,000
$90,594
$100,014 $96,353
South 2014 Average Household Income
2%
60%
38%
Overall % of 0-19 Population
No ServiceBelow ThresholdAt or Above Threshold
2%
60%
37%
Overall % of Total 2014 Population
No ServiceBelow ThresholdAt or Above Threshold

Walkable Level of Service Findings Demographic analysis shows good distribution of parks where people live with
98% of 0-19 age group having walkable access to some recreation service
Heavy reliance on alternative providers for walkable neighborhood level of service in many areas
While Meridian’s “Neighborhood” Parks meet the threshold, lack of trails access
keeps areas below threshold in walkability
Surprising discrepancy in average household income from North to South
Generally “no service areas” have lowest average household income

Trails and Recreational Connectivity 49 different segments of existing pathways
currently About 22 miles Displayed with darker being longer length Orange/Red
13 miles of “Micro Paths” Pink
133 miles of proposed trails Gray dashed
Trail Hierarchy Park Trails Community Trails Regional Trails
Making Connections… Stakeholders Places Trails People
Access Trailheads and Access Points Map & App Resources Public Transportation

Preliminary Facility Recommendations
Improve recreational connectivity through neighborhood trail connections and park “spurs”
Continue to improve level of service especially at “Neighborhood” Parks through upgrades or additional components if trails can not be added
Work with neighborhoods to create an individual identity for each neighborhood park
Work with alternative providers to increase level of service in areas Meridian doesn’t have neighborhood parks but level of service is low
Consider programming needs when adding new components to existing parks

Reoccurring Themes
• Connectivity and Pathways• Maintain what we have• Keep up with rapid community growth• Land acquisition for future parks• Indoor Recreation Facility• Communication / Marketing / Technology• Organizational Development / Staffing• Dedicated Revenue Source

Programming
• Non-sports Activities• Community-wide Special Events• Aquatic Programs• Teen Programs• Outdoor Recreation and Adventure Programs• Art in the Park• Senior Programs• Cultural / Preforming Arts Programs

Questions?Your Project Manager
Art Thatcher, CPRPDirect: 757-592-3103 [email protected]
Thank You For Your Time& Consideration!
55