Embed Size (px)
Citation preview

A Sponsored Supplement to Science
Optimizing your live-cell microscopy: Tricks and trade-offs
Produced by the Science/AAAS Custom
Publishing OfficeSponsored by
Your compact confocal for high-end imaging
With ZEISS LSM 800 you are choosing a flexible and compact confocal laser scanning microscope, complete with highly sensitive GaAsP detector technology and fast linear scanning. Add Airyscan, the revolutionary detection concept from ZEISS, and you will gain 1.7× higher resolution in all three dimensions – resulting in a 5× smaller confocal volume. And you will be pushing sensitivity beyond the limits of all conventional confocals.
www.zeiss.com/lsm800
Finding answers in demanding research.ZEISS LSM 800
// INNOVATION MADE BY ZEISS

TABLE OF CONTENTS
1
Optimizing your live-cell microscopy: Tricks and trade-offs
Introductions 2 A life well lived in the age of microscopy Sean Sanders, Ph.D. Science/AAAS
3 Shedding light on life Bernhard Zimmermann, Ph.D. Senior Director Segment Marketing Life Sciences Carl Zeiss Microscopy GmbH
White paper: Superresolution microscopy 4 Bringing cellular dynamics to light with live-cell microscopy Jeffrey M. Perkel
Research articles 8 Detryrosinated microtubules buckle and bear load in contracting cardiomyocytes Patrick Robison, Matthew A. Caporizzo, Hossein Ahmadzadeh et al.
17 Complement and microglia mediate early synapse loss in Alzheimer mouse models Soyon Hong, Victoria F. Beja-Glasser, Bianca M. Nfonoyim et al.
22 Bioengineering a 3D integumentary organ system from iPS cells using an in vivo transplantation model Ryoji Takagi, Junko Ishimaru, Ayaka Sugawara et al.
Application note30 The Fast module for ZEISS LSM 880 with Airyscan: Confocal superresolution imaging with four times the speed and improved signal-to-noise ratio Joseph Huff and Annette Bergter
BILL MORAN, GLOBAL DIRECTOR Custom [email protected]+1-202-326-6438
ROGER GONCALVES, SALES MANAGERCustom Publishing Europe, Middle East, and [email protected]+41-43-243-1358
© 2016 by The American Association for the Advancement of Science. All rights reserved. 13 May 2016
Editor: Sean Sanders, Ph.D.Proofreader/Copyeditor: Bob FrenchDesigner: Amy Hardcastle
ABOUT THE COVER: Choanoflagellate rosette colony isolated from Mono Lake, California, stained for DNA, microtubules, and F-actin. Acquired using a ZEISS LSM 880 with Airyscan. Credit: Kayley Hake, University of California, Berkeley.
This booklet was produced by the Science/AAAS Custom Publishing Office and sponsored by Carl Zeiss Microscopy GmbH.
ScienceCareers.org
Learn more and don’t let your job search leave you washed up.
� Search thousands of job postings� Create job alerts based on your criteria� Get career advice from our Career Forum experts� Download career advice articles and webinars� Complete an individual development plan at “myIDP”
Target your job search using relevant resources on ScienceCareers.org.
3SCIENCE sciencemag.org2 sciencemag.org SCIENCE
In the world of cellular biology, the microscope is king. If you want to know what’s going on at a cellular or subcellular level, one of the few direct ways of doing so is with some flavor of microscopy. From its invention in the early 1600s (the origin of the first light microscope is somewhat in dispute), inventors and
researchers have been constantly improving on the original design through hardware and software upgrades, pushing the boundaries of resolution, speed, and depth of imaging. Seldom does a year pass without a significant advance in this field, most especially in the realm of fluorescent microscopy (which garnered a Nobel Prize in Chemistry in 2014).
For the vast majority of the time since the invention of the micro-scope, in order to view a specimen, it has needed to be prepared through a permanent fixation procedure. Also, samples are often spe-cially treated to reveal the location of specific cellular components, a process that requires the fixation step. However, this methodol-ogy provides only a single instant in time for researchers to analyze. Sometimes this is sufficient. But in order to study the kinetics of a cellular event or track changes in a cell over time, the ability to image a live cell is paramount. Additionally, the process of preparing fixed cells has been found to cause artifacts that can confound the interpre-tation of the data.
Caveat emptor. Together with the clear advantages of live-cell imaging come new challenges. Dead cells can be treated relatively harshly without much concern. Live cells on the other hand, frequently require careful handling that includes a constant temperature, stable CO2 levels, and sufficient nutrients. Moreover, the lasers used in many fluorescent microscopes to create the beautiful and colorful images we have come to know are so powerful that they can easily damage cells even during short-term illumination. Live-cell imaging is, in its most fundamental form, a constant balance between achieving the necessary data and not damaging or killing the cells.
A variety of clever solutions have been developed recently that surpass the methods and materials of yesteryear, including brighter fluorescent dyes that require lower-energy activation light, more sensitive detectors that can image both more quickly and in lower light, and techniques and technologies that use hardware and software tricks to minimize the amount of light bathing the sample. None of these provides a complete solution, but these advances and others have allowed researchers to better balance the best resolution, fastest imaging speed, maximum imaging depth, and best cell health to obtain the optimal results. The content provided in this new supplement gives you an indication of how they’re succeeding in these efforts. We’ve provided three recent Science and Science Advances articles and an exclusive white paper in this timely update on live-cell imaging. We hope you enjoy reading it.
Sean Sanders, Ph.D.Editor, Science/AAAS Custom Publishing Office
Apicture is worth a thousand words,” goes the saying. As such, the evolution of humanity is tracked and studied by the drawings and pictures created by generations who sought to depict their world, and the accuracy and frequency of the images mark how well we were and are
able to describe and understand the phenomena of the world. Over the last two centuries the rapid progression of innovative mi-
croscopy techniques has allowed unprecedented visualization and description of microscopic phenomena, making a light microscope an indispensable tool in every biological or medical laboratory. As the light microscope has developed, it has given rise to hundreds of different imaging techniques, from brightfield and differential interfer-ence contrast to modern fluorescence and superresolution microsco-py, which all have one thing in common: They are based on light and its interaction with the specimen. Nowadays light microscopes cannot match the resolution of electron microscopes or the penetration of X-ray microscopes, but they remain unchallenged when it comes to the imaging of dynamic processes in living cells, tissues, and organisms—observing life as it happens. Traditionally, light microscopes were divided into two distinct groups: widefield microscopes, which can acquire an entire image in a single exposure, and laser scanning mi-croscopes, that image a specimen sequentially, point-by-point. While the latter produce crisper images of thick specimens, the former re-cord images much faster and with less damage to the specimen.
Since Carl Zeiss, Ernst Abbe, and Otto Schott laid the foundations of modern microscopy 170 years ago, the company they founded delivered most of the radical microscope innovations, from the simple achromatic and apochromatic lenses of the 19th century, to the com-plex imaging instruments of today. The latest innovation from ZEISS is a novel confocal detector named Airyscan. It blurs the traditional divide between widefield and laser scanning microscopes and offers users the best of both worlds: high-speed, gentle imaging combined with superb resolution and contrast, capabilities unmatched by stan-dard confocal microscopes.
We hope you will find this collection of publications and peer-reviewed articles interesting and inspiring, an example of how in-novative light microscopy continues to enable researchers to push the boundaries of human knowledge. We believe that modern light microscopy can make a difference in your research as well. We are excited to contribute to your success.
Bernhard Zimmermann, Ph.D.Senior Director Segment Marketing Life SciencesCarl Zeiss Microscopy [email protected]
OPTIMIZING YOUR LIVE-CELL MICROSCOP Y: TRICKS AND TRADE-OFFS SECTION ONE | INTRODUCTIONS
A life well lived in the age of microscopy
Shedding light on life
“
Your new standard for fast and gentle confocal imaging
Discover ZEISS LSM 880 with Airyscan – the new confocal laser scanning microscope that offers high sensitivity, improved resolution in x, y and z, and high speed. All in one system. Find out more and book a hands-on demonstration in one of our ZEISS Microscopy Labs now.
www.zeiss.com/lsm880
Revolutionizing your confocal imaging.ZEISS LSM 880 with Airyscan
// INNOVATION MADE BY ZEISS
5SCIENCE sciencemag.org4 sciencemag.org SCIENCE
L ight microscopy has countless applications in today’s life sciences laboratory, from documenting cellular and organismal structure and mapping RNA localization, to
tracking cellular dynamics. First, though, researchers must an-swer a fundamental question: Are they going to image the cells while they’re alive, or after they’re dead?
For many projects, the answer is: both. Yet the question defines the kind of data a microscope provides, and thus, the questions researchers can ask of it. Dead men tell no tales, as the saying goes, but dead cells do. Immunohistochemistry, for instance, reveals cellular and tissue morphology and protein distribution in fixed samples, while in situ hybridization reports the abundance and subcellular location of specific DNA or RNA sequences—data that pathologists can use to diagnose and stratify disease, among other things. Confocal and super-resolution microscopy methods likewise have yielded up daz-zling images of organismal and subcellular architecture from fixed cells, such as the 2013 discovery (using stochastic optical reconstruction microscopy, or STORM, superresolution micros-copy) by Harvard University’s Xiaowei Zhuang of a “periodic cytoskeletal structure” undergirding long axonal filaments—a subcellular protein scaffold that researchers never previously knew existed (1).
In all these cases, the data produced are static representa-tions of once-living systems—the equivalent of reducing a
movie to a single frame. And for many questions, the resulting data are good enough to provide the answers. But some ques-tions simply cannot be answered from single images. In those cases, researchers turn to live-cell imaging.
In theory, live-cell microscopy is no different from any other microscopy method. But live cells do pose significant techni-cal issues, and researchers pursuing live-cell methods have
devised strategies for dealing with them.The sine qua non of live-cell microscopy is, obviously, live
cells, and both microscope vendors and third-party firms offer tools (such as climate-controlled growth chambers) to facili-tate such research. But it’s not enough that the cells be alive; generally they also have to be healthy, and not all microscopy techniques are compatible with that state. Fluorescence-based approaches, especially, often require extended and intense sample irradiation with high-powered light sources, which can induce phototoxicity. Fixed cells can easily stand this assault—so long as the fluorescent dyes or proteins being imaged do not succumb to negative effects such as photobleaching. But live cells can become stressed and apoptotic, or at the very least alter their behavior, under the blinding glare of such scrutiny.
“As part of their normal life cycle, most tissues and cells are never exposed to light, and it is known that ultraviolet (UV) light damages DNA, focused infrared (IR) light can cause lo-calized heating, and fluorescence excitation causes phototox-icity to tissues and cells,” wrote Clare Brown and colleagues of McGill University in a 2009 commentary in the Journal of Cell Science (2).
Live cells also move and change shape, as do their subcel-lular components, potentially complicating image collection and data analysis. Researchers are also limited in the types and nature of stains they can use to visualize those cells, and many fluorescent dyes are incompatible with live cells. As a result, live-cell imaging studies often employ fluorescent pro-teins rather than inorganic dyes or fluorophore-conjugated antibodies for staining purposes, or enzyme-based tags such as HaloTag, which allow researchers to label specific proteins in live cells (3).
Bringing cellular dynamics to light with live-cell microscopyBy Je�rey M. Perkel
IMA
GE
: C
OU
RT
ES
Y O
F J
UL
IA S
EL
LIN
, MIC
HA
EL
HO
CH
, LIM
ES
INS
TIT
UT
, UN
IVE
RSIT
Y O
F B
ON
N
Researchers have no shortage of options for livecell microscopy, from standard brightfield and differential interference contrast microscopy, to confocal and super-
resolution approaches. Here, we consider some of the more popular fluorescence-based strategies.
The most straightforward approach, perhaps, is basic wide-field fluorescence microscopy, in which an entire field of view is illuminated with excitation energy, and total fluorescence from the area is recorded at once using an area detector, such as a CCD (charge-coupled device) or CMOS (complementary metal-oxide semiconductor) camera. The simplest microscopy meth-od available, widefield imaging also yields the blurriest images, as there’s no mechanism to exclude out-of-focus light from reaching the detector. Thus, according to a review on the Carl Zeiss Microscopy Online Campus, “widefield imaging achieves the optimum results when the features of interest are either large (such as an organelle) or highly punctate in nature” (4).
One strategy for overcoming those limitations is confocal microscopy. A bright light source (usually a laser) is focused onto a particular point in the sample. The resulting fluores-cence is then captured after it passes through a small pinhole aperture, which blocks out-of-focus light, producing a sharp image. The focal plane is then stepped perpendicular to the slide (i.e., along the z axis), creating multiple optical planes that can be virtually assembled to create a 3D representation of the original sample.
Confocal systems generally take one of two approaches to reconstruct each optical slice: Either the diffraction-limited illumination point is raster-scanned across the sample (as in laser-scanning confocal microscopy), or multiple points are im-aged simultaneously (as in spinning-disk confocal microscopy). The difficulty is that whatever z position is being imaged, the entire sample volume is illuminated, increasing the likelihood of phototoxicity and photobleaching. The spinning-disk approach is generally considered faster and less phototoxic, but both can be applied to live cells, assuming the experiment is designed appropriately. Newer resonant scanning heads, such as that in the Nikon A1R+ confocal system can accelerate scanning-based microscopy to 30 frames per second or higher, depending on the size of the scanned region.
One alternative to confocal microscopy is pairing widefield microscopy with deconvolution strategies. Widefield images typically subject cells to lower light intensity than confocal. But, since the resulting pictures tend to be blurrier, especially with thick specimens, they can be cleaned up using computational algorithms to produce a sharper reconstruction.
Another alternative strategy, also compatible with live-cell imaging, is confocal microscopy using ZEISS’s Airyscan detec-tor. In a typical confocal, one or more pinholes are used to re-ject out-of-focus light; in-focus emission light is captured using a point detector (such as a photomultiplier tube) or spectral array. As a result, the researcher must balance signal with clar-ity: By making the pinhole smaller, image sharpness increases, but less light is captured, meaning more intense excitation light must be used. Airyscan circumvents that problem by eliminat-ing the pinhole and projecting the emission light onto a 32-el-ement array of hexagonal detectors. “Each detector element functions as a single, very small pinhole,” according to compa-ny literature, leading to stronger signals, increased resolution, and decreased imaging speed.
“Superresolution microscopy” is a catch-all term describing a half-dozen or so different methods. In general, they also fall into two categories, the first of which includes localization-based approaches such as PALM (photoactivated localization microscopy) and STORM (available from ZEISS and Nikon, respectively). Normally, all fluorescent molecules in a diffrac-tion-limited spot will fluoresce, making it impossible to dif-ferentiate fluorophores separated by less than about 200 nm. Localization-based approaches circumvent that problem by keeping most fluorophores dark and allowing only a stochastic handful to fluoresce. The positions of those fluors can then be mapped with subdiffraction resolution, at which point the pro-cess repeats until sufficient molecules have been mapped to re-construct the original image. The second category of methods, which includes STED (stimulated emission depletion, available from Leica Microsystems), RESOLFT (reversible saturable opti-cal fluorescence transitions), and SIM (structured illumination microscopy, available from ZEISS, Nikon, and GE Healthcare Life Sciences), use patterned light sources to define specifically where fluorophores are on and off.
Live-cell images have been collected with many of these different techniques. In one 2013 study, for instance, Nobel laureate Stefan Hell and colleagues at the Max Planck Institute for Biophysical Chemistry used a homemade RESOLFT system capable of producing 116,000 simultaneous “doughnuts” of light to capture neurite growth over nearly 4 minutes (5). In early 2016, Joerg Bewersdorf and colleagues at continued>
“Superresolution microscopy” is a catch-all term describing a half-dozen
or so di�erent methods.
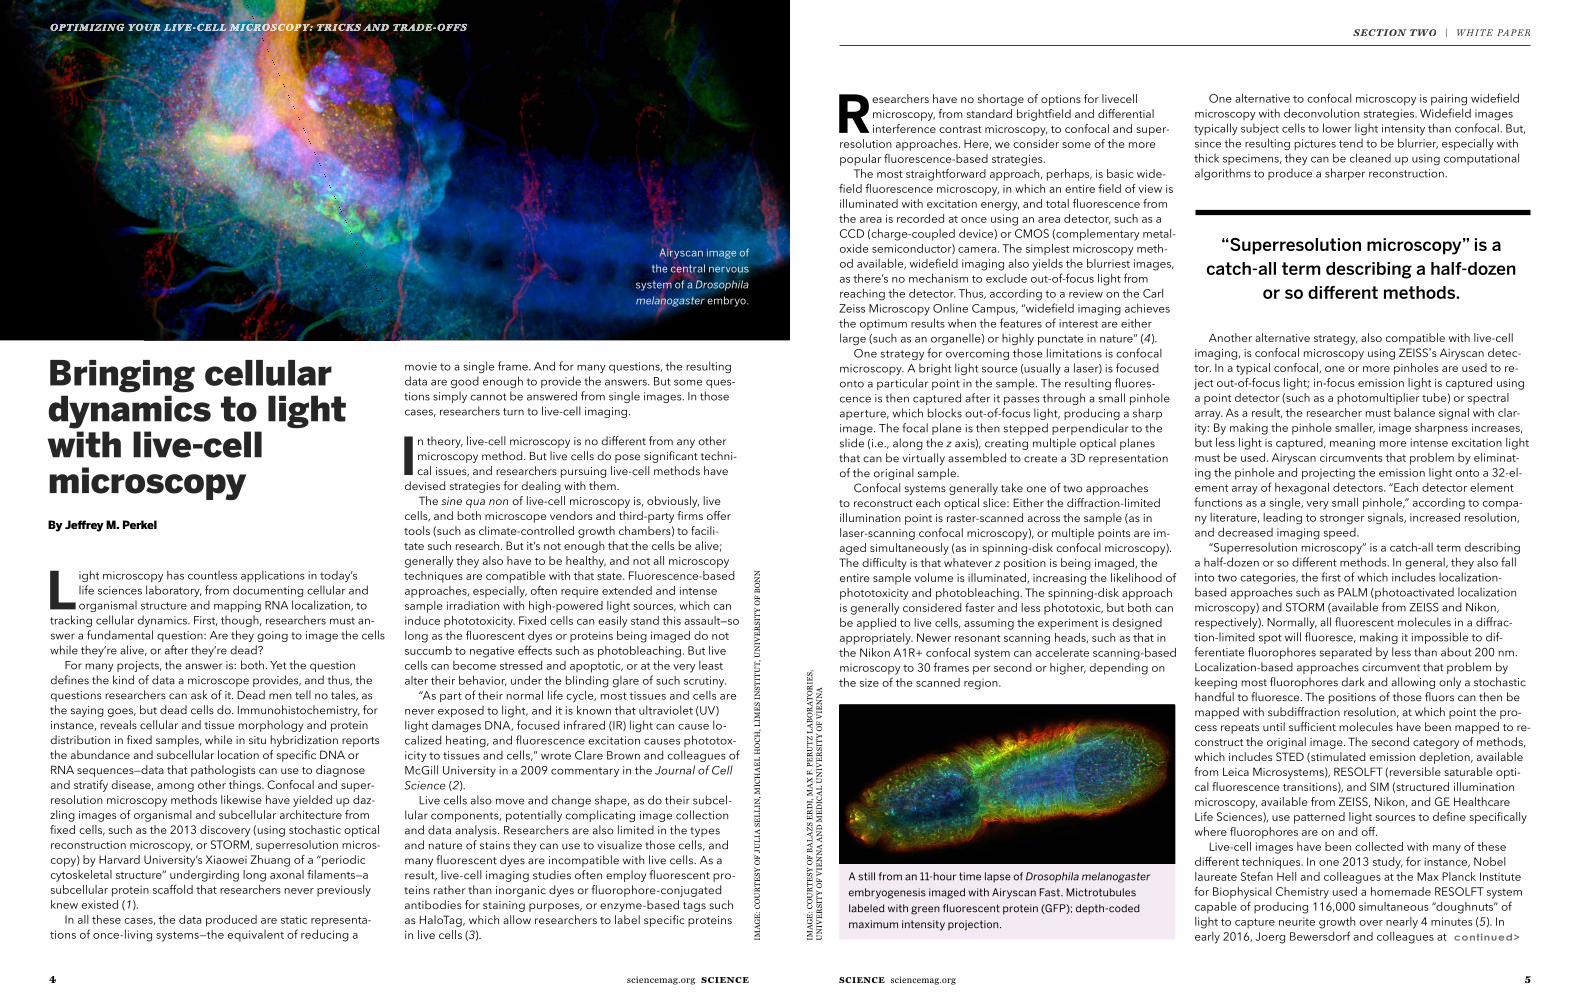
Airyscan image of the central nervous
system of a Drosophila melanogaster embryo.
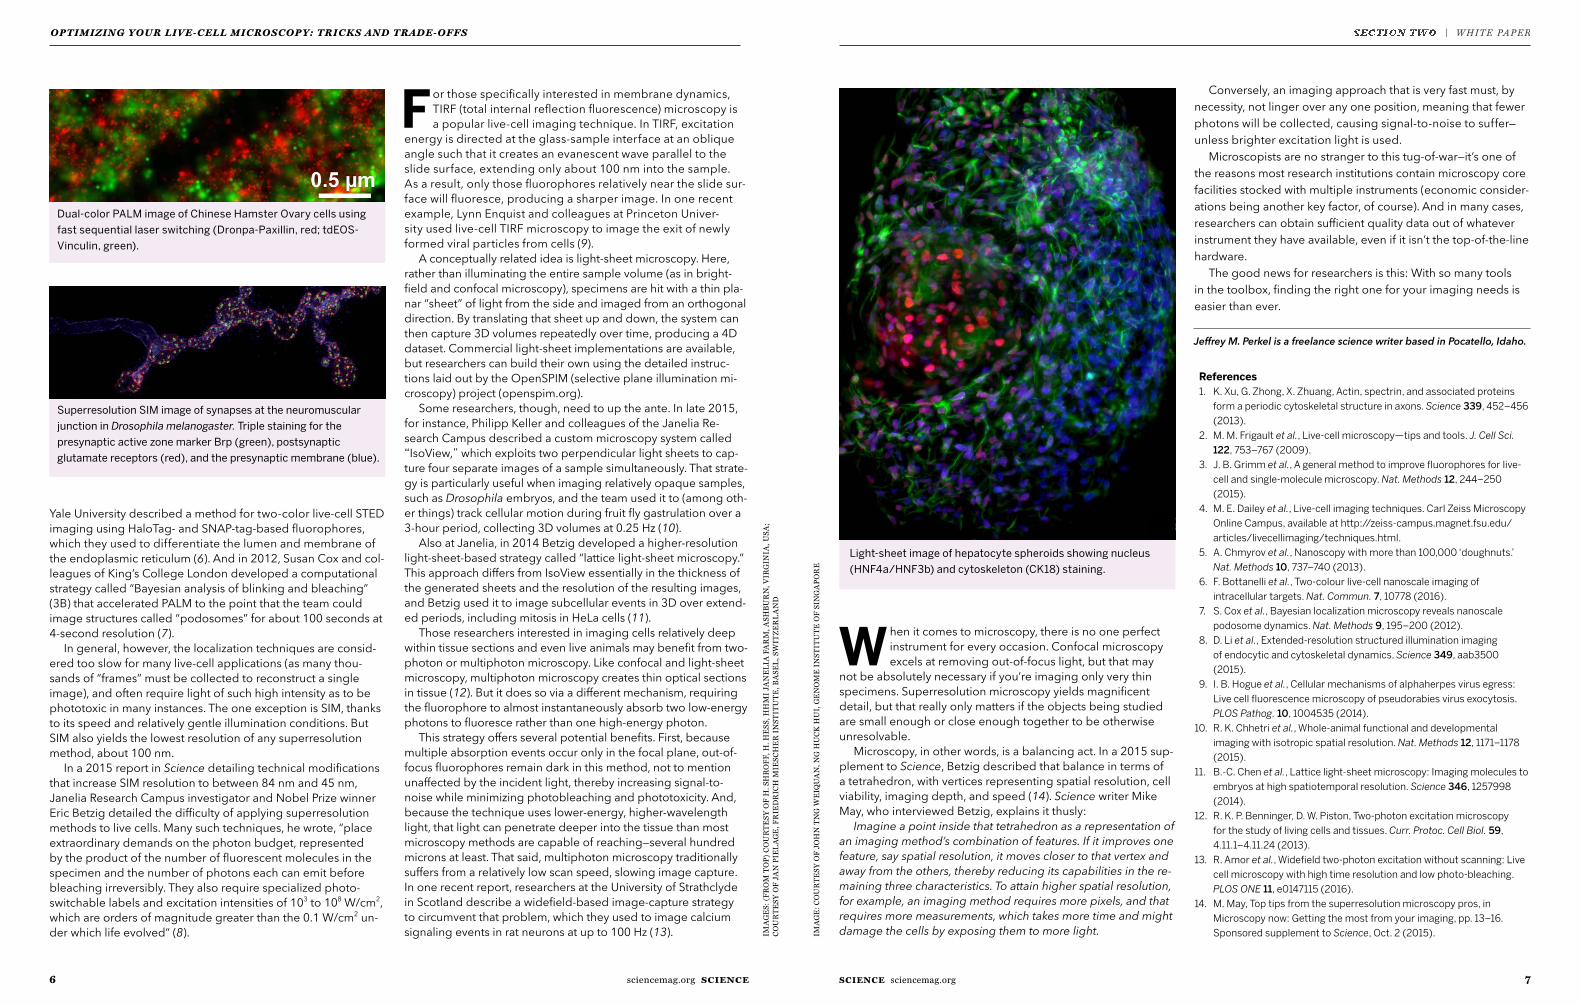
A still from an 11-hour time lapse of Drosophila melanogaster embryogenesis imaged with Airyscan Fast. Mictrotubules labeled with green �uorescent protein (GFP); depth-coded maximum intensity projection.
IMA
GE
: C
OU
RT
ES
Y O
F B
AL
AZ
S E
RD
I, M
AX
F. P
ER
UT
Z L
AB
OR
AT
OR
IES
, U
NIV
ER
SIT
Y O
F V
IEN
NA
AN
D M
ED
ICA
L U
NIV
ER
SIT
Y O
F V
IEN
NA
SECTION TWO | WHITE PAPEROPTIMIZING YOUR LIVE-CELL MICROSCOP Y: TRICKS AND TRADE-OFFS
7SCIENCE sciencemag.org6 sciencemag.org SCIENCE
Yale University described a method for two-color live-cell STED imaging using HaloTag- and SNAP-tag-based fluorophores, which they used to differentiate the lumen and membrane of the endoplasmic reticulum (6). And in 2012, Susan Cox and col-leagues of King’s College London developed a computational strategy called “Bayesian analysis of blinking and bleaching” (3B) that accelerated PALM to the point that the team could image structures called “podosomes” for about 100 seconds at 4-second resolution (7).
In general, however, the localization techniques are consid-ered too slow for many live-cell applications (as many thou-sands of “frames” must be collected to reconstruct a single image), and often require light of such high intensity as to be phototoxic in many instances. The one exception is SIM, thanks to its speed and relatively gentle illumination conditions. But SIM also yields the lowest resolution of any superresolution method, about 100 nm.
In a 2015 report in Science detailing technical modifications that increase SIM resolution to between 84 nm and 45 nm, Janelia Research Campus investigator and Nobel Prize winner Eric Betzig detailed the difficulty of applying superresolution methods to live cells. Many such techniques, he wrote, “place extraordinary demands on the photon budget, represented by the product of the number of fluorescent molecules in the specimen and the number of photons each can emit before bleaching irreversibly. They also require specialized photo-switchable labels and excitation intensities of 103 to 108 W/cm2, which are orders of magnitude greater than the 0.1 W/cm2 un-der which life evolved” (8).
For those specifically interested in membrane dynamics, TIRF (total internal reflection fluorescence) microscopy is a popular live-cell imaging technique. In TIRF, excitation
energy is directed at the glass-sample interface at an oblique angle such that it creates an evanescent wave parallel to the slide surface, extending only about 100 nm into the sample. As a result, only those fluorophores relatively near the slide sur-face will fluoresce, producing a sharper image. In one recent example, Lynn Enquist and colleagues at Princeton Univer-sity used live-cell TIRF microscopy to image the exit of newly formed viral particles from cells (9).
A conceptually related idea is light-sheet microscopy. Here, rather than illuminating the entire sample volume (as in bright-field and confocal microscopy), specimens are hit with a thin pla-nar “sheet” of light from the side and imaged from an orthogonal direction. By translating that sheet up and down, the system can then capture 3D volumes repeatedly over time, producing a 4D dataset. Commercial light-sheet implementations are available, but researchers can build their own using the detailed instruc-tions laid out by the OpenSPIM (selective plane illumination mi-croscopy) project (openspim.org).
Some researchers, though, need to up the ante. In late 2015, for instance, Philipp Keller and colleagues of the Janelia Re-search Campus described a custom microscopy system called “IsoView,” which exploits two perpendicular light sheets to cap-ture four separate images of a sample simultaneously. That strate-gy is particularly useful when imaging relatively opaque samples, such as Drosophila embryos, and the team used it to (among oth-er things) track cellular motion during fruit fly gastrulation over a 3-hour period, collecting 3D volumes at 0.25 Hz (10).
Also at Janelia, in 2014 Betzig developed a higher-resolution light-sheet-based strategy called “lattice light-sheet microscopy.” This approach differs from IsoView essentially in the thickness of the generated sheets and the resolution of the resulting images, and Betzig used it to image subcellular events in 3D over extend-ed periods, including mitosis in HeLa cells (11).
Those researchers interested in imaging cells relatively deep within tissue sections and even live animals may benefit from two-photon or multiphoton microscopy. Like confocal and light-sheet microscopy, multiphoton microscopy creates thin optical sections in tissue (12). But it does so via a different mechanism, requiring the fluorophore to almost instantaneously absorb two low-energy photons to fluoresce rather than one high-energy photon.
This strategy offers several potential benefits. First, because multiple absorption events occur only in the focal plane, out-of-focus fluorophores remain dark in this method, not to mention unaffected by the incident light, thereby increasing signal-to-noise while minimizing photobleaching and phototoxicity. And, because the technique uses lower-energy, higher-wavelength light, that light can penetrate deeper into the tissue than most microscopy methods are capable of reaching—several hundred microns at least. That said, multiphoton microscopy traditionally suffers from a relatively low scan speed, slowing image capture. In one recent report, researchers at the University of Strathclyde in Scotland describe a widefield-based image-capture strategy to circumvent that problem, which they used to image calcium signaling events in rat neurons at up to 100 Hz (13).
When it comes to microscopy, there is no one perfect instrument for every occasion. Confocal microscopy excels at removing out-of-focus light, but that may
not be absolutely necessary if you’re imaging only very thin specimens. Superresolution microscopy yields magnificent detail, but that really only matters if the objects being studied are small enough or close enough together to be otherwise unresolvable.
Microscopy, in other words, is a balancing act. In a 2015 sup-plement to Science, Betzig described that balance in terms of a tetrahedron, with vertices representing spatial resolution, cell viability, imaging depth, and speed (14). Science writer Mike May, who interviewed Betzig, explains it thusly:
Imagine a point inside that tetrahedron as a representation of an imaging method’s combination of features. If it improves one feature, say spatial resolution, it moves closer to that vertex and away from the others, thereby reducing its capabilities in the re-maining three characteristics. To attain higher spatial resolution, for example, an imaging method requires more pixels, and that requires more measurements, which takes more time and might damage the cells by exposing them to more light.
References 1. K. Xu, G. Zhong, X. Zhuang, Actin, spectrin, and associated proteins form a periodic cytoskeletal structure in axons. Science 339, 452–456 (2013). 2. M. M. Frigault et al., Live-cell microscopy—tips and tools. J. Cell Sci. 122, 753–767 (2009). 3. J. B. Grimm et al., A general method to improve �uorophores for live- cell and single-molecule microscopy. Nat. Methods 12, 244–250 (2015). 4. M. E. Dailey et al., Live-cell imaging techniques. Carl Zeiss Microscopy Online Campus, available at http://zeiss-campus.magnet.fsu.edu/ articles/livecellimaging/techniques.html. 5. A. Chmyrov et al., Nanoscopy with more than 100,000 ‘doughnuts.’ Nat. Methods 10, 737–740 (2013). 6. F. Bottanelli et al., Two-colour live-cell nanoscale imaging of intracellular targets. Nat. Commun. 7, 10778 (2016). 7. S. Cox et al., Bayesian localization microscopy reveals nanoscale podosome dynamics. Nat. Methods 9, 195–200 (2012). 8. D. Li et al., Extended-resolution structured illumination imaging of endocytic and cytoskeletal dynamics. Science 349, aab3500 (2015). 9. I. B. Hogue et al., Cellular mechanisms of alphaherpes virus egress: Live cell �uorescence microscopy of pseudorabies virus exocytosis. PLOS Pathog. 10, 1004535 (2014). 10. R. K. Chhetri et al., Whole-animal functional and developmental imaging with isotropic spatial resolution. Nat. Methods 12, 1171–1178 (2015). 11. B.-C. Chen et al., Lattice light-sheet microscopy: Imaging molecules to embryos at high spatiotemporal resolution. Science 346, 1257998 (2014). 12. R. K. P. Benninger, D. W. Piston, Two-photon excitation microscopy for the study of living cells and tissues. Curr. Protoc. Cell Biol. 59, 4.11.1–4.11.24 (2013). 13. R. Amor et al., Wide¦eld two-photon excitation without scanning: Live cell microscopy with high time resolution and low photo-bleaching. PLOS ONE 11, e0147115 (2016).14. M. May, Top tips from the superresolution microscopy pros, in Microscopy now: Getting the most from your imaging, pp. 13–16. Sponsored supplement to Science, Oct. 2 (2015).
Dual-color PALM image of Chinese Hamster Ovary cells using fast sequential laser switching (Dronpa-Paxillin, red; tdEOS-Vinculin, green).
Conversely, an imaging approach that is very fast must, by necessity, not linger over any one position, meaning that fewer photons will be collected, causing signal-to-noise to suffer—unless brighter excitation light is used.
Microscopists are no stranger to this tug-of-war—it’s one of the reasons most research institutions contain microscopy core facilities stocked with multiple instruments (economic consider-ations being another key factor, of course). And in many cases, researchers can obtain sufficient quality data out of whatever instrument they have available, even if it isn’t the top-of-the-line hardware.
The good news for researchers is this: With so many tools in the toolbox, finding the right one for your imaging needs is easier than ever.
Light-sheet image of hepatocyte spheroids showing nucleus (HNF4a/HNF3b) and cytoskeleton (CK18) staining.
Superresolution SIM image of synapses at the neuromuscular junction in Drosophila melanogaster. Triple staining for the presynaptic active zone marker Brp (green), postsynaptic glutamate receptors (red), and the presynaptic membrane (blue).
IMA
GE
S: (
FR
OM
TO
P)
CO
UR
TE
SY
OF
H. S
HR
OF
F, H
. HE
SS
, HH
MI
JAN
EL
IA F
AR
M, A
SH
BU
RN
, VIR
GIN
IA, U
SA
;C
OU
RT
ES
Y O
F J
AN
PIE
LA
GE
, FR
IED
RIC
H M
IES
CH
ER
IN
ST
ITU
TE
, BA
SE
L, S
WIT
ZE
RL
AN
D
IMA
GE
: C
OU
RT
ES
Y O
F J
OH
N T
NG
WE
IQU
AN
, NG
HU
CK
HU
I, G
EN
OM
E I
NS
TIT
UT
E O
F S
ING
AP
OR
E
SECTION TWO | WHITE PAPEROPTIMIZING YOUR LIVE-CELL MICROSCOP Y: TRICKS AND TRADE-OFFS
Jeffrey M. Perkel is a freelance science writer based in Pocatello, Idaho.
98 SCIENCE sciencemag.orgsciencemag.org SCIENCE
OPTIMIZING YOUR LIVE-CELL MICROSCOP Y: TRICKS AND TRADE-OFFS SECTION TWO | RESEARCH ARTICLES
Originally published online on 22 April 2016 in SCIENCE
indicative of ordered geometric constraints on
the buckling MT. This was observed in certain
cells where faint transverse staining at the Z-disc
shows MTs buckling between sarcomeric con-
straints (movie S4).
Detyrosination regulates MT buckling in
the heart
This robust buckling behavior of theMTnetwork
may be a result of a particularly high abundance
of “detyrosinated” MTs in adult cardiomyocytes
(19). Detyrosination is a PTM of a-tubulin where
the C-terminal tyrosine residue has been cleaved
by a tubulin carboxypeptidase (TCP); this process
can be readily reversed by tubulin tyrosine ligase
(TTL) (11). This tyrosination cycle is evolutionar-
ily conserved across eukaryotes (20) and appears
required for life (21), yet its functional roles are
still poorly understood. Because detyrosination
can protect MTs from disassembly (22, 23) and
can facilitate their cross-linkingwith intermediate
filaments (IFs) (24, 25), we hypothesized that the
high proportion of detyrosination may confer the
resilient load-bearing capabilities of the cardiac
cytoskeletal network.
Using antibodies specific to detyrosinated a-
tubulin, we found a high abundance of detyrosi-
nation in the a-tubulin network of adultmyocytes
(Fig. 2, A and B), as expected (12, 19). To test the
role of detyrosinated MTs, we generated adeno-
virus encoding TTL (AdV-TTL) with a Discosoma
red fluorescent protein (DsRed) reporter. Express-
ing this construct in isolated cardiomyocytes
could effectively reduce the level of detyrosina-
tion as shown by both immunofluorescence (Fig.
2, A and B) and immunoblot (Fig. 2, C and D),
which resulted in a 71% reduction in the amount
of polymerized, detyrosinated MTs, with a con-
comitant up-regulation of tyrosinated tubulin
(Fig. 2, C and D, and fig. S2). Overexpression of
TTL also resulted in a modest (10%) reduction in
the density of the polymerized MT network (Fig.
2B), consistent with an increased disassembly of
tyrosinated MTs (22, 23). We complemented this
genetic strategy with a pharmacological approach
to inhibit TCP using parthenolide (PTL) (26). PTL
treatment also reduced the fraction of detyrosi-
nated MTs, albeit to a lesser extent (42%) than
aaf0659-2 22 APRIL 2016 • VOL 352 ISSUE 6284 sciencemag.org SCIENCE
rest
Confocal
subsarcolemmal SiR tubulin
EMTB
interior
Airyscan
contract
MT
am
plit
ud
e (
µm
)
rest contracted
0ms
35ms
70ms
105ms
175ms
active frame, rest frame
1µm
1µm
1µm
2 µm
1.5 2.0 2.5 3.0
3.3µm
0.5 1.0 3.5 4.0 4.5 5.0
0
10
20
30
Co
un
ts
Buckle Wavelength, λ ( µm)
~ 3.3µm
~ 1.65µm
~ 4.7µm
1.65µm
rest
contract
Amp
Pe
ars
on
’s
Time (s)
0.4
0 1 2 3 4
0.6
0.8
1.0
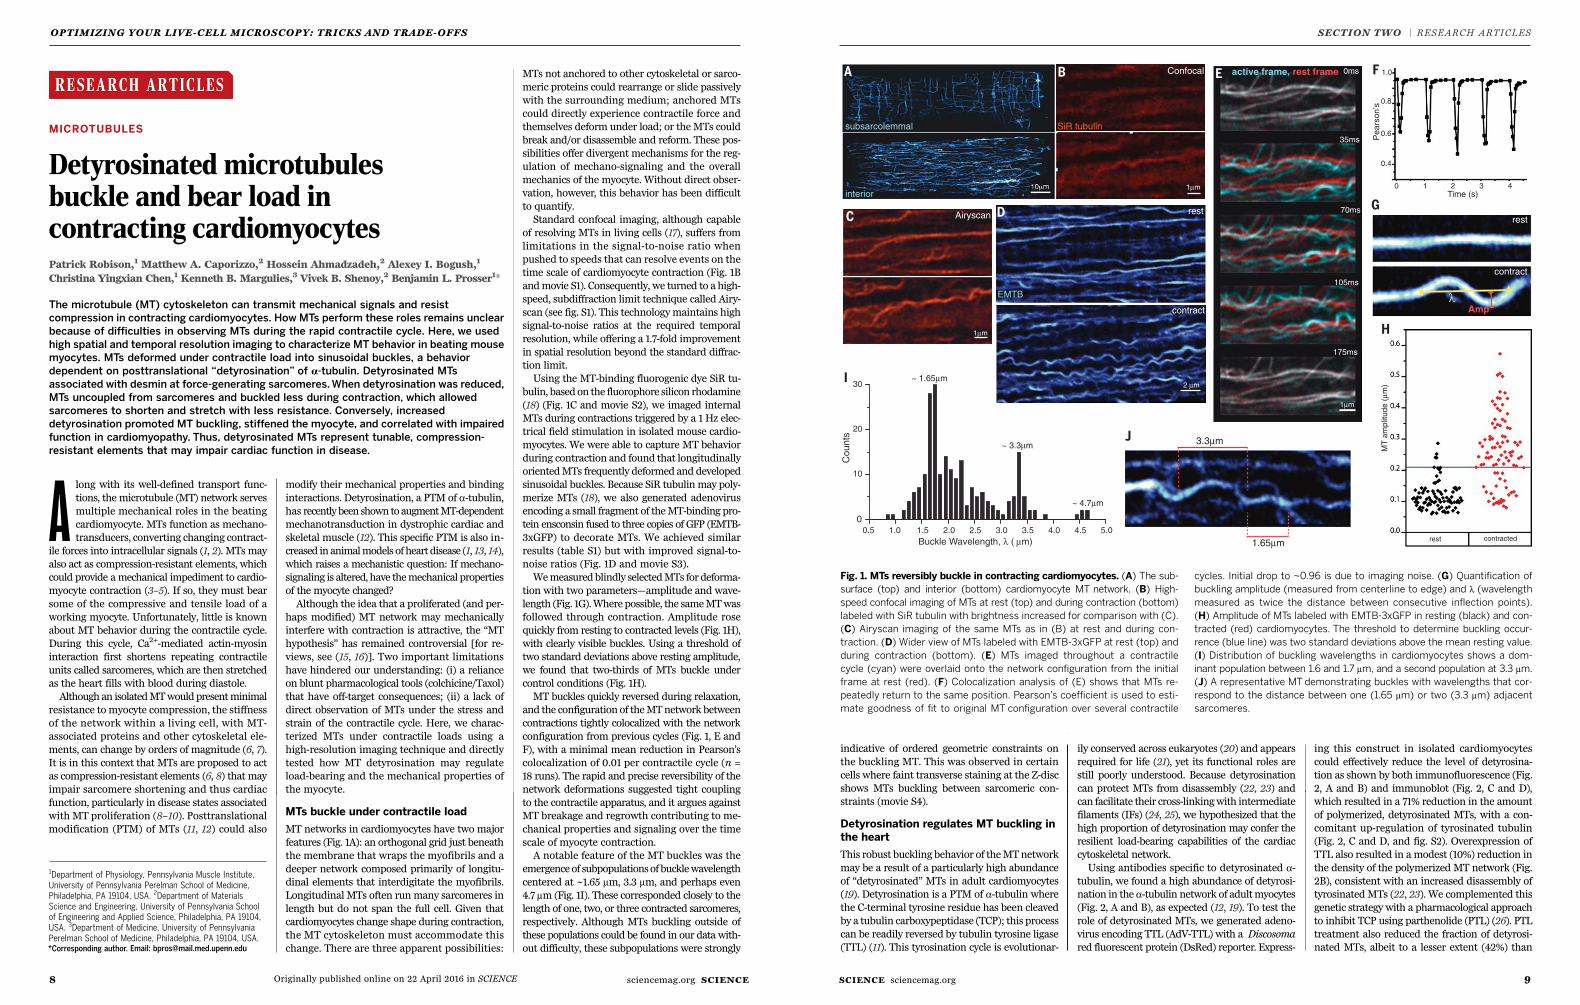
Fig. 1. MTs reversibly buckle in contracting cardiomyocytes. (A) The sub-
surface (top) and interior (bottom) cardiomyocyte MT network. (B) High-
speed confocal imaging of MTs at rest (top) and during contraction (bottom)
labeled with SiR tubulin with brightness increased for comparison with (C).
(C) Airyscan imaging of the same MTs as in (B) at rest and during con-
traction. (D) Wider view of MTs labeled with EMTB-3xGFP at rest (top) and
during contraction (bottom). (E) MTs imaged throughout a contractile
cycle (cyan) were overlaid onto the network configuration from the initial
frame at rest (red). (F) Colocalization analysis of (E) shows that MTs re-
peatedly return to the same position. Pearson’s coefficient is used to esti-
mate goodness of fit to original MT configuration over several contractile
cycles. Initial drop to ~0.96 is due to imaging noise. (G) Quantification of
buckling amplitude (measured from centerline to edge) and l (wavelength
measured as twice the distance between consecutive inflection points).
(H) Amplitude of MTs labeled with EMTB-3xGFP in resting (black) and con-
tracted (red) cardiomyocytes. The threshold to determine buckling occur-
rence (blue line) was two standard deviations above the mean resting value.
(I) Distribution of buckling wavelengths in cardiomyocytes shows a dom-
inant population between 1.6 and 1.7 mm, and a second population at 3.3 mm.
(J) A representative MTdemonstrating buckles with wavelengths that cor-
respond to the distance between one (1.65 mm) or two (3.3 mm) adjacent
sarcomeres.
RESEARCH | RESEARCH ARTICLE
9SCIENCE sciencemag.org
SECTION TWO | RESEARCH ARTICLES
indicative of ordered geometric constraints on
the buckling MT. This was observed in certain
cells where faint transverse staining at the Z-disc
shows MTs buckling between sarcomeric con-
straints (movie S4).
Detyrosination regulates MT buckling in
the heart
This robust buckling behavior of theMTnetwork
may be a result of a particularly high abundance
of “detyrosinated” MTs in adult cardiomyocytes
(19). Detyrosination is a PTM of a-tubulin where
the C-terminal tyrosine residue has been cleaved
by a tubulin carboxypeptidase (TCP); this process
can be readily reversed by tubulin tyrosine ligase
(TTL) (11). This tyrosination cycle is evolutionar-
ily conserved across eukaryotes (20) and appears
required for life (21), yet its functional roles are
still poorly understood. Because detyrosination
can protect MTs from disassembly (22, 23) and
can facilitate their cross-linkingwith intermediate
filaments (IFs) (24, 25), we hypothesized that the
high proportion of detyrosination may confer the
resilient load-bearing capabilities of the cardiac
cytoskeletal network.
Using antibodies specific to detyrosinated a-
tubulin, we found a high abundance of detyrosi-
nation in the a-tubulin network of adultmyocytes
(Fig. 2, A and B), as expected (12, 19). To test the
role of detyrosinated MTs, we generated adeno-
virus encoding TTL (AdV-TTL) with a Discosoma
red fluorescent protein (DsRed) reporter. Express-
ing this construct in isolated cardiomyocytes
could effectively reduce the level of detyrosina-
tion as shown by both immunofluorescence (Fig.
2, A and B) and immunoblot (Fig. 2, C and D),
which resulted in a 71% reduction in the amount
of polymerized, detyrosinated MTs, with a con-
comitant up-regulation of tyrosinated tubulin
(Fig. 2, C and D, and fig. S2). Overexpression of
TTL also resulted in a modest (10%) reduction in
the density of the polymerized MT network (Fig.
2B), consistent with an increased disassembly of
tyrosinated MTs (22, 23). We complemented this
genetic strategy with a pharmacological approach
to inhibit TCP using parthenolide (PTL) (26). PTL
treatment also reduced the fraction of detyrosi-
nated MTs, albeit to a lesser extent (42%) than
8 sciencemag.org SCIENCE
TITLE
Originally published 22 April 2016 in SCIENCE
RESEARCH ARTICLE◥
MICROTUBULES
Detyrosinated microtubulesbuckle and bear load incontracting cardiomyocytesPatrick Robison,1 Matthew A. Caporizzo,2 Hossein Ahmadzadeh,2 Alexey I. Bogush,1
Christina Yingxian Chen,1 Kenneth B. Margulies,3 Vivek B. Shenoy,2 Benjamin L. Prosser1*
The microtubule (MT) cytoskeleton can transmit mechanical signals and resist
compression in contracting cardiomyocytes. How MTs perform these roles remains unclear
because of difficulties in observing MTs during the rapid contractile cycle. Here, we used
high spatial and temporal resolution imaging to characterize MT behavior in beating mouse
myocytes. MTs deformed under contractile load into sinusoidal buckles, a behavior
dependent on posttranslational “detyrosination” of a-tubulin. Detyrosinated MTs
associated with desmin at force-generating sarcomeres.When detyrosination was reduced,
MTs uncoupled from sarcomeres and buckled less during contraction, which allowed
sarcomeres to shorten and stretch with less resistance. Conversely, increased
detyrosination promoted MT buckling, stiffened the myocyte, and correlated with impaired
function in cardiomyopathy. Thus, detyrosinated MTs represent tunable, compression-
resistant elements that may impair cardiac function in disease.
Along with its well-defined transport func-
tions, the microtubule (MT) network serves
multiple mechanical roles in the beating
cardiomyocyte. MTs function as mechano-
transducers, converting changing contract-
ile forces into intracellular signals (1, 2). MTs may
also act as compression-resistant elements, which
could provide a mechanical impediment to cardio-
myocyte contraction (3–5). If so, they must bear
some of the compressive and tensile load of a
working myocyte. Unfortunately, little is known
about MT behavior during the contractile cycle.
During this cycle, Ca2+-mediated actin-myosin
interaction first shortens repeating contractile
units called sarcomeres, which are then stretched
as the heart fills with blood during diastole.
Although an isolatedMTwould presentminimal
resistance to myocyte compression, the stiffness
of the network within a living cell, with MT-
associated proteins and other cytoskeletal ele-
ments, can change by orders of magnitude (6, 7).
It is in this context that MTs are proposed to act
as compression-resistant elements (6, 8) that may
impair sarcomere shortening and thus cardiac
function, particularly in disease states associated
with MT proliferation (8–10). Posttranslational
modification (PTM) of MTs (11, 12) could also
modify their mechanical properties and binding
interactions. Detyrosination, a PTM of a-tubulin,
has recently been shown toaugmentMT-dependent
mechanotransduction in dystrophic cardiac and
skeletal muscle (12). This specific PTM is also in-
creased in animalmodels of heartdisease (1, 13, 14),
which raises a mechanistic question: If mechano-
signaling is altered, have themechanical properties
of the myocyte changed?
Although the idea that a proliferated (and per-
haps modified) MT network may mechanically
interfere with contraction is attractive, the “MT
hypothesis” has remained controversial [for re-
views, see (15, 16)]. Two important limitations
have hindered our understanding: (i) a reliance
on blunt pharmacological tools (colchicine/Taxol)
that have off-target consequences; (ii) a lack of
direct observation of MTs under the stress and
strain of the contractile cycle. Here, we charac-
terized MTs under contractile loads using a
high-resolution imaging technique and directly
tested how MT detyrosination may regulate
load-bearing and the mechanical properties of
the myocyte.
MTs buckle under contractile load
MT networks in cardiomyocytes have two major
features (Fig. 1A): an orthogonal grid just beneath
the membrane that wraps the myofibrils and a
deeper network composed primarily of longitu-
dinal elements that interdigitate the myofibrils.
Longitudinal MTs often runmany sarcomeres in
length but do not span the full cell. Given that
cardiomyocytes change shape during contraction,
the MT cytoskeleton must accommodate this
change. There are three apparent possibilities:
MTs not anchored to other cytoskeletal or sarco-
meric proteins could rearrange or slide passively
with the surrounding medium; anchored MTs
could directly experience contractile force and
themselves deform under load; or the MTs could
break and/or disassemble and reform. These pos-
sibilities offer divergent mechanisms for the reg-
ulation of mechano-signaling and the overall
mechanics of the myocyte. Without direct obser-
vation, however, this behavior has been difficult
to quantify.
Standard confocal imaging, although capable
of resolving MTs in living cells (17), suffers from
limitations in the signal-to-noise ratio when
pushed to speeds that can resolve events on the
time scale of cardiomyocyte contraction (Fig. 1B
andmovie S1). Consequently, we turned to a high-
speed, subdiffraction limit technique called Airy-
scan (see fig. S1). This technologymaintains high
signal-to-noise ratios at the required temporal
resolution, while offering a 1.7-fold improvement
in spatial resolution beyond the standard diffrac-
tion limit.
Using the MT-binding fluorogenic dye SiR tu-
bulin, basedon the fluorophore silicon rhodamine
(18) (Fig. 1C and movie S2), we imaged internal
MTs during contractions triggered by a 1 Hz elec-
trical field stimulation in isolated mouse cardio-
myocytes. We were able to capture MT behavior
during contraction and found that longitudinally
orientedMTs frequently deformed and developed
sinusoidal buckles. Because SiR tubulin may poly-
merize MTs (18), we also generated adenovirus
encoding a small fragment of theMT-binding pro-
tein ensconsin fused to three copies of GFP (EMTB-
3xGFP) to decorate MTs. We achieved similar
results (table S1) but with improved signal-to-
noise ratios (Fig. 1D and movie S3).
Wemeasured blindly selectedMTs for deforma-
tion with two parameters—amplitude and wave-
length (Fig. 1G).Where possible, the sameMTwas
followed through contraction. Amplitude rose
quickly from resting to contracted levels (Fig. 1H),
with clearly visible buckles. Using a threshold of
two standard deviations above resting amplitude,
we found that two-thirds of MTs buckle under
control conditions (Fig. 1H).
MT buckles quickly reversed during relaxation,
and the configuration of theMTnetwork between
contractions tightly colocalized with the network
configuration from previous cycles (Fig. 1, E and
F), with a minimal mean reduction in Pearson’s
colocalization of 0.01 per contractile cycle (n =
18 runs). The rapid and precise reversibility of the
network deformations suggested tight coupling
to the contractile apparatus, and it argues against
MT breakage and regrowth contributing to me-
chanical properties and signaling over the time
scale of myocyte contraction.
A notable feature of the MT buckles was the
emergence of subpopulationsof bucklewavelength
centered at ~1.65 mm, 3.3 mm, and perhaps even
4.7 mm (Fig. 1I). These corresponded closely to the
length of one, two, or three contracted sarcomeres,
respectively. Although MTs buckling outside of
these populations could be found in our data with-
out difficulty, these subpopulations were strongly
1Department of Physiology, Pennsylvania Muscle Institute,University of Pennsylvania Perelman School of Medicine,Philadelphia, PA 19104, USA. 2Department of MaterialsScience and Engineering, University of Pennsylvania Schoolof Engineering and Applied Science, Philadelphia, PA 19104,USA. 3Department of Medicine, University of PennsylvaniaPerelman School of Medicine, Philadelphia, PA 19104, USA.*Corresponding author. Email: [email protected]
RESEARCH ARTICLE◥
MICROTUBULES
Detyrosinated microtubulesbuckle and bear load incontracting cardiomyocytesPatrick Robison,1 Matthew A. Caporizzo,2 Hossein Ahmadzadeh,2 Alexey I. Bogush,1
Christina Yingxian Chen,1 Kenneth B. Margulies,3 Vivek B. Shenoy,2 Benjamin L. Prosser1*
The microtubule (MT) cytoskeleton can transmit mechanical signals and resist
compression in contracting cardiomyocytes. How MTs perform these roles remains unclear
because of difficulties in observing MTs during the rapid contractile cycle. Here, we used
high spatial and temporal resolution imaging to characterize MT behavior in beating mouse
myocytes. MTs deformed under contractile load into sinusoidal buckles, a behavior
dependent on posttranslational “detyrosination” of a-tubulin. Detyrosinated MTs
associated with desmin at force-generating sarcomeres.When detyrosination was reduced,
MTs uncoupled from sarcomeres and buckled less during contraction, which allowed
sarcomeres to shorten and stretch with less resistance. Conversely, increased
detyrosination promoted MT buckling, stiffened the myocyte, and correlated with impaired
function in cardiomyopathy. Thus, detyrosinated MTs represent tunable, compression-
resistant elements that may impair cardiac function in disease.
Along with its well-defined transport func-
tions, the microtubule (MT) network serves
multiple mechanical roles in the beating
cardiomyocyte. MTs function as mechano-
transducers, converting changing contract-
ile forces into intracellular signals (1, 2). MTs may
also act as compression-resistant elements, which
could provide a mechanical impediment to cardio-
myocyte contraction (3–5). If so, they must bear
some of the compressive and tensile load of a
working myocyte. Unfortunately, little is known
about MT behavior during the contractile cycle.
During this cycle, Ca2+-mediated actin-myosin
interaction first shortens repeating contractile
units called sarcomeres, which are then stretched
as the heart fills with blood during diastole.
Although an isolatedMTwould presentminimal
resistance to myocyte compression, the stiffness
of the network within a living cell, with MT-
associated proteins and other cytoskeletal ele-
ments, can change by orders of magnitude (6, 7).
It is in this context that MTs are proposed to act
as compression-resistant elements (6, 8) that may
impair sarcomere shortening and thus cardiac
function, particularly in disease states associated
with MT proliferation (8–10). Posttranslational
modification (PTM) of MTs (11, 12) could also
modify their mechanical properties and binding
interactions. Detyrosination, a PTM of a-tubulin,
has recently been shown toaugmentMT-dependent
mechanotransduction in dystrophic cardiac and
skeletal muscle (12). This specific PTM is also in-
creased in animalmodels of heart disease (1, 13, 14),
which raises a mechanistic question: If mechano-
signaling is altered, have themechanical properties
of the myocyte changed?
Although the idea that a proliferated (and per-
haps modified) MT network may mechanically
interfere with contraction is attractive, the “MT
hypothesis” has remained controversial [for re-
views, see (15, 16)]. Two important limitations
have hindered our understanding: (i) a reliance
on blunt pharmacological tools (colchicine/Taxol)
that have off-target consequences; (ii) a lack of
direct observation of MTs under the stress and
strain of the contractile cycle. Here, we charac-
terized MTs under contractile loads using a
high-resolution imaging technique and directly
tested how MT detyrosination may regulate
load-bearing and the mechanical properties of
the myocyte.
MTs buckle under contractile load
MT networks in cardiomyocytes have two major
features (Fig. 1A): an orthogonal grid just beneath
the membrane that wraps the myofibrils and a
deeper network composed primarily of longitu-
dinal elements that interdigitate the myofibrils.
Longitudinal MTs often runmany sarcomeres in
length but do not span the full cell. Given that
cardiomyocytes change shape during contraction,
the MT cytoskeleton must accommodate this
change. There are three apparent possibilities:
MTs not anchored to other cytoskeletal or sarco-
meric proteins could rearrange or slide passively
with the surrounding medium; anchored MTs
could directly experience contractile force and
themselves deform under load; or the MTs could
break and/or disassemble and reform. These pos-
sibilities offer divergent mechanisms for the reg-
ulation of mechano-signaling and the overall
mechanics of the myocyte. Without direct obser-
vation, however, this behavior has been difficult
to quantify.
Standard confocal imaging, although capable
of resolving MTs in living cells (17), suffers from
limitations in the signal-to-noise ratio when
pushed to speeds that can resolve events on the
time scale of cardiomyocyte contraction (Fig. 1B
andmovie S1). Consequently, we turned to a high-
speed, subdiffraction limit technique called Airy-
scan (see fig. S1). This technologymaintains high
signal-to-noise ratios at the required temporal
resolution, while offering a 1.7-fold improvement
in spatial resolution beyond the standard diffrac-
tion limit.
Using the MT-binding fluorogenic dye SiR tu-
bulin, based on the fluorophore silicon rhodamine
(18) (Fig. 1C and movie S2), we imaged internal
MTs during contractions triggered by a 1 Hz elec-
trical field stimulation in isolated mouse cardio-
myocytes. We were able to capture MT behavior
during contraction and found that longitudinally
orientedMTs frequently deformed and developed
sinusoidal buckles. Because SiR tubulinmay poly-
merize MTs (18), we also generated adenovirus
encoding a small fragment of theMT-binding pro-
tein ensconsin fused to three copies of GFP (EMTB-
3xGFP) to decorate MTs. We achieved similar
results (table S1) but with improved signal-to-
noise ratios (Fig. 1D and movie S3).
Wemeasuredblindly selectedMTs for deforma-
tion with two parameters—amplitude and wave-
length (Fig. 1G).Where possible, the sameMTwas
followed through contraction. Amplitude rose
quickly from resting to contracted levels (Fig. 1H),
with clearly visible buckles. Using a threshold of
two standard deviations above resting amplitude,
we found that two-thirds of MTs buckle under
control conditions (Fig. 1H).
MT buckles quickly reversed during relaxation,
and the configuration of theMTnetwork between
contractions tightly colocalized with the network
configuration from previous cycles (Fig. 1, E and
F), with a minimal mean reduction in Pearson’s
colocalization of 0.01 per contractile cycle (n =
18 runs). The rapid and precise reversibility of the
network deformations suggested tight coupling
to the contractile apparatus, and it argues against
MT breakage and regrowth contributing to me-
chanical properties and signaling over the time
scale of myocyte contraction.
A notable feature of the MT buckles was the
emergence of subpopulationsof bucklewavelength
centered at ~1.65 mm, 3.3 mm, and perhaps even
4.7 mm (Fig. 1I). These corresponded closely to the
length of one, two, or three contracted sarcomeres,
respectively. Although MTs buckling outside of
these populations could be found in our data with-
out difficulty, these subpopulations were strongly
RESEARCH
SCIENCE sciencemag.org 22 APRIL 2016 • VOL 352 ISSUE 6284 aaf0659-1
1Department of Physiology, Pennsylvania Muscle Institute,University of Pennsylvania Perelman School of Medicine,Philadelphia, PA 19104, USA. 2Department of MaterialsScience and Engineering, University of Pennsylvania Schoolof Engineering and Applied Science, Philadelphia, PA 19104,USA. 3Department of Medicine, University of PennsylvaniaPerelman School of Medicine, Philadelphia, PA 19104, USA.*Corresponding author. Email: [email protected]
8 sciencemag.org SCIENCE
TITLE
Originally published 22 April 2016 in SCIENCE
RESEARCH ARTICLE◥
MICROTUBULES
Detyrosinated microtubulesbuckle and bear load incontracting cardiomyocytesPatrick Robison,1 Matthew A. Caporizzo,2 Hossein Ahmadzadeh,2 Alexey I. Bogush,1
Christina Yingxian Chen,1 Kenneth B. Margulies,3 Vivek B. Shenoy,2 Benjamin L. Prosser1*
The microtubule (MT) cytoskeleton can transmit mechanical signals and resist
compression in contracting cardiomyocytes. How MTs perform these roles remains unclear
because of difficulties in observing MTs during the rapid contractile cycle. Here, we used
high spatial and temporal resolution imaging to characterize MT behavior in beating mouse
myocytes. MTs deformed under contractile load into sinusoidal buckles, a behavior
dependent on posttranslational “detyrosination” of a-tubulin. Detyrosinated MTs
associated with desmin at force-generating sarcomeres.When detyrosination was reduced,
MTs uncoupled from sarcomeres and buckled less during contraction, which allowed
sarcomeres to shorten and stretch with less resistance. Conversely, increased
detyrosination promoted MT buckling, stiffened the myocyte, and correlated with impaired
function in cardiomyopathy. Thus, detyrosinated MTs represent tunable, compression-
resistant elements that may impair cardiac function in disease.
Along with its well-defined transport func-
tions, the microtubule (MT) network serves
multiple mechanical roles in the beating
cardiomyocyte. MTs function as mechano-
transducers, converting changing contract-
ile forces into intracellular signals (1, 2). MTs may
also act as compression-resistant elements, which
could provide a mechanical impediment to cardio-
myocyte contraction (3–5). If so, they must bear
some of the compressive and tensile load of a
working myocyte. Unfortunately, little is known
about MT behavior during the contractile cycle.
During this cycle, Ca2+-mediated actin-myosin
interaction first shortens repeating contractile
units called sarcomeres, which are then stretched
as the heart fills with blood during diastole.
Although an isolatedMTwould presentminimal
resistance to myocyte compression, the stiffness
of the network within a living cell, with MT-
associated proteins and other cytoskeletal ele-
ments, can change by orders of magnitude (6, 7).
It is in this context that MTs are proposed to act
as compression-resistant elements (6, 8) that may
impair sarcomere shortening and thus cardiac
function, particularly in disease states associated
with MT proliferation (8–10). Posttranslational
modification (PTM) of MTs (11, 12) could also
modify their mechanical properties and binding
interactions. Detyrosination, a PTM of a-tubulin,
has recently been shown toaugmentMT-dependent
mechanotransduction in dystrophic cardiac and
skeletal muscle (12). This specific PTM is also in-
creased in animalmodels of heartdisease (1, 13, 14),
which raises a mechanistic question: If mechano-
signaling is altered, have themechanical properties
of the myocyte changed?
Although the idea that a proliferated (and per-
haps modified) MT network may mechanically
interfere with contraction is attractive, the “MT
hypothesis” has remained controversial [for re-
views, see (15, 16)]. Two important limitations
have hindered our understanding: (i) a reliance
on blunt pharmacological tools (colchicine/Taxol)
that have off-target consequences; (ii) a lack of
direct observation of MTs under the stress and
strain of the contractile cycle. Here, we charac-
terized MTs under contractile loads using a
high-resolution imaging technique and directly
tested how MT detyrosination may regulate
load-bearing and the mechanical properties of
the myocyte.
MTs buckle under contractile load
MT networks in cardiomyocytes have two major
features (Fig. 1A): an orthogonal grid just beneath
the membrane that wraps the myofibrils and a
deeper network composed primarily of longitu-
dinal elements that interdigitate the myofibrils.
Longitudinal MTs often runmany sarcomeres in
length but do not span the full cell. Given that
cardiomyocytes change shape during contraction,
the MT cytoskeleton must accommodate this
change. There are three apparent possibilities:
MTs not anchored to other cytoskeletal or sarco-
meric proteins could rearrange or slide passively
with the surrounding medium; anchored MTs
could directly experience contractile force and
themselves deform under load; or the MTs could
break and/or disassemble and reform. These pos-
sibilities offer divergent mechanisms for the reg-
ulation of mechano-signaling and the overall
mechanics of the myocyte. Without direct obser-
vation, however, this behavior has been difficult
to quantify.
Standard confocal imaging, although capable
of resolving MTs in living cells (17), suffers from
limitations in the signal-to-noise ratio when
pushed to speeds that can resolve events on the
time scale of cardiomyocyte contraction (Fig. 1B
andmovie S1). Consequently, we turned to a high-
speed, subdiffraction limit technique called Airy-
scan (see fig. S1). This technologymaintains high
signal-to-noise ratios at the required temporal
resolution, while offering a 1.7-fold improvement
in spatial resolution beyond the standard diffrac-
tion limit.
Using the MT-binding fluorogenic dye SiR tu-
bulin, basedon the fluorophore silicon rhodamine
(18) (Fig. 1C and movie S2), we imaged internal
MTs during contractions triggered by a 1 Hz elec-
trical field stimulation in isolated mouse cardio-
myocytes. We were able to capture MT behavior
during contraction and found that longitudinally
orientedMTs frequently deformed and developed
sinusoidal buckles. Because SiR tubulin may poly-
merize MTs (18), we also generated adenovirus
encoding a small fragment of theMT-binding pro-
tein ensconsin fused to three copies of GFP (EMTB-
3xGFP) to decorate MTs. We achieved similar
results (table S1) but with improved signal-to-
noise ratios (Fig. 1D and movie S3).
Wemeasured blindly selectedMTs for deforma-
tion with two parameters—amplitude and wave-
length (Fig. 1G).Where possible, the sameMTwas
followed through contraction. Amplitude rose
quickly from resting to contracted levels (Fig. 1H),
with clearly visible buckles. Using a threshold of
two standard deviations above resting amplitude,
we found that two-thirds of MTs buckle under
control conditions (Fig. 1H).
MT buckles quickly reversed during relaxation,
and the configuration of theMTnetwork between
contractions tightly colocalized with the network
configuration from previous cycles (Fig. 1, E and
F), with a minimal mean reduction in Pearson’s
colocalization of 0.01 per contractile cycle (n =
18 runs). The rapid and precise reversibility of the
network deformations suggested tight coupling
to the contractile apparatus, and it argues against
MT breakage and regrowth contributing to me-
chanical properties and signaling over the time
scale of myocyte contraction.
A notable feature of the MT buckles was the
emergence of subpopulationsof bucklewavelength
centered at ~1.65 mm, 3.3 mm, and perhaps even
4.7 mm (Fig. 1I). These corresponded closely to the
length of one, two, or three contracted sarcomeres,
respectively. Although MTs buckling outside of
these populations could be found in our data with-
out difficulty, these subpopulations were strongly
1Department of Physiology, Pennsylvania Muscle Institute,University of Pennsylvania Perelman School of Medicine,Philadelphia, PA 19104, USA. 2Department of MaterialsScience and Engineering, University of Pennsylvania Schoolof Engineering and Applied Science, Philadelphia, PA 19104,USA. 3Department of Medicine, University of PennsylvaniaPerelman School of Medicine, Philadelphia, PA 19104, USA.*Corresponding author. Email: [email protected]
1110 SCIENCE sciencemag.orgsciencemag.org SCIENCE
OPTIMIZING YOUR LIVE-CELL MICROSCOP Y: TRICKS AND TRADE-OFFS SECTION TWO | RESEARCH ARTICLES
11
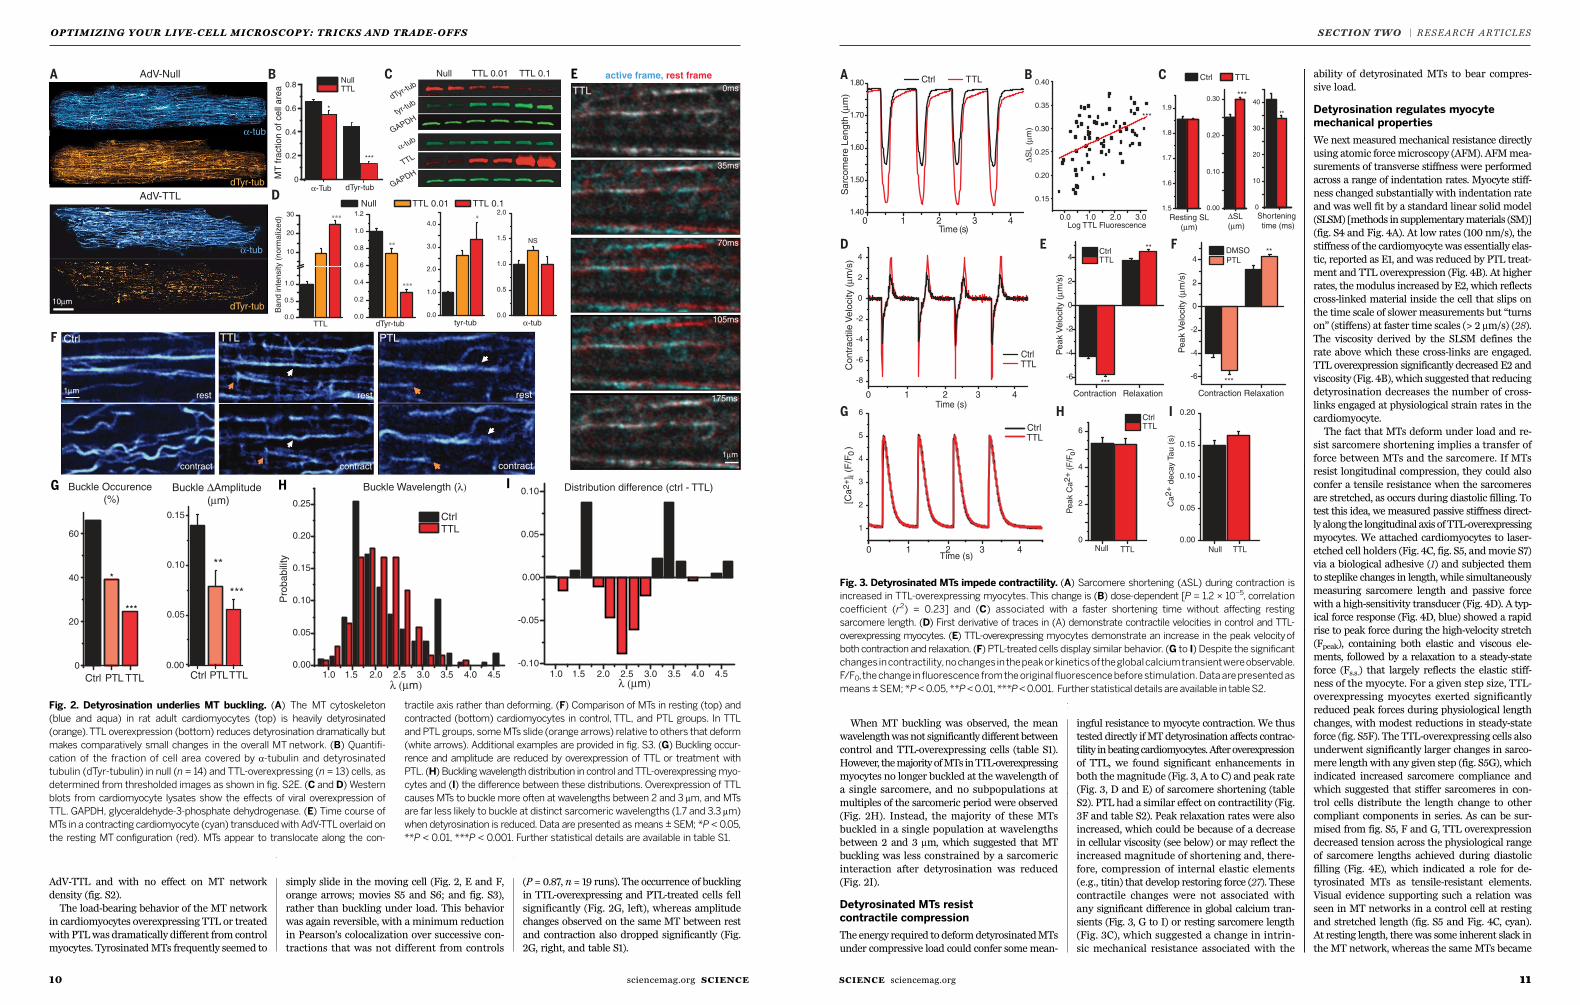
AdV-TTL and with no effect on MT network
density (fig. S2).
The load-bearing behavior of the MT network
in cardiomyocytes overexpressing TTL or treated
with PTLwas dramatically different from control
myocytes. TyrosinatedMTs frequently seemed to
simply slide in the moving cell (Fig. 2, E and F,
orange arrows; movies S5 and S6; and fig. S3),
rather than buckling under load. This behavior
was again reversible, with a minimum reduction
in Pearson’s colocalization over successive con-
tractions that was not different from controls
(P = 0.87, n = 19 runs). The occurrence of buckling
in TTL-overexpressing and PTL-treated cells fell
significantly (Fig. 2G, left), whereas amplitude
changes observed on the same MT between rest
and contraction also dropped significantly (Fig.
2G, right, and table S1).
SCIENCE sciencemag.org 22 APRIL 2016 • VOL 352 ISSUE 6284 aaf0659-3
Fig. 2. Detyrosination underlies MT buckling. (A) The MT cytoskeleton
(blue and aqua) in rat adult cardiomyocytes (top) is heavily detyrosinated
(orange).TTL overexpression (bottom) reduces detyrosination dramatically but
makes comparatively small changes in the overall MT network. (B) Quantifi-
cation of the fraction of cell area covered by a-tubulin and detyrosinated
tubulin (dTyr-tubulin) in null (n = 14) and TTL-overexpressing (n = 13) cells, as
determined from thresholded images as shown in fig. S2E. (C and D) Western
blots from cardiomyocyte lysates show the effects of viral overexpression of
TTL. GAPDH, glyceraldehyde-3-phosphate dehydrogenase. (E) Time course of
MTs in a contracting cardiomyocyte (cyan) transducedwith AdV-TTLoverlaid on
the resting MT configuration (red). MTs appear to translocate along the con-
tractile axis rather than deforming. (F) Comparison of MTs in resting (top) and
contracted (bottom) cardiomyocytes in control, TTL, and PTL groups. In TTL
and PTL groups, someMTs slide (orange arrows) relative to others that deform
(white arrows). Additional examples are provided in fig. S3. (G) Buckling occur-
rence and amplitude are reduced by overexpression of TTL or treatment with
PTL. (H) Bucklingwavelength distribution in control and TTL-overexpressingmyo-
cytes and (I) the difference between these distributions. Overexpression of TTL
causes MTs to buckle more often at wavelengths between 2 and 3 mm, and MTs
are far less likely to buckle at distinct sarcomeric wavelengths (1.7 and 3.3 mm)
when detyrosination is reduced. Data are presented as means ± SEM; *P < 0.05,
**P < 0.01, ***P < 0.001. Further statistical details are available in table S1.
RESEARCH | RESEARCH ARTICLE
10 sciencemag.org SCIENCE
TITLE
AdV-TTL and with no effect on MT network
density (fig. S2).
The load-bearing behavior of the MT network
in cardiomyocytes overexpressing TTL or treated
with PTLwas dramatically different from control
myocytes. TyrosinatedMTs frequently seemed to
simply slide in the moving cell (Fig. 2, E and F,
orange arrows; movies S5 and S6; and fig. S3),
rather than buckling under load. This behavior
was again reversible, with a minimum reduction
in Pearson’s colocalization over successive con-
tractions that was not different from controls
(P = 0.87, n = 19 runs). The occurrence of buckling
in TTL-overexpressing and PTL-treated cells fell
significantly (Fig. 2G, left), whereas amplitude
changes observed on the same MT between rest
and contraction also dropped significantly (Fig.
2G, right, and table S1).
11SCIENCE sciencemag.org
SECTION TWO | RESEARCH ARTICLES
11
When MT buckling was observed, the mean
wavelengthwasnot significantly different between
control and TTL-overexpressing cells (table S1).
However, themajorityofMTs inTTL-overexpressing
myocytes no longer buckled at the wavelength of
a single sarcomere, and no subpopulations at
multiples of the sarcomeric period were observed
(Fig. 2H). Instead, the majority of these MTs
buckled in a single population at wavelengths
between 2 and 3 mm, which suggested that MT
buckling was less constrained by a sarcomeric
interaction after detyrosination was reduced
(Fig. 2I).
Detyrosinated MTs resist
contractile compression
The energy required to deformdetyrosinatedMTs
under compressive load could confer somemean-
ingful resistance to myocyte contraction. We thus
tested directly ifMT detyrosination affects contrac-
tility inbeatingcardiomyocytes.Afteroverexpression
of TTL, we found significant enhancements in
both the magnitude (Fig. 3, A to C) and peak rate
(Fig. 3, D and E) of sarcomere shortening (table
S2). PTL had a similar effect on contractility (Fig.
3F and table S2). Peak relaxation rates were also
increased, which could be because of a decrease
in cellular viscosity (see below) or may reflect the
increased magnitude of shortening and, there-
fore, compression of internal elastic elements
(e.g., titin) that develop restoring force (27). These
contractile changes were not associated with
any significant difference in global calcium tran-
sients (Fig. 3, G to I) or resting sarcomere length
(Fig. 3C), which suggested a change in intrin-
sic mechanical resistance associated with the
ability of detyrosinated MTs to bear compres-
sive load.
Detyrosination regulates myocyte
mechanical properties
We next measured mechanical resistance directly
using atomic forcemicroscopy (AFM). AFMmea-
surements of transverse stiffness were performed
across a range of indentation rates. Myocyte stiff-
ness changed substantially with indentation rate
and was well fit by a standard linear solid model
(SLSM) [methods in supplementarymaterials (SM)]
(fig. S4 and Fig. 4A). At low rates (100 nm/s), the
stiffness of the cardiomyocyte was essentially elas-
tic, reported as E1, and was reduced by PTL treat-
ment and TTL overexpression (Fig. 4B). At higher
rates, themodulus increased by E2, which reflects
cross-linked material inside the cell that slips on
the time scale of slower measurements but “turns
on” (stiffens) at faster time scales (> 2 mm/s) (28).
The viscosity derived by the SLSM defines the
rate above which these cross-links are engaged.
TTL overexpression significantly decreased E2 and
viscosity (Fig. 4B), which suggested that reducing
detyrosination decreases the number of cross-
links engaged at physiological strain rates in the
cardiomyocyte.
The fact that MTs deform under load and re-
sist sarcomere shortening implies a transfer of
force between MTs and the sarcomere. If MTs
resist longitudinal compression, they could also
confer a tensile resistance when the sarcomeres
are stretched, as occurs during diastolic filling. To
test this idea, we measured passive stiffness direct-
ly along the longitudinal axis of TTL-overexpressing
myocytes. We attached cardiomyocytes to laser-
etched cell holders (Fig. 4C, fig. S5, andmovie S7)
via a biological adhesive (1) and subjected them
to steplike changes in length, while simultaneously
measuring sarcomere length and passive force
with a high-sensitivity transducer (Fig. 4D). A typ-
ical force response (Fig. 4D, blue) showed a rapid
rise to peak force during the high-velocity stretch
(Fpeak), containing both elastic and viscous ele-
ments, followed by a relaxation to a steady-state
force (Fs.s.) that largely reflects the elastic stiff-
ness of the myocyte. For a given step size, TTL-
overexpressing myocytes exerted significantly
reduced peak forces during physiological length
changes, with modest reductions in steady-state
force (fig. S5F). The TTL-overexpressing cells also
underwent significantly larger changes in sarco-
mere length with any given step (fig. S5G), which
indicated increased sarcomere compliance and
which suggested that stiffer sarcomeres in con-
trol cells distribute the length change to other
compliant components in series. As can be sur-
mised from fig. S5, F and G, TTL overexpression
decreased tension across the physiological range
of sarcomere lengths achieved during diastolic
filling (Fig. 4E), which indicated a role for de-
tyrosinated MTs as tensile-resistant elements.
Visual evidence supporting such a relation was
seen in MT networks in a control cell at resting
and stretched length (fig. S5 and Fig. 4C, cyan).
At resting length, there was some inherent slack in
the MT network, whereas the sameMTs became
aaf0659-4 22 APRIL 2016 • VOL 352 ISSUE 6284 sciencemag.org SCIENCE
0 1 2 3 41.40
1.50
1.60
1.70
1.80
Time (s)
0 1 2 3 4
0 1 2 3 4
-8
-6
-4
-2
0
2
4
Time (s)
Ctrl TTL
Ctrl TTL
1.5
1.6
1.7
1.8
1.9
Contraction Relaxation
-6
-4
-2
0
2
4CtrlTTL
CtrlTTL
0.00
0.10
0.20
0.30
Ctrl TTL
0
10
20
30
40
Sa
rco
me
re L
en
gth
(µ
m)
Resting SL (µm)
Shortening time (ms)
∆SL (µm)
∆S
L (
µm
)
Co
ntr
actile
Ve
locity (
µm
/s)
Peak V
elo
city (
µm
/s)
Peak V
elo
city (
µm
/s)
***
***
***
**
**
0.0 1.0 2.0 3.0
0.15
0.20
0.25
0.30
0.35
0.40
Log TTL Fluorescence
Contraction Relaxation
***
**
-6
-4
-2
0
2
4 DMSO
PTL
1
2
3
4
5
6
[Ca
2+] i (
F/F
)
0
Time (s)
Ctrl TTL
Null TTL
0
2
4
6
Peak C
a2+
(F
/F0)
Null TTL
0.00
0.05
0.10
0.15
0.20
Ca
2+
decay T
au (
s)
Fig. 3. Detyrosinated MTs impede contractility. (A) Sarcomere shortening (DSL) during contraction is
increased in TTL-overexpressing myocytes.This change is (B) dose-dependent [P = 1.2 × 10⁻⁵, correlation
coefficient (r2) = 0.23] and (C) associated with a faster shortening time without affecting resting
sarcomere length. (D) First derivative of traces in (A) demonstrate contractile velocities in control and TTL-
overexpressing myocytes. (E) TTL-overexpressing myocytes demonstrate an increase in the peak velocityof
both contraction and relaxation. (F) PTL-treated cells display similar behavior. (G to I) Despite the significant
changes incontractility,nochanges inthepeakorkineticsoftheglobalcalciumtransientwereobservable.
F/F0,thechange in fluorescence fromtheoriginal fluorescencebeforestimulation.Dataarepresentedas
means ±SEM; *P<0.05, **P<0.01, ***P<0.001. Furtherstatistical details are available in tableS2.
RESEARCH | RESEARCH ARTICLE
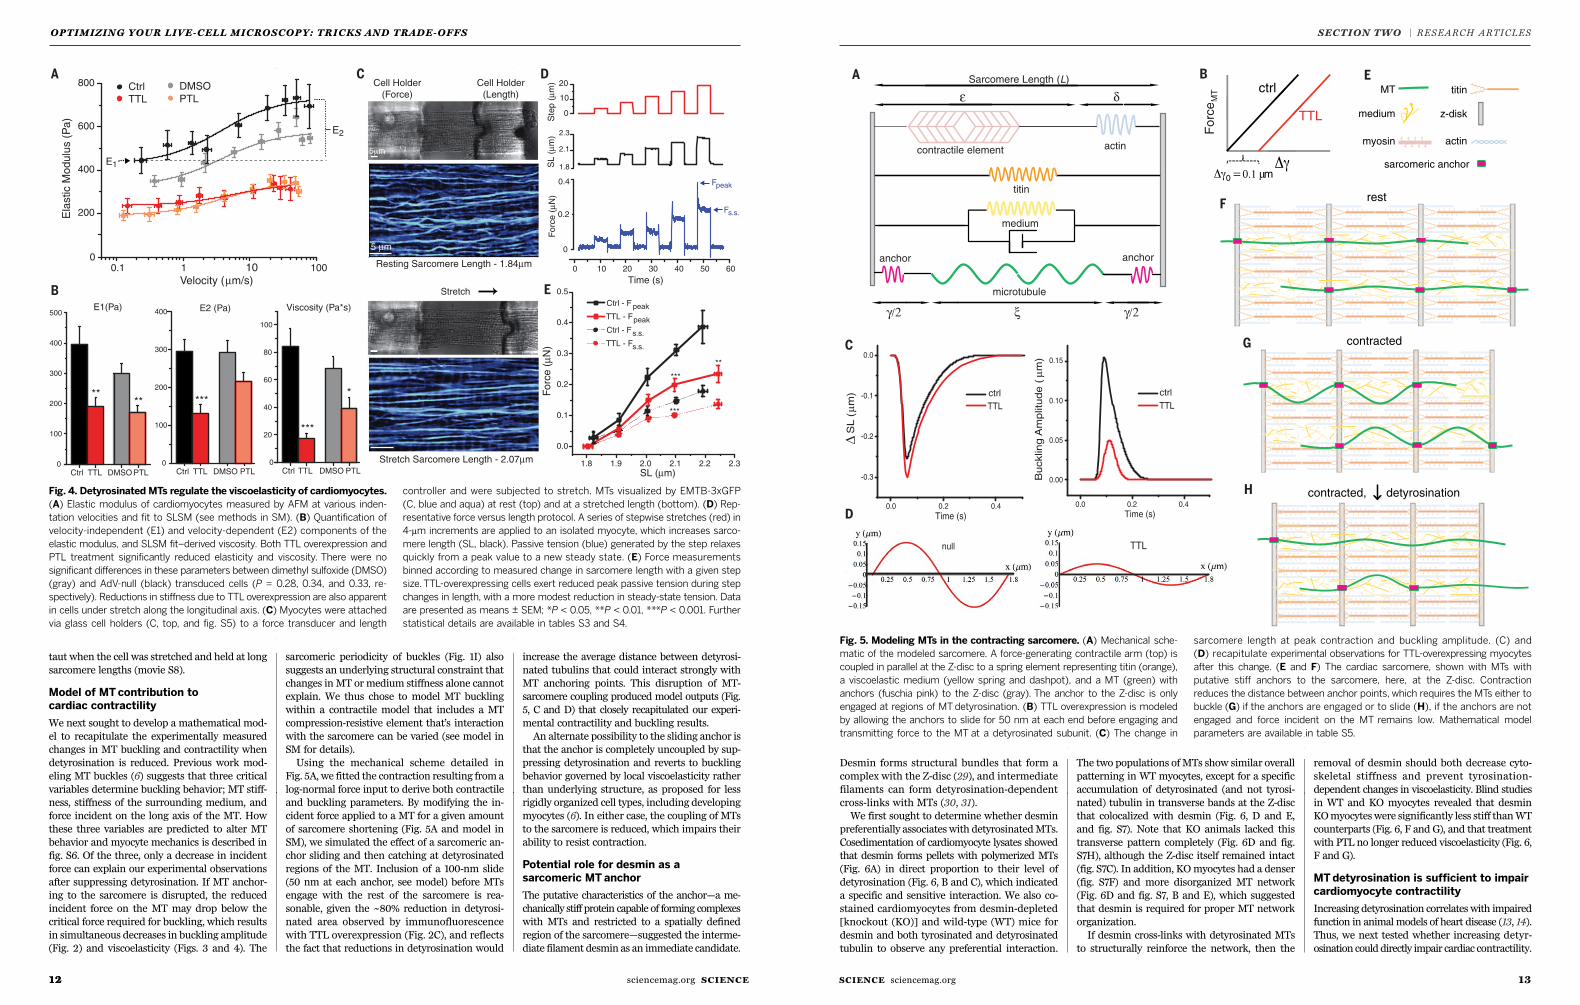
1312 SCIENCE sciencemag.orgsciencemag.org SCIENCE
OPTIMIZING YOUR LIVE-CELL MICROSCOP Y: TRICKS AND TRADE-OFFS SECTION TWO | RESEARCH ARTICLES
12
taut when the cell was stretched and held at long
sarcomere lengths (movie S8).
Model of MTcontribution to
cardiac contractility
We next sought to develop a mathematical mod-
el to recapitulate the experimentally measured
changes in MT buckling and contractility when
detyrosination is reduced. Previous work mod-
eling MT buckles (6) suggests that three critical
variables determine buckling behavior; MT stiff-
ness, stiffness of the surrounding medium, and
force incident on the long axis of the MT. How
these three variables are predicted to alter MT
behavior and myocyte mechanics is described in
fig. S6. Of the three, only a decrease in incident
force can explain our experimental observations
after suppressing detyrosination. If MT anchor-
ing to the sarcomere is disrupted, the reduced
incident force on the MT may drop below the
critical force required for buckling, which results
in simultaneous decreases in buckling amplitude
(Fig. 2) and viscoelasticity (Figs. 3 and 4). The
sarcomeric periodicity of buckles (Fig. 1I) also
suggests an underlying structural constraint that
changes inMT or medium stiffness alone cannot
explain. We thus chose to model MT buckling
within a contractile model that includes a MT
compression-resistive element that’s interaction
with the sarcomere can be varied (see model in
SM for details).
Using the mechanical scheme detailed in
Fig. 5A, we fitted the contraction resulting from a
log-normal force input to derive both contractile
and buckling parameters. By modifying the in-
cident force applied to a MT for a given amount
of sarcomere shortening (Fig. 5A and model in
SM), we simulated the effect of a sarcomeric an-
chor sliding and then catching at detyrosinated
regions of the MT. Inclusion of a 100-nm slide
(50 nm at each anchor, see model) before MTs
engage with the rest of the sarcomere is rea-
sonable, given the ~80% reduction in detyrosi-
nated area observed by immunofluorescence
with TTL overexpression (Fig. 2C), and reflects
the fact that reductions in detyrosination would
increase the average distance between detyrosi-
nated tubulins that could interact strongly with
MT anchoring points. This disruption of MT-
sarcomere coupling produced model outputs (Fig.
5, C and D) that closely recapitulated our experi-
mental contractility and buckling results.
An alternate possibility to the sliding anchor is
that the anchor is completely uncoupled by sup-
pressing detyrosination and reverts to buckling
behavior governed by local viscoelasticity rather
than underlying structure, as proposed for less
rigidly organized cell types, including developing
myocytes (6). In either case, the coupling of MTs
to the sarcomere is reduced, which impairs their
ability to resist contraction.
Potential role for desmin as a
sarcomeric MT anchor
The putative characteristics of the anchor—a me-
chanically stiff protein capable of forming complexes
with MTs and restricted to a spatially defined
region of the sarcomere—suggested the interme-
diate filament desmin as an immediate candidate.
SCIENCE sciencemag.org 22 APRIL 2016 • VOL 352 ISSUE 6284 aaf0659-5
0 10 20 30 40 50 60
0
0
0.4
0.2
Fo
rce
(µ
N)
SL
(µ
m)
Ste
p (
µm
)
Time (s)
2.3
1.8
2.1
10
20
Fo
rce
(µ
N)
***
***
**
Fpeak
Fs.s.
1.8 1.9 2.0 2.1 2.2 2.3
0.0
0.1
0.2
0.3
0.4
0.5
SL (µm)
Ctrl - F peak
TTL - Fpeak
Ctrl - Fs.s.
TTL - Fs.s.
DMSO PTLCtrl
Resting Sarcomere Length - 1.84µm
Stretch Sarcomere Length - 2.07µm
TTL0
100
200
300
400
500
DMSO PTLCtrl TTL0
100
200
300
400
****
***
DMSO PTLCtrl TTL0
20
40
60
80
100
*
***
Cell Holder
(Force)
Cell Holder
(Length)
E2
E1
0.1 1 10 100
200
0
400
600
800
Ela
stic M
odulu
s (
Pa)
Velocity ( µm/s)
Ctrl DMSO
TTL PTL
Viscosity (Pa*s)E2 (Pa)E1(Pa)
Stretch
5 µm
Fig. 4. Detyrosinated MTs regulate the viscoelasticity of cardiomyocytes.
(A) Elastic modulus of cardiomyocytes measured by AFM at various inden-
tation velocities and fit to SLSM (see methods in SM). (B) Quantification of
velocity-independent (E1) and velocity-dependent (E2) components of the
elastic modulus, and SLSM fit–derived viscosity. Both TTL overexpression and
PTL treatment significantly reduced elasticity and viscosity. There were no
significant differences in these parameters between dimethyl sulfoxide (DMSO)
(gray) and AdV-null (black) transduced cells (P = 0.28, 0.34, and 0.33, re-
spectively). Reductions in stiffness due to TTL overexpression are also apparent
in cells under stretch along the longitudinal axis. (C) Myocytes were attached
via glass cell holders (C, top, and fig. S5) to a force transducer and length
controller and were subjected to stretch. MTs visualized by EMTB-3xGFP
(C, blue and aqua) at rest (top) and at a stretched length (bottom). (D) Rep-
resentative force versus length protocol. A series of stepwise stretches (red) in
4-mm increments are applied to an isolated myocyte, which increases sarco-
mere length (SL, black). Passive tension (blue) generated by the step relaxes
quickly from a peak value to a new steady state. (E) Force measurements
binned according to measured change in sarcomere length with a given step
size. TTL-overexpressing cells exert reduced peak passive tension during step
changes in length, with a more modest reduction in steady-state tension. Data
are presented as means ± SEM; *P < 0.05, **P < 0.01, ***P < 0.001. Further
statistical details are available in tables S3 and S4.
RESEARCH | RESEARCH ARTICLE
12 sciencemag.org SCIENCE
TITLE
12
taut when the cell was stretched and held at long
sarcomere lengths (movie S8).
Model of MTcontribution to
cardiac contractility
We next sought to develop a mathematical mod-
el to recapitulate the experimentally measured
changes in MT buckling and contractility when
detyrosination is reduced. Previous work mod-
eling MT buckles (6) suggests that three critical
variables determine buckling behavior; MT stiff-
ness, stiffness of the surrounding medium, and
force incident on the long axis of the MT. How
these three variables are predicted to alter MT
behavior and myocyte mechanics is described in
fig. S6. Of the three, only a decrease in incident
force can explain our experimental observations
after suppressing detyrosination. If MT anchor-
ing to the sarcomere is disrupted, the reduced
incident force on the MT may drop below the
critical force required for buckling, which results
in simultaneous decreases in buckling amplitude
(Fig. 2) and viscoelasticity (Figs. 3 and 4). The
sarcomeric periodicity of buckles (Fig. 1I) also
suggests an underlying structural constraint that
changes inMT or medium stiffness alone cannot
explain. We thus chose to model MT buckling
within a contractile model that includes a MT
compression-resistive element that’s interaction
with the sarcomere can be varied (see model in
SM for details).
Using the mechanical scheme detailed in
Fig. 5A, we fitted the contraction resulting from a
log-normal force input to derive both contractile
and buckling parameters. By modifying the in-
cident force applied to a MT for a given amount
of sarcomere shortening (Fig. 5A and model in
SM), we simulated the effect of a sarcomeric an-
chor sliding and then catching at detyrosinated
regions of the MT. Inclusion of a 100-nm slide
(50 nm at each anchor, see model) before MTs
engage with the rest of the sarcomere is rea-
sonable, given the ~80% reduction in detyrosi-
nated area observed by immunofluorescence
with TTL overexpression (Fig. 2C), and reflects
the fact that reductions in detyrosination would
increase the average distance between detyrosi-
nated tubulins that could interact strongly with
MT anchoring points. This disruption of MT-
sarcomere coupling produced model outputs (Fig.
5, C and D) that closely recapitulated our experi-
mental contractility and buckling results.
An alternate possibility to the sliding anchor is
that the anchor is completely uncoupled by sup-
pressing detyrosination and reverts to buckling
behavior governed by local viscoelasticity rather
than underlying structure, as proposed for less
rigidly organized cell types, including developing
myocytes (6). In either case, the coupling of MTs
to the sarcomere is reduced, which impairs their
ability to resist contraction.
Potential role for desmin as a
sarcomeric MT anchor
The putative characteristics of the anchor—a me-
chanically stiff protein capable of forming complexes
with MTs and restricted to a spatially defined
region of the sarcomere—suggested the interme-
diate filament desmin as an immediate candidate.
Desmin forms structural bundles that form a
complex with the Z-disc (29), and intermediate
filaments can form detyrosination-dependent
cross-links with MTs (30, 31).
We first sought to determine whether desmin
preferentially associates with detyrosinatedMTs.
Cosedimentation of cardiomyocyte lysates showed
that desmin forms pellets with polymerized MTs
(Fig. 6A) in direct proportion to their level of
detyrosination (Fig. 6, B and C), which indicated
a specific and sensitive interaction. We also co-
stained cardiomyocytes from desmin-depleted
[knockout (KO)] and wild-type (WT) mice for
desmin and both tyrosinated and detyrosinated
tubulin to observe any preferential interaction.
The two populations of MTs show similar overall
patterning in WT myocytes, except for a specific
accumulation of detyrosinated (and not tyrosi-
nated) tubulin in transverse bands at the Z-disc
that colocalized with desmin (Fig. 6, D and E,
and fig. S7). Note that KO animals lacked this
transverse pattern completely (Fig. 6D and fig.
S7H), although the Z-disc itself remained intact
(fig. S7C). In addition, KOmyocytes had a denser
(fig. S7F) and more disorganized MT network
(Fig. 6D and fig. S7, B and E), which suggested
that desmin is required for proper MT network
organization.
If desmin cross-links with detyrosinated MTs
to structurally reinforce the network, then the
removal of desmin should both decrease cyto-
skeletal stiffness and prevent tyrosination-
dependent changes in viscoelasticity. Blind studies
in WT and KO myocytes revealed that desmin
KOmyocyteswere significantly less stiff thanWT
counterparts (Fig. 6, F and G), and that treatment
with PTL no longer reduced viscoelasticity (Fig. 6,
F and G).
MTdetyrosination is sufficient to impair
cardiomyocyte contractility
Increasing detyrosination correlates with impaired
function in animalmodels of heart disease (13, 14).
Thus, we next tested whether increasing detyr-
osination coulddirectly impair cardiac contractility.
aaf0659-6 22 APRIL 2016 • VOL 352 ISSUE 6284 sciencemag.org SCIENCE
rest
contracted
contracted, detyrosination 0.0 0.2 0.4
-0.3
-0.2
-0.1
0.0
SL (
µm
)
Time (s)
0.0 0.2 0.4
0.00
0.05
0.10
0.15
Buckling A
mplitu
de (
µm
)
Time (s)
ctrl
Forc
eM
T
ctrl
MT
actin
z-disk
sarcomeric anchor
myosin
medium
titin
contractile element actin
titin
medium
anchor anchor
microtubule
ε δ
ξ
Sarcomere Length (L)
γ/2 γ/2
null
TTL TTL
TTL
0 = 0.1 µm
ctrl
rce
M
TTL
∆
Fig. 5. Modeling MTs in the contracting sarcomere. (A) Mechanical sche-
matic of the modeled sarcomere. A force-generating contractile arm (top) is
coupled in parallel at the Z-disc to a spring element representing titin (orange),
a viscoelastic medium (yellow spring and dashpot), and a MT (green) with
anchors (fuschia pink) to the Z-disc (gray). The anchor to the Z-disc is only
engaged at regions of MTdetyrosination. (B) TTL overexpression is modeled
by allowing the anchors to slide for 50 nm at each end before engaging and
transmitting force to the MT at a detyrosinated subunit. (C) The change in
sarcomere length at peak contraction and buckling amplitude. (C) and
(D) recapitulate experimental observations for TTL-overexpressing myocytes
after this change. (E and F) The cardiac sarcomere, shown with MTs with
putative stiff anchors to the sarcomere, here, at the Z-disc. Contraction
reduces the distance between anchor points, which requires the MTs either to
buckle (G) if the anchors are engaged or to slide (H), if the anchors are not
engaged and force incident on the MT remains low. Mathematical model
parameters are available in table S5.
RESEARCH | RESEARCH ARTICLE
13SCIENCE sciencemag.org
SECTION TWO | RESEARCH ARTICLES
Desmin forms structural bundles that form a
complex with the Z-disc (29), and intermediate
filaments can form detyrosination-dependent
cross-links with MTs (30, 31).
We first sought to determine whether desmin
preferentially associates with detyrosinatedMTs.
Cosedimentation of cardiomyocyte lysates showed
that desmin forms pellets with polymerized MTs
(Fig. 6A) in direct proportion to their level of
detyrosination (Fig. 6, B and C), which indicated
a specific and sensitive interaction. We also co-
stained cardiomyocytes from desmin-depleted
[knockout (KO)] and wild-type (WT) mice for
desmin and both tyrosinated and detyrosinated
tubulin to observe any preferential interaction.
The two populations of MTs show similar overall
patterning in WT myocytes, except for a specific
accumulation of detyrosinated (and not tyrosi-
nated) tubulin in transverse bands at the Z-disc
that colocalized with desmin (Fig. 6, D and E,
and fig. S7). Note that KO animals lacked this
transverse pattern completely (Fig. 6D and fig.
S7H), although the Z-disc itself remained intact
(fig. S7C). In addition, KOmyocytes had a denser
(fig. S7F) and more disorganized MT network
(Fig. 6D and fig. S7, B and E), which suggested
that desmin is required for proper MT network
organization.
If desmin cross-links with detyrosinated MTs
to structurally reinforce the network, then the
removal of desmin should both decrease cyto-
skeletal stiffness and prevent tyrosination-
dependent changes in viscoelasticity. Blind studies
in WT and KO myocytes revealed that desmin
KOmyocyteswere significantly less stiff thanWT
counterparts (Fig. 6, F and G), and that treatment
with PTL no longer reduced viscoelasticity (Fig. 6,
F and G).
MTdetyrosination is sufficient to impair
cardiomyocyte contractility
Increasing detyrosination correlates with impaired
function in animalmodels of heart disease (13, 14).
Thus, we next tested whether increasing detyr-
osination coulddirectly impair cardiac contractility.
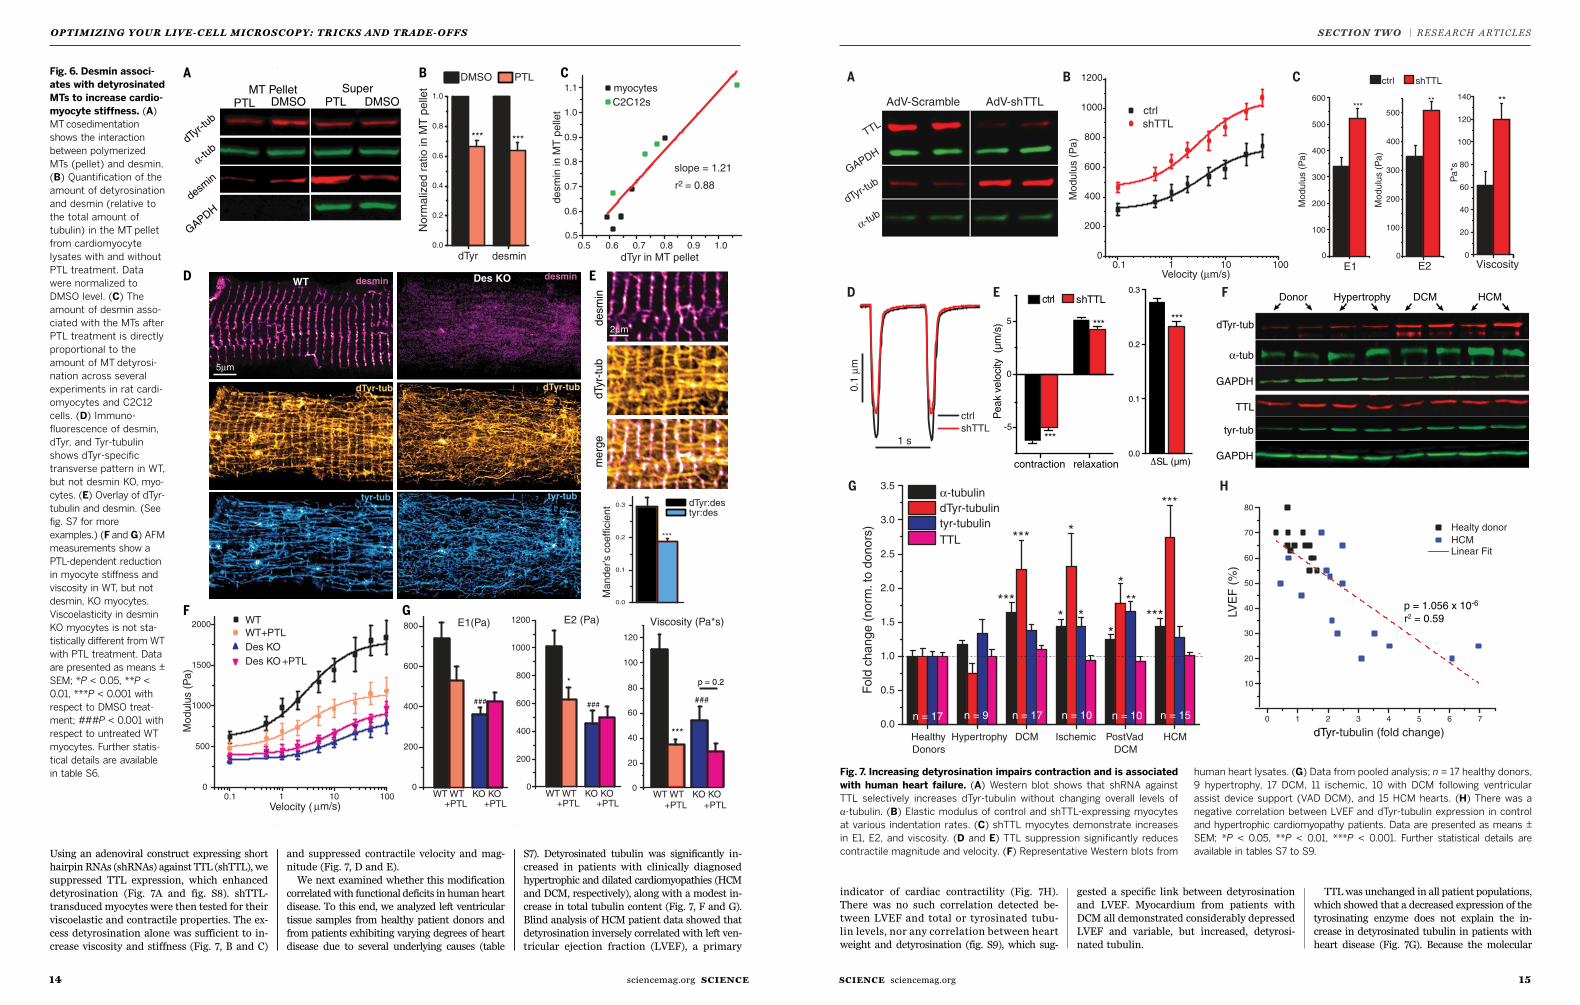
14 sciencemag.org SCIENCE
OPTIMIZING YOUR LIVE-CELL MICROSCOP Y: TRICKS AND TRADE-OFFS
15SCIENCE sciencemag.org
SECTION TWO | RESEARCH ARTICLES
Using an adenoviral construct expressing short
hairpin RNAs (shRNAs) against TTL (shTTL), we
suppressed TTL expression, which enhanced
detyrosination (Fig. 7A and fig. S8). shTTL-
transduced myocytes were then tested for their
viscoelastic and contractile properties. The ex-
cess detyrosination alone was sufficient to in-
crease viscosity and stiffness (Fig. 7, B and C)
and suppressed contractile velocity and mag-
nitude (Fig. 7, D and E).
We next examined whether this modification
correlatedwith functional deficits in human heart
disease. To this end, we analyzed left ventricular
tissue samples from healthy patient donors and
from patients exhibiting varying degrees of heart
disease due to several underlying causes (table
S7). Detyrosinated tubulin was significantly in-
creased in patients with clinically diagnosed
hypertrophic and dilated cardiomyopathies (HCM
and DCM, respectively), along with a modest in-
crease in total tubulin content (Fig. 7, F and G).
Blind analysis of HCM patient data showed that
detyrosination inversely correlated with left ven-
tricular ejection fraction (LVEF), a primary
SCIENCE sciencemag.org 22 APRIL 2016 • VOL 352 ISSUE 6284 aaf0659-7
Fig. 6. Desmin associ-
ates with detyrosinated
MTs to increase cardio-
myocyte stiffness. (A)
MTcosedimentation
shows the interaction
between polymerized
MTs (pellet) and desmin.
(B) Quantification of the
amount of detyrosination
and desmin (relative to
the total amount of
tubulin) in the MT pellet
from cardiomyocyte
lysates with and without
PTL treatment. Data
were normalized to
DMSO level. (C) The
amount of desmin asso-
ciated with the MTs after
PTL treatment is directly
proportional to the
amount of MT detyrosi-
nation across several
experiments in rat cardi-
omyocytes and C2C12
cells. (D) Immuno-
fluorescence of desmin,
dTyr, and Tyr-tubulin
shows dTyr-specific
transverse pattern in WT,
but not desmin KO, myo-
cytes. (E) Overlay of dTyr-
tubulin and desmin. (See
fig. S7 for more
examples.) (F and G) AFM
measurements show a
PTL-dependent reduction
in myocyte stiffness and
viscosity in WT, but not
desmin, KO myocytes.
Viscoelasticity in desmin
KO myocytes is not sta-
tistically different fromWT
with PTL treatment. Data
are presented as means ±
SEM; *P < 0.05, **P <
0.01, ***P < 0.001 with
respect to DMSO treat-
ment; ###P < 0.001 with
respect to untreated WT
myocytes. Further statis-
tical details are available
in table S6.
tyr-tub
desmin
de
sm
in
desmin
dTyr-tub dTyr-tub
tyr-tub
WT Des KO
0.1 1 10 1000
500
1000
1500
2000 WT
WT KO KO
WT+PTL
WT
Des KO
Des KO +PTL
Modulu
s (
Pa)
Velocity ( µm/s)
0
200
400
600
800
0
20
40
60
80
100
120
Viscosity (Pa*s)
0
200
400
600
800
1000
1200 E2 (Pa)E1(Pa)
*
###### ###
***
p = 0.2
α-tub
dTyr-t
ub
GAPDH
desmin
MT Pellet SuperDMSOPTL DMSOPTL
DMSO
PTL
D
+PTL +PTL
WT KO KOWT+PTL +PTL
WT KO KOWT+PTL +PTL
0.0
0.1
0.2
0.3
Ma
nd
er’s c
oe
ffic
ien
t dTyr:des tyr:des
***
dTyr-
tub
me
rge
0.50.5
0.6 0.7 0.8 0.9 1.0
0.6
0.7
0.8
0.9
1.0
1.1 myocytes
C2C12s
slope = 1.21
dTyr in MT pellet
desm
in in M
T p
elle
t
r2 = 0.88
desmindTyr0.0
0.2
0.4
0.6
0.8
1.0
No
rma
lize
d r
atio
in
MT
pe
llet
*** ***
5µm
2µm
RESEARCH | RESEARCH ARTICLE
indicator of cardiac contractility (Fig. 7H).
There was no such correlation detected be-
tween LVEF and total or tyrosinated tubu-
lin levels, nor any correlation between heart
weight and detyrosination (fig. S9), which sug-
gested a specific link between detyrosination
and LVEF. Myocardium from patients with
DCM all demonstrated considerably depressed
LVEF and variable, but increased, detyrosi-
nated tubulin.
TTLwas unchanged in all patient populations,
which showed that a decreased expression of the
tyrosinating enzyme does not explain the in-
crease in detyrosinated tubulin in patients with
heart disease (Fig. 7G). Because the molecular
aaf0659-8 22 APRIL 2016 • VOL 352 ISSUE 6284 sciencemag.org SCIENCE
dTyr-tub
Donor Hypertrophy DCM HCM
α-tub
GAPDH
TTL
tyr-tub
GAPDH
p = 1.056 x 10⁻⁶
r2 = 0.59
0 1 2 3 4 5 6 7
10
20
30
40
50
60
70
80
HCM
Healty donor
Linear Fit
LVE
F (
%)
dTyr-tubulin (fold change)Healthy
Donors
Hypertrophy DCM Ischemic PostVad
DCM
HCM
0.0
0.5
1.0
1.5
2.0
2.5
3.0
3.5
**
*
****
**
Fold
change (
norm
. to
donors
)
*
***
***
α-tubulin
dTyr-tubulin
tyr-tubulin
TTL ***
n = 17 n = 17 n = 15n = 10n = 10n = 9
0.1 1 10 1000
200
400
600
800
1000
1200
Modulu
s (
Pa)
ctrl
shTTL
ViscosityVelocity (µm/s)
0
20
40
60
80
100
120
140
ctrl shTTL
E10
100
200
300
400
500
600
Mo
du
lus (
Pa
)
E20
100
200
300
400
500
Mo
du
lus (
Pa
)
Pa
*s
contraction relaxation
-5
0
5
Pe
ak v
elo
city
(µ
m/s
)
ctrl shTTL
***
******
0.0
0.1
0.2
0.3
SL (µm)
** *****
1 s
0.1
µm
ctrl
shTTL
AdV-Scramble AdV-shTTL
dTyr-tub
α-tub
TTL
GAPDH
A B C
D E F
G H
Fig. 7. Increasing detyrosination impairs contraction and is associated
with human heart failure. (A) Western blot shows that shRNA against
TTL selectively increases dTyr-tubulin without changing overall levels of
a-tubulin. (B) Elastic modulus of control and shTTL-expressing myocytes
at various indentation rates. (C) shTTL myocytes demonstrate increases
in E1, E2, and viscosity. (D and E) TTL suppression significantly reduces
contractile magnitude and velocity. (F) Representative Western blots from
human heart lysates. (G) Data from pooled analysis; n = 17 healthy donors,
9 hypertrophy, 17 DCM, 11 ischemic, 10 with DCM following ventricular
assist device support (VAD DCM), and 15 HCM hearts. (H) There was a
negative correlation between LVEF and dTyr-tubulin expression in control
and hypertrophic cardiomyopathy patients. Data are presented as means ±
SEM; *P < 0.05, **P < 0.01, ***P < 0.001. Further statistical details are
available in tables S7 to S9.
RESEARCH | RESEARCH ARTICLE
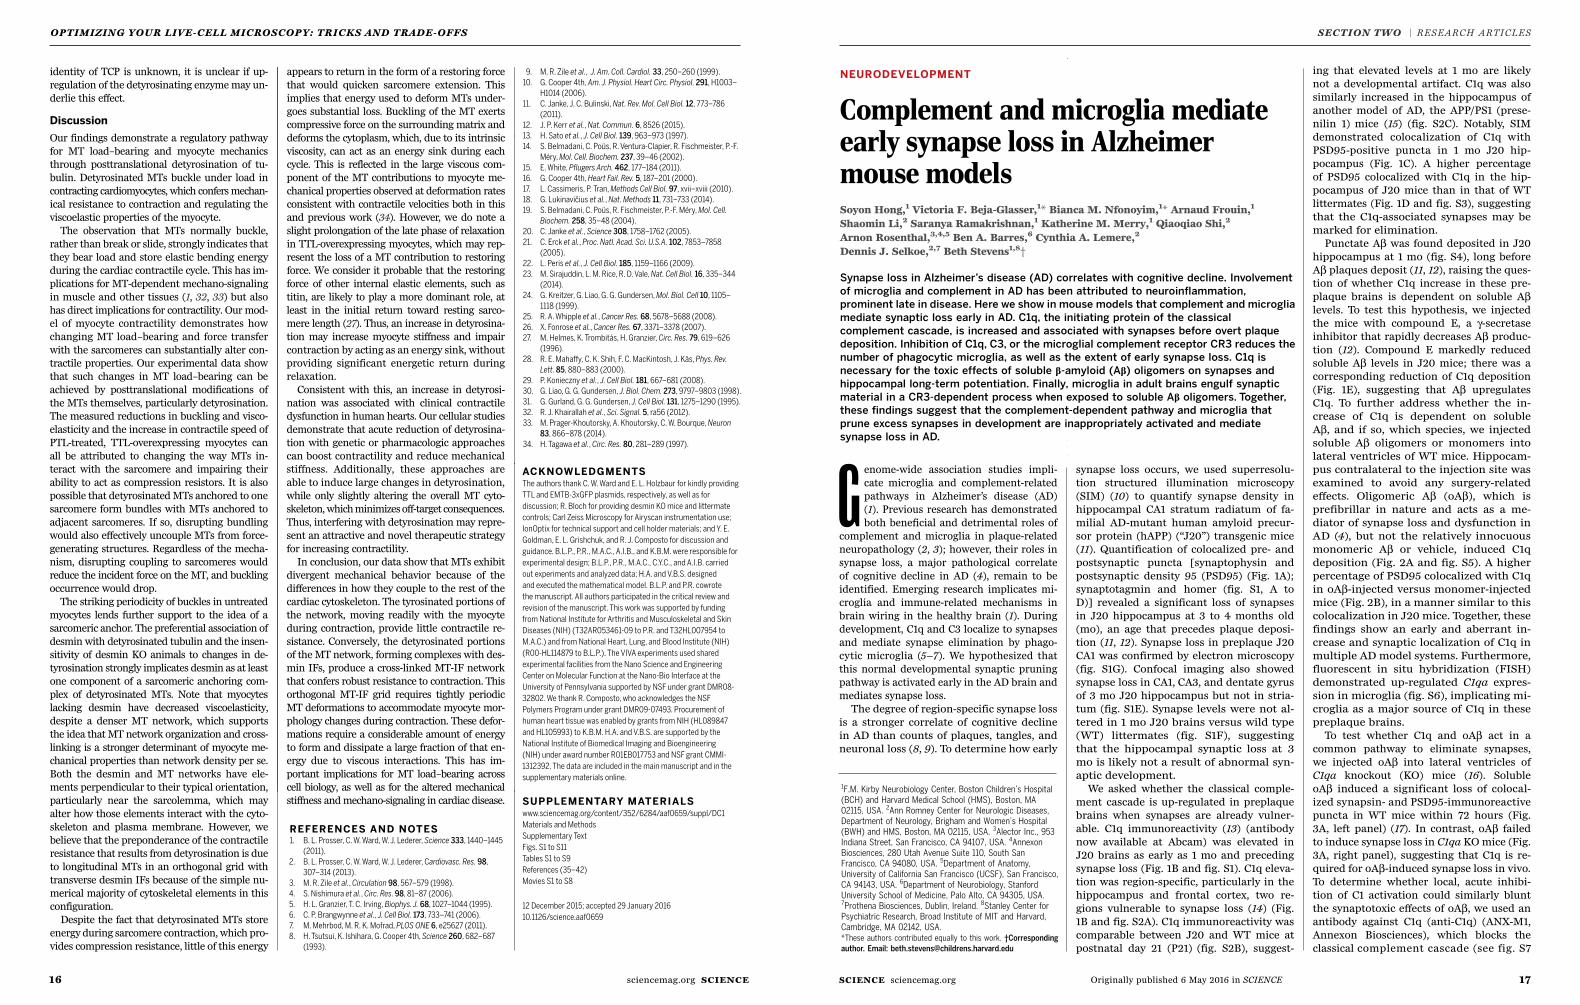
1716 SCIENCE sciencemag.orgsciencemag.org SCIENCE
OPTIMIZING YOUR LIVE-CELL MICROSCOP Y: TRICKS AND TRADE-OFFS SECTION TWO | RESEARCH ARTICLES
16 sciencemag.org SCIENCE
TITLE
identity of TCP is unknown, it is unclear if up-
regulation of the detyrosinating enzymemay un-
derlie this effect.
Discussion
Our findings demonstrate a regulatory pathway
for MT load–bearing and myocyte mechanics
through posttranslational detyrosination of tu-
bulin. Detyrosinated MTs buckle under load in
contracting cardiomyocytes, which confersmechan-
ical resistance to contraction and regulating the
viscoelastic properties of the myocyte.
The observation that MTs normally buckle,
rather than break or slide, strongly indicates that
they bear load and store elastic bending energy
during the cardiac contractile cycle. This has im-
plications for MT-dependent mechano-signaling
in muscle and other tissues (1, 32, 33) but also
has direct implications for contractility. Our mod-
el of myocyte contractility demonstrates how
changing MT load–bearing and force transfer
with the sarcomeres can substantially alter con-
tractile properties. Our experimental data show
that such changes in MT load–bearing can be
achieved by posttranslational modifications of
the MTs themselves, particularly detyrosination.
The measured reductions in buckling and visco-
elasticity and the increase in contractile speed of
PTL-treated, TTL-overexpressing myocytes can
all be attributed to changing the way MTs in-
teract with the sarcomere and impairing their
ability to act as compression resistors. It is also
possible that detyrosinatedMTs anchored to one
sarcomere form bundles with MTs anchored to
adjacent sarcomeres. If so, disrupting bundling
would also effectively uncouple MTs from force-
generating structures. Regardless of the mecha-
nism, disrupting coupling to sarcomeres would
reduce the incident force on the MT, and buckling
occurrence would drop.
The striking periodicity of buckles in untreated
myocytes lends further support to the idea of a
sarcomeric anchor. The preferential association of
desmin with detyrosinated tubulin and the insen-
sitivity of desmin KO animals to changes in de-
tyrosination strongly implicates desmin as at least
one component of a sarcomeric anchoring com-
plex of detyrosinated MTs. Note that myocytes
lacking desmin have decreased viscoelasticity,
despite a denser MT network, which supports
the idea that MT network organization and cross-
linking is a stronger determinant of myocyte me-
chanical properties than network density per se.
Both the desmin and MT networks have ele-
ments perpendicular to their typical orientation,
particularly near the sarcolemma, which may
alter how those elements interact with the cyto-
skeleton and plasma membrane. However, we
believe that the preponderance of the contractile
resistance that results from detyrosination is due
to longitudinal MTs in an orthogonal grid with
transverse desmin IFs because of the simple nu-
merical majority of cytoskeletal elements in this
configuration.
Despite the fact that detyrosinated MTs store
energy during sarcomere contraction, which pro-
vides compression resistance, little of this energy
appears to return in the form of a restoring force
that would quicken sarcomere extension. This
implies that energy used to deform MTs under-
goes substantial loss. Buckling of the MT exerts
compressive force on the surrounding matrix and
deforms the cytoplasm, which, due to its intrinsic
viscosity, can act as an energy sink during each
cycle. This is reflected in the large viscous com-
ponent of the MT contributions to myocyte me-
chanical properties observed at deformation rates
consistent with contractile velocities both in this
and previous work (34). However, we do note a
slight prolongation of the late phase of relaxation
in TTL-overexpressing myocytes, which may rep-
resent the loss of a MT contribution to restoring
force. We consider it probable that the restoring
force of other internal elastic elements, such as
titin, are likely to play a more dominant role, at
least in the initial return toward resting sarco-
mere length (27). Thus, an increase in detyrosina-
tion may increase myocyte stiffness and impair
contraction by acting as an energy sink, without
providing significant energetic return during
relaxation.
Consistent with this, an increase in detyrosi-
nation was associated with clinical contractile
dysfunction in human hearts. Our cellular studies
demonstrate that acute reduction of detyrosina-
tion with genetic or pharmacologic approaches
can boost contractility and reduce mechanical
stiffness. Additionally, these approaches are
able to induce large changes in detyrosination,
while only slightly altering the overall MT cyto-
skeleton,whichminimizesoff-target consequences.
Thus, interfering with detyrosination may repre-
sent an attractive and novel therapeutic strategy
for increasing contractility.
In conclusion, our data show that MTs exhibit
divergent mechanical behavior because of the
differences in how they couple to the rest of the
cardiac cytoskeleton. The tyrosinated portions of
the network, moving readily with the myocyte
during contraction, provide little contractile re-
sistance. Conversely, the detyrosinated portions
of the MT network, forming complexes with des-
min IFs, produce a cross-linked MT-IF network
that confers robust resistance to contraction. This
orthogonal MT-IF grid requires tightly periodic
MT deformations to accommodate myocyte mor-
phology changes during contraction. These defor-
mations require a considerable amount of energy
to form and dissipate a large fraction of that en-
ergy due to viscous interactions. This has im-
portant implications for MT load–bearing across
cell biology, as well as for the altered mechanical
stiffness andmechano-signaling in cardiac disease.
REFERENCES AND NOTES
1. B. L. Prosser, C. W. Ward, W. J. Lederer, X-ROS signaling: Rapid
mechano-chemo transduction in heart. Science 333,
1440–1445 (2011). doi: 10.1126/science.1202768;
pmid: 21903813
2. B. L. Prosser, C. W. Ward, W. J. Lederer, X-ROS signaling is
enhanced and graded by cyclic cardiomyocyte stretch.
Cardiovasc. Res. 98, 307–314 (2013). doi: 10.1093/cvr/cvt066
3. M. R. Zile et al., Constitutive properties of adult mammalian
cardiac muscle cells. Circulation 98, 567–579 (1998).
doi: 10.1161/01.CIR.98.6.567; pmid: 9714115
REFERENCES AND NOTES 1. B. L. Prosser, C. W. Ward, W. J. Lederer, Science 333, 1440–1445
(2011). 2. B. L. Prosser, C. W. Ward, W. J. Lederer, Cardiovasc. Res. 98,
307–314 (2013). 3. M. R. Zile et al., Circulation 98, 567–579 (1998). 4. S. Nishimura et al., Circ. Res. 98, 81–87 (2006). 5. H. L. Granzier, T. C. Irving, Biophys. J. 68, 1027–1044 (1995). 6. C. P. Brangwynne et al., J. Cell Biol. 173, 733–741 (2006). 7. M. Mehrbod, M. R. K. Mofrad, PLOS ONE 6, e25627 (2011). 8. H. Tsutsui, K. Ishihara, G. Cooper 4th, Science 260, 682–687
(1993).
9. M. R. Zile et al., J. Am. Coll. Cardiol. 33, 250–260 (1999). 10. G. Cooper 4th, Am. J. Physiol. Heart Circ. Physiol. 291, H1003–
H1014 (2006). 11. C. Janke, J. C. Bulinski, Nat. Rev. Mol. Cell Biol. 12, 773–786
(2011). 12. J. P. Kerr et al., Nat. Commun. 6, 8526 (2015). 13. H. Sato et al., J. Cell Biol. 139, 963–973 (1997).14. S. Belmadani, C. Poüs, R. Ventura-Clapier, R. Fischmeister, P.-F.
Méry, Mol. Cell. Biochem. 237, 39–46 (2002).15. E. White, P�ugers Arch. 462, 177–184 (2011). 16. G. Cooper 4th, Heart Fail. Rev. 5, 187–201 (2000). 17. L. Cassimeris, P. Tran, Methods Cell Biol. 97, xvii–xviii (2010).18. G. Lukinavičius et al., Nat. Methods 11, 731–733 (2014).19. S. Belmadani, C. Poüs, R. Fischmeister, P.-F. Méry, Mol. Cell.
Biochem. 258, 35–48 (2004).20. C. Janke et al., Science 308, 1758–1762 (2005). 21. C. Erck et al., Proc. Natl. Acad. Sci. U.S.A. 102, 7853–7858
(2005). 22. L. Peris et al., J. Cell Biol. 185, 1159–1166 (2009). 23. M. Sirajuddin, L. M. Rice, R. D. Vale, Nat. Cell Biol. 16, 335–344
(2014). 24. G. Kreitzer, G. Liao, G. G. Gundersen, Mol. Biol. Cell 10, 1105–
1118 (1999). 25. R. A. Whipple et al., Cancer Res. 68, 5678–5688 (2008). 26. X. Fonrose et al., Cancer Res. 67, 3371–3378 (2007).27. M. Helmes, K. Trombitás, H. Granzier, Circ. Res. 79, 619–626
(1996).28. R. E. Maha£y, C. K. Shih, F. C. MacKintosh, J. Käs, Phys. Rev.
Lett. 85, 880–883 (2000).29. P. Konieczny et al., J. Cell Biol. 181, 667–681 (2008).30. G. Liao, G. G. Gundersen, J. Biol. Chem. 273, 9797–9803 (1998).31. G. Gurland, G. G. Gundersen, J. Cell Biol. 131, 1275–1290 (1995).32. R. J. Khairallah et al., Sci. Signal. 5, ra56 (2012).33. M. Prager-Khoutorsky, A. Khoutorsky, C. W. Bourque, Neuron
83, 866–878 (2014). 34. H. Tagawa et al., Circ. Res. 80, 281–289 (1997).
ACKNOWLEDGMENTSThe authors thank C. W. Ward and E. L. Holzbaur for kindly providing TTL and EMTB-3xGFP plasmids, respectively, as well as for discussion; R. Bloch for providing desmin KO mice and littermate controls; Carl Zeiss Microscopy for Airyscan instrumentation use; IonOptix for technical support and cell holder materials; and Y. E. Goldman, E. L. Grishchuk, and R. J. Composto for discussion and guidance. B.L.P., P.R., M.A.C., A.I.B., and K.B.M. were responsible for experimental design; B.L.P., P.R., M.A.C., C.Y.C., and A.I.B. carried out experiments and analyzed data; H.A. and V.B.S. designed and executed the mathematical model. B.L.P. and P.R. cowrote the manuscript. All authors participated in the critical review and revision of the manuscript. This work was supported by funding from National Institute for Arthritis and Musculoskeletal and Skin Diseases (NIH) (T32AR053461-09 to P.R. and T32HL007954 to M.A.C.) and from National Heart, Lung, and Blood Institute (NIH) (R00-HL114879 to B.L.P.). The VIVA experiments used shared experimental facilities from the Nano Science and Engineering Center on Molecular Function at the Nano-Bio Interface at the University of Pennsylvania supported by NSF under grant DMR08-32802. We thank R. Composto, who acknowledges the NSF Polymers Program under grant DMR09-07493. Procurement of human heart tissue was enabled by grants from NIH (HL089847 and HL105993) to K.B.M. H.A. and V.B.S. are supported by the National Institute of Biomedical Imaging and Bioengineering (NIH) under award number R01EB017753 and NSF grant CMMI-1312392. The data are included in the main manuscript and in the supplementary materials online.
SUPPLEMENTARY MATERIALS www.sciencemag.org/content/352/6284/aaf0659/suppl/DC1 Materials and Methods Supplementary TextFigs. S1 to S11Tables S1 to S9References (35–42)Movies S1 to S8
12 December 2015; accepted 29 January 201610.1126/science.aaf0659
Genome-wide association studies impli-cate microglia and complement-related pathways in Alzheimer’s disease (AD) (1). Previous research has demonstrated both beneficial and detrimental roles of
complement and microglia in plaque-related neuropathology (2, 3); however, their roles in synapse loss, a major pathological correlate of cognitive decline in AD (4), remain to be identified. Emerging research implicates mi-croglia and immune-related mechanisms in brain wiring in the healthy brain (1). During development, C1q and C3 localize to synapses and mediate synapse elimination by phago-cytic microglia (5–7). We hypothesized that this normal developmental synaptic pruning pathway is activated early in the AD brain and mediates synapse loss.
The degree of region-specific synapse loss is a stronger correlate of cognitive decline in AD than counts of plaques, tangles, and neuronal loss (8, 9). To determine how early
ing that elevated levels at 1 mo are likely not a developmental artifact. C1q was also similarly increased in the hippocampus ofanother model of AD, the APP/PS1 (prese-nilin 1) mice (15) (fig. S2C). Notably, SIM demonstrated colocalization of C1q with PSD95-positive puncta in 1 mo J20 hip-pocampus (Fig. 1C). A higher percentage of PSD95 colocalized with C1q in the hip-pocampus of J20 mice than in that of WT littermates (Fig. 1D and fig. S3), suggesting that the C1q-associated synapses may be marked for elimination.
Punctate Aβ was found deposited in J20 hippocampus at 1 mo (fig. S4), long before Aβ plaques deposit (11, 12), raising the ques-tion of whether C1q increase in these pre-plaque brains is dependent on soluble Aβlevels. To test this hypothesis, we injected the mice with compound E, a γ-secretase inhibitor that rapidly decreases Aβ produc-tion (12). Compound E markedly reduced soluble Aβ levels in J20 mice; there was a corresponding reduction of C1q deposition(Fig. 1E), suggesting that Aβ upregulates C1q. To further address whether the in-crease of C1q is dependent on soluble Aβ, and if so, which species, we injected soluble Aβ oligomers or monomers into lateral ventricles of WT mice. Hippocam-pus contralateral to the injection site was examined to avoid any surgery-related effects. Oligomeric Aβ (oAβ), which is prefibrillar in nature and acts as a me-diator of synapse loss and dysfunction in AD (4), but not the relatively innocuous monomeric Aβ or vehicle, induced C1q deposition (Fig. 2A and fig. S5). A higherpercentage of PSD95 colocalized with C1q in oAβ-injected versus monomer-injected mice (Fig. 2B), in a manner similar to this colocalization in J20 mice. Together, these findings show an early and aberrant in-crease and synaptic localization of C1q in multiple AD model systems. Furthermore, fluorescent in situ hybridization (FISH)demonstrated up-regulated C1qa expres-sion in microglia (fig. S6), implicating mi-croglia as a major source of C1q in these preplaque brains.
To test whether C1q and oAβ act in a common pathway to eliminate synapses, we injected oAβ into lateral ventricles of C1qa knockout (KO) mice (16). Soluble oAβ induced a significant loss of colocal-ized synapsin- and PSD95-immunoreactivepuncta in WT mice within 72 hours (Fig. 3A, left panel) (17). In contrast, oAβ failed to induce synapse loss in C1qa KO mice (Fig. 3A, right panel), suggesting that C1q is re-quired for oAβ-induced synapse loss in vivo. To determine whether local, acute inhibi-tion of C1 activation could similarly blunt the synaptotoxic effects of oAβ, we used an antibody against C1q (anti-C1q) (ANX-M1,Annexon Biosciences), which blocks the classical complement cascade (see fig. S7
2. B. Bosworth, K. Zhang, “Evidence of Increasing Differential
Mortality: A Comparison of the HRS and SIPP,” Center for
Retirement Research at Boston College Working Paper 2015-13
(2015).
3. R. Chetty et al., JAMA 10.1001/jama.2016.4226 (2016).
4. National Research Council, Committee on the Long-Run
Macroeconomic Effects of the Aging U.S. Population, “The
Growing Gap in Life Expectancy by Income: Implications for
Federal Programs and Policy Responses” (2015).
5. J. Pijoan-Mas, J. V. Ríos-Rull, Demography 51, 2075–2102
(2014).
6. H. Waldron, Soc. Secur. Bull. 67, 1–28 (2007).
7. H. Waldron, Soc. Secur. Bull. 73, 1–37 (2013).
8. J. Wilmoth, C. Boe, M. Barbieri, in International Differences
in Mortality at Older Ages: Dimensions and Sources,
E. M. Crimmins, S. H. Preston, B. Cohen, Eds.
(National Academies Press, Washington, DC, 2011),
pp. 337–372.
9. G. K. Singh, M. Siahpush, Int. J. Epidemiol. 35, 969–979
(2006).
10. M. Ezzati, A. B. Friedman, S. C. Kulkarni, C. J. Murray, PLOS
Med. 5, e66 (2008).
11. C. J. Murray et al., PLOS Med. 3, e260 (2006).
12. H. Wang, A. E. Schumacher, C. E. Levitz, A. H. Mokdad,
C. J. Murray, Popul. Health Metr. 11, 8 (2013).
13. J. S. Olshansky et al., Health Aff. 31, 1803–1813 (2011).
14. E. R. Meara, S. Richards, D. M. Cutler, Health Aff. 27, 350–360
(2008).
15. D. M. Cutler, F. Lange, E. Meara, S. Richards-Shubik,
C. J. Ruhm, J. Health Econ. 30, 1174–1187 (2011).
16. J. K. Montez, L. F. Berkman, Am. J. Public Health 104, e82–e90
(2014).
17. Human Mortality Database; www.mortality.org.
18. D. D. Reidpath, P. Allotey, J. Epidemiol. Community Health 57,
344–346 (2003).
19. A. Case, A. Deaton, Proc. Natl. Acad. Sci. U.S.A. 112,
15078–15083 (2015).
20. J. Bound, A. Geronimus, J. Rodriguez, T. Waidman, “The
Implications of Differential Trends in Mortality for Social
Security Policy,” University of Michigan Retirement Research
Center Working Paper 2014-314 (2014).
21. J. B. Dowd, A. Hamoudi, Int. J. Epidemiol. 43, 983–988
(2014).
22. T. Goldring, F. Lange, S. Richards-Shubik, “Testing for Changes
in the SES-Mortality Gradient When the Distribution of
Education Changes Too,” National Bureau of Economic
Research Working Paper 20993 (2015).
23. A. S. Hendi, Int. J. Epidemiol. 44, 946–955 (2015).
24. A. Aizer, J. Currie, Science 344, 856–861 (2014).
25. D. Brown, A. Kowalski, I. Lurie, “Medicaid as an Investment in
Children: What Is the Long-Term Impact on Tax Receipts?”
National Bureau of Economic Research Working Paper 20835
(2015).
26. S. Cahodes, S. Kleiner, M. F. Lovenhem, M. Grossman,
“Effect of Child Health Insurance Access on Schooling,”
National Bureau of Economic Research Working Paper
20178 (2014).
27. S. Miller, L. R. Wherry, “The Long-Term Health Effects of Early
Life Medicaid Coverage,” Social Science Research Network
Working Paper 2466691 (2015).
28. L. R. Wherry, B. Meyer, “Saving Teens: Using and Eligibility
Discontinuity to Estimate the Effects of Medicaid Eligibility,”
National Bureau of Economic Research Working Paper 18309
(2013).
29. L. R. Wherry, S. Miller, R. Kaestner, B. D. Meyer, “Childhood
Medicaid Coverage and Later Life Health Care Utilization,”
National Bureau of Economic Research Working Paper 20929
(2015).
30. J. Ludwig, D. L. Miller, Q. J. Econ. 122, 159–208 (2007).
31. H. Hoynes, D. Whitmore-Schanzanbach, D. Almond,
“Long Run Impacts of Childhood Access to the Safety Net,”
National Bureau of Economic Research Working Paper 18535
(2012).
32. A. Isen, M. Rossin-Slater, R. Walker, “Every Breath You Take
Every Dollar You’ll Make: The Long-Term Consequences of
the Clean Air Act of 1970,” National Bureau of Economic
Research Working Paper 19858 (2014).
33. A. Fenelon, S. H. Preston, Demography 49, 797–818
(2012).
34. D. de Walque, J. Hum. Resour. 45, 682–717 (2010).
35. C. E. Finch, E. M. Crimmins, Science 305, 1736–1739
(2004).
ACKNOWLEDGMENTS
We thank M. Barbieri, A. Case, A. Deaton, J. Goldstein,
I. Kuziemko, R. Lee, and K. Wachter, as well as seminar
participants at Berkeley, the Chicago Federal Reserve,
Fundação Getúlio Vargas São Paulo, Bonn University,
University of Munich, Princeton University, ETH Zurich,
and the University of Zurich for comments. Supported by
Princeton Center for Translational Research on Aging
grant 2P30AG024928. Data and code are available at
http://dx.doi.org/10.7910/DVN/C2VYNM.
SUPPLEMENTARY MATERIALS
www.sciencemag.org/content/352/6286/708/suppl/DC1
Materials and Methods
Figs. S1 to S8
Tables S1 to S4
References (36–38)
22 December 2015; accepted 17 March 2016
Published online 21 April 2016
10.1126/science.aaf1437
NEURODEVELOPMENT
Complement and microglia mediateearly synapse loss in Alzheimermouse modelsSoyon Hong,1 Victoria F. Beja-Glasser,1* Bianca M. Nfonoyim,1* Arnaud Frouin,1
Shaomin Li,2 Saranya Ramakrishnan,1 Katherine M. Merry,1 Qiaoqiao Shi,2
Arnon Rosenthal,3,4,5 Ben A. Barres,6 Cynthia A. Lemere,2
Dennis J. Selkoe,2,7 Beth Stevens1,8†
Synapse loss in Alzheimer’s disease (AD) correlates with cognitive decline. Involvement
of microglia and complement in AD has been attributed to neuroinflammation,
prominent late in disease. Here we show in mouse models that complement and microglia
mediate synaptic loss early in AD. C1q, the initiating protein of the classical
complement cascade, is increased and associated with synapses before overt plaque
deposition. Inhibition of C1q, C3, or the microglial complement receptor CR3 reduces the
number of phagocytic microglia, as well as the extent of early synapse loss. C1q is
necessary for the toxic effects of soluble b-amyloid (Ab) oligomers on synapses and
hippocampal long-term potentiation. Finally, microglia in adult brains engulf synaptic
material in a CR3-dependent process when exposed to soluble Ab oligomers. Together,
these findings suggest that the complement-dependent pathway and microglia that
prune excess synapses in development are inappropriately activated and mediate
synapse loss in AD.
Genome-wide association studies impli-
cate microglia and complement-related
pathways in Alzheimer’s disease (AD) (1).
Previous research has demonstrated both
beneficial and detrimental roles of com-
plement and microglia in plaque-related neuro-
pathology (2, 3); however, their roles in synapse
loss, a major pathological correlate of cognitive
decline in AD (4), remain to be identified. Emerg-
ing research implicates microglia and immune-
relatedmechanisms in brainwiring in the healthy
brain (1). During development, C1q and C3 local-
ize to synapses and mediate synapse elimination
by phagocytic microglia (5–7). We hypothesized
that this normal developmental synaptic pruning
pathway is activated early in the AD brain and
mediates synapse loss.
The degree of region-specific synapse loss is
a stronger correlate of cognitive decline in AD
than counts of plaques, tangles, and neuronal
loss (8, 9). To determine how early synapse loss
occurs, we used superresolution structured illu-
mination microscopy (SIM) (10) to quantify syn-
apse density in hippocampal CA1 stratum radiatum
of familial AD-mutant human amyloid precursor
protein (hAPP) (“J20”) transgenicmice (11). Quan-
tification of colocalized pre- and postsynaptic
puncta [synaptophysin and postsynaptic den-
sity 95 (PSD95) (Fig. 1A); synaptotagmin and
homer (fig. S1, A to D)] revealed a significant loss
of synapses in J20 hippocampus at 3 to 4months
old (mo), an age that precedes plaque deposition
(11, 12). Synapse loss in preplaque J20 CA1 was
confirmed by electron microscopy (fig. S1G). Con-
focal imaging also showed synapse loss in CA1,
CA3, and dentate gyrus of 3 mo J20 hippo-
campus but not in striatum (fig. S1E). Synapse
712 6 MAY 2016 • VOL 352 ISSUE 6286 sciencemag.org SCIENCE
1F.M. Kirby Neurobiology Center, Boston Children’s Hospital(BCH) and Harvard Medical School (HMS), Boston, MA02115, USA. 2Ann Romney Center for Neurologic Diseases,Department of Neurology, Brigham and Women’s Hospital(BWH) and HMS, Boston, MA 02115, USA. 3Alector Inc., 953Indiana Street, San Francisco, CA 94107, USA. 4AnnexonBiosciences, 280 Utah Avenue Suite 110, South SanFrancisco, CA 94080, USA. 5Department of Anatomy,University of California San Francisco (UCSF), San Francisco,CA 94143, USA. 6Department of Neurobiology, StanfordUniversity School of Medicine, Palo Alto, CA 94305, USA.7Prothena Biosciences, Dublin, Ireland. 8Stanley Center forPsychiatric Research, Broad Institute of MIT and Harvard,Cambridge, MA 02142, USA.*These authors contributed equally to this work. †Corresponding
author. Email: [email protected]
RESEARCH | REPORTS
synapse loss occurs, we used superresolu-tion structured illumination microscopy (SIM) (10) to quantify synapse density in hippocampal CA1 stratum radiatum of fa-milial AD-mutant human amyloid precur-sor protein (hAPP) (“J20”) transgenic mice (11). Quantification of colocalized pre- and postsynaptic puncta [synaptophysin and postsynaptic density 95 (PSD95) (Fig. 1A); synaptotagmin and homer (fig. S1, A to D)] revealed a significant loss of synapses in J20 hippocampus at 3 to 4 months old (mo), an age that precedes plaque deposi-tion (11, 12). Synapse loss in preplaque J20 CA1 was confirmed by electron microscopy (fig. S1G). Confocal imaging also showed synapse loss in CA1, CA3, and dentate gyrus of 3 mo J20 hippocampus but not in stria-tum (fig. S1E). Synapse levels were not al-tered in 1 mo J20 brains versus wild type (WT) littermates (fig. S1F), suggesting that the hippocampal synaptic loss at 3 mo is likely not a result of abnormal syn-aptic development.
We asked whether the classical comple-ment cascade is up-regulated in preplaque brains when synapses are already vulner-able. C1q immunoreactivity (13) (antibody now available at Abcam) was elevated in J20 brains as early as 1 mo and preceding synapse loss (Fig. 1B and fig. S1). C1q eleva-tion was region-specific, particularly in the hippocampus and frontal cortex, two re-gions vulnerable to synapse loss (14) (Fig. 1B and fig. S2A). C1q immunoreactivity was comparable between J20 and WT mice at postnatal day 21 (P21) (fig. S2B), suggest-
2. B. Bosworth, K. Zhang, “Evidence of Increasing Differential
Mortality: A Comparison of the HRS and SIPP,” Center for
Retirement Research at Boston College Working Paper 2015-13
(2015).
3. R. Chetty et al., JAMA 10.1001/jama.2016.4226 (2016).
4. National Research Council, Committee on the Long-Run
Macroeconomic Effects of the Aging U.S. Population, “The
Growing Gap in Life Expectancy by Income: Implications for
Federal Programs and Policy Responses” (2015).
5. J. Pijoan-Mas, J. V. Ríos-Rull, Demography 51, 2075–2102
(2014).
6. H. Waldron, Soc. Secur. Bull. 67, 1–28 (2007).
7. H. Waldron, Soc. Secur. Bull. 73, 1–37 (2013).
8. J. Wilmoth, C. Boe, M. Barbieri, in International Differences
in Mortality at Older Ages: Dimensions and Sources,
E. M. Crimmins, S. H. Preston, B. Cohen, Eds.
(National Academies Press, Washington, DC, 2011),
pp. 337–372.
9. G. K. Singh, M. Siahpush, Int. J. Epidemiol. 35, 969–979
(2006).
10. M. Ezzati, A. B. Friedman, S. C. Kulkarni, C. J. Murray, PLOS
Med. 5, e66 (2008).
11. C. J. Murray et al., PLOS Med. 3, e260 (2006).
12. H. Wang, A. E. Schumacher, C. E. Levitz, A. H. Mokdad,
C. J. Murray, Popul. Health Metr. 11, 8 (2013).
13. J. S. Olshansky et al., Health Aff. 31, 1803–1813 (2011).
14. E. R. Meara, S. Richards, D. M. Cutler, Health Aff. 27, 350–360
(2008).
15. D. M. Cutler, F. Lange, E. Meara, S. Richards-Shubik,
C. J. Ruhm, J. Health Econ. 30, 1174–1187 (2011).
16. J. K. Montez, L. F. Berkman, Am. J. Public Health 104, e82–e90
(2014).
17. Human Mortality Database; www.mortality.org.
18. D. D. Reidpath, P. Allotey, J. Epidemiol. Community Health 57,
344–346 (2003).
19. A. Case, A. Deaton, Proc. Natl. Acad. Sci. U.S.A. 112,
15078–15083 (2015).
20. J. Bound, A. Geronimus, J. Rodriguez, T. Waidman, “The
Implications of Differential Trends in Mortality for Social
Security Policy,” University of Michigan Retirement Research
Center Working Paper 2014-314 (2014).
21. J. B. Dowd, A. Hamoudi, Int. J. Epidemiol. 43, 983–988
(2014).
22. T. Goldring, F. Lange, S. Richards-Shubik, “Testing for Changes
in the SES-Mortality Gradient When the Distribution of
Education Changes Too,” National Bureau of Economic
Research Working Paper 20993 (2015).
23. A. S. Hendi, Int. J. Epidemiol. 44, 946–955 (2015).
24. A. Aizer, J. Currie, Science 344, 856–861 (2014).
25. D. Brown, A. Kowalski, I. Lurie, “Medicaid as an Investment in
Children: What Is the Long-Term Impact on Tax Receipts?”
National Bureau of Economic Research Working Paper 20835
(2015).
26. S. Cahodes, S. Kleiner, M. F. Lovenhem, M. Grossman,
“Effect of Child Health Insurance Access on Schooling,”
National Bureau of Economic Research Working Paper
20178 (2014).
27. S. Miller, L. R. Wherry, “The Long-Term Health Effects of Early
Life Medicaid Coverage,” Social Science Research Network
Working Paper 2466691 (2015).
28. L. R. Wherry, B. Meyer, “Saving Teens: Using and Eligibility
Discontinuity to Estimate the Effects of Medicaid Eligibility,”
National Bureau of Economic Research Working Paper 18309
(2013).
29. L. R. Wherry, S. Miller, R. Kaestner, B. D. Meyer, “Childhood
Medicaid Coverage and Later Life Health Care Utilization,”
National Bureau of Economic Research Working Paper 20929
(2015).
30. J. Ludwig, D. L. Miller, Q. J. Econ. 122, 159–208 (2007).
31. H. Hoynes, D. Whitmore-Schanzanbach, D. Almond,
“Long Run Impacts of Childhood Access to the Safety Net,”
National Bureau of Economic Research Working Paper 18535
(2012).
32. A. Isen, M. Rossin-Slater, R. Walker, “Every Breath You Take
Every Dollar You’ll Make: The Long-Term Consequences of
the Clean Air Act of 1970,” National Bureau of Economic
Research Working Paper 19858 (2014).
33. A. Fenelon, S. H. Preston, Demography 49, 797–818
(2012).
34. D. de Walque, J. Hum. Resour. 45, 682–717 (2010).
35. C. E. Finch, E. M. Crimmins, Science 305, 1736–1739
(2004).
ACKNOWLEDGMENTS
We thank M. Barbieri, A. Case, A. Deaton, J. Goldstein,
I. Kuziemko, R. Lee, and K. Wachter, as well as seminar
participants at Berkeley, the Chicago Federal Reserve,
Fundação Getúlio Vargas São Paulo, Bonn University,
University of Munich, Princeton University, ETH Zurich,
and the University of Zurich for comments. Supported by
Princeton Center for Translational Research on Aging
grant 2P30AG024928. Data and code are available at
http://dx.doi.org/10.7910/DVN/C2VYNM.
SUPPLEMENTARY MATERIALS
www.sciencemag.org/content/352/6286/708/suppl/DC1
Materials and Methods
Figs. S1 to S8
Tables S1 to S4
References (36–38)
22 December 2015; accepted 17 March 2016
Published online 21 April 2016
10.1126/science.aaf1437
NEURODEVELOPMENT
Complement and microglia mediateearly synapse loss in Alzheimermouse modelsSoyon Hong,1 Victoria F. Beja-Glasser,1* Bianca M. Nfonoyim,1* Arnaud Frouin,1
Shaomin Li,2 Saranya Ramakrishnan,1 Katherine M. Merry,1 Qiaoqiao Shi,2
Arnon Rosenthal,3,4,5 Ben A. Barres,6 Cynthia A. Lemere,2
Dennis J. Selkoe,2,7 Beth Stevens1,8†
Synapse loss in Alzheimer’s disease (AD) correlates with cognitive decline. Involvement
of microglia and complement in AD has been attributed to neuroinflammation,
prominent late in disease. Here we show in mouse models that complement and microglia
mediate synaptic loss early in AD. C1q, the initiating protein of the classical
complement cascade, is increased and associated with synapses before overt plaque
deposition. Inhibition of C1q, C3, or the microglial complement receptor CR3 reduces the
number of phagocytic microglia, as well as the extent of early synapse loss. C1q is
necessary for the toxic effects of soluble b-amyloid (Ab) oligomers on synapses and
hippocampal long-term potentiation. Finally, microglia in adult brains engulf synaptic
material in a CR3-dependent process when exposed to soluble Ab oligomers. Together,
these findings suggest that the complement-dependent pathway and microglia that
prune excess synapses in development are inappropriately activated and mediate
synapse loss in AD.
Genome-wide association studies impli-
cate microglia and complement-related
pathways in Alzheimer’s disease (AD) (1).
Previous research has demonstrated both
beneficial and detrimental roles of com-
plement and microglia in plaque-related neuro-
pathology (2, 3); however, their roles in synapse
loss, a major pathological correlate of cognitive
decline in AD (4), remain to be identified. Emerg-
ing research implicates microglia and immune-
relatedmechanisms in brainwiring in the healthy
brain (1). During development, C1q and C3 local-
ize to synapses and mediate synapse elimination
by phagocytic microglia (5–7). We hypothesized
that this normal developmental synaptic pruning
pathway is activated early in the AD brain and
mediates synapse loss.
The degree of region-specific synapse loss is
a stronger correlate of cognitive decline in AD
than counts of plaques, tangles, and neuronal
loss (8, 9). To determine how early synapse loss
occurs, we used superresolution structured illu-
mination microscopy (SIM) (10) to quantify syn-
apse density in hippocampal CA1 stratum radiatum
of familial AD-mutant human amyloid precursor
protein (hAPP) (“J20”) transgenicmice (11). Quan-
tification of colocalized pre- and postsynaptic
puncta [synaptophysin and postsynaptic den-
sity 95 (PSD95) (Fig. 1A); synaptotagmin and
homer (fig. S1, A to D)] revealed a significant loss
of synapses in J20 hippocampus at 3 to 4months
old (mo), an age that precedes plaque deposition
(11, 12). Synapse loss in preplaque J20 CA1 was
confirmed by electron microscopy (fig. S1G). Con-
focal imaging also showed synapse loss in CA1,
CA3, and dentate gyrus of 3 mo J20 hippo-
campus but not in striatum (fig. S1E). Synapse
712 6 MAY 2016 • VOL 352 ISSUE 6286 sciencemag.org SCIENCE
1F.M. Kirby Neurobiology Center, Boston Children’s Hospital(BCH) and Harvard Medical School (HMS), Boston, MA02115, USA. 2Ann Romney Center for Neurologic Diseases,Department of Neurology, Brigham and Women’s Hospital(BWH) and HMS, Boston, MA 02115, USA. 3Alector Inc., 953Indiana Street, San Francisco, CA 94107, USA. 4AnnexonBiosciences, 280 Utah Avenue Suite 110, South SanFrancisco, CA 94080, USA. 5Department of Anatomy,University of California San Francisco (UCSF), San Francisco,CA 94143, USA. 6Department of Neurobiology, StanfordUniversity School of Medicine, Palo Alto, CA 94305, USA.7Prothena Biosciences, Dublin, Ireland. 8Stanley Center forPsychiatric Research, Broad Institute of MIT and Harvard,Cambridge, MA 02142, USA.*These authors contributed equally to this work. †Corresponding
author. Email: [email protected]
RESEARCH | REPORTS
Originally published 6 May 2016 in SCIENCE
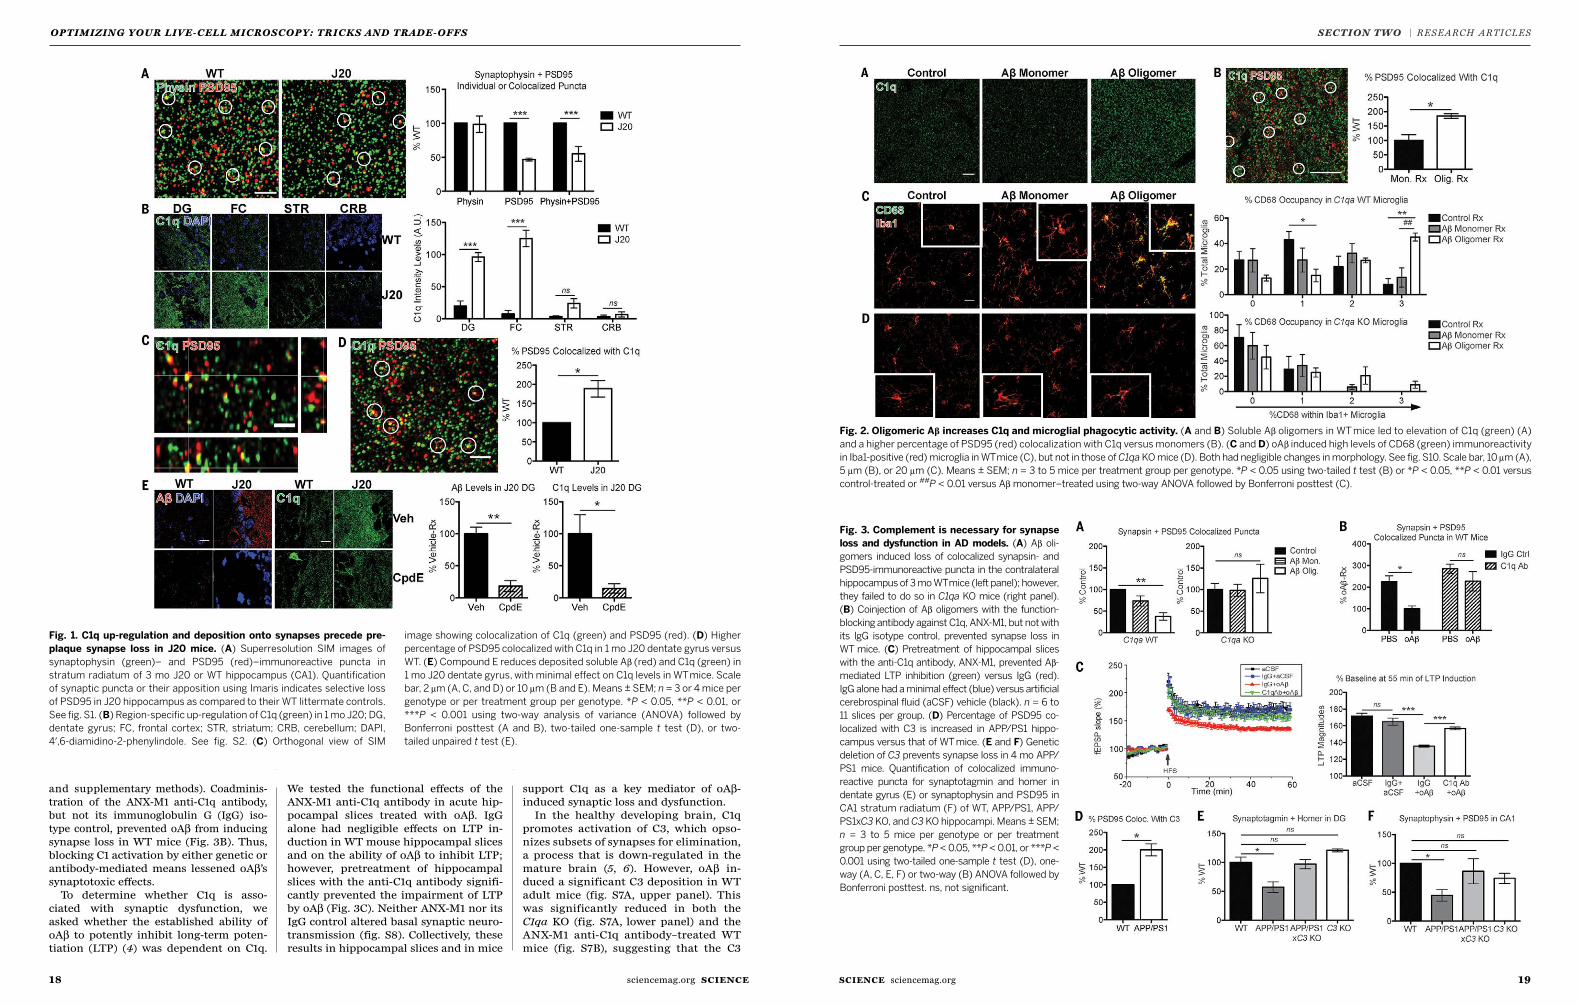
1918 SCIENCE sciencemag.orgsciencemag.org SCIENCE
OPTIMIZING YOUR LIVE-CELL MICROSCOP Y: TRICKS AND TRADE-OFFS SECTION TWO | RESEARCH ARTICLES
and supplementary methods). Coadminis-tration of the ANX-M1 anti-C1q antibody, but not its immunoglobulin G (IgG) iso-type control, prevented oAβ from inducing synapse loss in WT mice (Fig. 3B). Thus, blocking C1 activation by either genetic or antibody-mediated means lessened oAβ’s synaptotoxic effects.
To determine whether C1q is asso-ciated with synaptic dysfunction, we asked whether the established ability of oAβ to potently inhibit long-term poten-tiation (LTP) (4) was dependent on C1q.
We tested the functional effects of the ANX-M1 anti-C1q antibody in acute hip-pocampal slices treated with oAβ. IgG alone had negligible effects on LTP in-duction in WT mouse hippocampal slices and on the ability of oAβ to inhibit LTP; however, pretreatment of hippocampal slices with the anti-C1q antibody signifi-cantly prevented the impairment of LTP by oAβ (Fig. 3C). Neither ANX-M1 nor its IgG control altered basal synaptic neuro-transmission (fig. S8). Collectively, these results in hippocampal slices and in mice
support C1q as a key mediator of oAβ-induced synaptic loss and dysfunction.
In the healthy developing brain, C1q promotes activation of C3, which opso-nizes subsets of synapses for elimination, a process that is down-regulated in the mature brain (5, 6). However, oAβ in-duced a significant C3 deposition in WTadult mice (fig. S7A, upper panel). This was significantly reduced in both the C1qa KO (fig. S7A, lower panel) and the ANX-M1 anti-C1q antibody–treated WT mice (fig. S7B), suggesting that the C3
levels were not altered in 1 mo J20 brains ver-
sus wild-type (WT) littermates (fig. S1F), sug-
gesting that the hippocampal synaptic loss at
3 mo is likely not a result of abnormal synaptic
development.
We asked whether the classical complement
cascade is up-regulated in preplaque brains when
synapses are already vulnerable. C1q immuno-
reactivity (13) (antibody now available at Abcam)
was elevated in J20 brains as early as 1 mo and
preceding synapse loss (Fig. 1B and fig. S1). C1q
elevation was region-specific, particularly in
the hippocampus and frontal cortex, two regions
vulnerable to synapse loss (14) (Fig. 1B and fig.
S2A). C1q immunoreactivity was comparable be-
tween J20 andWTmice at postnatal day 21 (P21)
(fig. S2B), suggesting that elevated levels at 1 mo
are likely not a developmental artifact. C1q was
also similarly increased in the hippocampus of
anothermodel of AD, the APP/PS1 (presenilin 1)
mice (15) (fig. S2C). Notably, SIM demonstrated
colocalization of C1q with PSD95-positive puncta
in 1 mo J20 hippocampus (Fig. 1C). A higher
percentage of PSD95 colocalized with C1q in
the hippocampus of J20 mice than in that of
WT littermates (Fig. 1D and fig. S3), suggesting
that the C1q-associated synapses may be marked
for elimination.
Punctate Abwas found deposited in J20 hip-
pocampus at 1 mo (fig. S4), long before Ab
plaques deposit (11, 12), raising the question of
whether C1q increase in these preplaque brains
is dependent on soluble Ab levels. To test this
hypothesis, we injected themice with compound
E, a g-secretase inhibitor that rapidly decreases
Ab production (12). Compound E markedly re-
duced soluble Ab levels in J20 mice; there was
a corresponding reduction of C1q deposition
(Fig. 1E), suggesting that Ab up-regulates C1q.
SCIENCE sciencemag.org 6 MAY 2016 • VOL 352 ISSUE 6286 713
Fig. 1. C1q up-regulation and deposition onto synapses precede pre-
plaque synapse loss in J20 mice. (A) Superresolution SIM images of
synaptophysin (green)– and PSD95 (red)–immunoreactive puncta in
stratum radiatum of 3 mo J20 or WT hippocampus (CA1). Quantification
of synaptic puncta or their apposition using Imaris indicates selective loss
of PSD95 in J20 hippocampus as compared to their WT littermate controls.
See fig. S1. (B) Region-specific up-regulation of C1q (green) in 1mo J20; DG,
dentate gyrus; FC, frontal cortex; STR, striatum; CRB, cerebellum; DAPI,
4′,6-diamidino-2-phenylindole. See fig. S2. (C) Orthogonal view of SIM
image showing colocalization of C1q (green) and PSD95 (red). (D) Higher
percentage of PSD95 colocalized with C1q in 1 mo J20 dentate gyrus versus
WT. (E) Compound E reduces deposited soluble Ab (red) and C1q (green) in
1 mo J20 dentate gyrus, with minimal effect on C1q levels in WTmice. Scale
bar, 2 mm (A, C, and D) or 10 mm (B and E). Means ± SEM; n = 3 or 4mice per
genotype or per treatment group per genotype. *P < 0.05, **P < 0.01, or
***P < 0.001 using two-way analysis of variance (ANOVA) followed by
Bonferroni posttest (A and B), two-tailed one-sample t test (D), or two-
tailed unpaired t test (E).
RESEARCH | REPORTS
714 6 MAY 2016 • VOL 352 ISSUE 6286 sciencemag.org SCIENCE
Fig. 2. Oligomeric Ab increases C1q and microglial phagocytic activity. (A and B) Soluble Ab oligomers in WTmice led to elevation of C1q (green) (A)
and a higher percentage of PSD95 (red) colocalization with C1q versusmonomers (B). (C andD) oAb induced high levels of CD68 (green) immunoreactivity
in Iba1-positive (red)microglia inWTmice (C), but not in those ofC1qaKOmice (D). Both had negligible changes inmorphology. See fig. S10. Scale bar, 10 mm(A),
5 mm (B), or 20 mm (C). Means ± SEM; n = 3 to 5 mice per treatment group per genotype. *P < 0.05 using two-tailed t test (B) or *P < 0.05, **P < 0.01 versus
control-treated or ##P < 0.01 versus Ab monomer–treated using two-way ANOVA followed by Bonferroni posttest (C).
Fig. 3. Complement is necessary for synapse
loss and dysfunction in AD models. (A) Ab oli-
gomers induced loss of colocalized synapsin- and
PSD95-immunoreactive puncta in the contralateral
hippocampusof 3moWTmice (left panel); however,
they failed to do so in C1qa KO mice (right panel).
(B) Coinjection of Ab oligomers with the function-
blocking antibody against C1q, ANX-M1, but notwith
its IgG isotype control, prevented synapse loss in
WT mice. (C) Pretreatment of hippocampal slices
with the anti-C1q antibody, ANX-M1, prevented Ab-
mediated LTP inhibition (green) versus IgG (red).
IgG alone had aminimal effect (blue) versus artificial
cerebrospinal fluid (aCSF) vehicle (black). n = 6 to
11 slices per group. (D) Percentage of PSD95 co-
localized with C3 is increased in APP/PS1 hippo-
campus versus that of WTmice. (E and F) Genetic
deletion of C3 prevents synapse loss in 4 mo APP/
PS1 mice. Quantification of colocalized immuno-
reactive puncta for synaptotagmin and homer in
dentate gyrus (E) or synaptophysin and PSD95 in
CA1 stratum radiatum (F) of WT, APP/PS1, APP/
PS1xC3 KO, and C3 KO hippocampi. Means ± SEM;
n = 3 to 5 mice per genotype or per treatment
group per genotype. *P< 0.05, **P < 0.01, or ***P<
0.001 using two-tailed one-sample t test (D), one-
way (A, C, E, F) or two-way (B) ANOVA followed by
Bonferroni posttest. ns, not significant.
RESEARCH | REPORTS
2120 SCIENCE sciencemag.orgsciencemag.org SCIENCE
OPTIMIZING YOUR LIVE-CELL MICROSCOP Y: TRICKS AND TRADE-OFFS SECTION TWO | RESEARCH ARTICLES
deposition in this model is downstream ofthe classical complement cascade. Consis-tent with these findings, a higher percent-age of PSD95 colocalized with C3 in J20 and APP/PS1 brains (Fig. 3D and fig. S9). To determine whether C3 is necessary for early synapse loss in AD genetic models, we crossed APP/PS1 mice, which, similar to the J20 mice, had a significant increaseand localization of C1q and C3 onto hip-pocampal synapses (figs. S2C and S9), to C3-deficient mice (18). Quantification of colocalized pre- and post-synaptic puncta demonstrated synapse loss in 4 mo APP/PS1 hippocampus as compared to WT;however, APP/PS1xC3 KO mice did not display this synapse loss (Fig. 3, E and F). Together, our data indicate that genetic deletion of C3 ameliorates synapse loss in APP/PS1 mice, providing further evidence that the classical complement cascade mediates early synapse loss in AD mousemodels.
Microglia express complement recep-tors and mediate synaptic pruning in the developing brain (1, 6), raising the ques-tion of whether this normal developmen-tal pruning pathway could be activated to mediate synapse loss in the preplaqueAD brain. Consistent with this hypoth-esis, microglia had increased amounts of the lysosomal protein CD68 in J20 hippocampus compared to WT and less so in striatum, a less vulnerable region (figs. S1C and S10). Furthermore, in WTmice challenged with oAβ, microglia had significantly increased levels of CD68 immuno-reactivity (Fig. 2C). However, in C1qa KO mice in which synapse loss was rescued, oAβ failed to induce such
an increase (Fig. 2D), suggesting that mi-croglia eliminate synapses through thecomplement pathway.
To directly test whether phagocytic microglia engulf synaptic elements, we adapted our in vivo synaptic engulfment assay (19) using intracerebroventricular injections of Aβ in homer-GFP (green flu-orescent protein) mice (20) (Fig. 4A). oAβinduced a significantly higher volumeof internalized homer-GFP in microglia than monomeric Aβ controls did at the contralateral hippocampus (Fig. 4B), in-dicating that microglia engulf synaptic elements when challenged with oAβ. In-ternalized homer-GFP often colocalized with CD68 (fig. S11A), suggesting that the engulfed synapses are internalized into ly-sosomal compartments in a manner similar to that of developmental synaptic pruning (6). Notably, oAβ failed to increase synaptic engulfment in microglia lacking CR3 (21), a high-affinity receptor for C3 expressed on macrophages [homer-GFPxCR3 KO versus homer-GFP mice, which received tail vein injections of phosphate-buffered saline (PBS) or oAβ (Fig. 4C)]. These data demon-strate that CR3 is necessary for oAβ-depen-dent engulfment of synapses by microglia.
To test whether inhibition in microglial engulfment leads to protection against oAβ-induced synapse loss, we performed tail vein injections of oAβ into WT and CR3 KO mice. oAβ induced synapse loss in the hippocampus of WT mice but not in that of CR3 KO mice (Fig. 4D). All CR3-positive microglia were P2RY12-positive(fig. S11), indicating that they are resi-dent cells (22). Altogether, these results suggest that resident microglia engulf
synaptic material when challenged by oAβ through a complement-dependent mechanism.
Synaptic deficits occur in early AD and mild cognitive impairment before onset of plaques and are some of the first signs of the neuronal degenerative process (4, 23–25). Here we identify critical synaptotoxic roles of complement and microglia in AD models before plaque formation and neu-roinflammation, in regions of the hippo-campus undergoing synapse loss. Usingmultiple experimental approaches, we demonstrate a region-specific increase of phagocytic microglia and accumulation of C1q and C3 on synapses in preplaque brains. Microglia in the adult brain, when challenged with synaptotoxic, soluble Aβoligomers, engulf synapses in the absence of plaque aggregates; deletion of CR3 blocks this process. Finally, inhibiting C1q, C3, or CR3 activity rescues synaptic loss and dysfunction.
Our data suggest a local activation of a developmental pruning pathway (5, 6) as a key mechanism underlying oAβ-induced synapse loss in preplaque AD brain. C1q is aberrantly increased by diffusible oAβin a region-specific manner and deposits onto synapses, triggering the activation of downstream classical complement path-way and phagocytic microglia. Blocking Aβ production in J20 mice significantlyameliorated C1q deposition in the hip-pocampus, and genetic or antibody-mediated inhibition of complement blocks oAβ from inducing microglial syn-aptic engulfment, synapse loss, and LTPinhibition. These complementary find-ings have direct therapeutic relevance.
We propose a model in which C1q and oAβ operate in a common pathway to ac-tivate the complement cascade and drive synapse elimination by microglia through CR3 (fig. S12). This could occur in multiple ways: Soluble oAβ associates with synaptic membranes and other synaptic markers (4, 26); thus, oAβ bound to synapses may an-chor C1q directly. Alternatively, oAβ bind-ing to synapses may weaken the synapse (4) and expose a C1q receptor. Although specific receptors for C1q at synapses are not yet known, we have shown that C1q binds synapses in vulnerable re-gions undergoing synapse loss (5, 27). It is also plausible that oAβ and C1q may work indirectly to mediate synapse loss through cytokines such as transforming growth factor–β (7), through microglialor astrocytic activation, or through other mechanisms, including major histocom-patibility complex class I (MHCI)–PirB, another immune pathway critical for synapse elimination in development and AD (28–30).
Finally, our studies show that resident microglia in the adult central nervous system phagocytose synapses when chal-lenged by synaptotoxic oAβ, implicating microglia as potential cellular media-tors of synapse loss. Although microglia and complement activation are promi-nently involved in plaque maintenance and related periplaque neuropathology, their roles have heretofore been largely regarded as a secondary event related to neuroinflammation (2). Our studies directly challenge this view and sug-gest that microglia and immune-related pathways can act as early mediators of synapse loss and dysfunction that oc-cur in AD models before plaques form. Although the complement pathway may not be involved in all pathological routes to AD, including plaque-associated syn-apse loss, the work reported here pro-vides new insights into how synapses are lost in AD. It will be important in future studies to examine whether this microglia or the complement-dependent
pathway also plays a role in plaque-as-sociated synapse loss or in other syn-aptopathies, including tauopathies and Huntington’s disease. If so, our findings may suggest complement and microglia as potential early therapeutic targets in AD and other neurodegenerative dis-eases involving synaptic dysfunction and memory decline.
REFERENCES AND NOTES 1. S. Hong, L. Dissing-Olesen, B. Stevens, Curr. Opin.
Neurobiol. 36, 128–134 (2016). 2. T. Wyss-Coray, J. Rogers, Cold Spring Harb. Perspect. Med.
2, l a006346 (2012). 3. M. E. Benoit et al., J. Biol. Chem. 288, 654–665 (2013). 4. L. Mucke, D. J. Selkoe, Cold Spring Harb. Perspect. Med. 2,
a006338 (2012). 5. B. Stevens et al., Cell 131, 1164–1178 (2007). 6. D. P. Schafer et al., Neuron 74, 691–705 (2012). 7. A. R. Bialas, B. Stevens, Nat. Neurosci. 16, 1773–1782
(2013). 8. S. T. DeKosky, S. W. Sche£, Ann. Neurol. 27, 457–464
(1990). 9. R. D. Terry et al., Ann. Neurol. 30, 572–580 (1991).10. S. Hong, D. Wilton, B. Stevens, D. S. Richardson,
Structured Illumination Microscopy for the Investigation of Synaptic Structure and Function. In Methods in Molecular Biology; Synapse Development: Methods and Protocols.
11. L. Mucke et al., J. Neurosci. 20, 4050–4058 (2000).12. S. Hong et al., J. Neurosci. 31, 15861–15869 (2011).13. A. H. Stephan et al., J. Neurosci. 33, 13460–13474
(2013).14. J. A. Harris et al., J. Neurosci. 30, 372–381 (2010).15. J. L. Jankowsky et al., Hum. Mol. Genet. 13, 159–170
(2004).16. M. Botto et al., Nat. Genet. 19, 56–59 (1998).17. D. B. Freir et al., Neurobiol. Aging 32, 2211–2218 (2011).18. M. R. Wessels et al., Proc. Natl. Acad. Sci. U.S.A. 92,
11490–11494 (1995).19. D. P. Schafer, E. K. Lehrman, C. T. Heller, B. Stevens, J. Vis. Exp.
88, 51482 (2014).20. T. Ebihara, I. Kawabata, S. Usui, K. Sobue, S. Okabe, J.
Neurosci. 23, 2170–2181 (2003).21. A. Coxon et al., Immunity 5, 653–666 (1996).22. O. Butovsky et al., Nat. Neurosci. 17, 131–143 (2014).23. D. J. Selkoe, Science 298, 789–791 (2002).24. S. W. Sche£, D. A. Price, F. A. Schmitt, E. J. Mufson,
Neurobiol. Aging 27, 1372–1384 (2006).25. S. W. Sche£, D. A. Price, F. A. Schmitt, S. T. DeKosky, E. J.
Mufson, Neurology 68, 1501–1508 (2007). 26. S. Hong et al., Neuron 82, 308–319 (2014).27. A. H. Stephan, B. A. Barres, B. Stevens, Annu. Rev.
Neurosci. 35, 369–389 (2012). 28. A. Datwani et al., Neuron 64, 463–470 (2009). 29. T. Kim et al., Science 341, 1399–1404 (2013).30. H. Lee et al., Nature 509, 195–200 (2014).
ACKNOWLEDGMENTSWe thank B. Sabatini (HMS), T. Bartels (BWH), and members of the Stevens laboratory for critical reading of the manuscript; L. Dissing-Olesen (BCH) for help with the conceptual «gure («g. S12), M. Ericsson [HMS electron microscopy (EM) facility] for EM imaging, K. Kapur (BCH) for advice on statistics, D. M. Walsh (BWH) for Ab oligomers (S26C), S. Okabe (University of Tokyo) for homer-GFP mice, and M. Leviten and T. Yednock (Annexon Biosciences) for characterization and advice on the ANX-M1 anti-C1q antibody; D. Richardson (Harvard Center for Biological Imaging), A. Hill BCH Intellectual and Developmental Disabilities Research Center Cellular Imaging Core NIH-P30-HD-18655, and H. Elliot and T. Xie (HMS Image and Data Analysis Core) for assistance with imaging and data analysis; and S. Kim (BWH), K. Colodner (BCH), and S. Matousek (BWH) for assistance with mice. The J20 mice, C1qa KO mice, P2RY12 antibody, and the ANX-M1 C1q function-blocking antibody are available from L. Mucke, M. Botto, O. Butovsky, and A. Rosenthal under material transfer agreements with UCSF Gladstone, Imperial College London, BWH, and Annexon Biosciences, respectively. A.R. is a cofounder, consultant, and chairman of the board of directors; B.A.B. is a cofounder and chairman of the scienti«c advisory board; and B.S. serves on the scienti«c advisory board of Annexon LLC. A.R., B.A.B., and B.S. are minor shareholders of Annexon LLC. All other authors declare no competing «nancial interests related to this project. The following patents related to this project have been granted or applied for: PCT/2015/010288 (S.H. and B.S.), US14/988387 and EP14822330 (S.H., A.R., and B.S.), and US8148330, US9149444, US20150368324, US20150368325, US20150368326, and US20120328601 (B.S. and B.A.B.). This work was funded by an Edward R. and Anne G. Le°er Fellowship (S.H.), Coins for Alzheimer’s Research Trust (B.S.), Fidelity Biosciences Research Initiative (F-Prime) (B.S. and C.A.L.), JPB Foundation (B.A.B.), the National Institutes of Health AG000222 (S.H.), National Institute of Neurological Disorders and Stroke–NIH R01NS083845 (D.J.S.), National Institute on Aging–NIH 1RF1AG051496A (B.S.). Supplementary materials contain additional data, including materials and methods. S.H. and B.S. designed the study and wrote the manuscript, with help from all authors. S.H. performed most experiments and data analysis; V.F.B.-G. and B.M.N. performed microglial activation and engulfment experiments along with immunohistochemistry; S.R. and K.M.M. performed C1q immunohistochemistry; A.F. performed FISH; S.L. performed electrophysiology; Q.S. and C.A.L. assisted with design and collection of APP/PS1 tissue; A.R. and B.A.B. designed and characterized the ANX-M1 antiC1q antibody; and D.J.S. contributed in the discussions and experimental design.
SUPPLEMENTARY MATERIALS www.sciencemag.org/cgi/content/full/science.aad8373/DC1Materials and MethodsFigs. S1 to S12
10 November 2015; accepted 18 March 2016Published online 31 March 201610.1126/science.aad8373
To further address whether the increase of C1q
is dependent on soluble Ab, and if so, which
species, we injected soluble Ab oligomers or
monomers into lateral ventricles of WT mice.
Hippocampus contralateral to the injection site
was examined to avoid any surgery-related ef-
fects. Oligomeric Ab (oAb), which is prefibrillar
in nature and acts as amediator of synapse loss
and dysfunction in AD (4), but not the relatively
innocuous monomeric Ab or vehicle, induced
C1q deposition (Fig. 2A and fig. S5). A higher
percentage of PSD95 colocalized with C1q in
oAb-injected versusmonomer-injectedmice (Fig.
2B), in a manner similar to this colocalization in
J20 mice. Together, these findings show an early
and aberrant increase and synaptic localization
of C1q in multiple AD model systems. Further-
more, fluorescent in situ hybridization (FISH)
demonstrated up-regulated C1qa expression in
microglia (fig. S6), implicatingmicroglia as amajor
source of C1q in these preplaque brains.
To test whether C1q and oAb act in a common
pathway to eliminate synapses, we injected oAb
into lateral ventricles ofC1qa knockout (KO) mice
(16). Soluble oAb induced a significant loss of co-
localized synapsin- and PSD95-immunoreactive
puncta in WT mice within 72 hours (Fig. 3A, left
panel) (17). In contrast, oAb failed to induce syn-
apse loss in C1qa KO mice (Fig. 3A, right panel),
suggesting that C1q is required for oAb-induced
synapse loss in vivo. To determine whether local,
acute inhibition of C1 activation could similarly
blunt the synaptotoxic effects of oAb, we used
an antibody against C1q (anti-C1q) (ANX-M1,
Annexon Biosciences), which blocks the classical
complement cascade (see fig. S7 and supplemen-
tary methods). Coadministration of the ANX-M1
anti-C1q antibody, but not its immunoglobulin G
(IgG) isotype control, prevented oAb from inducing
synapse loss in WT mice (Fig. 3B). Thus, block-
ing C1 activation by either genetic or antibody-
mediated means lessened oAb’s synaptotoxic
effects.
To determine whether C1q is associated with
synaptic dysfunction, we asked whether the
established ability of oAb to potently inhibit
long-term potentiation (LTP) (4) was depen-
dent on C1q. We tested the functional effects of
the ANX-M1 anti-C1q antibody in acute hippo-
campal slices treated with oAb. IgG alone had
negligible effects on LTP induction inWTmouse
hippocampal slices and on the ability of oAb to
inhibit LTP; however, pretreatment of hippo-
campal slices with the anti-C1q antibody signif-
icantly prevented the impairment of LTP by oAb
(Fig. 3C). Neither ANX-M1 nor its IgG control
altered basal synaptic neurotransmission (fig. S8).
Collectively, these results in hippocampal slices
and in mice support C1q as a key mediator of
oAb-induced synaptic loss and dysfunction.
In the healthy developing brain, C1q promotes
activation of C3, which opsonizes subsets of
synapses for elimination, a process that is down-
regulated in the mature brain (5, 6). However,
oAb induced a significant C3 deposition in WT
adult mice (fig. S7A, upper panel). This was sig-
nificantly reduced in both the C1qa KO (fig. S7A,
lower panel) and the ANX-M1 anti-C1q antibody–
treated WT mice (fig. S7B), suggesting that the
C3 deposition in this model is downstream of
the classical complement cascade. Consistent
with these findings, a higher percentage of PSD95
colocalized with C3 in J20 and APP/PS1 brains
(Fig. 3D and fig. S9). To determine whether C3
is necessary for early synapse loss in AD genetic
models, we crossed APP/PS1 mice, which, simi-
lar to the J20 mice, had a significant increase
and localization of C1q and C3 onto hippocampal
synapses (figs. S2C and S9), to C3-deficient mice
(18). Quantification of colocalized pre- and post-
synaptic puncta demonstrated synapse loss in
4moAPP/PS1 hippocampus as compared toWT;
however, APP/PS1xC3 KO mice did not display
this synapse loss (Fig. 3, E and F). Together, our
data indicate that genetic deletion of C3 amelio-
rates synapse loss in APP/PS1 mice, providing
further evidence that the classical complement
cascademediates early synapse loss in ADmouse
models.
Microglia express complement receptors and
mediate synaptic pruning in the developing brain
(1, 6), raising the question ofwhether this normal
developmental pruning pathway could be acti-
vated to mediate synapse loss in the preplaque
AD brain. Consistent with this hypothesis, mi-
croglia had increased amounts of the lysosomal
protein CD68 in J20 hippocampus compared
to WT and less so in striatum, a less vulnerable
region (figs. S1C and S10). Furthermore, in WT
mice challenged with oAb, microglia had sig-
nificantly increased levels of CD68 immuno-
reactivity (Fig. 2C). However, in C1qa KO mice
in which synapse loss was rescued, oAb failed
to induce such an increase (Fig. 2D), suggesting
that microglia eliminate synapses through the
complement pathway.
To directly test whether phagocytic microg-
lia engulf synaptic elements, we adapted our
in vivo synaptic engulfment assay (19) using in-
tracerebroventricular injections of Ab in homer-
GFP (green fluorescent protein) mice (20) (Fig.
4A). oAb induced a significantly higher volume
of internalized homer-GFP in microglia than
monomeric Ab controls did at the contralateral
hippocampus (Fig. 4B), indicating that microglia
engulf synaptic elements when challenged with
oAb. Internalized homer-GFP often colocalized
SCIENCE sciencemag.org 6 MAY 2016 • VOL 352 ISSUE 6286 715
Fig. 4. Microglia engulf synapses via CR3 upon
oligomeric Ab challenge. (A) Orthogonal view of
high-resolution confocal image shows colocalization
of homer-GFPand Iba1 (red). (B) Three-dimensional
reconstruction and surface rendering using Imaris
demonstrate larger volumes of homer-GFP puncta
inside microglia of oAb-injected contralateral hippo-
campus versus those of monomer-injected. (C) Mi-
croglia of homer-GFPxCR3 KO mice (right panel)
show less engulfment of homer-GFP when chal-
lenged with oAb versus those of homer-GFP mice
(left panel). (D) Ab oligomers failed to induce syn-
apse loss in the contralateral hippocampus of CR3
KO mice (right panel) as they did in WTmice (left
panel). Scale bar, 5 mm (A and B). Means ± SEM; n
= 3 mice per treatment group per genotype (n = 6
to 17 microglia analyzed per mouse). *P < 0.05,
**P < 0.01, or ***P < 0.0001 using two-tailed t test
(B) or two-tailed one-sample t test (C and D). ns,
not significant.
RESEARCH | REPORTS
2322 SCIENCE sciencemag.orgsciencemag.org SCIENCE
OPTIMIZING YOUR LIVE-CELL MICROSCOP Y: TRICKS AND TRADE-OFFS SECTION TWO | RESEARCH ARTICLES
Bioengineering a 3D integumentary organ system from iPS cells using an in vivo transplantation modelRyoji Takagi,1∗ Junko Ishimaru,1∗ Ayaka Sugawara,1* Koh-ei Toyoshima,2,3,4
Kentaro Ishida,5 Miho Ogawa,2,3,4 Kei Sakakibara,1 Kyosuke Asakawa,2 Akitoshi Kashiwakura,1 Masamitsu Oshima,5 Ryohei Minamide,2 Akio Sato,4 Toshihiro Yoshitake,4 Akira Takeda,4 Hiroshi Egusa,6 Takashi Tsuji2,3,5†
The integumentary organ system is a complex system that plays important roles in waterproofing, cushioning, protecting deeper tissues, excreting waste, and thermoregulation. We developed a novel in vivo transplantation model designated as a clustering-dependent embryoid body transplantation method and generated a bioengineered three-dimensional (3D) integumentary organ system, including appendage organs such as hair follicles and sebaceous glands, from induced pluripotent stem cells. This bioengineered 3D integumentary organ system was fully functional following transplantation into nude mice and could be properly connected to surrounding host tissues, such as the epidermis, arrector pili muscles, and nerve fibers, without tumorigenesis. The bioengineered hair follicles in the 3D integumentary organ system also showed proper hair eruption and hair cycles, including the rearrangement of follicular stem cells and their niches. Potential applications of the 3D integumentary organ system include an in vitro assay system, an animal model alternative, and a bioengineered organ replacement therapy.
INTRODUCTION
Organogenesis is a complex process in-volving tissue self-organization, cell-cell interactions, regulation of signaling mol-ecules, and cell movement (1–3). Almost all organs arise from organ germs, which
are induced by reciprocal epithelial-mesen-chymal interactions in each organ-forming field (4). Current regenerative therapy uses tissue stem cell transplantation to restore damaged tissues and organs in a wide vari-ety of diseases (5–7). Next-generation regen-erative therapy consists of organ replacement regenerative therapy, which aims to repro-duce the reciprocal epithelial-mesenchymal interactions during embryogenesis. This or-gan regeneration therapy represents a fun-damental approach to treating patients who
experience organ dysfunction as a result of disease, injury, or aging (8). Our recent stud-ies provided the proof of concept that fully functional regeneration of ectodermal or-gans, such as teeth, hair follicles, and salivary and lachrymal glands, could be achieved with the transplantation of bioengineered organ germs using the organ germ method (9–13). However, organ-inductive stem cells in a wide variety of organs, except hair follicles, exist only during embryonic organogenesis (2). Thus, we must develop techniques to recon-stitute a wide variety of bioengineered organ germs using pluripotent stem cells, such as embryonic stem (ES) cells and induced plu-ripotent stem (iPS) cells (2, 14).
Pluripotent stem cells, such as ES and iPS cells, can be induced to differentiate into spe-cific somatic cell lineages using cytokines that mimic the patterning and positioning signals during embryogenesis (15). In the embryo, patterning signals indicating body axis and organ-forming fields are strictly controlled by signaling centers according to the embryonic body plan (16). These complex pattern forma-tion signals in local areas of the body may lack centralized organizing signals, as ob-served in the generation of teratomas, which include disorganized neural tissues, cartilage, muscle, and bronchial epithelia (17). Although it is difficult to control the development of specific types of compartmentalized tissues, several groups recently reported neuroecto-dermal and endodermal organs generated via
the regulation of complex patterning signals during embryogenesis and self-formation of pluripotent stem cells in three-dimensional (3D) stem cell culture (2, 3, 18–22). However, ectodermal organs, such as the skin, hair folli-cles, teeth, and exocrine organs, have not been generated with sufficient reproducibility from pluripotent stem cells in 3D stem cell culture or by transplantation (3).
The integumentary organ system (IOS) is a complex system that plays important roles in waterproofing, cushioning, protecting deeper tissues, excreting waste, and thermo-regulation. The integumentary organs include the skin and its appendages (hair, sebaceous glands, sweat glands, feathers, and nails) (23). The integumentary organs arise from organ germs through reciprocal epithelial-mesenchymal interactions in the skin field (4). During embryogenesis, the skin field forms through a regulated process of pattern for-mation, and its appendage organs are then induced through epithelial-mesenchymal in-teractions according to a typical Turing model of activator and inhibitor signals (23). Regen-eration of the 3D IOS could contribute to re-generative therapies for patients with burns, scars, and alopecia, and could be used as a novel assay system for nonanimal safety test-ing of cosmetics and quasi-drugs (5, 24). How-ever, it is difficult to generate the complex 3D IOS using in vitro stem cell culture or in vivo transplantation models and to recapitulate the physiological functions of the skin using a bioengineered 3D IOS.
Here, we generated a bioengineered 3D IOS from iPS cells, which includes appendage organs such as hair follicles and sebaceous glands, using a novel in vivo transplantation model designated as the clustering-depen-dent embryoid body (CDB) transplantation method. We first developed the conditions for the induction of various epithelial germ layers in in vivo explants of iPS cells. Wnt signaling controlled the frequency of the 3D IOS, calcu-lated by the number of hair follicles in the ex-plants. After orthotopic transplantation of the bioengineered IOS into nude mice, the bioen-gineered hair follicles showed full functional-ity, including the ability to undergo repeated hair cycles through the rearrangement of vari-ous stem cell niches. Our current study thus demonstrates the development of a functional bioengineered 3D IOS and the realization of organ replacement therapy using iPS cells.
RESULTS
In vivo induction of epithelial tissue using a CDB transplantation methodTo generate various epithelia from iPS cells, we first developed a CDB transplantation method as an in vivo transplantation model. To form the complete three-germ-layer epi-thelial tissue from iPS cells, we established iPS cells from murine gingiva (Fig. 1A) (25).In an in vitro culture of iPS cells (3000 cells
per well of a 96-well plate), iPS cells formed embryoid bodies (EBs) in 3 days, and the EBs were allowed to grow for 1 week (Fig. 1B). The relative mRNA expression levels of undifferentiated iPS markers (Nanog) were significantly reduced over the culture period (Fig. 1C and table S1). By contrast, neural crest markers, such as Nestin and Pax3, were sig-nificantly increased on day 7 in culture (Fig. 1C). In an immunohistochemical analysis of EBs after 7 days in culture, we observed that the iPS cell–derived EBs had differenti-ated into both epithelial and mesenchymal cells (Fig. 1D). EBs expressed Sox2 and p63 as integumentary markers and expressed Sox17 as an endodermal epithelial marker. EBs also expressed proteins for the neural progenitor marker Pax6 and for neural crest markers such as Snail and Twist (Fig. 1D). These results indicated that both epithelial and mesenchymal cells were generated in iPS cell–derived EBs after 7 days in culture.
We next transplanted these EBs under various conditions into the subrenal capsule of severe combined immunodeficient (SCID) mice in vivo. Both single iPS cells and single EB transplants formed teratoma-like tissues, which contained three germ layers, including neural tissue, muscle, cartilage, and bronchial epithelia, as reported previously (Fig. 1E, top and middle) (26). By contrast, in multiple EBs transplanted using collagen gel, which con-tained more than 30 EBs cultured for 7 days under nonadhesive conditions (Fig. 1F), cys-tic epithelia were observed in the CDB trans-plants (Fig. 1E, bottom). The tissue weight of CDB transplants was heavy compared with single EB transplants, and organ formation was observed in 4 to 9 g of explants (Fig. 1G). The ratio of cystic tissue area in CDB transplants was significantly larger than that in explants of single iPS cells and single EB transplants (Fig. 1H and fig. S1).
We next characterized the types of epithe-lium generated in the in vivo explants using the CDB transplantation method, such as ectodermal epithelium, nerve tissue, integu-ment, and endodermal epithelium, includ-ing the respiratory tract and gastrointestinal tube, by histochemical analyses with specific antibodies for CK5, CK10, Muc2, Cdx2, Pax6, villin, Tuj1, CC10, and E-cadherin (Fig. 1I and fig. S2). In the explants, we identified various types of epithelium arising from the three germ layers, including ectodermal epithelium (CK5-positive), integument (CK10-positive), and endodermal epithelium, including the re-spiratory tract (Muc2-positive, CC10-positive, and CK10-negative) and gastrointestinal tube (villin-positive and Cdx2-positive). Although the transplantation of single ES or iPS cells induced epithelium at low efficiency (27), the incidence ratio of epithelium was statistically constant in explants generated via the CDB transplantation method (Fig. 1J). These re-sults indicate that our CDB transplantation method reproduced various epithelia.
Bioengineered 3D IOS in iPS cell–derived explants generated using the CDB transplantation method
In the iPS cell–derived explants generated via the CDB transplantation method, we observed that Wnt10b, which regulates the dermal papilla (DP) (28–30) and the subcuta-neous adipose tissue (31) derived from neural crest origin, induced the bioengineered hair follicles and developed the stage of hair fol-licles compared with the not-stimulated con-dition (Fig. 2A). The morphology of EBs and the expression of Sox2, p63, Sox17, Pax6, Snail, and Twist were not different with or without Wnt10b signaling (Fig. 1D and fig. S3). The hair shaft in the explant is black (Fig. 2A), al-though the hair shaft of the SCID mouse is white, indicating that hair follicles contain melanocytes that originate from iPS cell–de-rived neural crest cells. Although the frequen-cies in the explants with or without Wnt10b signaling were not different (Fig. 2B), the number of bioengineered hair follicles in the CDB explants treated with Wnt10b was drasti-cally higher than that of the explants without Wnt10b (Fig. 2C). In the explants treated with Wnt10b, the bioengineered hair shaft, which was measured from the tip of the hair shaft to the DP, was longer than that in the explants without Wnt10b (Fig. 2D). Moreover, the hair follicles in explants treated with Wnt10b were abundant, and mature hair follicle structures included the dermal sheath, DP, sebaceous glands, and subcutaneous adipose tissue (Fig. 2E). The expression of Shh, Msx2, Wnt10b, β-catenin, and Lef1 in the epithelium, and of Bmp4 and Notch1 in the mesenchyme of the bioengineered hair follicles in the CDB explants cultured with Wnt10b, was similar to that observed in natural skin on embry-onic day 18.5 (fig. S4) (11). Thus, in the iPS cell–derived explants generated via the CDB transplantation method, we observed the bioengineered 3D IOS, including the skin, hair follicles, dermis, sebaceous glands, and subcutaneous adipose tissue. We confirmed these structures using other iPS cell clones, including a gingiva-derived iPS cell clone (ectodermal origin), the stomach-derived iPS-Stm-FB/gfp-99-1 clone (endodermal ori-gin), and the hepatocyte-derived iPS-Hep-FB/Ng/gfp-103C-1 clone (endodermal origin) (32). The gingiva- and stomach-derived iPS cell clones, but not the iPS-Hep-FB/Ng/gfp-103C-1 clone, generated the bioengineered 3D IOS, including hair follicles. These results in-dicate that the generation of a bioengineered 3D IOS is not dependent on the origin of iPS cell clones from different germ layers because heterogeneity exists among iPS cell clones.
In hair follicles, various stem cell types are maintained in particular regions, such as CD34-, CK15-, and Sox9-positive follicle epi-thelial cells in the follicle stem cell niche of the bulge region (33, 34), Lrig1-positive epithelial stem cells in the upper bulge outer root sheath region, and multipotent mesenchymal precur-
sors in DP cells (34, 35). The follicle variable region mediates the hair cycle, which depends on the activation of Lgr5-positive follicle epi-thelial stem cells during the telogen-to-anagen transition. In addition, the follicle epithelial stem cells in the bulge region connect to the calponin-positive arrector pili muscles (Fig. 2F). We next investigated whether various stem/progenitor cells and their niches were reconstructed in the EGFP-labeled bioengi-neered hair follicles of the CDB transplants, which were produced using the EGFP-labeled iPS cell clone. All cells composed of bioengi-neered 3D IOS showed green fluorescence (Fig. 2G, left panels). Sox9 and CD34 dou-ble-positive epithelial stem cells were also observed in the bulge region of the normal iPS-derived bioengineered hair follicles (Fig. 2G). Lrig1-positive epithelial stem cells and Lgr5-positive epithelial cells were also observed in the proper anatomical regions, which were de-tected in the upper and lower portions of the CK15-positive bulge region, respectively (Fig. 2G). The calponin-positive arrector pili muscle was connected to the bulge region epithelial cells of both the natural hair follicle and the bioengineered hair follicle (Fig. 2H). These results indicate that various follicle stem cells and the arrector pili muscles were correctly arranged in the bioengineered hair follicles constructed using the bioengineered 3D IOS, which was derived from iPS cells.
Orthotopic transplantation of the iPS cell–derived bioengineered 3D IOSWe next investigated whether the iPS cell–derived IOS could be transplanted into the cutaneous environment of adult nude mice (Fig. 3A, upper panel). We isolated male cys-tic tissues with hair follicles in the explants, cut them into small specimens containing 10 to 20 follicular units, and transplanted them onto the backs of female nude mice using a follicular unit transplantation method (Fig. 3A, lower panels). At 14 days and thereafter, we observed the eruption and growth of black hair shafts (n = 216; Fig. 3B). After 3 months, we did not observe tumorigenesis in the trans-plantation areas (n = 171). To confirm that the transplanted 3D IOS was of iPS cell origin, we performed Y-chromosome fluorescence in situ hybridization (Y-FISH) with male mouse–specific DNA probes (Fig. 3C and fig. S5). Y-FISH–positive cells were observed in the transplantation area (including the skin epi-thelium, dermis, sebaceous glands, intracuta-neous adipose tissue, and hair follicles) of the cervical skin of recipient female mice. These results indicated that the bioengineered IOS could engraft in the cervical skin and revealed that it is of iPS cell origin. The engrafted hair follicle must establish proper connections with the surrounding tissues, such as the ar-rector pili muscles and nerve fibers. The hair follicles in the bioengineered 3D IOS had connected to calponin-positive arrector pili muscles in the correct polarization to iPS cell–
1Department of Biological Science and Technology, Graduate School of Industrial Science and Technology, Tokyo University of Science, Noda, Chiba 278-8510, Japan. 2Laboratory for Organ Regeneration, RIKEN Center for Developmental Biology, Kobe, Hyogo 650-0047, Japan. 3Organ Technologies Inc., Minato-ku, Tokyo 105-0001, Japan. 4Department of Regenerative Medicine, Plastic and Reconstructive Surgery, Kitasato University of Medicine, Sagamihara, Kanagawa 252-0374, Japan. 5Research Institute for Science and Technology, Tokyo University of Science, Noda, Chiba 278-8510, Japan. 6Division of Molecular and Regenerative Prosthodontics, Tohoku University Graduate School of Dentistry, Sendai, Miyagi 980-8575, Japan.*These authors contributed equally to this work.†Corresponding author. Email: [email protected]
Originally published 1 April 2016 in SCIENCE ADVANCES
BIOMEDICAL ENGINEERING
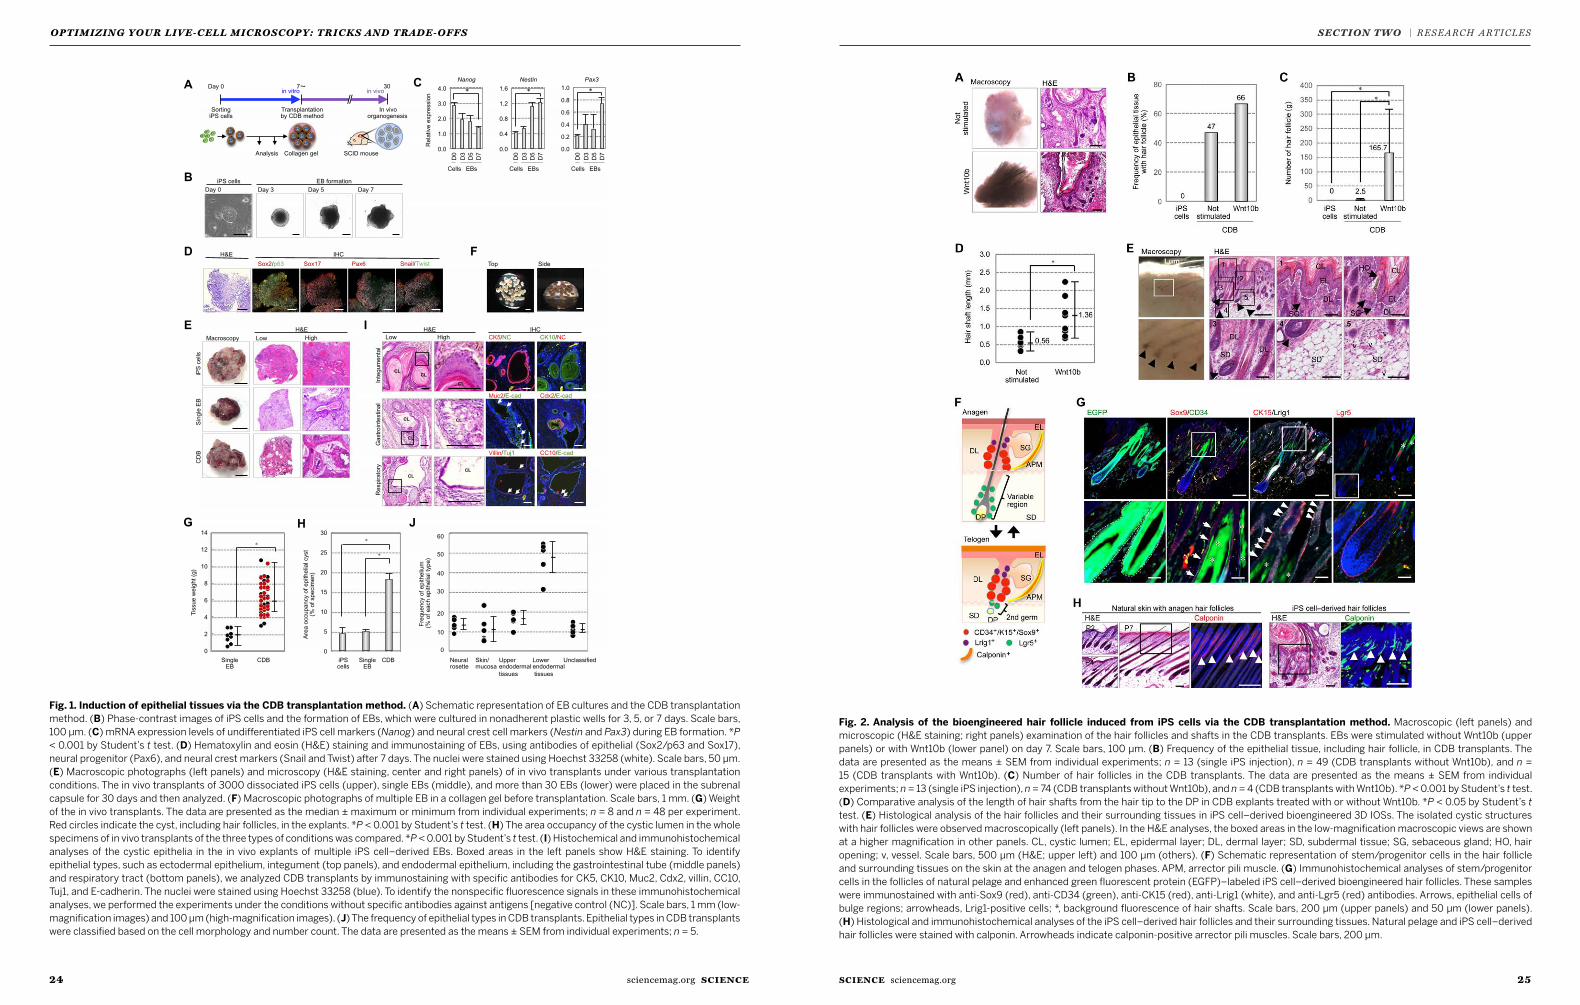
2524 SCIENCE sciencemag.orgsciencemag.org SCIENCE
OPTIMIZING YOUR LIVE-CELL MICROSCOP Y: TRICKS AND TRADE-OFFS SECTION TWO | RESEARCH ARTICLES
iPS cells B
E
Day 0
H&E IHC
Day 3 Day 7 Day 5 EB formation
C
Sorting iPS cells
Day 0
In vivo organogenesis
30in vivo
Analysis SCID mouse
Transplantation by CDB method
7in vitro
Collagen gel
Sin
gle
EB
Low High Macroscopy H&E
iPS
cel
ls
CD
B
A
Rel
ativ
e ex
pres
sion
H
0
2
4
6
8
10
12
14
Tiss
ue w
eigh
t (g)
Single EB
CDB
*
Are
a oc
cupa
ncy
of e
pith
elia
l cys
t (%
of s
peci
men
)
iPS cells
CDBSingleEB
0
5
10
15
20
25
30 *
*
Sox17 Sox2/ p63 Snail / Twist Pax6
J
Inte
gum
enta
lG
astr
oint
estin
alR
espi
rato
ry
CK10/NCCK5/NC
Muc2/E-cad Cdx2/E-cad
Villin/Tuj1 CC10/E-cad
I
CLCL
CL
CL
CLCL
CL
CL
Neural rosette
Skin/ mucosa
Upper endodermal tissues
UnclassifiedLower endodermal tissues
60
50
40
30
20
10
0
Fre
quen
cy o
f epi
thel
ium
(
% o
f eac
h ep
ithel
ial t
ype)
0.0
0.2
0.4
0.6
0.8
1.0 Pax3
0.0
1.0
2.0
3.0
4.0
Nanog
0.0
0.4
0.8
1.2
1.6
Nestin
Top Side
F
Low High H&E IHC
Cells
D3
D5
D7
EBs
D0
Cells
D3
D5
D7
EBs
D0
Cells
D3
D5
D7
EBs
D0
D
G
Fig. 1. Induction of epithelial tissues via the CDB transplantation method. (A) Schematic representation of EB cultures and the CDB transplantationmethod. (B) Phase-contrast images of iPS cells and the formation of EBs, which were cultured in nonadherent plastic wells for 3, 5, or 7 days. Scale bars, 100 mm.(C) mRNA expression levels of undifferentiated iPS cell markers (Nanog) and neural crest cell markers (Nestin and Pax3) during EB formation. *P < 0.001 byStudent’s t test. (D) Hematoxylin and eosin (H&E) staining and immunostaining of EBs, using antibodies of epithelial (Sox2/p63 and Sox17), neural progenitor(Pax6), and neural crest markers (Snail and Twist) after 7 days. The nuclei were stained using Hoechst 33258 (white). Scale bars, 50 mm. (E) Macroscopicphotographs (left panels) andmicroscopy (H&E staining, center and right panels) of in vivo transplants under various transplantation conditions. The in vivotransplants of 3000 dissociated iPS cells (upper), single EBs (middle), andmore than 30 EBs (lower) were placed in the subrenal capsule for 30 days and thenanalyzed. (F)Macroscopic photographs ofmultiple EB in a collagengel before transplantation. Scale bars, 1mm. (G)Weight of the in vivo transplants. Thedataare presented as themedian ±maximum orminimum from individual experiments; n = 8 and n = 48 per experiment. Red circles indicate the cyst, includinghair follicles, in the explants. *P < 0.001 by Student’s t test. (H) The area occupancy of the cystic lumen in the whole specimens of in vivo transplants of thethree types of conditions was compared. *P < 0.001 by Student’s t test. (I) Histochemical and immunohistochemical analyses of the cystic epithelia in the invivo explants of multiple iPS cell–derived EBs. Boxed areas in the left panels show H&E staining. To identify epithelial types, such as ectodermal epithelium,integument (top panels), and endodermal epithelium, including the gastrointestinal tube (middle panels) and respiratory tract (bottom panels), we analyzedCDB transplants by immunostaining with specific antibodies for CK5, CK10, Muc2, Cdx2, villin, CC10, Tuj1, and E-cadherin. The nuclei were stained usingHoechst 33258 (blue). To identify the nonspecific fluorescence signals in these immunohistochemical analyses, we performed the experiments underthe conditionswithout specific antibodies against antigens [negative control (NC)]. Scalebars, 1mm(low-magnification images) and100mm(high-magnificationimages). (J) The frequency of epithelial types in CDB transplants. Epithelial types in CDB transplants were classified based on the cell morphology and numbercount. The data are presented as the means ± SEM from individual experiments; n = 5.
R E S EARCH ART I C L E
Takagi et al. Sci. Adv. 2016; 2 : e1500887 1 April 2016 3 of 10
on April 5, 2016
http://advances.sciencemag.org/
Dow
nloaded from
Fig. 2. Analysis of the bioengineered hair follicle induced from iPS cells via the CDB transplantation method. (A) Macroscopic (left panels) andmicroscopic (H&E staining; right panels) examination of the hair follicles and shafts in the CDB transplants. EBs were stimulated without Wnt10b (upperpanels) or with Wnt10b (lower panel) on day 7. Scale bars, 100 mm. (B) Frequency of the epithelial tissue, including hair follicle, in CDB transplants. The dataare presented as the means ± SEM from individual experiments; n = 13 (single iPS injection), n = 49 (CDB transplants without Wnt10b), and n = 15 (CDBtransplants withWnt10b). (C) Number of hair follicles in the CDB transplants. The data are presented as themeans ± SEM from individual experiments; n= 13(single iPS injection), n = 74 (CDB transplants without Wnt10b), and n = 4 (CDB transplants with Wnt10b). *P < 0.001 by Student’s t test. (D) Comparativeanalysis of the length of hair shafts from the hair tip to the DP in CDB explants treated with or without Wnt10b. *P < 0.05 by Student’s t test. (E) Histologicalanalysis of the hair follicles and their surrounding tissues in iPS cell–derived bioengineered 3D IOSs. The isolated cystic structures with hair follicles wereobservedmacroscopically (left panels). In theH&E analyses, the boxed areas in the low-magnificationmacroscopic views are shown at a highermagnificationin other panels. CL, cystic lumen; EL, epidermal layer; DL, dermal layer; SD, subdermal tissue; SG, sebaceous gland; HO, hair opening; v, vessel. Scale bars,500 mm (H&E; upper left) and 100 mm (others). (F) Schematic representation of stem/progenitor cells in the hair follicle and surrounding tissues on the skin atthe anagen and telogen phases. APM, arrector pili muscle. (G) Immunohistochemical analyses of stem/progenitor cells in the follicles of natural pelage andenhanced green fluorescent protein (EGFP)–labeled iPS cell–derived bioengineered hair follicles. These samples were immunostained with anti-Sox9 (red),anti-CD34 (green), anti-CK15 (red), anti-Lrig1 (white), and anti-Lgr5 (red) antibodies. Arrows, epithelial cells of bulge regions; arrowheads, Lrig1-positivecells; *, background fluorescence of hair shafts. Scale bars, 200 mm (upper panels) and 50 mm (lower panels). (H) Histological and immunohistochemicalanalyses of the iPS cell–derived hair follicles and their surrounding tissues. Natural pelage and iPS cell–derived hair follicles were stained with calponin.Arrowheads indicate calponin-positive arrector pili muscles. Scale bars, 200 mm.
R E S EARCH ART I C L E
Takagi et al. Sci. Adv. 2016; 2 : e1500887 1 April 2016 4 of 10
on April 5, 2016
http://advances.sciencemag.org/
Dow
nloaded from
Fig. 1. Induction of epithelial tissues via the CDB transplantation method. (A) Schematic representation of EB cultures and the CDB transplantation method. (B) Phase-contrast images of iPS cells and the formation of EBs, which were cultured in nonadherent plastic wells for 3, 5, or 7 days. Scale bars, 100 µm. (C) mRNA expression levels of undifferentiated iPS cell markers (Nanog) and neural crest cell markers (Nestin and Pax3) during EB formation. *P < 0.001 by Student’s t test. (D) Hematoxylin and eosin (H&E) staining and immunostaining of EBs, using antibodies of epithelial (Sox2/p63 and Sox17), neural progenitor (Pax6), and neural crest markers (Snail and Twist) after 7 days. The nuclei were stained using Hoechst 33258 (white). Scale bars, 50 µm. (E) Macroscopic photographs (left panels) and microscopy (H&E staining, center and right panels) of in vivo transplants under various transplantation conditions. The in vivo transplants of 3000 dissociated iPS cells (upper), single EBs (middle), and more than 30 EBs (lower) were placed in the subrenal capsule for 30 days and then analyzed. (F) Macroscopic photographs of multiple EB in a collagen gel before transplantation. Scale bars, 1 mm. (G) Weight of the in vivo transplants. The data are presented as the median ± maximum or minimum from individual experiments; n = 8 and n = 48 per experiment. Red circles indicate the cyst, including hair follicles, in the explants. *P < 0.001 by Student’s t test. (H) The area occupancy of the cystic lumen in the whole specimens of in vivo transplants of the three types of conditions was compared. *P < 0.001 by Student’s t test. (I) Histochemical and immunohistochemical analyses of the cystic epithelia in the in vivo explants of multiple iPS cell–derived EBs. Boxed areas in the left panels show H&E staining. To identify epithelial types, such as ectodermal epithelium, integument (top panels), and endodermal epithelium, including the gastrointestinal tube (middle panels) and respiratory tract (bottom panels), we analyzed CDB transplants by immunostaining with specific antibodies for CK5, CK10, Muc2, Cdx2, villin, CC10, Tuj1, and E-cadherin. The nuclei were stained using Hoechst 33258 (blue). To identify the nonspecific fluorescence signals in these immunohistochemical analyses, we performed the experiments under the conditions without specific antibodies against antigens [negative control (NC)]. Scale bars, 1 mm (low-magnification images) and 100 µm (high-magnification images). (J) The frequency of epithelial types in CDB transplants. Epithelial types in CDB transplants were classified based on the cell morphology and number count. The data are presented as the means ± SEM from individual experiments; n = 5.
Fig. 2. Analysis of the bioengineered hair follicle induced from iPS cells via the CDB transplantation method. Macroscopic (left panels) and microscopic (H&E staining; right panels) examination of the hair follicles and shafts in the CDB transplants. EBs were stimulated without Wnt10b (upper panels) or with Wnt10b (lower panel) on day 7. Scale bars, 100 µm. (B) Frequency of the epithelial tissue, including hair follicle, in CDB transplants. The data are presented as the means ± SEM from individual experiments; n = 13 (single iPS injection), n = 49 (CDB transplants without Wnt10b), and n = 15 (CDB transplants with Wnt10b). (C) Number of hair follicles in the CDB transplants. The data are presented as the means ± SEM from individual experiments; n = 13 (single iPS injection), n = 74 (CDB transplants without Wnt10b), and n = 4 (CDB transplants with Wnt10b). *P < 0.001 by Student’s t test. (D) Comparative analysis of the length of hair shafts from the hair tip to the DP in CDB explants treated with or without Wnt10b. *P < 0.05 by Student’s t test. (E) Histological analysis of the hair follicles and their surrounding tissues in iPS cell–derived bioengineered 3D IOSs. The isolated cystic structures with hair follicles were observed macroscopically (left panels). In the H&E analyses, the boxed areas in the low-magnification macroscopic views are shown at a higher magnification in other panels. CL, cystic lumen; EL, epidermal layer; DL, dermal layer; SD, subdermal tissue; SG, sebaceous gland; HO, hair opening; v, vessel. Scale bars, 500 µm (H&E; upper left) and 100 µm (others). (F) Schematic representation of stem/progenitor cells in the hair follicle and surrounding tissues on the skin at the anagen and telogen phases. APM, arrector pili muscle. (G) Immunohistochemical analyses of stem/progenitor cells in the follicles of natural pelage and enhanced green fluorescent protein (EGFP)–labeled iPS cell–derived bioengineered hair follicles. These samples were immunostained with anti-Sox9 (red), anti-CD34 (green), anti-CK15 (red), anti-Lrig1 (white), and anti-Lgr5 (red) antibodies. Arrows, epithelial cells of bulge regions; arrowheads, Lrig1-positive cells; *, background fluorescence of hair shafts. Scale bars, 200 µm (upper panels) and 50 µm (lower panels). (H) Histological and immunohistochemical analyses of the iPS cell–derived hair follicles and their surrounding tissues. Natural pelage and iPS cell–derived hair follicles were stained with calponin. Arrowheads indicate calponin-positive arrector pili muscles. Scale bars, 200 µm.
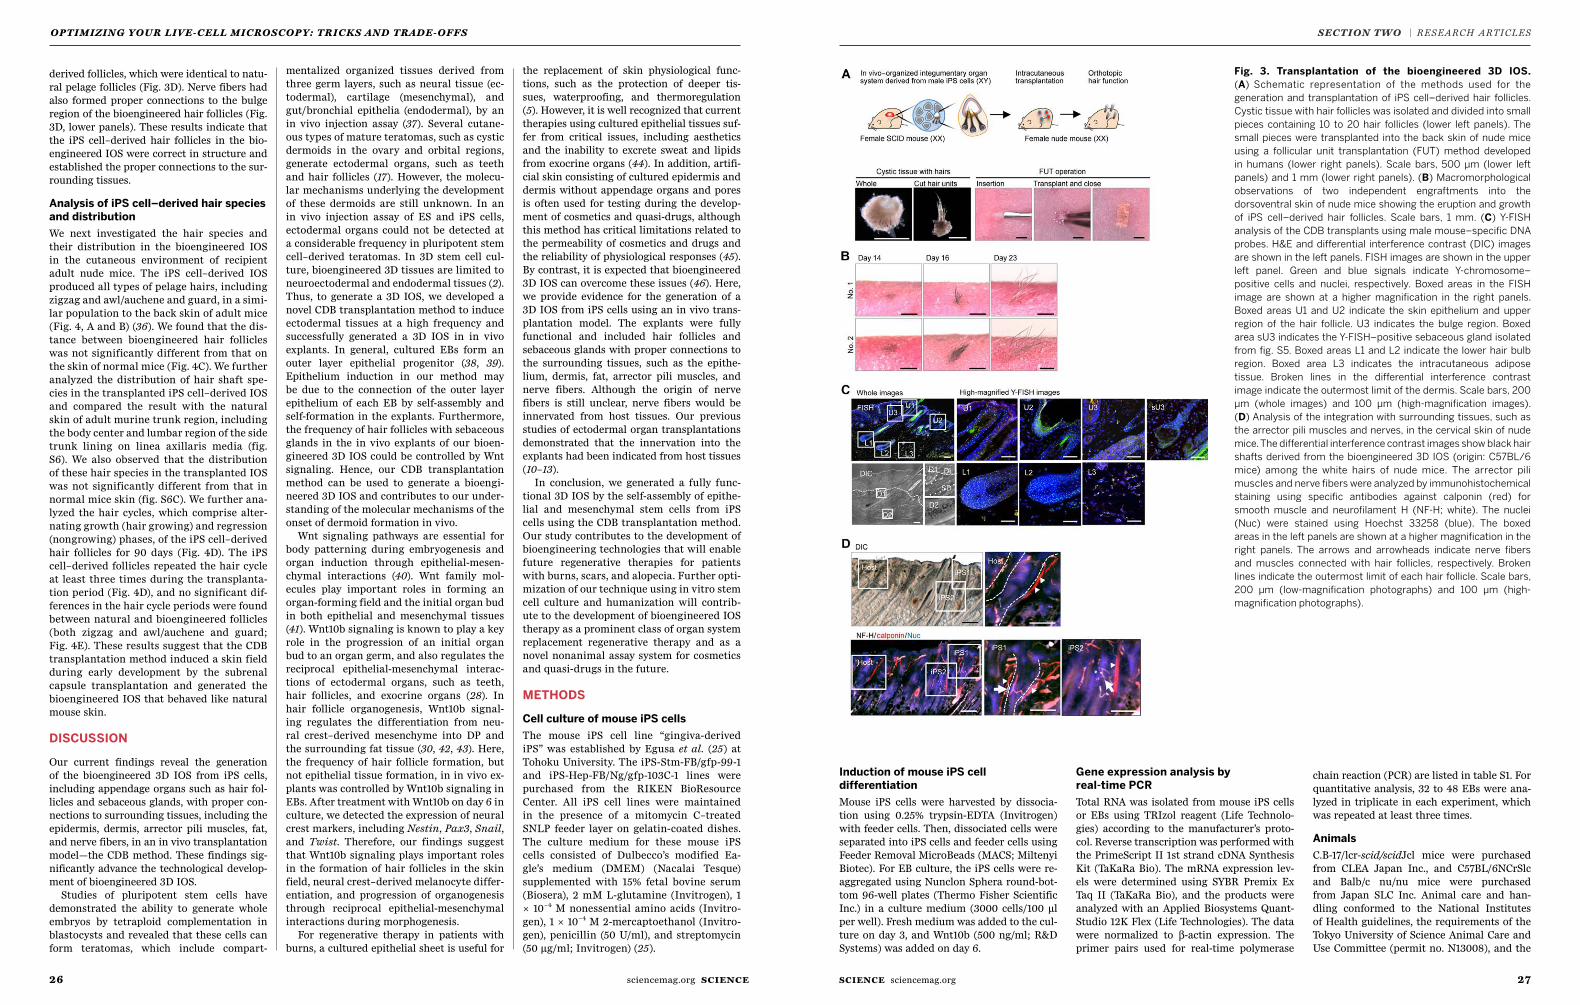
2726 SCIENCE sciencemag.orgsciencemag.org SCIENCE
OPTIMIZING YOUR LIVE-CELL MICROSCOP Y: TRICKS AND TRADE-OFFS SECTION TWO | RESEARCH ARTICLES
Fig. 3. Transplantation of the bioengineered 3D IOS. (A) Schematic representation of the methods used for the generation and transplantation of iPScell–derived hair follicles. Cystic tissue with hair follicles was isolated and divided into small pieces containing 10 to 20 hair follicles (lower left panels). Thesmall pieceswere transplanted into the back skin of nudemice using a follicular unit transplantation (FUT)methoddeveloped in humans (lower right panels).Scale bars, 500 mm (lower left panels) and 1 mm (lower right panels). (B) Macromorphological observations of two independent engraftments into thedorsoventral skin of nudemice showing the eruption and growth of iPS cell–derived hair follicles. Scale bars, 1mm. (C) Y-FISH analysis of the CDB transplantsusing male mouse–specific DNA probes. H&E and differential interference contrast (DIC) images are shown in the left panels. FISH images are shown in theupper left panel. Green and blue signals indicate Y-chromosome–positive cells and nuclei, respectively. Boxed areas in the FISH image are shown at a highermagnification in the right panels. Boxed areas U1 and U2 indicate the skin epithelium and upper region of the hair follicle. U3 indicates the bulge region.Boxed area sU3 indicates the Y-FISH–positive sebaceous gland isolated from fig. S5. Boxed areas L1 and L2 indicate the lower hair bulb region. Boxed area L3indicates the intracutaneous adipose tissue. Broken lines in the differential interference contrast image indicate the outermost limit of the dermis. Scale bars,200mm(whole images) and100mm(high-magnification images). (D) Analysis of the integrationwith surrounding tissues, such as the arrector pilimuscles andnerves, in the cervical skin of nudemice. The differential interference contrast images show black hair shafts derived from the bioengineered 3D IOS (origin:C57BL/6mice) among thewhite hairs of nudemice. The arrector pili muscles and nerve fiberswere analyzed by immunohistochemical staining using specificantibodies against calponin (red) for smoothmuscle andneurofilamentH (NF-H;white). The nuclei (Nuc)were stainedusingHoechst 33258 (blue). Theboxedareas in the left panels are shown at a highermagnification in the right panels. The arrows and arrowheads indicate nerve fibers andmuscles connectedwithhair follicles, respectively. Broken lines indicate theoutermost limit of eachhair follicle. Scale bars, 200mm(low-magnificationphotographs) and100mm(high-magnification photographs).
R E S EARCH ART I C L E
Takagi et al. Sci. Adv. 2016; 2 : e1500887 1 April 2016 6 of 10
on April 5, 2016
http://advances.sciencemag.org/
Dow
nloaded from
derived follicles, which were identical to natu-ral pelage follicles (Fig. 3D). Nerve fibers had also formed proper connections to the bulge region of the bioengineered hair follicles (Fig. 3D, lower panels). These results indicate that the iPS cell–derived hair follicles in the bio-engineered IOS were correct in structure and established the proper connections to the sur-rounding tissues.
Analysis of iPS cell–derived hair species and distributionWe next investigated the hair species and their distribution in the bioengineered IOS in the cutaneous environment of recipient adult nude mice. The iPS cell–derived IOS produced all types of pelage hairs, including zigzag and awl/auchene and guard, in a simi-lar population to the back skin of adult mice (Fig. 4, A and B) (36). We found that the dis-tance between bioengineered hair follicles was not significantly different from that on the skin of normal mice (Fig. 4C). We further analyzed the distribution of hair shaft spe-cies in the transplanted iPS cell–derived IOS and compared the result with the natural skin of adult murine trunk region, including the body center and lumbar region of the side trunk lining on linea axillaris media (fig. S6). We also observed that the distribution of these hair species in the transplanted IOS was not significantly different from that in normal mice skin (fig. S6C). We further ana-lyzed the hair cycles, which comprise alter-nating growth (hair growing) and regression (nongrowing) phases, of the iPS cell–derived hair follicles for 90 days (Fig. 4D). The iPS cell–derived follicles repeated the hair cycle at least three times during the transplanta-tion period (Fig. 4D), and no significant dif-ferences in the hair cycle periods were found between natural and bioengineered follicles (both zigzag and awl/auchene and guard; Fig. 4E). These results suggest that the CDB transplantation method induced a skin field during early development by the subrenal capsule transplantation and generated the bioengineered IOS that behaved like natural mouse skin.
DISCUSSION
Our current findings reveal the generation of the bioengineered 3D IOS from iPS cells, including appendage organs such as hair fol-licles and sebaceous glands, with proper con-nections to surrounding tissues, including the epidermis, dermis, arrector pili muscles, fat, and nerve fibers, in an in vivo transplantation model—the CDB method. These findings sig-nificantly advance the technological develop-ment of bioengineered 3D IOS.
Studies of pluripotent stem cells have demonstrated the ability to generate whole embryos by tetraploid complementation in blastocysts and revealed that these cells can form teratomas, which include compart-
mentalized organized tissues derived from three germ layers, such as neural tissue (ec-todermal), cartilage (mesenchymal), and gut/bronchial epithelia (endodermal), by an in vivo injection assay (37). Several cutane-ous types of mature teratomas, such as cystic dermoids in the ovary and orbital regions, generate ectodermal organs, such as teeth and hair follicles (17). However, the molecu-lar mechanisms underlying the development of these dermoids are still unknown. In an in vivo injection assay of ES and iPS cells, ectodermal organs could not be detected at a considerable frequency in pluripotent stem cell–derived teratomas. In 3D stem cell cul-ture, bioengineered 3D tissues are limited to neuroectodermal and endodermal tissues (2). Thus, to generate a 3D IOS, we developed a novel CDB transplantation method to induce ectodermal tissues at a high frequency and successfully generated a 3D IOS in in vivo explants. In general, cultured EBs form an outer layer epithelial progenitor (38, 39). Epithelium induction in our method may be due to the connection of the outer layer epithelium of each EB by self-assembly and self-formation in the explants. Furthermore, the frequency of hair follicles with sebaceous glands in the in vivo explants of our bioen-gineered 3D IOS could be controlled by Wnt signaling. Hence, our CDB transplantation method can be used to generate a bioengi-neered 3D IOS and contributes to our under-standing of the molecular mechanisms of the onset of dermoid formation in vivo.
Wnt signaling pathways are essential for body patterning during embryogenesis and organ induction through epithelial-mesen-chymal interactions (40). Wnt family mol-ecules play important roles in forming an organ-forming field and the initial organ bud in both epithelial and mesenchymal tissues (41). Wnt10b signaling is known to play a key role in the progression of an initial organ bud to an organ germ, and also regulates the reciprocal epithelial-mesenchymal interac-tions of ectodermal organs, such as teeth, hair follicles, and exocrine organs (28). In hair follicle organogenesis, Wnt10b signal-ing regulates the differentiation from neu-ral crest–derived mesenchyme into DP and the surrounding fat tissue (30, 42, 43). Here, the frequency of hair follicle formation, but not epithelial tissue formation, in in vivo ex-plants was controlled by Wnt10b signaling in EBs. After treatment with Wnt10b on day 6 in culture, we detected the expression of neural crest markers, including Nestin, Pax3, Snail, and Twist. Therefore, our findings suggest that Wnt10b signaling plays important roles in the formation of hair follicles in the skin field, neural crest–derived melanocyte differ-entiation, and progression of organogenesis through reciprocal epithelial-mesenchymal interactions during morphogenesis.
For regenerative therapy in patients with burns, a cultured epithelial sheet is useful for
the replacement of skin physiological func-tions, such as the protection of deeper tis-sues, waterproofing, and thermoregulation (5). However, it is well recognized that current therapies using cultured epithelial tissues suf-fer from critical issues, including aesthetics and the inability to excrete sweat and lipids from exocrine organs (44). In addition, artifi-cial skin consisting of cultured epidermis and dermis without appendage organs and pores is often used for testing during the develop-ment of cosmetics and quasi-drugs, although this method has critical limitations related to the permeability of cosmetics and drugs and the reliability of physiological responses (45). By contrast, it is expected that bioengineered 3D IOS can overcome these issues (46). Here, we provide evidence for the generation of a 3D IOS from iPS cells using an in vivo trans-plantation model. The explants were fully functional and included hair follicles and sebaceous glands with proper connections to the surrounding tissues, such as the epithe-lium, dermis, fat, arrector pili muscles, and nerve fibers. Although the origin of nerve fibers is still unclear, nerve fibers would be innervated from host tissues. Our previous studies of ectodermal organ transplantations demonstrated that the innervation into the explants had been indicated from host tissues (10–13).
In conclusion, we generated a fully func-tional 3D IOS by the self-assembly of epithe-lial and mesenchymal stem cells from iPS cells using the CDB transplantation method. Our study contributes to the development of bioengineering technologies that will enable future regenerative therapies for patients with burns, scars, and alopecia. Further opti-mization of our technique using in vitro stem cell culture and humanization will contrib-ute to the development of bioengineered IOS therapy as a prominent class of organ system replacement regenerative therapy and as a novel nonanimal assay system for cosmetics and quasi-drugs in the future.
METHODS
Cell culture of mouse iPS cellsThe mouse iPS cell line “gingiva-derived iPS” was established by Egusa et al. (25) at Tohoku University. The iPS-Stm-FB/gfp-99-1 and iPS-Hep-FB/Ng/gfp-103C-1 lines were purchased from the RIKEN BioResource Center. All iPS cell lines were maintained in the presence of a mitomycin C–treated SNLP feeder layer on gelatin-coated dishes. The culture medium for these mouse iPS cells consisted of Dulbecco’s modified Ea-gle’s medium (DMEM) (Nacalai Tesque) supplemented with 15% fetal bovine serum (Biosera), 2 mM L-glutamine (Invitrogen), 1 × 10⁻⁴ M nonessential amino acids (Invitro-gen), 1 × 10⁻⁴ M 2-mercaptoethanol (Invitro-gen), penicillin (50 U/ml), and streptomycin (50 µg/ml; Invitrogen) (25).
Fig. 3. Transplantation of the bioengineered 3D IOS. (A) Schematic representation of the methods used for the generation and transplantation of iPS cell–derived hair follicles. Cystic tissue with hair follicles was isolated and divided into small pieces containing 10 to 20 hair follicles (lower left panels). The small pieces were transplanted into the back skin of nude mice using a follicular unit transplantation (FUT) method developed in humans (lower right panels). Scale bars, 500 µm (lower left panels) and 1 mm (lower right panels). (B) Macromorphological observations of two independent engraftments into the dorsoventral skin of nude mice showing the eruption and growth of iPS cell–derived hair follicles. Scale bars, 1 mm. (C) Y-FISH analysis of the CDB transplants using male mouse–specific DNA probes. H&E and differential interference contrast (DIC) images are shown in the left panels. FISH images are shown in the upper left panel. Green and blue signals indicate Y-chromosome–positive cells and nuclei, respectively. Boxed areas in the FISH image are shown at a higher magnification in the right panels. Boxed areas U1 and U2 indicate the skin epithelium and upper region of the hair follicle. U3 indicates the bulge region. Boxed area sU3 indicates the Y-FISH–positive sebaceous gland isolated from fig. S5. Boxed areas L1 and L2 indicate the lower hair bulb region. Boxed area L3 indicates the intracutaneous adipose tissue. Broken lines in the differential interference contrast image indicate the outermost limit of the dermis. Scale bars, 200 µm (whole images) and 100 µm (high-magnification images). (D) Analysis of the integration with surrounding tissues, such as the arrector pili muscles and nerves, in the cervical skin of nude mice. The differential interference contrast images show black hair shafts derived from the bioengineered 3D IOS (origin: C57BL/6 mice) among the white hairs of nude mice. The arrector pili muscles and nerve fibers were analyzed by immunohistochemical staining using specific antibodies against calponin (red) for smooth muscle and neurofilament H (NF-H; white). The nuclei (Nuc) were stained using Hoechst 33258 (blue). The boxed areas in the left panels are shown at a higher magnification in the right panels. The arrows and arrowheads indicate nerve fibers and muscles connected with hair follicles, respectively. Broken lines indicate the outermost limit of each hair follicle. Scale bars, 200 µm (low-magnification photographs) and 100 µm (high-magnification photographs).
Induction of mouse iPS cell differentiationMouse iPS cells were harvested by dissocia-tion using 0.25% trypsin-EDTA (Invitrogen) with feeder cells. Then, dissociated cells were separated into iPS cells and feeder cells using Feeder Removal MicroBeads (MACS; Miltenyi Biotec). For EB culture, the iPS cells were re-aggregated using Nunclon Sphera round-bot-tom 96-well plates (Thermo Fisher Scientific Inc.) in a culture medium (3000 cells/100 µl per well). Fresh medium was added to the cul-ture on day 3, and Wnt10b (500 ng/ml; R&D Systems) was added on day 6.
Gene expression analysis by real-time PCRTotal RNA was isolated from mouse iPS cells or EBs using TRIzol reagent (Life Technolo-gies) according to the manufacturer’s proto-col. Reverse transcription was performed with the PrimeScript II 1st strand cDNA Synthesis Kit (TaKaRa Bio). The mRNA expression lev-els were determined using SYBR Premix Ex Taq II (TaKaRa Bio), and the products were analyzed with an Applied Biosystems Quant-Studio 12K Flex (Life Technologies). The data were normalized to β-actin expression. The primer pairs used for real-time polymerase
chain reaction (PCR) are listed in table S1. For quantitative analysis, 32 to 48 EBs were ana-lyzed in triplicate in each experiment, which was repeated at least three times.
AnimalsC.B-17/lcr-scid/scidJcl mice were purchased from CLEA Japan Inc., and C57BL/6NCrSlc and Balb/c nu/nu mice were purchased from Japan SLC Inc. Animal care and han-dling conformed to the National Institutes of Health guidelines, the requirements of the Tokyo University of Science Animal Care and Use Committee (permit no. N13008), and the
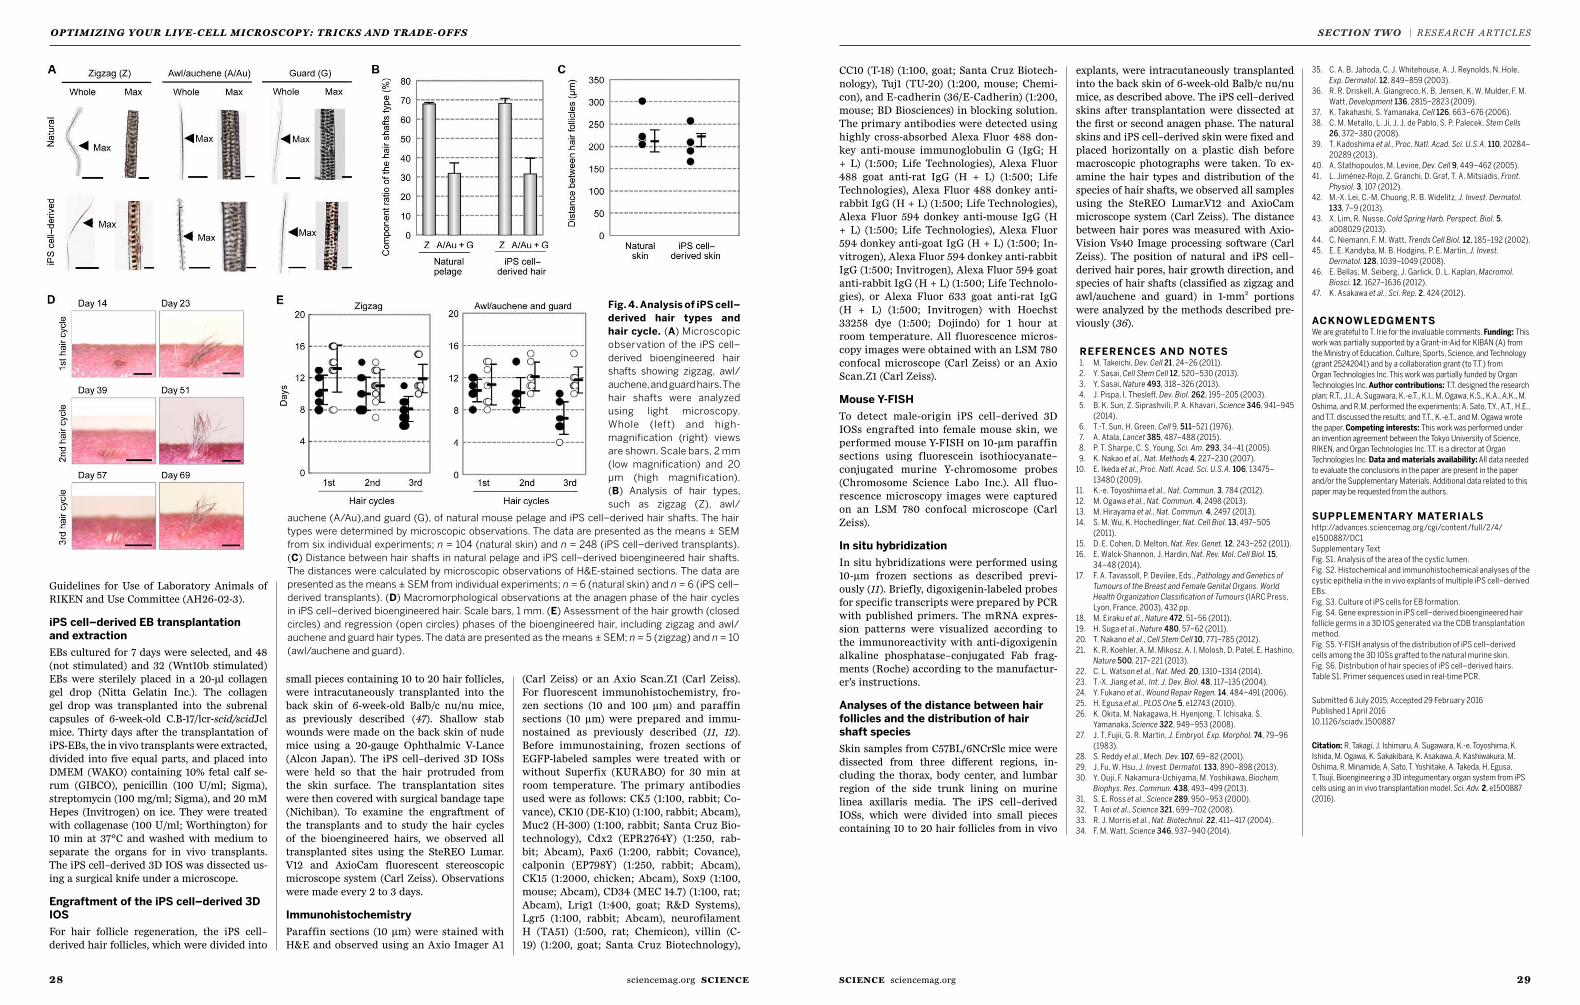
2928 SCIENCE sciencemag.orgsciencemag.org SCIENCE
OPTIMIZING YOUR LIVE-CELL MICROSCOP Y: TRICKS AND TRADE-OFFS SECTION TWO | RESEARCH ARTICLES
markers, including Nestin, Pax3, Snail, and Twist. Therefore, our findingssuggest that Wnt10b signaling plays important roles in the formation ofhair follicles in the skin field, neural crest–derived melanocyte differentia-tion, and progression of organogenesis through reciprocal epithelial-mesenchymal interactions during morphogenesis.
For regenerative therapy in patients with burns, a cultured epithelialsheet is useful for the replacement of skin physiological functions, suchas the protection of deeper tissues, waterproofing, and thermoregulation(5). However, it is well recognized that current therapies using culturedepithelial tissues suffer from critical issues, including aesthetics and theinability to excrete sweat and lipids from exocrine organs (44). In ad-dition, artificial skin consisting of cultured epidermis anddermiswith-out appendage organs and pores is often used for testing during the
development of cosmetics and quasi-drugs, although this method hascritical limitations related to the permeability of cosmetics and drugs andthe reliability of physiological responses (45). By contrast, it is expectedthat bioengineered 3D IOS can overcome these issues (46). Here, weprovide evidence for the generation of a 3D IOS from iPS cells using anin vivo transplantationmodel. The explants were fully functional and in-cluded hair follicles and sebaceous glands with proper connections to thesurrounding tissues, such as the epithelium, dermis, fat, arrector pilimuscles, and nerve fibers. Although the origin of nerve fibers is stillunclear, nerve fibers would be innervated from host tissues. Our pre-vious studies of ectodermal organ transplantations demonstratedthat the innervation into the explants had been indicated from hosttissues (10–13).
Fig. 4. Analysis of iPS cell–derived hair types and hair cycle. (A) Microscopic observation of the iPS cell–derived bioengineered hair shafts showingzigzag, awl/auchene, andguard hairs. Thehair shaftswere analyzedusing lightmicroscopy.Whole (left) andhigh-magnification (right) views are shown. Scalebars, 2 mm (low magnification) and 20 mm (high magnification). (B) Analysis of hair types, such as zigzag (Z), awl/auchene (A/Au), and guard (G), of naturalmousepelage and iPS cell–derivedhair shafts. Thehair typesweredeterminedbymicroscopic observations. Thedata arepresented as themeans± SEM fromsix individual experiments; n = 104 (natural skin) and n = 248 (iPS cell–derived transplants). (C) Distance between hair shafts in natural pelage and iPS cell–derived bioengineered hair shafts. The distances were calculated bymicroscopic observations of H&E-stained sections. The data are presented as the means ±SEM from individual experiments; n = 6 (natural skin) and n = 6 (iPS cell–derived transplants). (D) Macromorphological observations at the anagen phaseof the hair cycles in iPS cell–derived bioengineered hair. Scale bars, 1 mm. (E) Assessment of the hair growth (closed circles) and regression (open circles)phases of the bioengineered hair, including zigzag and awl/auchene and guard hair types. The data are presented as the means ± SEM; n = 5 (zigzag)and n = 10 (awl/auchene and guard).
R E S EARCH ART I C L E
Takagi et al. Sci. Adv. 2016; 2 : e1500887 1 April 2016 7 of 10
on April 5, 2016
http://advances.sciencemag.org/
Dow
nloaded from
Guidelines for Use of Laboratory Animals of RIKEN and Use Committee (AH26-02-3).
iPS cell–derived EB transplantation and extractionEBs cultured for 7 days were selected, and 48 (not stimulated) and 32 (Wnt10b stimulated) EBs were sterilely placed in a 20-µl collagen gel drop (Nitta Gelatin Inc.). The collagen gel drop was transplanted into the subrenal capsules of 6-week-old C.B-17/lcr-scid/scidJcl mice. Thirty days after the transplantation of iPS-EBs, the in vivo transplants were extracted, divided into five equal parts, and placed into DMEM (WAKO) containing 10% fetal calf se-rum (GIBCO), penicillin (100 U/ml; Sigma), streptomycin (100 mg/ml; Sigma), and 20 mM Hepes (Invitrogen) on ice. They were treated with collagenase (100 U/ml; Worthington) for 10 min at 37°C and washed with medium to separate the organs for in vivo transplants. The iPS cell–derived 3D IOS was dissected us-ing a surgical knife under a microscope.
Engraftment of the iPS cell–derived 3D IOSFor hair follicle regeneration, the iPS cell–derived hair follicles, which were divided into
small pieces containing 10 to 20 hair follicles, were intracutaneously transplanted into the back skin of 6-week-old Balb/c nu/nu mice, as previously described (47). Shallow stab wounds were made on the back skin of nude mice using a 20-gauge Ophthalmic V-Lance (Alcon Japan). The iPS cell–derived 3D IOSs were held so that the hair protruded from the skin surface. The transplantation sites were then covered with surgical bandage tape (Nichiban). To examine the engraftment of the transplants and to study the hair cycles of the bioengineered hairs, we observed all transplanted sites using the SteREO Lumar.V12 and AxioCam fluorescent stereoscopic microscope system (Carl Zeiss). Observations were made every 2 to 3 days.
ImmunohistochemistryParaffin sections (10 µm) were stained with H&E and observed using an Axio Imager A1
(Carl Zeiss) or an Axio Scan.Z1 (Carl Zeiss). For fluorescent immunohistochemistry, fro-zen sections (10 and 100 µm) and paraffin sections (10 µm) were prepared and immu-nostained as previously described (11, 12). Before immunostaining, frozen sections of EGFP-labeled samples were treated with or without Superfix (KURABO) for 30 min at room temperature. The primary antibodies used were as follows: CK5 (1:100, rabbit; Co-vance), CK10 (DE-K10) (1:100, rabbit; Abcam), Muc2 (H-300) (1:100, rabbit; Santa Cruz Bio-technology), Cdx2 (EPR2764Y) (1:250, rab-bit; Abcam), Pax6 (1:200, rabbit; Covance), calponin (EP798Y) (1:250, rabbit; Abcam), CK15 (1:2000, chicken; Abcam), Sox9 (1:100, mouse; Abcam), CD34 (MEC 14.7) (1:100, rat; Abcam), Lrig1 (1:400, goat; R&D Systems), Lgr5 (1:100, rabbit; Abcam), neurofilament H (TA51) (1:500, rat; Chemicon), villin (C-19) (1:200, goat; Santa Cruz Biotechnology),
CC10 (T-18) (1:100, goat; Santa Cruz Biotech-nology), Tuj1 (TU-20) (1:200, mouse; Chemi-con), and E-cadherin (36/E-Cadherin) (1:200, mouse; BD Biosciences) in blocking solution. The primary antibodies were detected using highly cross-absorbed Alexa Fluor 488 don-key anti-mouse immunoglobulin G (IgG; H + L) (1:500; Life Technologies), Alexa Fluor 488 goat anti-rat IgG (H + L) (1:500; Life Technologies), Alexa Fluor 488 donkey anti-rabbit IgG (H + L) (1:500; Life Technologies), Alexa Fluor 594 donkey anti-mouse IgG (H + L) (1:500; Life Technologies), Alexa Fluor 594 donkey anti-goat IgG (H + L) (1:500; In-vitrogen), Alexa Fluor 594 donkey anti-rabbit IgG (1:500; Invitrogen), Alexa Fluor 594 goat anti-rabbit IgG (H + L) (1:500; Life Technolo-gies), or Alexa Fluor 633 goat anti-rat IgG (H + L) (1:500; Invitrogen) with Hoechst 33258 dye (1:500; Dojindo) for 1 hour at room temperature. All fluorescence micros-copy images were obtained with an LSM 780 confocal microscope (Carl Zeiss) or an Axio Scan.Z1 (Carl Zeiss).
Mouse Y-FISHTo detect male-origin iPS cell–derived 3D IOSs engrafted into female mouse skin, we performed mouse Y-FISH on 10-µm paraffin sections using fluorescein isothiocyanate–conjugated murine Y-chromosome probes (Chromosome Science Labo Inc.). All fluo-rescence microscopy images were captured on an LSM 780 confocal microscope (Carl Zeiss).
In situ hybridizationIn situ hybridizations were performed using 10-µm frozen sections as described previ-ously (11). Briefly, digoxigenin-labeled probes for specific transcripts were prepared by PCR with published primers. The mRNA expres-sion patterns were visualized according to the immunoreactivity with anti-digoxigenin alkaline phosphatase–conjugated Fab frag-ments (Roche) according to the manufactur-er’s instructions.
Analyses of the distance between hair follicles and the distribution of hair shaft speciesSkin samples from C57BL/6NCrSlc mice were dissected from three different regions, in-cluding the thorax, body center, and lumbar region of the side trunk lining on murine linea axillaris media. The iPS cell–derived IOSs, which were divided into small pieces containing 10 to 20 hair follicles from in vivo
explants, were intracutaneously transplanted into the back skin of 6-week-old Balb/c nu/nu mice, as described above. The iPS cell–derived skins after transplantation were dissected at the first or second anagen phase. The natural skins and iPS cell–derived skin were fixed and placed horizontally on a plastic dish before macroscopic photographs were taken. To ex-amine the hair types and distribution of the species of hair shafts, we observed all samples using the SteREO Lumar.V12 and AxioCam microscope system (Carl Zeiss). The distance between hair pores was measured with Axio-Vision Vs40 Image processing software (Carl Zeiss). The position of natural and iPS cell–derived hair pores, hair growth direction, and species of hair shafts (classified as zigzag and awl/auchene and guard) in 1-mm2 portions were analyzed by the methods described pre-viously (36).
REFERENCES AND NOTES 1. M. Takeichi, Dev. Cell 21, 24–26 (2011).
2. Y. Sasai, Cell Stem Cell 12, 520–530 (2013). 3. Y. Sasai, Nature 493, 318–326 (2013). 4. J. Pispa, I. Thesle£, Dev. Biol. 262, 195–205 (2003). 5. B. K. Sun, Z. Siprashvili, P. A. Khavari, Science 346, 941–945
(2014). 6. T.-T. Sun, H. Green, Cell 9, 511–521 (1976). 7. A. Atala, Lancet 385, 487–488 (2015). 8. P. T. Sharpe, C. S. Young, Sci. Am. 293, 34–41 (2005). 9. K. Nakao et al., Nat. Methods 4, 227–230 (2007).10. E. Ikeda et al., Proc. Natl. Acad. Sci. U.S.A. 106, 13475–
13480 (2009).11. K.-e. Toyoshima et al., Nat. Commun. 3, 784 (2012).12. M. Ogawa et al., Nat. Commun. 4, 2498 (2013).13. M. Hirayama et al., Nat. Commun. 4, 2497 (2013).14. S. M. Wu, K. Hochedlinger, Nat. Cell Biol. 13, 497–505
(2011).15. D. E. Cohen, D. Melton, Nat. Rev. Genet. 12, 243–252 (2011).16. E. Walck-Shannon, J. Hardin, Nat. Rev. Mol. Cell Biol. 15,
34–48 (2014).17. F. A. Tavassoll, P. Devilee, Eds., Pathology and Genetics of
Tumours of the Breast and Female Genital Organs. World Health Organization Classi�cation of Tumours (IARC Press, Lyon, France, 2003), 432 pp.
18. M. Eiraku et al., Nature 472, 51–56 (2011).19. H. Suga et al., Nature 480, 57–62 (2011).20. T. Nakano et al., Cell Stem Cell 10, 771–785 (2012).21. K. R. Koehler, A. M. Mikosz, A. I. Molosh, D. Patel, E. Hashino,
Nature 500, 217–221 (2013).22. C. L. Watson et al., Nat. Med. 20, 1310–1314 (2014).23. T.-X. Jiang et al., Int. J. Dev. Biol. 48, 117–135 (2004).24. Y. Fukano et al., Wound Repair Regen. 14, 484–491 (2006).25. H. Egusa et al., PLOS One 5, e12743 (2010).26. K. Okita, M. Nakagawa, H. Hyenjong, T. Ichisaka, S.
Yamanaka, Science 322, 949–953 (2008).27. J. T. Fujii, G. R. Martin, J. Embryol. Exp. Morphol. 74, 79–96
(1983).28. S. Reddy et al., Mech. Dev. 107, 69–82 (2001).29. J. Fu, W. Hsu, J. Invest. Dermatol. 133, 890–898 (2013).30. Y. Ouji, F. Nakamura-Uchiyama, M. Yoshikawa, Biochem.
Biophys. Res. Commun. 438, 493–499 (2013).31. S. E. Ross et al., Science 289, 950–953 (2000).32. T. Aoi et al., Science 321, 699–702 (2008).33. R. J. Morris et al., Nat. Biotechnol. 22, 411–417 (2004).34. F. M. Watt, Science 346, 937–940 (2014).
35. C. A. B. Jahoda, C. J. Whitehouse, A. J. Reynolds, N. Hole, Exp. Dermatol. 12, 849–859 (2003).
36. R. R. Driskell, A. Giangreco, K. B. Jensen, K. W. Mulder, F. M. Watt, Development 136, 2815–2823 (2009).
37. K. Takahashi, S. Yamanaka, Cell 126, 663–676 (2006).38. C. M. Metallo, L. Ji, J. J. de Pablo, S. P. Palecek, Stem Cells
26, 372–380 (2008).39. T. Kadoshima et al., Proc. Natl. Acad. Sci. U.S.A. 110, 20284–
20289 (2013).40. A. Stathopoulos, M. Levine, Dev. Cell 9, 449–462 (2005).41. L. Jiménez-Rojo, Z. Granchi, D. Graf, T. A. Mitsiadis, Front.
Physiol. 3, 107 (2012).42. M.-X. Lei, C.-M. Chuong, R. B. Widelitz, J. Invest. Dermatol.
133, 7–9 (2013).43. X. Lim, R. Nusse, Cold Spring Harb. Perspect. Biol. 5,
a008029 (2013).44. C. Niemann, F. M. Watt, Trends Cell Biol. 12, 185–192 (2002).45. E. E. Kandyba, M. B. Hodgins, P. E. Martin, J. Invest.
Dermatol. 128, 1039–1049 (2008).46. E. Bellas, M. Seiberg, J. Garlick, D. L. Kaplan, Macromol.
Biosci. 12, 1627–1636 (2012).47. K. Asakawa et al., Sci. Rep. 2, 424 (2012).
ACKNOWLEDGMENTSWe are grateful to T. Irie for the invaluable comments. Funding: This work was partially supported by a Grant-in-Aid for KIBAN (A) from the Ministry of Education, Culture, Sports, Science, and Technology (grant 25242041) and by a collaboration grant (to T.T.) from Organ Technologies Inc. This work was partially funded by Organ Technologies Inc. Author contributions: T.T. designed the research plan; R.T., J.I., A. Sugawara, K.-e.T., K.I., M. Ogawa, K.S., K.A., A.K., M. Oshima, and R.M. performed the experiments; A. Sato, T.Y., A.T., H.E., and T.T. discussed the results; and T.T., K.-e.T., and M. Ogawa wrote the paper. Competing interests: This work was performed under an invention agreement between the Tokyo University of Science, RIKEN, and Organ Technologies Inc. T.T. is a director at Organ Technologies Inc. Data and materials availability: All data needed to evaluate the conclusions in the paper are present in the paper and/or the Supplementary Materials. Additional data related to this paper may be requested from the authors.
SUPPLEMENTARY MATERIALS http://advances.sciencemag.org/cgi/content/full/2/4/e1500887/DC1Supplementary TextFig. S1. Analysis of the area of the cystic lumen.Fig. S2. Histochemical and immunohistochemical analyses of the cystic epithelia in the in vivo explants of multiple iPS cell–derived EBs.Fig. S3. Culture of iPS cells for EB formation.Fig. S4. Gene expression in iPS cell–derived bioengineered hair follicle germs in a 3D IOS generated via the CDB transplantation method.Fig. S5. Y-FISH analysis of the distribution of iPS cell–derived cells among the 3D IOSs grafted to the natural murine skin.Fig. S6. Distribution of hair species of iPS cell–derived hairs.Table S1. Primer sequences used in real-time PCR.
Submitted 6 July 2015; Accepted 29 February 2016Published 1 April 201610.1126/sciadv.1500887
Citation: R. Takagi, J. Ishimaru, A. Sugawara, K.-e. Toyoshima, K. Ishida, M. Ogawa, K. Sakakibara, K. Asakawa, A. Kashiwakura, M. Oshima, R. Minamide, A. Sato, T. Yoshitake, A. Takeda, H. Egusa,T. Tsuji, Bioengineering a 3D integumentary organ system from iPS cells using an in vivo transplantation model. Sci. Adv. 2, e1500887 (2016).
auchene (A/Au),and guard (G), of natural mouse pelage and iPS cell–derived hair shafts. The hair types were determined by microscopic observations. The data are presented as the means ± SEM from six individual experiments; n = 104 (natural skin) and n = 248 (iPS cell–derived transplants). (C) Distance between hair shafts in natural pelage and iPS cell–derived bioengineered hair shafts. The distances were calculated by microscopic observations of H&E-stained sections. The data are presented as the means ± SEM from individual experiments; n = 6 (natural skin) and n = 6 (iPS cell–derived transplants). (D) Macromorphological observations at the anagen phase of the hair cycles in iPS cell–derived bioengineered hair. Scale bars, 1 mm. (E) Assessment of the hair growth (closed circles) and regression (open circles) phases of the bioengineered hair, including zigzag and awl/auchene and guard hair types. The data are presented as the means ± SEM; n = 5 (zigzag) and n = 10 (awl/auchene and guard).
markers, including Nestin, Pax3, Snail, and Twist. Therefore, our findingssuggest that Wnt10b signaling plays important roles in the formation ofhair follicles in the skin field, neural crest–derived melanocyte differentia-tion, and progression of organogenesis through reciprocal epithelial-mesenchymal interactions during morphogenesis.
For regenerative therapy in patients with burns, a cultured epithelialsheet is useful for the replacement of skin physiological functions, suchas the protection of deeper tissues, waterproofing, and thermoregulation(5). However, it is well recognized that current therapies using culturedepithelial tissues suffer from critical issues, including aesthetics and theinability to excrete sweat and lipids from exocrine organs (44). In ad-dition, artificial skin consisting of cultured epidermis anddermiswith-out appendage organs and pores is often used for testing during the
development of cosmetics and quasi-drugs, although this method hascritical limitations related to the permeability of cosmetics and drugs andthe reliability of physiological responses (45). By contrast, it is expectedthat bioengineered 3D IOS can overcome these issues (46). Here, weprovide evidence for the generation of a 3D IOS from iPS cells using anin vivo transplantationmodel. The explants were fully functional and in-cluded hair follicles and sebaceous glands with proper connections to thesurrounding tissues, such as the epithelium, dermis, fat, arrector pilimuscles, and nerve fibers. Although the origin of nerve fibers is stillunclear, nerve fibers would be innervated from host tissues. Our pre-vious studies of ectodermal organ transplantations demonstratedthat the innervation into the explants had been indicated from hosttissues (10–13).
Fig. 4. Analysis of iPS cell–derived hair types and hair cycle. (A) Microscopic observation of the iPS cell–derived bioengineered hair shafts showingzigzag, awl/auchene, andguard hairs. Thehair shaftswere analyzedusing lightmicroscopy.Whole (left) andhigh-magnification (right) views are shown. Scalebars, 2 mm (low magnification) and 20 mm (high magnification). (B) Analysis of hair types, such as zigzag (Z), awl/auchene (A/Au), and guard (G), of naturalmousepelage and iPS cell–derivedhair shafts. Thehair typesweredeterminedbymicroscopic observations. Thedata arepresented as themeans± SEM fromsix individual experiments; n = 104 (natural skin) and n = 248 (iPS cell–derived transplants). (C) Distance between hair shafts in natural pelage and iPS cell–derived bioengineered hair shafts. The distances were calculated bymicroscopic observations of H&E-stained sections. The data are presented as the means ±SEM from individual experiments; n = 6 (natural skin) and n = 6 (iPS cell–derived transplants). (D) Macromorphological observations at the anagen phaseof the hair cycles in iPS cell–derived bioengineered hair. Scale bars, 1 mm. (E) Assessment of the hair growth (closed circles) and regression (open circles)phases of the bioengineered hair, including zigzag and awl/auchene and guard hair types. The data are presented as the means ± SEM; n = 5 (zigzag)and n = 10 (awl/auchene and guard).
R E S EARCH ART I C L E
Takagi et al. Sci. Adv. 2016; 2 : e1500887 1 April 2016 7 of 10
on April 5, 2016
http://advances.sciencemag.org/
Dow
nloaded from
Fig. 4. Analysis of iPS cell–derived hair types and hair cycle. (A) Microscopic observation of the iPS cell–derived bioengineered hair shafts showing zigzag, awl/auchene, and guard hairs. The hair shafts were analyzed using light microscopy. Whole (left) and high-magnification (right) views are shown. Scale bars, 2 mm (low magnification) and 20 µm (high magnification).(B) Analysis of hair types, such as zigzag (Z), awl/
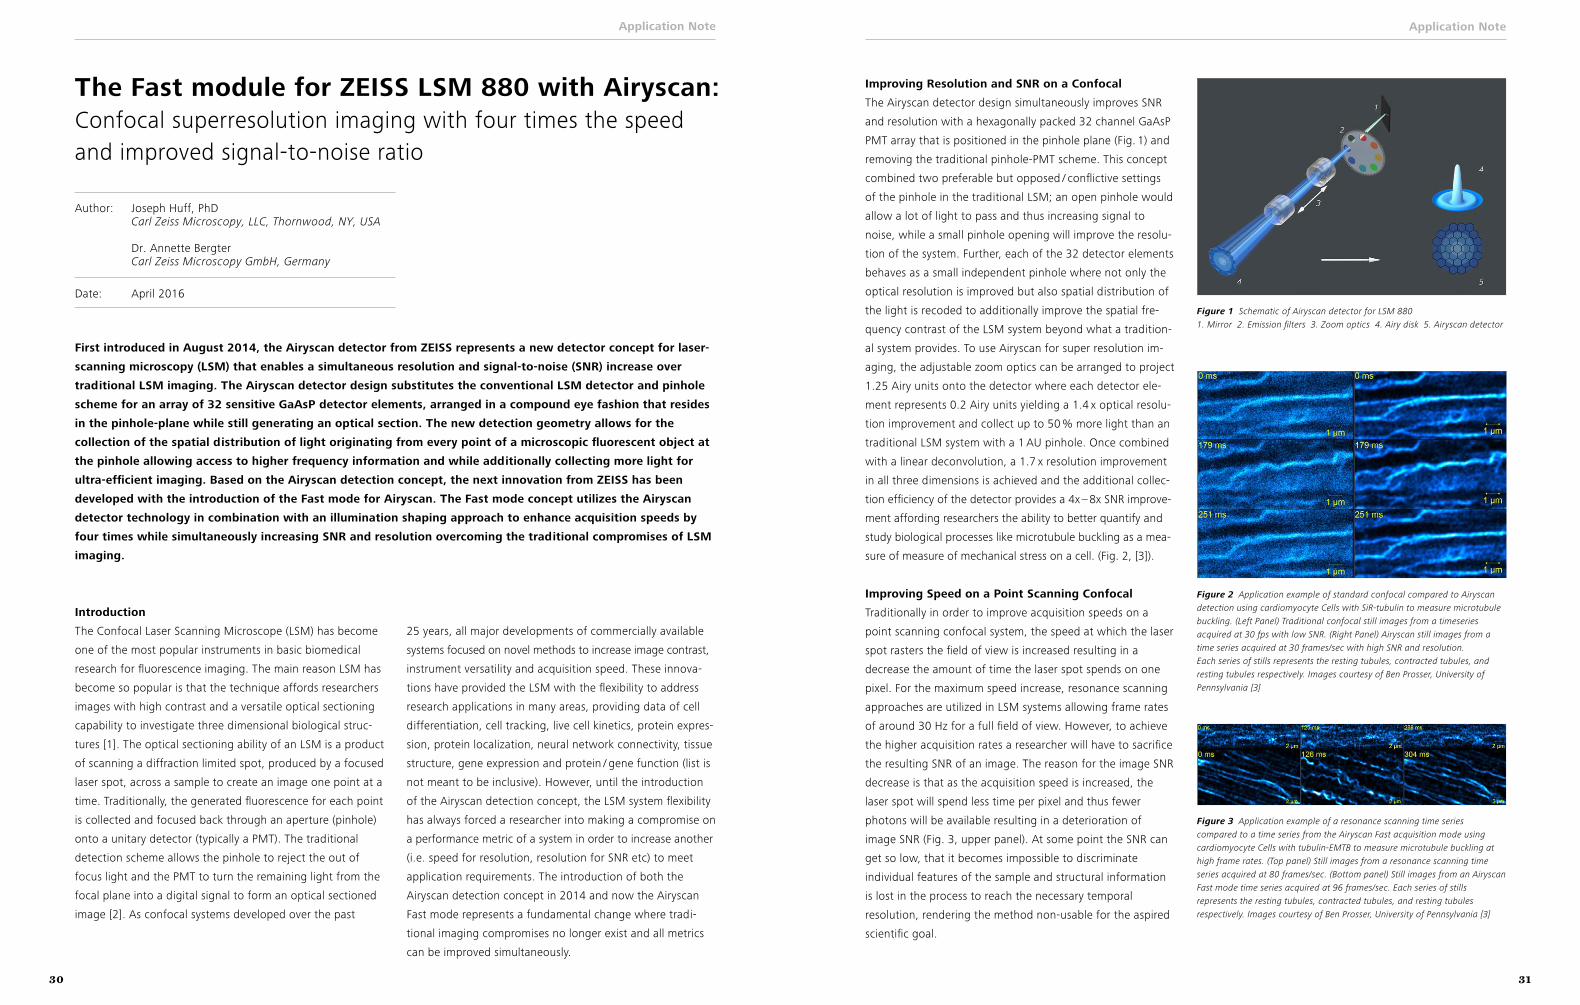
Application Note
2
The Fast module for ZEISS LSM 880 with Airyscan:Confocal superresolution imaging with four times the speed and improved signal-to-noise ratio
First introduced in August 2014, the Airyscan detector from ZEISS represents a new detector concept for laser-
scanning microscopy (LSM) that enables a simultaneous resolution and signal-to-noise (SNR) increase over
traditional LSM imaging. The Airyscan detector design substitutes the conventional LSM detector and pinhole
scheme for an array of 32 sensitive GaAsP detector elements, arranged in a compound eye fashion that resides
in the pinhole-plane while still generating an optical section. The new detection geometry allows for the
collection of the spatial distribution of light originating from every point of a microscopic fluorescent object at
the pinhole allowing access to higher frequency information and while additionally collecting more light for
ultra-efficient imaging. Based on the Airyscan detection concept, the next innovation from ZEISS has been
developed with the introduction of the Fast mode for Airyscan. The Fast mode concept utilizes the Airyscan
detector technology in combination with an illumination shaping approach to enhance acquisition speeds by
four times while simultaneously increasing SNR and resolution overcoming the traditional compromises of LSM
imaging.
Introduction
The Confocal Laser Scanning Microscope (LSM) has become
one of the most popular instruments in basic biomedical
research for fluorescence imaging. The main reason LSM has
become so popular is that the technique affords researchers
images with high contrast and a versatile optical sectioning
capability to investigate three dimensional biological struc-
tures [1]. The optical sectioning ability of an LSM is a product
of scanning a diffraction limited spot, produced by a focused
laser spot, across a sample to create an image one point at a
time. Traditionally, the generated fluorescence for each point
is collected and focused back through an aperture (pinhole)
onto a unitary detector (typically a PMT). The traditional
detection scheme allows the pinhole to reject the out of
focus light and the PMT to turn the remaining light from the
focal plane into a digital signal to form an optical sectioned
image [2]. As confocal systems developed over the past
25 years, all major developments of commercially available
systems focused on novel methods to increase image contrast,
instrument versatility and acquisition speed. These innova-
tions have provided the LSM with the flexibility to address
research applications in many areas, providing data of cell
differentiation, cell tracking, live cell kinetics, protein expres-
sion, protein localization, neural network connectivity, tissue
structure, gene expression and protein / gene function (list is
not meant to be inclusive). However, until the introduction
of the Airyscan detection concept, the LSM system flexibility
has always forced a researcher into making a compromise on
a performance metric of a system in order to increase another
(i.e. speed for resolution, resolution for SNR etc) to meet
application requirements. The introduction of both the
Airyscan detection concept in 2014 and now the Airyscan
Fast mode represents a fundamental change where tradi-
tional imaging compromises no longer exist and all metrics
can be improved simultaneously.
Author: Joseph Huff, PhD Carl Zeiss Microscopy, LLC, Thornwood, NY, USA
Dr. Annette Bergter Carl Zeiss Microscopy GmbH, Germany
Date: April 2016
Application Note
3
Figure 3 Application example of a resonance scanning time series compared to a time series from the Airyscan Fast acquisition mode using cardiomyocyte Cells with tubulin-EMTB to measure microtubule buckling at high frame rates. (Top panel) Still images from a resonance scanning time series acquired at 80 frames/sec. (Bottom panel) Still images from an Airyscan Fast mode time series acquired at 96 frames/sec. Each series of stills represents the resting tubules, contracted tubules, and resting tubules respectively. Images courtesy of Ben Prosser, University of Pennsylvania [3]
Improving Resolution and SNR on a Confocal
The Airyscan detector design simultaneously improves SNR
and resolution with a hexagonally packed 32 channel GaAsP
PMT array that is positioned in the pinhole plane (Fig. 1) and
removing the traditional pinhole-PMT scheme. This concept
combined two preferable but opposed / conflictive settings
of the pinhole in the traditional LSM; an open pinhole would
allow a lot of light to pass and thus increasing signal to
noise, while a small pinhole opening will improve the resolu-
tion of the system. Further, each of the 32 detector elements
behaves as a small independent pinhole where not only the
optical resolution is improved but also spatial distribution of
the light is recoded to additionally improve the spatial fre-
quency contrast of the LSM system beyond what a tradition-
al system provides. To use Airyscan for super resolution im-
aging, the adjustable zoom optics can be arranged to project
1.25 Airy units onto the detector where each detector ele-
ment represents 0.2 Airy units yielding a 1.4 x optical resolu-
tion improvement and collect up to 50 % more light than an
traditional LSM system with a 1 AU pinhole. Once combined
with a linear deconvolution, a 1.7 x resolution improvement
in all three dimensions is achieved and the additional collec-
tion efficiency of the detector provides a 4x – 8x SNR improve-
ment affording researchers the ability to better quantify and
study biological processes like microtubule buckling as a mea-
sure of measure of mechanical stress on a cell. (Fig. 2, [3]).
Improving Speed on a Point Scanning Confocal
Traditionally in order to improve acquisition speeds on a
point scanning confocal system, the speed at which the laser
spot rasters the field of view is increased resulting in a
decrease the amount of time the laser spot spends on one
pixel. For the maximum speed increase, resonance scanning
approaches are utilized in LSM systems allowing frame rates
of around 30 Hz for a full field of view. However, to achieve
the higher acquisition rates a researcher will have to sacrifice
the resulting SNR of an image. The reason for the image SNR
decrease is that as the acquisition speed is increased, the
laser spot will spend less time per pixel and thus fewer
photons will be available resulting in a deterioration of
image SNR (Fig. 3, upper panel). At some point the SNR can
get so low, that it becomes impossible to discriminate
individual features of the sample and structural information
is lost in the process to reach the necessary temporal
resolution, rendering the method non-usable for the aspired
scientific goal.
Figure 1 Schematic of Airyscan detector for LSM 880 1. Mirror 2. Emission filters 3. Zoom optics 4. Airy disk 5. Airyscan detector
Figure 2 Application example of standard confocal compared to Airyscan detection using cardiomyocyte Cells with SiR-tubulin to measure microtubule buckling. (Left Panel) Traditional confocal still images from a timeseries acquired at 30 fps with low SNR. (Right Panel) Airyscan still images from a time series acquired at 30 frames/sec with high SNR and resolution. Each series of stills represents the resting tubules, contracted tubules, and resting tubules respectively. Images courtesy of Ben Prosser, University of Pennsylvania [3]
3130
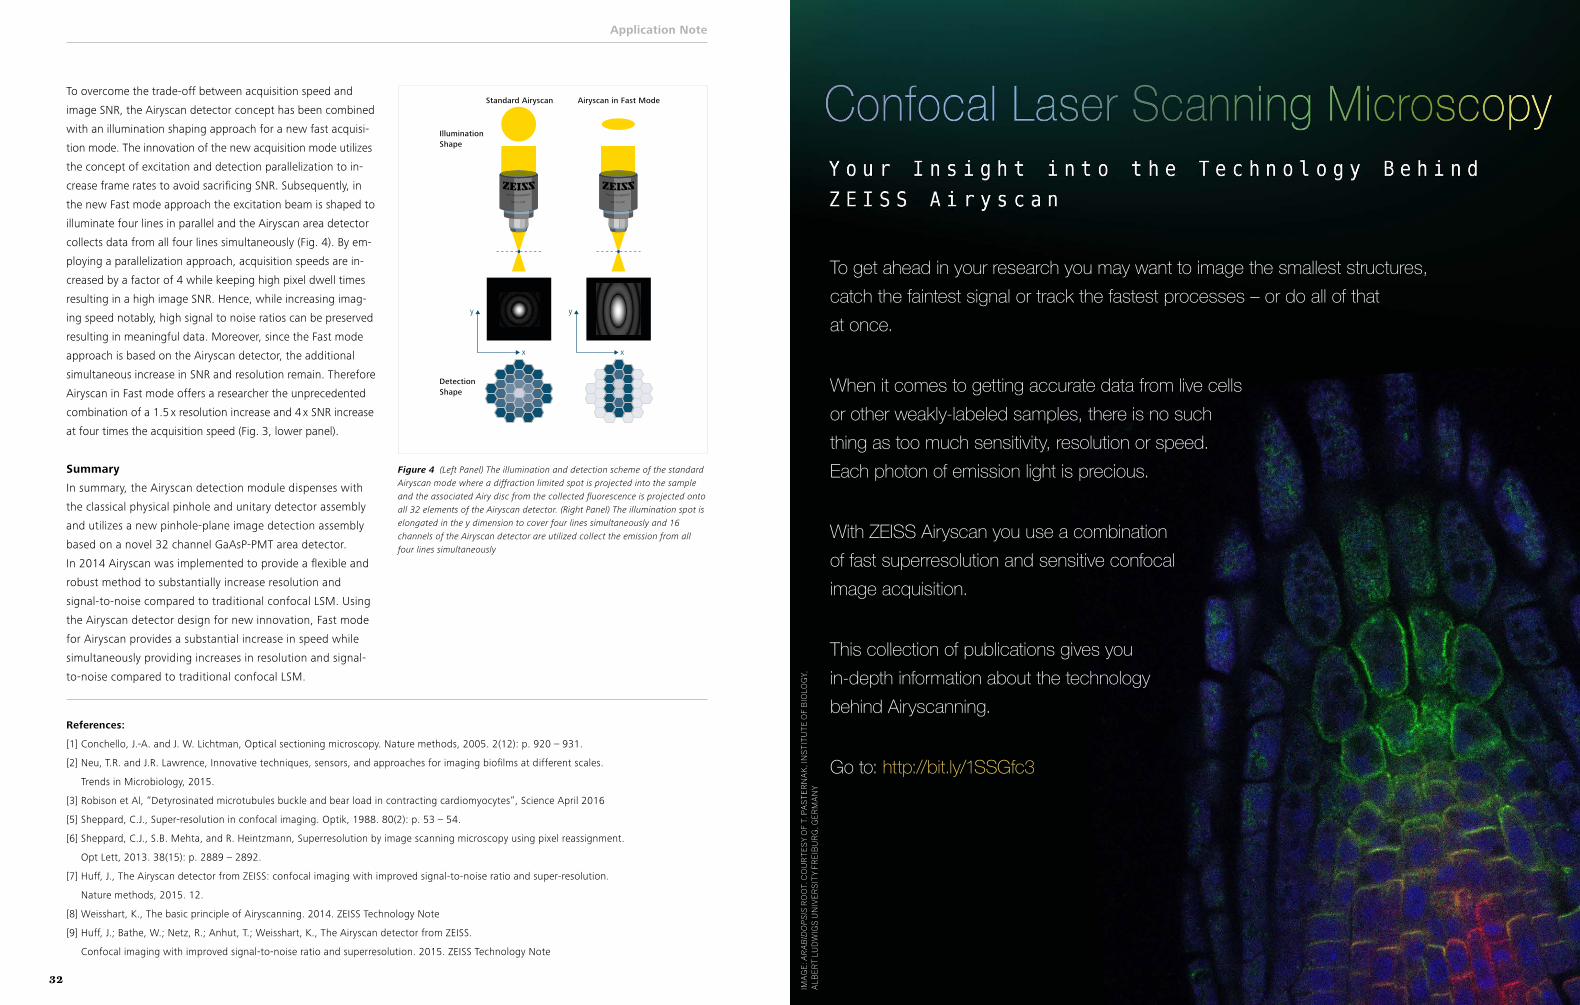
Application Note
4
y
x
y
x
Standard Airyscan
IlluminationShape
DetectionShape
Airyscan in Fast Mode
Figure 4 (Left Panel) The illumination and detection scheme of the standard Airyscan mode where a diffraction limited spot is projected into the sample and the associated Airy disc from the collected fluorescence is projected onto all 32 elements of the Airyscan detector. (Right Panel) The illumination spot is elongated in the y dimension to cover four lines simultaneously and 16 channels of the Airyscan detector are utilized collect the emission from all four lines simultaneously
Cover Image Courtesy of: Dr. Pawel Pasierbek, BIOOPTICS, IMBA – Institute of Molecular Biotechnology, IMP - Institute of Molecular Pathology, Vienna Biocenter
References:
[1] Conchello, J.-A. and J. W. Lichtman, Optical sectioning microscopy. Nature methods, 2005. 2(12): p. 920 – 931.
[2] Neu, T.R. and J.R. Lawrence, Innovative techniques, sensors, and approaches for imaging biofilms at different scales.
Trends in Microbiology, 2015.
[3] Robison et Al, “Detyrosinated microtubules buckle and bear load in contracting cardiomyocytes”, Science April 2016
[5] Sheppard, C.J., Super-resolution in confocal imaging. Optik, 1988. 80(2): p. 53 – 54.
[6] Sheppard, C.J., S.B. Mehta, and R. Heintzmann, Superresolution by image scanning microscopy using pixel reassignment.
Opt Lett, 2013. 38(15): p. 2889 – 2892.
[7] Huff, J., The Airyscan detector from ZEISS: confocal imaging with improved signal-to-noise ratio and super-resolution.
Nature methods, 2015. 12.
[8] Weisshart, K., The basic principle of Airyscanning. 2014. ZEISS Technology Note
[9] Huff, J.; Bathe, W.; Netz, R.; Anhut, T.; Weisshart, K., The Airyscan detector from ZEISS.
Confocal imaging with improved signal-to-noise ratio and superresolution. 2015. ZEISS Technology Note
To overcome the trade-off between acquisition speed and
image SNR, the Airyscan detector concept has been combined
with an illumination shaping approach for a new fast acquisi-
tion mode. The innovation of the new acquisition mode utilizes
the concept of excitation and detection parallelization to in-
crease frame rates to avoid sacrificing SNR. Subsequently, in
the new Fast mode approach the excitation beam is shaped to
illuminate four lines in parallel and the Airyscan area detector
collects data from all four lines simultaneously (Fig. 4). By em-
ploying a parallelization approach, acquisition speeds are in-
creased by a factor of 4 while keeping high pixel dwell times
resulting in a high image SNR. Hence, while increasing imag-
ing speed notably, high signal to noise ratios can be preserved
resulting in meaningful data. Moreover, since the Fast mode
approach is based on the Airyscan detector, the additional
s imultaneous increase in SNR and resolution remain. Therefore
Airyscan in Fast mode offers a researcher the unprecedented
combination of a 1.5 x resolution increase and 4 x SNR increase
at four times the acquisition speed (Fig. 3, lower panel).
Summary
In summary, the Airyscan detection module dispenses with
the classical physical pinhole and unitary detector assembly
and utilizes a new pinhole-plane image detection assembly
based on a novel 32 channel GaAsP-PMT area detector.
In 2014 Airyscan was implemented to provide a flexible and
robust method to substantially increase resolution and
signal-to-noise compared to traditional confocal LSM. Using
the Airyscan detector design for new innovation, Fast mode
for Airyscan provides a substantial increase in speed while
simultaneously providing increases in resolution and signal-
to-noise compared to traditional confocal LSM.
To get ahead in your research you may want to image the smallest structures, catch the faintest signal or track the fastest processes – or do all of that at once.
When it comes to getting accurate data from live cells or other weakly-labeled samples, there is no such thing as too much sensitivity, resolution or speed. Each photon of emission light is precious.
With ZEISS Airyscan you use a combination of fast superresolution and sensitive confocal image acquisition.
This collection of publications gives you in-depth information about the technology behind Airyscanning.
Go to: http://bit.ly/1SSGfc3 IM
AG
E: A
RABID
OPSIS
RO
OT.
CO
UR
TE
SY
OF
T. P
AS
TE
RN
AK
, IN
ST
ITU
TE
OF
BIO
LOG
Y,
ALB
ER
T L
UD
WIG
S U
NIV
ER
SIT
Y F
RE
IBU
RG
, GE
RM
AN
Y
32

Researchers and microscope makers alike are constantly striving to push the boundaries of sensitivity, resolution, and speed. Their determination has produced a steady stream of advances in microscope technology, and researchers armed with these ever-improving tools and techniques are squeezing ever more and better data out of their samples. This poster leads the reader through the past, present, and future of confocal microscopy. Additionally, you can go online to find an interactive version of the poster with additional information and graphics.
Go to poster.sciencemag.org/confocal
This poster is brought to you by the Science/AAAS Custom Publishing Office.
Your new standard for fast and gentle confocal imaging
Discover ZEISS LSM 880 with Airyscan – the new confocal laser scanning microscope that offers high sensitivity, improved resolution in x, y and z, and high speed. All in one system. Find out more and book a hands-on demonstration in one of our ZEISS Microscopy Labs now.
www.zeiss.com/lsm880
Revolutionizing your confocal imaging.ZEISS LSM 880 with Airyscan
// INNOVATION MADE BY ZEISS

Your compact confocal for high-end imaging
With ZEISS LSM 800 you are choosing a flexible and compact confocal laser scanning microscope, complete with highly sensitive GaAsP detector technology and fast linear scanning. Add Airyscan, the revolutionary detection concept from ZEISS, and you will gain 1.7× higher resolution in all three dimensions – resulting in a 5× smaller confocal volume. And you will be pushing sensitivity beyond the limits of all conventional confocals.
www.zeiss.com/lsm800
Finding answers in demanding research.ZEISS LSM 800
// INNOVATION MADE BY ZEISS