Embed Size (px)
Citation preview

Financing under Extreme Uncertainty: Evidence from PIPEs
Susan Chaplinsky* and David Haushalter
First Draft: March 2003 Latest Draft: September 2003 Not for Quotation, Comments Welcome
*Corresponding Author. University of Virginia, Darden Graduate School of Business Administration, Email: [email protected], (434) 924-4810. Part of this research was completed while Haushalter was with the Lundquist College of Business, University of Oregon. We thank Antonio Mello, Randall Heron, Audra Boone and seminar participants at the University of Wisconsin for their helpful comments. We thank the Batten Institute at the Darden Graduate School of Business Administration and individuals at Placementtracker, especially Bobbie Sue Richardson, for technical and financial assistance in obtaining the data on PIPEs. Hyoung Goo Kang and Sangwon Suh provided excellent research assistance on the project.

Financing under Extreme Uncertainty: Evidence from PIPEs
Abstract
Prior work on capital raising consistently finds that firms raising external capital experience good performance prior to fund raising events. By contrast, financially constrained firms – those faced with operating problems or informational asymmetries – frequently encounter difficulty raising capital through traditional financing instruments. This study examines the use of private investments in public equities (PIPEs), an increasingly common form of financing that can be structured to provide investors with varying degrees of asymmetric exposure to an issuer’s equity. The PIPE market has evolved to fill in a gap left by traditional forms of financing. In contrast to more traditional forms of capital, nearly 80 percent of companies issuing PIPEs have negative operating income and more than 60 percent have falling stock prices in the two years prior to issue. Although PIPE issuers realize negative returns following a PIPE issue on average, there is a large amount of cross sectional variation in these returns. Consistent with investors’ ability to rationally choose contracting terms, this variation is associated with the degree of the investors’ asymmetric exposure to the issuer’s equity.

Financing under Extreme Uncertainty: Evidence from PIPEs
1. Introduction
Access to capital has been an issue of longstanding interest in finance due to its central
role in the growth of firms and the overall economy. In recent years considerable attention has
focused on financing constraints and on the ways they can limit or make more costly a firm’s
access to external capital.1 Less attention, however, has been paid to marketplace innovations
that have arisen to provide alternative forms of financing to financially constrained firms. In this
study we examine an increasingly common type of financing called private investments in public
equity, generally referred to as PIPEs. PIPEs are sales of public securities to private investors on
a negotiated basis which can take the form of Floating Rate Convertible Preferred Stock,
Floating Rate Convertible Debt, Convertible Resets, Common Stock Resets, Structured Equity
Lines, and Common Stock. Since the market’s inception in 1995, a total of 1,062 firms engaged
in 2,158 PIPE transactions. By 2000, the market had grown $13 billion, roughly the equivalent of
eight percent of the volume of seasoned equity offerings (SEO).
Previous work on capital raising provides rather uniform evidence of favorable firm
performance prior to external capital raising events. Numerous studies, for example, of firms
making follow-on equity offerings find that an issuer’s stock price increases 30 percent or more
on average in the months leading up to the issue and that earnings are positive and growing
ahead of the offer.2 Similarly, Chaplinsky and Hansen (1993) find that public debt issuers are
profitable firms with an average return on assets (ROA) of approximately 12.0 percent in the two
1 For example, see Fazzari, Hubbard, and Petersen (1988), Kaplan and Zingales (1997), Whited (1992), and Hoshi, Kashyap, and Scharfstein (1991). 2 For a discussion of returns and earnings around equity offerings see among others, Heron and Lie (2003), Ritter and Loughran (1997), Korajczyk, Lucas and McDonald (1990), Asquith and Mullins (1986), Masulis and Korwar (1986), and Mikkelson and Partch (1986).

2
years prior to issue. Houston and James (1997) report that firms with one banking relationship,
those likely to be most comparable to PIPE issuers, have an average ROA of 4.4 percent (median
9.5 percent). Hertzel and Smith (1993) find for a sample of 106 private placements of equity that
80 percent experience positive earnings in the two years prior to issue. By comparison, in the two
years prior to issue, PIPE issuers have an average ROA of -30.0 percent, nearly 80 percent of the
issuers have negative operating income, and over 60 percent of the issuers experience falling
stock prices. By any standard, PIPE issuers are poorly performing firms - yet they are able to
raise new capital.
As the above suggests, companies with extreme operating difficulties or informational
asymmetries frequently face hurdles in raising capital through traditional financing instruments,
such as follow-on equity offerings, public or private debt. PIPEs differ from traditional forms of
financing because they can be structured to provide the necessary protection or potential rewards
to investors to allow these companies to raise capital, albeit at high costs. Specifically, PIPEs
can be negotiated with a variety of terms and features, such as caps, floors, mandatory
redemption, trading restrictions, warrants, and discounts which provide investors with
asymmetric exposure to the firm’s equity. As we describe in more detail later, common stock
PIPEs offer investors significantly enhanced returns in circumstances of positive post- issue stock
price performance, but offer no downside protection (“price unprotected”.) Alternatively,
Floating Rate Convertibles and Convertible Resets allow investors upside potential but
substantially reduce exposure to downside risk (“price protected.”) Therefore, although PIPEs
are either common stock or securities that will eventually convert into common stock, these
customized terms allow investors to significantly alter their exposure to the underlying value of
the issuer’s equity.

3
We find that the market reaction to PIPE announcements varies significantly with the
degree of downside price protection demanded by investors. The average return around the
announcement of a price unprotected PIPE is significantly positive. In contrast, the average
return around the announcement of price protected PIPEs is significantly negative. This
variation is consistent with the Hertzel and Smith (1993) notion that the terms of a private
investment conveys information to the market.
The longer term stock performance of PIPE issuers further exemplifies the amount of
uncertainty around these companies. Approximately 70 percent of PIPE issuers realize negative
benchmark adjusted returns in the year following issue. Further, approximately 12 percent of
companies issuing unprotected PIPEs and 7 percent of companies issuing protected PIPEs realize
returns greater than 100 percent in the year following issue.
Although it may seem that PIPE investors fare poorly, it is important to realize that the
returns earned by the issuer’s public shareholder’s are not the returns earned by PIPE investors.
It is precisely because PIPE investors can differentiate their returns from the public shareholders’
return that makes them willing to provide financing when others will not. For example, although
unprotected PIPEs do not provide downside price protection, these securities usually have
warrants. Therefore, the payoffs for unprotected PIPEs are asymmetric, allowing PIPE investors
to capitalize on issuers that realize abnormally good performance. Moreover, the long term
returns following issue are positively related to the PIPE investors’ degree of exposure to the
issuer’s equity as “price unprotected” PIPEs outperform “price protected” in the year following
issuance. These results demonstrate some ability on the part of investors to structure PIPE
investments in line with their pre- issue expectations of the company.

4
Our study is most similar to Hillion and Vermelaen (2003) that focuses on floating
conversion rates, or one type of PIPE, sometimes referred to as a “toxic convert” or “death
spiral.” Like us, Hillion and Vermelaen find that companies perform poorly after issuing
floating rate convertibles. They conclude that these are faulty contracts due to the short selling
pressure created by their issue.3 Our purpose is to provide a more comprehensive look at the
PIPE market to understand the motivations of firms to use this form of financing and of investors
to provide it. The terms “toxic convert” and “death spiral” themselves connote some type of
pejorative behavior on the part of investors and issuers in the PIPE market. However, floating
rate convertibles are not the most common type of PIPE. Nor a priori is there reason to believe
that the parties entering the contracts are not making the best decision among those available to
them at the time. As we show, the companies issuing these PIPEs, particularly floating rate
convertibles, appear to be highly distressed and have a high probability failure regardless of the
actions taken by management. Therefore, it is difficult to judge the success of these contracts
based solely on the issuer’s post issue performance. Our analysis does however show that the
PIPE market has evolved to provide financing for companies for which funding through
traditional markets would be impossible.
The plan of the paper is as follows. Section 2 provides a brief overview of the issue
process and institutional features of the PIPE market. In section 3, we describe the sample of
PIPEs and present information on the characteristics of the PIPE market. In this section we also
examine the degree of financial constraint faced by PIPE issuers are and how this influences the
availability of other forms of financing. In section 4, we conceptually describe the different
3 As we discuss further later, Hillion and Vermelaen (2003) do not specifically measure short-selling around PIPE issues. Our data suggests it is difficult to short the shares because the issuer’s stock is difficult to borrow. Nonetheless, some of the extreme dilution associated with these offers has motivated the National Security Dealers Association (NASD) to propose certain restrictions on their terms and use. These restrictions arose after the period

5
types of PIPE securities and the properties that alter private equity investor’s exposure to the
future performance of the company. Predictions are generated about the type of PIPE contract
chosen and the announcement date price reactions and long run performance associated with it.
In section 5, we examine the firm’s post- issuance performance and the characteristics associated
with the relative performance across PIPEs. Section 6 gives our conclusion.
2. Background on PIPE Contracts and the Issue Process
2.1 Issue Process
A PIPE describes one of several different types of securities that can be issued under the
U.S. Security and Exchange Commission’s (SEC) Regulation D. This regulation enables a public
company to issue equity or a security convertible into equity to a group of private investors prior
to registering the shares with the SEC. Because the shares are placed privately with investors, a
PIPE generally requires less disclosure, time, and underwriting fees than alternative forms of
public financing. However, once the shares underlying a PIPE are registered with the SEC and
this registration becomes effective, these shares can be traded publicly.
A company wishing to issue a PIPE initially employs an investment bank or placement
agent to assist with the offering and to contact potential investors. PIPE investors do not
necessarily need to meet SEC’s standards for being an “accredited investor” to participate in the
deal. However no more than 30 percent of the investors can be non-accredited.4 Inspection of
the top 15 PIPE investors based on the dollar amount invested between 1995 and 2000 reveals
that hedge funds (9 of the 15) are the most common PIPE investors.
examined by Hillion and Vermaelen (2003). See footnote 12 for further description of these regulatory changes. 4 The SEC classifies an investor as “accredited” if it meets one of several requirements. For a full list of these requirements see http://www.sec.gov/answers/accred.htm .

6
Before agreeing to make an investment in the PIPE issuer, a potential investor has the
opportunity to conduct extensive due diligence on the issuer and to negotiate the terms of the
security. This due diligence and negotiation process usually involves an extensive review of
public filings and discussions with management. Although these activities do not necessarily
result in the investors obtaining non-public information, such activities can potentially enable the
investors to overcome some of the informational asymmetries associated with these firms. As
discussed in the next section, the terms of the PIPE that the investor negotiates with the issuer
has a large effect on the degree of the investors’ exposure to movements in the issuer’s stock
price following the offering. Therefore, these terms likely reflect investors’ perception of the
issuers’ risk and potential returns.
If the company and investors reach an agreement on the terms, the company will issue a
press release describing the PIPE transaction at closing. An example of a typical press release is
provided in the Appendix. Although the press release describing the deal is often quite general,
the company usually files an accompanying 8-K form with the SEC containing a more detailed
description of the terms and a list of the investors participating in the deal. This 8-K filing is the
basis by which the PIPE becomes known to investors and Placementtracker.com, an on- line
market for PIPE investments, and the source of data for this study.
2.2 Types of PIPE Contracts
In this section, we briefly describe the basic features and pay-offs of PIPE contracts.
Later, we explore the institutional features and the costs of executing and investing in these
instruments further. There are important distinctions among the different types of PIPE
securities that affect the exposure an investor faces with respect to an issuer’s future

7
performance. Certain PIPEs are constructed such that they limit investors’ downside exposure,
while offering investors the ability to benefit from strong post-issue stock performance.
Alternatively, PIPEs can provide little downside protection but include features, such as
warrants, that increase investors’ ability to benefit from strong post- issue stock performance.
Based on the terms of the PIPE, we separate PIPEs into two broad categories: “Price Protected”
and “Unprotected.” Price Protected PIPEs allow investors to adjust the terms of the contract
after the initial contract is closed, whereas Unprotected PIPEs do not permit such adjustments.
2.2.1 Price Protected PIPEs
Of the five types of PIPEs we consider, Floating Rate Convertible Preferred Stock or
Debt (FRC), Convertible Resets (CVR), and Common Stock Resets (CSR) offer investors
downside protection from adverse movements in the issuer’s stock price. The familiar fixed rate
convertible typically has a single conversion price above the current market price of the common
stock that is maintained throughout the term of the contract. Relative to fixed rate convertibles,
the conversion price (or rate) on a floating rate convertible changes on a daily basis in
accordance with movements in the issuer’s stock price. Reset convertibles allow for a discrete
number of changes of the conversion price at specified intervals (e.g. six months, one year, and
two years from closing). Prior to the reset points, the security is convertible only at the last fixed
conversion price. Because of this adjustment feature, Brennan (1985) has argued that floating
rate convertibles are an ideal form of financing for high risk and high asymmetric information
firms.5 The most important distinction between a PIPE and a conventional floating rate
5If management believes that the firm’s equity is currently undervalued and possesses positive information that will eventually lead to a higher price, floating rate convertibles in effect allow shares to be issued at a higher price after the good news is revealed. However, Hillion and Vermaelen (2003) find no evidence that this argument characterizes the performance of floating rate convertibles or resets.

8
convertible is that roughly 50 percent of the time the PIPE’s conversion price can only be
adjusted downward.6
While a number of variations to the basic contract exist, in a typical PIPE an investor
purchases an amount ($50 million) in newly issued convertible preferred stock from a company
for a certain number of shares (5,000) at stated par value per share ($10,000). The issuer will
register the shares, in part or in whole via a shelf registration, with the appropriate regulatory
bodies within 30 days after this deal closes. Once the registration becomes effective, the shares
can be publicly traded – typically 90 days after registration. Thus, the registration process is key
to transforming what would otherwise be a private (non-liquid) asset into a public (liquid) asset.
Following issuance, if the stock price of the issuer falls, the investor will receive more
shares upon conversion. If the stock price of the issuer rises, the conversation will usually take
place at the originally agreed upon contract price. Therefore, issuers generally do not benefit
from stock price appreciation following issuance of a PIPE. In addition to these features, PIPEs
usually require the payment of dividends or interest in cash or additional shares. The basic
features of floating rate and reset convertibles are depicted in the following diagram:
6In some instances, PIPEs will allow for the maximum conversion price to be set at a premium over the current price but unlimited upsides are not observed.

9
The holder of a floating rate or convertible reset can be viewed as being long stock (S) at
the price at which the PIPE is issued, assuming this is the maximum conversion price of the
security, and long a put option at this price. The put option or downside protection offered from
the contract results from the larger number of shares obtained upon conversion as the price
company’s stock decreases. As long as the shares can be sold, the adjustment of the conversion
ratio over time ensures that investors maintain the face value of the instrument and their
investment principal. However, the protection offered by this put option is limited by the degree
of liquidity in the stock and can cease to exist as the stock price approaches zero in the event of
distress or delisting. This is depicted in the diagram as being short a put at a $1 share price
(delisting price).7 To control the liquidation process, PIPE contracts frequency stipulate a
maximum number of shares that can be converted within a given time period (usually a month).
However, if the issuer’s stock price drops below some minimum stipulated price (e.g., $2 or $3
7 In theory, if the stock price is delisted immediately and the investor has not converted any of the position, the short put value takes on an amount approximately -($X-0) or the loss experienced by investor in that circumstance.
Value
Face
Val
ue
Stock Price S Market or Max Conversion Price X
S
$1 or greater than floor
Convertible

10
per share), investors have the right to accelerate conversion of the remaining unconverted portion
of the security without regard to the original schedule. This permits investors to liquidate their
remaining position ahead of a possible delisting. 8 Any interest paid on these securities is usually
payment in kind rather than cash interest.
A common stock reset (CRS) is similar to the floating rate and convertible resets in its
payoff. The common stock reset allows investors to buy common stock at a set price less a
discount. The reset, which usually occurs once during contract term, adjusts the purchase price
downward in the event an issuer’s stock declines following issuance. Most CSR, however, allow
for the reset to occur only once within a relatively short time, 30 – 60 days, after closing. Thus,
the main difference between CRS and floating rate convertibles and resets is that the period of
price protection is of shorter duration.
2.2.2 Unprotected PIPEs
Unlike the former price protected PIPEs, Common Stock PIPEs (CS) and Structured
Equity Lines (SEL) do not allow the purchase price of the shares to be adjusted after the contact
closing date and thus do not provide investors with downside protection. 9 Rather these contracts
frequently enhance investors’ upside with warrants to purchase the company’s stock at a price
generally at or above the current market price of the stock. Whereas CS PIPEs typically involve
one lump sum upfront investment, SELs can be thought of as a series of CS PIPEs. An investor
in a SEL agrees to purchase a given dollar amount of the company’s common stock within a
specified time period. The company selects when during this period that it wishes to sell shares
8An additional feature that differentiates this instrument from a fixed rate convertible bond is that investors almost always convert their positions into shares of the company’s common stock. 9 Differences in the degree of the PIPE investors exposure to the issuer’s equity is not clear for Common Stock Resets and Structured Equity Lines. The results are robust if we consider change the classifications of these

11
to the investor.10 Investors purchase the company’s stock at a discount to then current market
price or at some average of prices in a short interval before the issue.
The basic features of a Common Stock PIPE and SEL are depicted in the diagram.
Hence, investors can vary significantly the degree of upside and downside exposure they
face to an issuer’s common equity through their choice of PIPE contract.
3. Sample and Market Characteristics of PIPEs
instruments, for example, including Common Stock Resets as a type of unprotected PIPE. 10 Placementtracker classifies SEL as structured PIPEs or “price protected.” By their definition, structured PIPEs have prices that can be adjusted if there is a change in market conditions or fundamentals of the company. However, in the case of an SEL shares will be purchased at a lower price than the initial tranche price if the price declines but
Value
Face
Val
ue
Stock Price S
S
Discount
Value
Face
Val
ue
Stock Price S
S
Discount
Strike Price on Warrants X
Warrants

12
3.1 Sample Description
We collect a sample of 2,631 PIPEs from Placementtracker over 1995 – 2000, which is
reduced to 2,158 PIPEs after imposing the requirement that issuers have stock price data
available on CRSP. The Placementtracker database is to the best of our knowledge an
exhaustive list of all PIPEs issued since 1995.11 We use Placementtracker data to identify the
type of PIPE issued, the terms of the contract, and the closing date of the agreement. Table 1
shows summary statistics for the five types of PIPE instruments. The two most commonly issued
PIPEs are Common Stock PIPEs and Floating Rate Convertibles. Common Stock PIPEs account
for almost 50 percent of the total number of PIPEs and roughly 66.6 percent of the capital raised
from these transactions. Floating Rate Convertibles account for 37.5 percent of the PIPE
transactions and approximately 22.7 percent of the capital raised. The use of Common Stock
PIPEs increases each year of the sample period, whereas Floating Rate Convertibles increase
from 30 in 1995 to a peak of 233 in 1997, but then trail off to 90 in 2000.12 In total, $26.7 billion
is raised over the sample period. The number of PIPEs issued and the amount of capital raised
through PIPE transactions increases steadily over the sample period, reaching a high of $12.7
billion in 2000. By comparison, 344 seasoned equity offerings (SEO) totaling $86.8 billion were
there is no adjustment of the price thereafter. Therefore we classify SEL as unprotected PIPEs. 11 We check the sample of PIPEs from Placementtracker against press announcements of PIPEs. All of the companies identified from press announcements are in Placementtracker. For a description of Placementtracker, see http://www.placementtracker.com. 12 The reduced number of FRCs may be partially due to the pending implementation of NASD Rule 4350. The National Association of Securities Dealers (NASD) views structured equity lines and floating rate convertibles and resets as “future priced securities.” Certain NASDAQ listing rules regarding future priced securities are codified in NASD Rule 4350 which was approved in March 2002 after several years of consideration. Under this rule, the issuance of certain PIPEs requires a vote by shareholders if the lowest possible conversion price is below the book or market value of the stock at the time of issuance of the security or if investors can receive mo re than 20% of the shares upon conversion from such low prices. To eliminate the need for shareholder approval, an issuer can place a cap on the number of shares that can be issued upon conversion to 20% of the common stock or voting power outstanding before the issuance of the PIPE or place a floor on the conversion price, such that the conversion price will always be at least as high as the greater of the book or market value of the common stock prior to the issuance of the PIPE. See the Federal Register, Vol. 67, Number 45, March 7, 2002.

13
made in 2000, implying that PIPEs roughly amount to eight percent of the funds raised through
SEOs. Consequently, the results in Table 1 indicate that PIPEs are an increasingly important
source of funding.13
3.2 Prior Operating Performances of PIPE Contracts
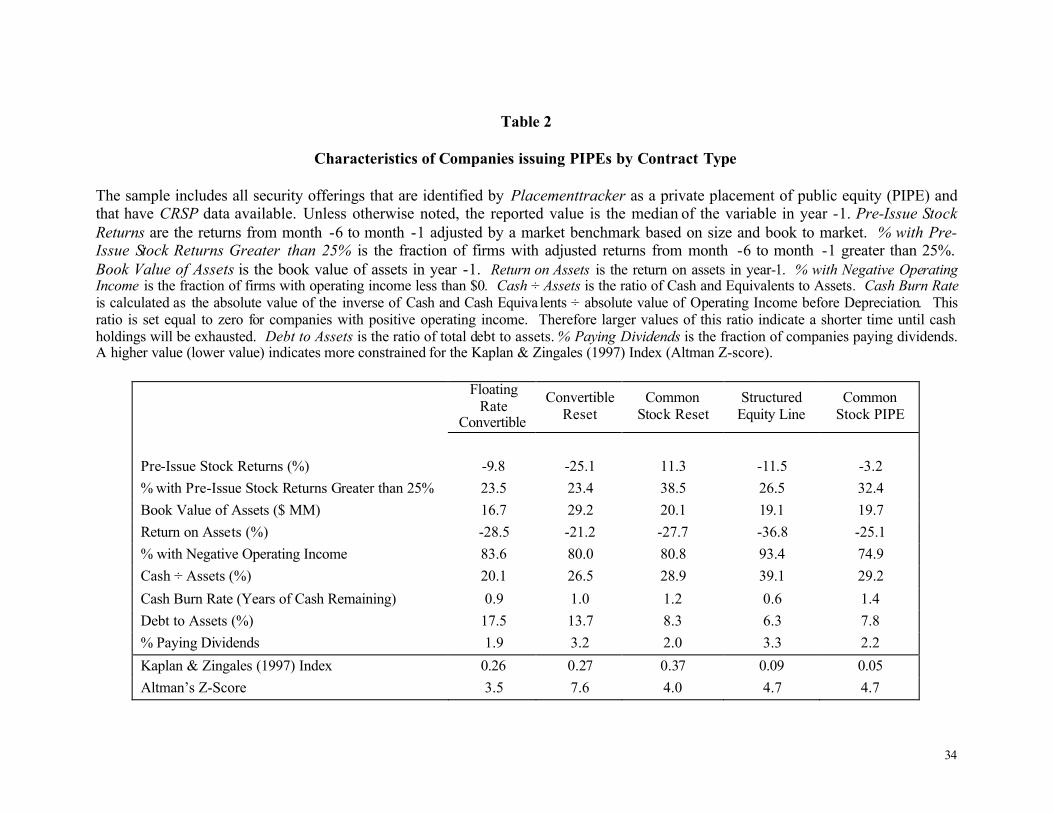
Table 2 presents information on selected financial and operating characteristics of the
companies issuing PIPEs by contract type. Notably, there is evidence of poor performance
regardless of the type of PIPE. With the exception of CS Resets, all categories of PIPEs
experience negative median stock returns in the six months prior to issue. All categories of
PIPEs have negative ROA and high cash burn rates. Additionally, consistent with the arguments
of Almeida, Campello, and Weisbach (2003) that constrained firms appear to hoard cash, the
cash to asset ratio across the PIPE categories ranges from 20.1 percent to 39.1 percent. To put
these values in perspective the median cash to asset ratio for Compustat firms during the 1995 to
2000 is 16.2 percent (not tabulated).14 Further, debt usage and the payment of dividends are
exceptionally low across the contracts which can also be a sign of financial constraint and poor
performance.
In the bottom panel of Table 2, we report several frequently used composite measures of
financial constraint or distress: Kaplan and Zingales’ (KZ) (1997) Index and Altman’s Z-score.
Higher values of the KZ Index indicate greater constraint, whereas lower values of the Z-score
indicate more constraint or distress with values below 1.8 generally viewed as “unhealthy.”
13 We do not find a strong industry pattern to PIPEs issues. Chemicals (SIC Code 2800) and Business Services (SIC Code 7300) each account for 20 percent of the issues and Instruments and Related Products (SIC Code 3800) accounts for 10 percent. The top two industry groups include firms in respectively, pharmaceutical and biotech, and computer programming, software and system design. The other issues are scattered among a number of industries. 14 We also ran the regression that Almeida, et. al (2003) specify in equation 8 of their paper (page 12) in which the change in cash is regressed on ROA, Q ratio, and assets for the year prior to the PIPE issue. Consistent with their results, the coefficient on ROA is positive (constrained firms keep more of their cash flow). However, this

14
Among companies on Compustat during the 1995 to 2000, excluding the companies that issued
PIPEs, the median KZ score is 0.46 and the median Z-score is 3.1. Somewhat surprisingly, both
the KZ Index and the Z-score indicate that the median Compustat firm is more constrained than
the median PIPE issuer. All categories of PIPEs have a KZ Index value well below 0.46 and a
Z-score above, and typically well above, 3.1. Several reasons may account for this. For one, the
Z-score places significant weight on a firm’s leverage and the KZ Index on both a firm’s
leverage and payment of dividends, of which PIPE issuers have little. Second, Baker, Stein, and
Wurgler (2003) note the KZ Index does not adequately capture a firm’s “equity dependence.”
Finally, Almeida, et. al (2003) argue that the cash ratio is more revealing of financial constraint
than the KZ Index. The results for PIPE issuers also suggest that it is not a revealing measure of
constraint and henceforth we rely on the cash burn rate and cash ratio as measures of constraint.
3.3 Availability of Other Forms of Financing
Based on the negative operating characteristics of PIPE issuers, it is clear that PIPE
issuers firms will require additional financing to continue operations. This raises the question of
what alternative forms of financing might be available to PIPE issuers. The generally small size
of PIPE issues and issuers, along with the ir poor operating performance likely rule out public
debt issuance and otherwise make other forms of debt (e.g., bank debt) ill advised. Therefore the
most likely available alternative funding source appears to be common stock.
Table 3 provides information on selected financial and operating characteristics of the
companies issuing PIPEs in relation to SEO issuers.15 The table presents medians of the
variables for the year prior (year -1) and the year of issuance (year 0). PIPE issuers have
coefficient is insignificant for the rest of the Compustat universe. 15 We collect information on 2,594 Seasoned Equity Offerings (SEOs) from the Security Data Corporation New

15
significantly smaller sales, total assets, and market value of equity compared to SEOs issuers.
The performance measurements also show the relatively poor performance of PIPEs in the
period before issue. The median pretax operating income is negative in both year -1 and year 0
compared to the positive operating income of SEOs. Likewise, return on assets (ROA) is
respectively -30.0 percent and -29.8 percent over the same two years. Moreover, the
performance in operating income, ROA, and the market value of equity from year -1 to year 0 is
decreasing for the PIPE issuers and increasing for SEOs issuers. Further evidence of the
widespread nature of the financial difficulty of PIPE issuers is that 78 percent of PIPE issuers
have negative operating income (versus 21 percent for SEO issuers) and less than one year’s
worth of cash on average to sustain operations compared to two years for SEOs issuers.
Consequently, the pervasive nature of the poor performance associated with PIPE issuers
suggests that even common stock financing is out of reach for many of the issuers.
Although the foregoing result show the typical PIPE issuer experiences poor
performance, there is high degree of variability in the performance of the group. To appreciate
the range of uncertainty associated with PIPEs, Figure 1 compares the abnormal stock returns of
PIPE and Seasoned Equity Offering (SEO) issuers in the 12 months prior to issue. These
cumulative abnormal stock returns are calculated using a wealth relative of monthly returns for
the sample firm and a benchmark portfolio for 12 months prior to the month of the PIPE offering
or Seasoned Equity Offering. Sample firms are assigned to the benchmark portfolio using the
market value of assets and the book to market ratio in the calendar year prior to the offer date.16
In terms of extreme performance, 25 percent of PIPEs experience returns greater than 50 percent
Issues (SDC) database over 1995 to 2000 which have data available on CRSP. 16The breakpoints used to assign the sample firms to a benchmark portfolio and the subsequent returns on the benchmark portfolio are from the Research Return Data Files available on Ken French’s webpage: http://mba.tuck.dartmouth.edu/pages/faculty/ken.french.

16
and 32 percent less than -50 percent. By comparison, 46 percent of SEOs experience returns
greater than 50 percent and 2 percent less than -50 percent.17 By now the point should be clear –
PIPE issuers are not candidates for any type of debt financing and even equity, their best chance,
is difficult to raise. However, often without funding, these firms will soon run out of cash.
3.4 Announcement Date Returns to PIPEs
The announcement date price reactions to private placements of equity have been
attributed in prior studies to information effects (Hertzel and Smith (1993)), greater monitoring
due to increased ownership concentration (Wruck (1989)), and liquidity costs due to resale
restrictions on the shares. PIPEs differ from the private placements previously examined in two
ways. First, resale restrictions on the shares are eliminated from consideration by registration of
the offers, and second, investors intend to dispose of the ir shares relatively soon after the offer.
Thus by design, PIPEs are intended to be passive investments and do not involve greater
opportunity for monitoring.
Hertzel and Smith (1993) argue that the extended discussions and negotiations between a
firm and private investors during a private placement can allow private investors to resolve some
of the asymmetric information about a firm’s value. The announcement of the issuance of a
private placement reveals this information to the market. PIPE transactions are particularly well
suited for testing this “information hypothesis.” First, given the uncertainty, small size and poor
performance of PIPE issuers, it is likely that even greater informational asymmetries exist for
these firms than for others. Second, unlike traditional private placements, PIPEs vary in the
17 However, also noteworthy, is the fact the some 42 percent of PIPE issuers experience positive returns. In unreported results, we find that the correlation between the annual number of SEOs and the number of PIPEs is –0.64. One interpretation of this negative correlation is that PIPEs become more prevalent as other forms of equity financing become more difficult to obtain.

17
degree of the private investors’ exposure to the post- issue performance of the issuer’s stock. As
discussed above, PIPE investors face substantially greater exposure to the firms’ post- issue
performance if they invest in unprotected PIPEs rather than protected PIPEs. Therefore, the
private investors’ decision to invest and the type of PIPE selected could be particularly
informative to the market for PIPE transactions. Specifically, based on information hypothesis
we predict that the market will react more favorably to the announcement of the placement of
unprotected PIPEs than protected PIPEs.
In Table 4 we report the cumulative abnormal returns around the announcement date of
protected and unprotected PIPEs. Relative to previous studies of SEOs, the announcement date
is measured less precisely for PIPEs as the exact details of a PIPE issue including the terms of
the PIPE and the identify of the private investors might not be publicly disclosed until several
days after the initial disclosure of the PIPE. Therefore a larger window around the offering is
examined.
From Day -1 to +1, unprotected PIPEs experience a significantly positive price reaction
of 3.49 percent (median 0.95 percent) at their announcement compared to 0.92 percent (median -
0.66 percent) for protected PIPEs. One also observes in the days leading up to and the days
following the announcement that unprotected PIPEs perform substantially better than protected
PIPEs. Figure 2 traces the cumulative abnormal returns around the PIPE announcements over
the 40 day period around the announcement date. As shown in the figure, there is an ever
widening gap between the cumulative returns for protected and unprotected PIPEs. Over the
period from Day -10 to +10, unprotected PIPEs increase by almost 11 percent (median 2.01
percent) versus a decrease of -1.95 percent (median -6.44 percent) for protected PIPEs. The
mean and median differences in returns over the announcement date window between the groups

18
are significant at the 1 percent level. Thus, the results suggest that the market does infer
different signals about the firm’s performance from private investors’ choice of contract.
To further examine the association between the stock returns around the announcement of
the PIPE offering and the type of PIPE that is issued, we estimate regressions on the cumulative
abnormal return for the 21 day window around a PIPE issue. The explanatory variables in the
regressions include a dummy variable that indicates whether the PIPE is unprotected
(UNPROTECT=1) or protected (UNPROTECT=0). Other explanatory variables in these
regressions that are related to the characteristics of the PIPE offering include the ratio of the
proceeds from the PIPE offering to the market value of equity at the time of the offering and the
discount at which the PIPE investor can convert or purchase the stock relative to the market
price. Explanatory variables that are proxies for the stock performance and operating
characteristics of the PIPE issuers include the abnormal stock performance for the 12 months
prior to the issuance of a PIPE, a dummy variable indicating whether sales increased (1) or not
(0) between year –2 and year -1, the inverse of the number of years until cash is projected to be
depleted (for firms with positive cash flow this variable is set equal to zero), and the log of the
market value of equity. We also include the years since the IPO to control for any effect that
length of time that a firm has been publicly traded might have on the market’s reaction to this
announcement.
The regression results are presented in Table 5. In column 1 we include the entire sample
of PIPEs. The regression results presented in Column 2 are only estimated using stocks trading
above $3 at the time of the PIPE offering. The results presented in Column 3 are estimated on
the first PIPE issued by a company. The coefficient on UNPROTECT is positive and
statistically significant (p-value = 0.02 or less) in all three specifications. The coefficient on
19
UNPROTECT indicates that after controlling for the other characteristics in the regressions, the
abnormal returns around the announcement of an unprotected PIPE is roughly 11 percent greater
than the announcement returns for protected PIPEs. These results are consistent with the
analysis of the announcement returns presented in Table 5 and support Hertzel and Smith’s
(1993) claim that private investors’ investment decisions convey information to the market about
a firm’s quality.
In addition to the specifications presented here, we conduct several robustness checks.
For example, the results are similar when we winsorize returns at different levels or use
alternative specifications for the regression model including other operating characteristics and
features of the PIPE contract. We also separate the 21 day announcement into three different
windows: day -10 to -2, day -1 to 1, and days 2 to 10. The coefficient of UNPROTECT is
insignificant in the day -10 to -2 window, and statistically positive for the day -1 to 1 window
and the day 2 to 10 window. For the day -1 to 1 window, the coefficient of UNPROTECT is
0.027, and for the day 2 to 10 window, it is 0.066. This indicates that it generally takes at least
several days following the announcement of the PIPE issue for investors to learn and assess the
important details of the issue.
4. Post-Issue Performance of PIPE Issuers
To this point we have shown that PIPEs issuers tend to be generally poor performers
prior to issue which makes other forms of financing difficult to obtain. Consistent with the
notion that the actions of private investors can signal information to the market, the market
reaction to the announcement of a PIPE varies according to terms of the PIPE. The market reacts
negatively to PIPEs that limits private equity investors’ downside exposure and reacts positively
20
for PIPEs without downside protection. In this section we provide further evidence of investors’
expectations and the signal associated with PIPE issuance by examining the post- issue
performance of PIPE issuers.
4.1 Operating Performance: Pre versus Post Issue
In Table 6, we report financial and operating characteristics over a period from year -1 to
year +1 for protected and unprotected PIPEs. To illustrate the susceptibility of the sample to
outliers, Table 6 shows both the mean and median values of the variables. The large difference
in the means and medians observed for most variables is aga in reflective of the large uncertainty
associated with PIPE issuers. For this reason, our discussion focuses primarily on the median
values. Of note, in year-1, with the exception of the “Years until Cash Depletion,” the medians of
the operating characteristics between protected and unprotected PIPEs do not differ significantly.
Over the period from year-1 to year +1, there is modest improvement for unprotected
PIPEs with respect to the median return on assets, market value of equity, and total assets,
whereas protected PIPEs exhibit similar or deteriorating performance in these characteristics
over the same period. Thus, by year +1, unprotected PIPEs now differ significantly from
protected PIPEs on the dimensions of total assets, return on assets and the market value of
equity.
The differences between the groups are most evident for the market value of equity and
the years until cash depletion. From year -1 to year +1, the market value of equity increases 16.7
percent for unprotected PIPEs compared to a decline of 16.9 percent for protected PIPEs. In
addition, although both groups experience a cash infusion in year 0, the years until cash
depletion falls from 8.3 months to less than six months for protected PIPEs, but stays at about 11
21
months for unprotected PIPEs. Thus, the post- issue analysis of operating characteristics is
consistent with the previous results that indicated a somewhat better outlook for unprotected
PIPE than protected PIPE issuers.
4.2. Post-Issue Stock Performance
We now turn to the issue of the post- issue stock returns to PIPE investors relative to the
firm’s common shareholders. As noted earlier, the terms of a PIPE contract allow investors to
differentiate their returns from the raw returns on the issuer’s common equity. Therefore we
begin by discussing those contract features and certain market conditions, such as liquidity and
the potential shorting of shares that can enhance or detract from PIPE investors’ returns relative
to public shareholders. We then compare the long-run returns of PIPE investors to those of the
company’s public shareholders.
4.2.1 Features of PIPE contracts
In principle, there are a number of terms and features that can be included in a PIPE
contract that potentially differentiate the PIPE investors’ returns from those of public
shareholders. In Table 7, we present selected characteristics of the offer, contract, and market
which affect PIPE investors’ returns relative to public shareholders. We report the averages (top
row) and medians (bottom row) of the characteristics on Table 7, but as before, due to the
skewness in the data, we rely on the medians when interpreting the results. One way investors
can reduce the risk of market acceptance is to simply offer smaller amounts of capital. Two
measures of offer size, the absolute median offer size and the relative offer size
(Proceeds/Market Value) are included in the Table 7. Price Protected PIPEs are significantly
22
smaller offers than Unprotected PIPEs in terms of their absolute and relative size. Also, in 47.0
percent of issues, investors in price protected PIPEs receive additional compensation in warrants
versus 34.9 percent of unprotected PIPEs. Despite the smaller size and higher percentage of
warrants, price protected PIPEs have a significantly higher median discount (14.7 percent) than
unprotected PIPEs (12.0 percent). Although not shown in the table, we find that 77 percent of
price protected PIPEs and 80 percent of unprotected PIPEs have an exercise price that is at a
discount to the market price.
Table 7 also provides some evidence that liquidity is a concern for PIPE investors. The
“Shares Issued/Volume” variable is the ratio of the amount of shares issued in the PIPE to the
average daily trading volume in the security. Although in general the size of PIPE offerings is
small in relation to other forms of publicly available financing, the shares issued in a PIPE are a
median 22.2 and 13.9 times the average daily trading volume of the shares for price protected
and unprotected PIPEs, respectively. Were an investor to attempt to liquidate his or her position
all at once, this evidence suggests that the sale would place unusual demands for liquidity on the
market and likely negatively impact the price received for the shares.
In theory the payoffs to PIPE securities could be further altered by shorting the
underlying common stock of the issuer, if shares are available to borrow. To examine the
possibility for shorting, following D’Avolio (2002) and Gezcy, Musto, and Reed (2002), we
characterize a stock as hard to borrow if the equity lender is not paying a full rebate, usually the
Fed Funds rate, on the collateral an investor deposits with the lender providing the stock. Stocks
in which the lender is not paying a full rebate are commonly labeled as “on special.” Using data
from the equity lending market for PIPEs issued between 1998 and 2000, in Table 7 we report
that 51.9 percent of the companies issuing unprotected PIPEs are on special in the year of issue

23
and this increases to 56.9 percent in the year after issue. For companies issuing protected PIPEs,
57.7 percent are on special in the year of issue and 65.7 percent are on special in the year
following issue. By comparison, D’Avolio (2002) using a database that includes about 70
percent of the companies in the CRSP database, reports that on an average day only 8.7 percent
of all stocks are on special in 2000 and 2001. Thus, the shares of PIPE issuers tend to be
unusually difficult to borrow, thereby reducing the opportunity of investors to profit from short
sales.18
4.2.2 Calculating Abnormal Returns to Public Shareholders
To calculate the abnormal post-issue stock performance to an issuer’s common
shareholders, we compare the monthly performance of a company issuing a PIPE to the
performance of a benchmark portfolio. We assign companies to a benchmark portfolio using a
similar method to that described in Brav and Gompers (1997) and Chalmers, Dann, and Harford
(2002). Companies are assigned to one of twenty-five benchmark portfolios in the year prior to
the PIPE offering using the market value of equity and the ratio of book value to market value.
The benchmark portfolios are constructed on an annual basis by first taking the companies
appearing in both the CRSP and COMPUSTAT databases and separating them into quintiles
according to the market value of assets as of June of the previous year. Then, each of these
quintiles is separated into quintiles based upon the ratio of the book value to the market value of
assets in June of the previous year. The returns from the benchmark portfolio returns as well as
18 In untabulated results, we find that the probability that a company’s stock will go on special in the year of the PIPE issue is positively correlated with the discount of the conversion price to the stock price. However, it is difficult to determine whether investors demand greater discounts for stocks that they anticipate will be harder to borrow or whether there is a greater demand to short stocks that have larger discounts.
24
the breakpoints needed to assign a sample firm to the benchmark portfolio are obtained from Ken
French’s data library. We calculate cumulative abnormal returns using the following approach:
CARi=
−
++∏
+ 10
0
111
,
,tt
t tm
ti
RR
Ri is the monthly return for the sample firm. Rm is the return on the size and book to market
matched benchmark portfolio. t0 is the month of the PIPE issue. t1 is the number of months
during which the returns are calculated. The results from our analysis are similar when we
estimate the abnormal return as the difference between the cumulative returns for sample firms
from t0 to t1. The results are also similar when we exclude companies with share prices below $3
at the time of the offering.
The cumulative abnormal returns for price protected and unprotected PIPEs for up to a
year following the issue are shown in Table 8 and Figure 3. These results indicate that the large
majority of companies issuing PIPEs underperform the market benchmark in the year following
issue. The cumulative abnormal return through 12 months post- issue is negative for 75 percent
of protected PIPE issuers and 64 percent of unprotected PIPE issuers. Almost 25 percent of
price protected PIPE issuers and 16 percent of unprotected PIPE issuers are delisted by the end
of the calendar year following the offering.19 The median abnormal return through 12 months is
–40.7 percent for protected PIPE issuers and –26.7 percent for unprotected PIPE issuers. The
average abnormal return through 12 months is -22.3 percent for the protected PIPE issuers is -1.9
percent for unprotected PIPE issuers, although this value is not statistically different from zero.
19 If a company is delisted within the 12 month window following the PIPE issue, the delisting return (if available) is used as the return for the month of the delisting. The returns for the remaining months are set equal to 0 percent. These returns are then adjusted by the returns on the benchmark portfolio to calculate abnormal returns.

25
Regardless of the window used, returns are greater for unprotected PIPEs issuers than protected
PIPEs issuers.
Figure 4 depicts the distribution of unprotected and protected PIPE returns to public
shareholders of PIPE issuers. The figure shows that while both PIPEs are likely to be “losers,” a
substantial fraction of PIPEs result in “big wins.” For example, 12 percent of unprotected PIPEs
increase by more than 100 percent in the year following issue, and eight percent increase by
more than 150 percent. Similarly, seven percent of the companies issuing protected PIPEs are up
by at least 100 percent in the year following issue and four percent of the companies increase by
more than 150 percent. However, it is worth recalling that investors in price protected PIPEs are
substantially less exposed to declines in the issuer’s post- issue stock price. These investors are
also able to fully participate in the case of large gains and often have warrants that allow them to
capitalize on favorable outcomes. Although unprotected PIPEs do not provide investors with
downside protection, the warrants received in a few investments can potentially result in such
large payoffs that the losses incurred on other investments are more than offset. Finally, in
addition to these payoffs, private investors returns are enhanced by their ability to purchase
shares at a discount to market prices. Therefore, although most companies issuing PIPEs
underperform the market, PIPE investors do not necessarily do so.
4.2.3 Calculating Abnormal Returns to PIPE Investors
To examine to what extent PIPE investors’ returns diverge from public shareholders’
returns, we repeat the estimation of long-run returns above but in this instance include several of
the earlier mentioned features that can differentiate their returns. This analysis takes into
account the size of the discount or premium on the purchase of shares, any price protective

26
features, any interest paid on the security, and whether any warrants included in the deal would
have been “in- the-money” in the twelve months post- issue. In computing these estimated returns
we assume that investors do not convert any shares or sell any of their equity stake during the 12
months following the PIPE issue. We also assume that investors in protected PIPEs earn the
same return as unprotected PIPE investors if the company’s stock gets delisted.
The average estimated returns for investors in price protected and protected PIPEs are
shown in Table 8. These estimates do not incorporate any gains or losses from offsetting
positions, e.g., shorting the stock. They also do not take into consideration the costs PIPE
investors might incur unwinding their positions, i.e., liquidity costs. The average return through
12 months after a PIPE issue is 21.5 percent for protected PIPE investors (versus -22.3 percent
for public shareholders) and 17.6 percent for unprotected PIPE investors (versus -1.9 percent for
public shareholders). Both of these values are statistically significant at the 1 percent level.
Therefore, the results indicate a significant ability on the part of PIPE investors to positively
differentiate their returns relative to public shareholders.
4.3 Regressions on Post-Issue Stock Performance
In Table 9, we estimate regressions of the entire sample of PIPEs. We consider two
dependent variables. In the first regression we use the cumulative abnormal return from month 0
to +12. In the second regression, we take a similar approach to Hillion and Vermaelen (2003)
and use dummy variable that is equal to one if the company’s stock was delisted by the end of
the calendar year following the PIPE issue and is zero otherwise. As shown in Table 8, almost
25 percent of protected PIPE issuers and approximately 16 percent of unprotected PIPE issuers
are delisted during this window. The independent variables in the regression are the same

27
variables as those used in the regression of announcement date returns. These include variables
pertaining to the characteristics of the PIPE contract, the issuer’s prior stock performance and
operating characteristics, and the number of years since the issuer’s IPO. The results presented
on Table 9 are similar when we restrict the regressions to companies whose shares trade above
$3 per share at the time of the PIPE issue, to the first PIPE issued by a firm, and when we
winsorize the data at various levels.
The coefficient on the dummy variable UNPROTECT in the first regression is 0.265 and
is significantly different from zero. This indicates that after we control for the other
characteristics of the PIPE offering, the returns through 12 months following the PIPE issue are
more than 26 percentage points greater for unprotected PIPEs than protected PIPEs issuers. As
shown in Table 8, this difference in returns largely reflects the abnormally poor performance of
protected PIPE issuers rather than positive performance of unprotected PIPE issues. The
abnormal returns for the 12 months leading up to the PIPE issue (month -12 to month -1) is the
also significant. The negative coefficient of this variable indicates that there is mean reversion in
returns. The coefficient of Log of Market Value is also marginally significant indicating that
larger firms issuing PIPEs underperform smaller issuers.
The coefficient on the dummy variable UNPROTECT in the second regression is -0.053
and is significantly different from zero. This is not surprising given the results presented in
Table 8. The negative coefficient on the prior abnormal performance variable shows that
companies that perform better in the 12 months preceding a PIPE issue are less likely to be
delisted. Finally, unlike the regression on post issue stock returns, the cash depletion rate
variable is significantly correlated with the likelihood of a company being delisted. The positive
coefficient of this variable indicates that companies burning through cash at a faster rate prior to
28
the PIPE issue are more likely to be delisted following the issue. We interpret this as evidence
that the cash depletion rate is a useful indicator of a company’s operating risks.
5. Conclusion
This study provides the first comprehensive look at PIPE (private investments in public
equity) securities, their features, and effects on the firms and investors using this new form of
financing. Since the beginning of the market in 1995, the amount of capital raised through PIPE
transactions has increased steadily from $899 million in 1995 to more than $12.6 billion in 2000,
and now represents about 8 percent of the capital raised by seasoned equity offerings.
Between the years 1995 and 2000, a total of 1,062 firms issued 2,158 PIPEs, in the form
of Floating Rate Convertible Preferred Stock, Convertible Resets, Common Stock Resets,
Structured Equity Lines, and Common Stock. The large majority of PIPEs are issued by
companies experiencing poor operating and stock performance. About 75 percent of PIPE
issuers have negative operating income and more than 50 percent underperform the market in the
year prior to issue. Therefore, PIPEs are usually issued by companies for which other more
traditional forms of financing are not likely available.
We compare PIPEs with limited downside risk or “price protected” PIPEs (floating rate
convertible preferred stock and resets) to “unprotected” PIPEs (common stock and structured
equity lines). We find that operating characteristics are similar for “protected” and
“unprotected” PIPEs. However, stock returns around the announcement of a “price protected”
PIPEs are significantly negative, while the stock returns around unprotected PIPEs are
significantly positive. Moreover, “unprotected” PIPEs outperform “protected” PIPEs in the year
following PIPE issuance.
29
The negative abnormal returns following the issue of a protected PIPEs are consistent
with a recent study by Hertzel, Lemmon, Linck, and Rees (2002) that documents
underperformance in companies following traditional private equity investments. Hertzel et. al
(2002) attribute this underperformance to shareholders’ having an overly optimistic views of the
future prospects for the issuer. However, given the significantly negative reaction of investors
upon learning of a price protected PIPE issue, it is difficult to characterize public investors’
reaction to these companies as overly optimistic. If anything, their reaction might be better
described as being “under pessimistic.”
Although companies that issue PIPEs tend to perform poorly, we find that PIPE investors
on average earn positive returns from their investments. Therefore, PIPE contracts appear to be
successful in providing a structure that allows for companies that are facing substantial
uncertainties to raise capital without fully exposing capital providers to these risks.

30
References
Almeida, H., M., Campello, and M. Weisbach, 2003, The Cash Flow Sensitivity of Cash,
Journal of Finance, forthcoming. Altman, E., 1993, “Corporate Financial Distress and Bankruptcy,” 2nd edition, John Wiley & Sons. Asquith, P. and D. Mullins, 1986, Equity issues and offering dilution, Journal of Financial
Economics 15, 61-89. Baker, M., J. Stein, and J. Wurgler, 2003, “When Does the Market Matter? Stock Prices and the
Investment of Equity-Dependent Firms, Quarterly Journal of Economics 188, no.3. Brennan, M., 1985, Costless Financing Policies under Asymmetric Information, unpublished
manuscript, UCLA. Brav, A., and P. Gompers, 1997, Myth or Reality? The Long Run Underperformance of Initial
Public Offerings: Evidence from Venture and Non venture Capital-Backed Companies, Journal of Finance 52, 1791- 1821.
Chalmers, J., L. Dann, and J. Harford, 2002, Managerial Opportunism? Evidence from Directors’
and Officers’ Insurance Purchases, Journal of Finance 57, 609 – 635. Chaplinsky, S. and R. S. Hansen, 1993, Partial Anticipation, the Flow of Information and the
Economic Impact of Corporate Debt Sales, Review of Financial Studies 6, no. 3, 1863-1889.
D’Avolio, G., 2002, The Market for Borrowing Stock, Journal of Financial Economics 66, 241-
269. 271-306. Fazzari, S. M., Hubbard, R. Glenn, and B. Petersen, 1988, Financing Constraints and Corporate
Investment, Brookings Papers on Economic Activity, no. 1, 141-195. Heron, R., and Lie E., 2003, A Comparison of the Motivations for and the Information Content
of Different Types of Equity Offerings, Journal of Business, forthcoming. Gezcy, C., D. Musto, and A. Reed, 2002, Stocks are Special Too: An Analysis of the Equity
Lending Market, Journal of Financial Economics 66, 241-269. Hertzel, M., and L., Rees, 1998, Earnings and Risk Changes Around Private Placements of
Equity. Journal of Accounting, Auditing, and Finance 13, No. 1, Winter. Hertzel, M. and R. L. Smith, 1993, Market Discounts and Shareholder Gains for Placing Equity
Privately, Journal of Finance 48, 459-485.

31
Hertzel, M., M. Lemmon, J. Linck, and L. Rees, 2002, Long-run Performance Following Private Placements of Equity, Journal of Finance 57, 2595-2617.
Hillion, P., and T. Vermaelen, 2003, Death Spiral Convertibles, Journal of Financial Economics,
forthcoming. Hoshi, T., Kashyap, A., and D. Scharfstein, 1991, Corporate Structure, Liquidity, and
Investment: Evidence from Japanese Industrial Groups, The Quarterly Journal of Economics 106, no. 1, 33-60.
Houston, J. F. and C. M. James, 1996, Bank Monopolies and the Mix of Private and Public Debt,
Journal of Finance 51, no. 5, 1863-1889. Kaplan, S. N. and L. Zingales, 1997, Do Investment-Cash Flow Sensitivities Provide Useful
Measures of Financing Constraints? The Quarterly Journal of Economics 112, no. 1, 169-215.
Korajczyk, R., D. Lucas, and R. McDonald, 1990, Understanding Stock Price Behavior around
the Time of Equity Issues, in Asymmetric Information, Corporate Finance and Investment , R. Glenn Hubbard, editor, (NBER: University of Chicago Press.)
Krishnamurthy, S., P. Spindt, V. Subramaniam, and T. Woidtke, 2000, Does Investor Identity
Matter in Equity Issues? Evidence from Private Placements, A. B. Freeman School of Business, Tulane working paper.
Masulis, R. and A. Korwar, 1986, Seasoned Equity Offerings: An Empirical Investigation,
Journal of Financial Economics 15, 91-118. Mikkelson, W. and M. Partch, 1986, Valuation Effects of Security Offerings and the Issuance
Process, Journal of Financial Economics 15, 30-31. Myers, S. and N. Majluf, 1984, Corporate financing and Investment Decisions when Firms have
Information that Investors Do Not Have, Journal of Financial Economics 13, 187-222. Ritter, J. and T. Loughran, 1997, The Operating Performance of Firms Conducting Seasoned
Equity Offerings, Journal of Finance 52, no. 5, 1823-1850. Whited, T. M., 1992, Debt, Liquidity Constraints, and Corporate Investment: Evidence from
Panel Data, Journal of Finance 47, no. 4, 1425-1460. Wruck, K., 1989, Equity Ownership Concentration and Firm Value: Evidence from Private
Equity Financings, Journal of Financial Economics 23, 3-18.

32
Appendix
Example of Press Release Describing the Issue of a PIPE
Good Guys Completes $9.36 Million Private Placement
SAN FRANCISCO, Aug. 22 /PRNewswire/ -- Good Guys (NASDAQ: GGUY), a leading specialty retailer of consumer entertainment electronics, today announced the completion of a private placement of $9.36 million of its common stock. Participants in the offering include every member of Good Guys' board ofdirectors and key management personnel, including Chairman and CEO Ronald A. Unkefer and newly appointed President Kenneth R. Weller. The proceeds of the offering will be used to strengthen Good Guys' balance sheet and enhance the availability of exclusive, limited distribution consumer entertainment electronics products in advance of the holiday shopping season. "Good Guys is poised to enter the holiday shopping season stronger and healthier than we have been in years, and we want to ensure that we capitalize on every opportunity to make November and December as profitable as possible," said Unkefer. "This infusion of cash will augment our balance sheet while allowing us to quickly stockpile a unique selection of fully featured digital and high-tech products that is above and beyond the generous allocation already being offered by our major suppliers." Investors purchased 2,017,647 restricted shares of the company's common stock at $4.64 a share, the closing price of the company's common stock on the NASDAQ National Market at the time of purchase. The investors also received warrants exercisable for three years to purchase 1,008,822 additional common shares at the same price. "I firmly believe that Good Guys has the right strategy, right product mix and right senior management to emerge as one of the most profitable and well-respected consumer electronics retailers in the world," said Weller, who recently rejoined Good Guys as president after seven years as senior vice president of sales at Best Buy. "The confidence and commitment of the officers and directors demonstrated by this investment underscore my enthusiasm for returning to Good Guys to fortify the recent sales resurgence and maximize growth opportunities." With the completion of the offering, Good Guys has a total of 22,671,434 shares of common stock outstanding. Good Guys is a leading specialty retailer of consumer entertainment electronics, offering a distinctive selection of fully featured digital and high-tech products from more than 100 of the world's most respectedmanufacturers. Founded in 1973, Good Guys currently operates 79 stores in California, Nevada, Oregon and Washington. For more information, visit http://www.goodguys.com. http://www.prnewswire.com/comp/108403.html

33
Table 1
Private Placement of Public Equity and Seasoned Equity Offerings 1995 – 2000
Type of Issue 1995 1996 1997 1998 1999 2000
No. of issues 30 149 233 194 116 90 Floating Rate Convertibles Amount Raised $232.4 $1,307.0 $1,822.5 $1,059.3 $869.4 $794.7
No. of issues 5 2 6 13 21 34 Common Stock Resets Amount Raised $28.3 $7.4 $24.2 $75.0 $145.1 $338.1
No. of issues 3 10 9 10 17 41 Convertible Resets Amount Raised $14.2 $186.2 $145.8 $107.0 $175.1 $1,125.8
No. of issues 0 1 10 12 10 69 Structured Equity Lines Amount Raised $0.0 $7.5 $41.3 $28.2 $46.1 $368.6
No. of issues 58 99 119 127 284 386 Common Stock PIPEs Amount Raised $624.3 $1,425.9 $1,545.3 $1,007.5 $3,238.1 $10,040.2
Total Amount Raised $899.2 $2,934.0 $3,579.1 $2,277.0 $4,473.8 $12,667.4
Seasoned Equity Offerings No. of issues 516 612 537 382 397 357
Amount Raised $71,548.9 $88,201.8 $73,028.5 $58,774.1 $55,879.2 $50,165.9
34
Table 2
Characteristics of Companies issuing PIPEs by Contract Type
The sample includes all security offerings that are identified by Placementtracker as a private placement of public equity (PIPE) and that have CRSP data available. Unless otherwise noted, the reported value is the median of the variable in year -1. Pre-Issue Stock Returns are the returns from month -6 to month -1 adjusted by a market benchmark based on size and book to market. % with Pre-Issue Stock Returns Greater than 25% is the fraction of firms with adjusted returns from month -6 to month -1 greater than 25%. Book Value of Assets is the book value of assets in year -1. Return on Assets is the return on assets in year-1. % with Negative Operating Income is the fraction of firms with operating income less than $0. Cash ÷ Assets is the ratio of Cash and Equivalents to Assets. Cash Burn Rate is calculated as the absolute value of the inverse of Cash and Cash Equiva lents ÷ absolute value of Operating Income before Depreciation. This ratio is set equal to zero for companies with positive operating income. Therefore larger values of this ratio indicate a shorter time until cash holdings will be exhausted. Debt to Assets is the ratio of total debt to assets. % Paying Dividends is the fraction of companies paying dividends. A higher value (lower value) indicates more constrained for the Kaplan & Zingales (1997) Index (Altman Z-score).
Floating
Rate Convertible
Convertible Reset
Common Stock Reset
Structured Equity Line
Common Stock PIPE
Pre-Issue Stock Returns (%) -9.8 -25.1 11.3 -11.5 -3.2 % with Pre-Issue Stock Returns Greater than 25% 23.5 23.4 38.5 26.5 32.4 Book Value of Assets ($ MM) 16.7 29.2 20.1 19.1 19.7 Return on Assets (%) -28.5 -21.2 -27.7 -36.8 -25.1 % with Negative Operating Income 83.6 80.0 80.8 93.4 74.9 Cash ÷ Assets (%) 20.1 26.5 28.9 39.1 29.2
Cash Burn Rate (Years of Cash Remaining) 0.9 1.0 1.2 0.6 1.4 Debt to Assets (%) 17.5 13.7 8.3 6.3 7.8 % Paying Dividends 1.9 3.2 2.0 3.3 2.2
Kaplan & Zingales (1997) Index 0.26 0.27 0.37 0.09 0.05 Altman’s Z-Score 3.5 7.6 4.0 4.7 4.7

35
Table 3 Pre-Issue Operating and Financial Characteristics of PIPE and SEO Issuers
The PIPE data are from Placementtracker and the data on seasoned equity offerings (SEO) are from Security Data Corporation (SDC). Unless otherwise noted, items are reported in $ millions. Year 0 is the year the security is issued. Years until Cash is Depleted is calculated as the ratio of cash and marketable securities to operating income before depreciation. Percent with Publicly Traded Debt is estimated from the companies that have a debt rating assigned by Standard and Poors’. Financial data are from COMPUSTAT. Data on the years since IPO are from SDC. ***, **, * indicates values are significantly different from zero at the 1%, 5%, and 10% level, respectively.
Medians of Variables: PIPES SEOs
Sales
Year -1 Year 0
8.16 11.08
90.36*** 147.06***
Operating Income before Deprec.
Year -1 Year 0
-4.28 -5.18
13.41*** 23.02***
Total Assets
Year -1 Year 0
18.93 24.02
128.13*** 247.76***
Return on Assets
Year -1 Year 0
-30.01% -29.83%
12.71%*** 12.90%***
Market Value of Equity
Year -1 Year 0
54.17 58.84
252.34*** 435.21***
Market to Book Ratio
Year -1 Year 0
3.37 2.93
2.24*** 2.17***
Total Debt to Assets
Year -1 Year 0
10.25% 11.86%
18.75%*** 11.42%
Percent with Neg. Operating Income Year -1 Year 0
78.7% 78.6%
21.8%*** 20.77%
Years until Cash Depleted a Year -1 Year 0
0.83 0.78
1.85*** 3.21***
Years since IPO 4 3
Percent with Public Debt 2.80% 25.1%***
a This ratio is only calculated for companies with negative operating income for the year.

36
Table 4
Abnormal Returns around PIPE Offerings
Average cumulative abnormal stock returns for company i the window between day t0 and day t1 are calculated using daily returns as:
CARi=
−
++∏
+ 10
0
111
,
,tt
t tm
ti
RR
Rm is the return on a benchmark portfolio. The results presented here are calculated using CRSP’s value-weighted
portfolio. Results are similar when we use equally weighted portfolio or alternative measures of abnormal returns. The sample includes 1,989 PIPEs issued between 1995 and 2000 by companies that are in the CRSP database and not missing daily returns during the sample 21 day period. PIPEs are classified as protected if they include a reset provision in which a conversion price or number of shares issued is reset if the stock price decreases following the offering. PIPEs in this category include Floating Rate Convertibles, Convertible Resets, and Common Stock resets. Unprotected PIPEs include Common Stock PIPEs and Structured Equity Lines. These securities are sold at a discount to the market price of the stock and often contain warrants, but do not have reset provisions. ***, **, * indicates values are significantly different from zero at the 1%, 5%, and 10% level, respectively.
Protected Unprotected P-Value of Differences
Relative Trading Day to PIPE issue Mean Median Mean Median Mean Median
Day –10 to -2 1.71%** -2.32%*** 3.43%*** -0.24% 0.117 0.002 Day –1 to +1. 0.92%** -0.66%* 3.49%*** 0.95%*** 0.001 0.001 Day +2 to +10 -3.89%*** -5.81%*** 2.80%* -1.44%** 0.001 0.001 Day –10 to +10 -1.95% -6.44%*** 10.94%*** 2.01%*** 0.001 0.001 Fraction with negative CAR –10 to +10 63.3% 45.8% 0.001 Number of Observations 889 1050

37
Table 5 Regression Analysis of Announcement Returns around PIPE Issues
The dependent variable is the cumulative abnormal return for a 21 trading day window around a PIPE issue (day –10 to day +10). Results for regressions on all sample firms are presented in Column 1. Regression results for sample companies that have a market price per share greater than $3 at the time of the PIPE issue are in Column 2. Regression results on the returns only for the first PIPE a firm issues are included in Column 3. UNPROTECT is a dummy variable that equals 1 if the PIPE is price unprotected and 0 if the PIPE is protected. Proceeds/Market Value is the ratio of the proceeds from the PIPE offering to the market value of equity at the time of the offering. Conversion / Purchase Discount is the ratio between the price at which shares can be converted or purchased to the market price minus one. This variable is set equal to 0 if this conversion or purchase price is equal to or greater than the market price. Abnormal Prior Performance is the sample firm’s cumulative abnormal stock performance from month –12 to month –1 relative to a size and book to market matched benchmark portfolio. Change in Sales is a dummy variable that is set equal to one if sales increased between year –2 and year –1. Cash Depletion Rate is the ratio of 1 ÷ Years until Cash is Depleted (the ratio of cash and marketable securities to operating income before depreciation). For companies that have positive operating cash flow this variable is set equal to 0. Years since IPO year of PIPE offering minus the year of the IPO. Financial data are from COMPUSTAT. P-values are in parentheses and in bold if less than 0.10.
All Price > $3 1st issue 1 2 3 Intercept -0.018
(0.703) -0.068
(0.266) -0.002
(0.975) UNPROTECT 0.116
(0.001) 0.116
(0.001) 0.107
(0.001) Proceeds/Market Value -0.008
(0.778) 0.068
(0.128) -0.014
(0.657) Conversion / Purchase Discount -0.053
(0.446) -0.053
(0.528) 0.035
(0.687) Abnormal Prior Performance (Month –12 to Month –1)
-0.001 (0.814)
-0.003 (0.569)
0.001 (0.883)
Change in Sales 0.001 (0.959)
0.024 (0.339)
0.024 (0.369)
Cash Depletion Rate -0.004 (0.451)
0.006 (0.436)
-0.002 (0.808)
Log of Market Value of Equity -0.004 (0.675)
0.002 (0.857)
-0.006 (0.540)
Years since IPO 0.001 (0.358)
0.001 (0.567)
0.001 (0.855)
Number of Observations 940 635 547 Adjusted R2 0.028 0.029 0.018 P-Value of F-test <0.001 <0.001 0.021

38
Table 6
Operating Characteristics of Protected and Unprotected PIPEs
Price protected PIPEs (Floating Rate Convertibles and Resets) limit an investor’s downside risk to declines in the issuer’s stock price Unprotected PIPEs (Common Stock and Structured Equity Lines) are not protected against declines in the issuer’s stock price. Financial data are from COMPUSTAT. Unless otherwise noted, items are reported in $ millions. Year 0 is the year the security is issued. ***, **, * indicates values are significantly different from zero at the 1%, 5%, and 10% level, respectively. Protected Unprotected P Value of Differences
Mean Median Mean Median Mean Median
Sales
Year -1 Year +1
52.90 60.90
8.42 11.62
51.01 119.07
8.03 12.99
0.92 0.13
0.90 0.28
Pre Tax Operating Income Year -1 Year +1
-1.89 -5.31
-4.35 -4.97
-4.39 -0.64
-4.17 -5.44
0.51 0.29
0.65 0.71
Total Assets Year -1 Year +1
74.79 100.57
17.85 20.94
115.19 236.67
19.65 30.19
0.30 0.01***
0.05 0.01***
Return on Assets Year -1 Year +1
-0.43 -0.45
-0.30 -0.29
-0.39 -0.37
-0.29 -0.23
0.35 0.04**
0.10* 0.02**
Market Value of Equity Year -1 Year +1
135.36 153.35
53.85 44.72
218.65 293.78
54.56 63.67
0.02** 0.01***
0.55 0.01***
Years until Cash Depleted Year -1 Year +1
1.93 1.31
0.69 0.44
9.75 11.38
0.95 0.94
0.21 0.17
0.01*** 0.01***
Pct w/Neg. Operating Income Year -1 Year +1
0.80 0.78
- 0.77 0.76
- 0.22 0.32
-
Percent with No Revenues Year -1 Year +1
0.07 0.07
- 0.06 0.06
- 0.77 0.79
-
No. Observations Year -1 No. Observations Year +1
598 506
728 643

39
Table 7
Features of PIPE Contracts
The sample includes all security offerings that are identified by Placementtracker as a private placement of public equity (PIPE) and that have CRSP data available. Issue Size is the proceeds received from the issue. For structured equity lines this value is the expected proceeds. Issue Size as Percent of Outstanding Shares is the ratio of the number of shares issued or shares converted via the PIPE issue to the number of shares outstanding prior to the PIPE issue. For PIPEs with floating conversion prices shares issued is based on current market prices. Conversion or Purchase Discount is the ratio between the price at which shares can be converted or purchased to the market price minus one. This variable is set equal to 0 if this conversion or purchase price is equal to or greater than the market price. I the Shares Issued / Volume is the ratio of the number of shares issued through the PIPE contract to the average daily trading volume. % with Warrants is the fraction of issues that include warrants. % with Floors is the fraction of issues that include floor provision. A floor provision sets a minimum conversion price. Unprotected PIPEs have a fixed purchase price and no floor. Daily Trading Volume is the average for the three months preceding the PIPE issue. Shares Issued / Volume is the ratio number of shares issued or shares convertible through the PIPE issue to the average daily trading volume. % On Special, year 0 is based on whether the PIPE issuer’s stock had a reduced rebate in the equity lending market during the year of the PIPE issue. % On Special, year 1 is based on whether the issuer’s stock had a reduced rebate during the calendar year subsequent to the PIPE issue. Median values are presented below average values.
Price Protected Price Unprotected
P-value of Differences
Contract Features
Issue Size ($MM) 9.00 5.00
19.26 6.00
0.001 0.001
Issue Size as Percent of Outstanding Shares
12.79 10.87
15.07 12.53
<0.001 <0.001
Conversion or Purchase Discount (%)
12.92 14.74
15.44 12.00
0.005 0.045
Fraction with Warrants 47.04 34.91 <0.001 Fraction with Floors 29.20 --- ---
Trading Characteristics
Daily Trading Volume (000s) 219.50 100.70
206.75 74.96
0.571 0.001
Shares Issued / Volume 22.17
13.89 24.41 19.64
<0.001 <0.001
Fraction on Special, Year 0 57.66 51.86 0.051 Fraction on Special, Year 1 65.72 56.98 0.003
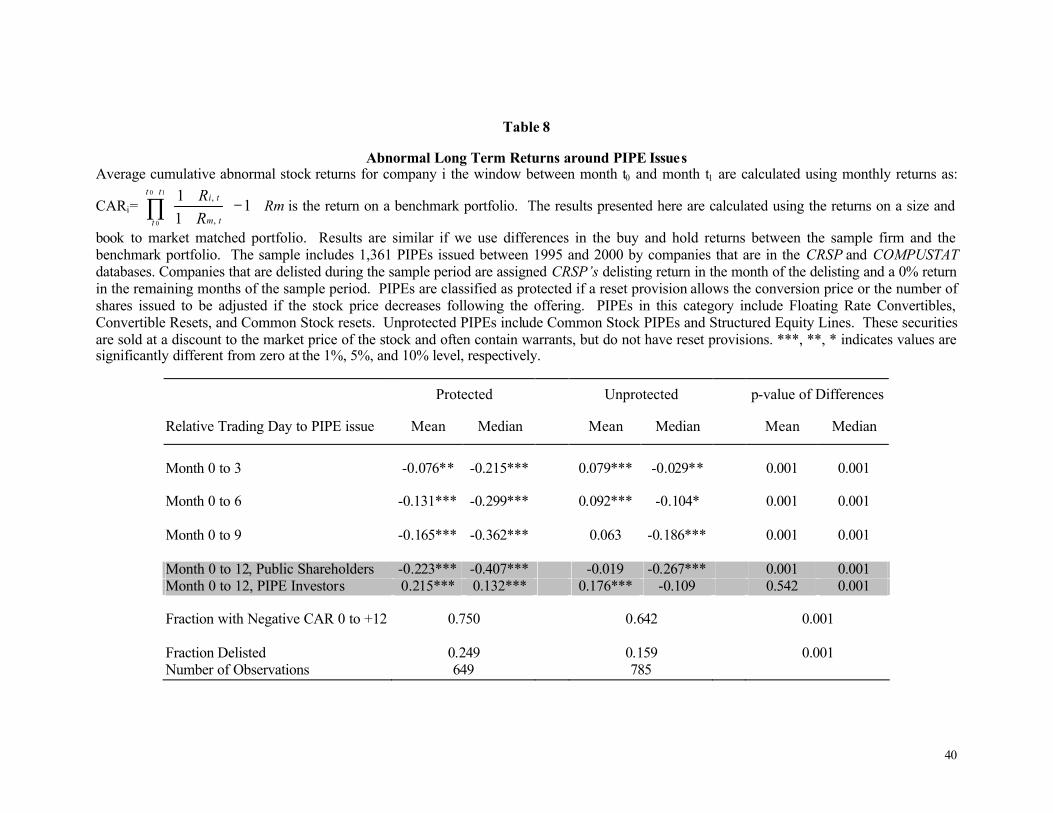
40
Table 8
Abnormal Long Term Returns around PIPE Issues Average cumulative abnormal stock returns for company i the window between month t0 and month t1 are calculated using monthly returns as:
CARi=
−
++∏
+ 10
0
111
,
,tt
t tm
ti
RR
Rm is the return on a benchmark portfolio. The results presented here are calculated using the returns on a size and
book to market matched portfolio. Results are similar if we use differences in the buy and hold returns between the sample firm and the benchmark portfolio. The sample includes 1,361 PIPEs issued between 1995 and 2000 by companies that are in the CRSP and COMPUSTAT databases. Companies that are delisted during the sample period are assigned CRSP’s delisting return in the month of the delisting and a 0% return in the remaining months of the sample period. PIPEs are classified as protected if a reset provision allows the conversion price or the number of shares issued to be adjusted if the stock price decreases following the offering. PIPEs in this category include Floating Rate Convertibles, Convertible Resets, and Common Stock resets. Unprotected PIPEs include Common Stock PIPEs and Structured Equity Lines. These securities are sold at a discount to the market price of the stock and often contain warrants, but do not have reset provisions. ***, **, * indicates values are significantly different from zero at the 1%, 5%, and 10% level, respectively.
Protected Unprotected p-value of Differences
Relative Trading Day to PIPE issue Mean Median Mean Median Mean Median
Month 0 to 3 -0.076** -0.215*** 0.079*** -0.029** 0.001 0.001 Month 0 to 6 -0.131*** -0.299*** 0.092*** -0.104* 0.001 0.001 Month 0 to 9 -0.165*** -0.362*** 0.063 -0.186*** 0.001 0.001 Month 0 to 12, Public Shareholders -0.223*** -0.407*** -0.019 -0.267*** 0.001 0.001 Month 0 to 12, PIPE Investors 0.215*** 0.132*** 0.176*** -0.109 0.542 0.001 Fraction with Negative CAR 0 to +12 0.750 0.642 0.001 Fraction Delisted 0.249 0.159 0.001 Number of Observations 649 785

41
Table 9
Regression Analysis of Long Term Returns around PIPE Issues The dependent variables are the cumulative abnormal return for a 13 month window around a PIPE issue (month 0 to month 12) and a dummy indicating whether the company was delisted within one calendar year after the PIPE issue (1) or not (0). The calculations of the abnormal returns are described in Table 8. The regressions are estimated on the entire sample firms. Results are similar when we winsorize the data a various level, only include companies that have a market price per share greater than $3 at the time of the PIPE issue are or only include the first PIPE a firm issues. UNPROTECT is a dummy variable that equals 1 if the PIPE is price unprotected and 0 if the PIPE is price protected. Proceeds/Market Value is the ratio of the proceeds from the PIPE offering to the market value of equity at the time of the offering. Discount is the difference between the price at which shares can be converted or purchased to the market price. This variable is set equal to 0 if this conversion or purchase price is equal to or greater than the market price. Abnormal Prior Performance is the sample firm’s cumulative abnormal stock performance from month –12 to month –1 relative to a size and book to market matched benchmark portfolio. Change in Sales is a dummy variable that is set equal to one if sales increased between year –2 and year –1. Cash Depletion Rate is the ratio of 1 ÷ Years until Cash is Depleted (the ratio of cash and marketable securities to operating income before depreciation). For companies that have positive operating cash flow this variable is set equal to 0. Years since IPO is the year of PIPE offering minus the year of the IPO. Financial data are from COMPUSTAT. P-values are in parentheses and in bold if less than 0.10.
Dependent Variable : Abnormal +12 month Returns
Delisted
Intercept -0.060 (0.684)
-0.884 (0.001)
UNPROTECT 0.265 (0.001)
-0.053 (0.022)
Proceeds / Market Value -0.069 (0.663)
0.060 (0.299)
Conversion or Purchase Discount 0.358 (0.158)
0.005 (0.954)
Prior Abnormal Performance (Month –12 to Month –1) -0.032 (0.025)
-0.011 (0.039)
Change in Sales -0.076 (0.249)
0.009 (0.691)
Cash Depletion Rate -0.001 (0.949)
0.031 (0.001)
Log of Market Value of Equity -0.044 (0.093)
0.003 (0.754)
Years since IPO 0.001 (0.745)
-0.002 (0.394)
Number of Observations 912 919 Adjusted R2 0.020 0.032 P-Value of F-test 0.001 0.001
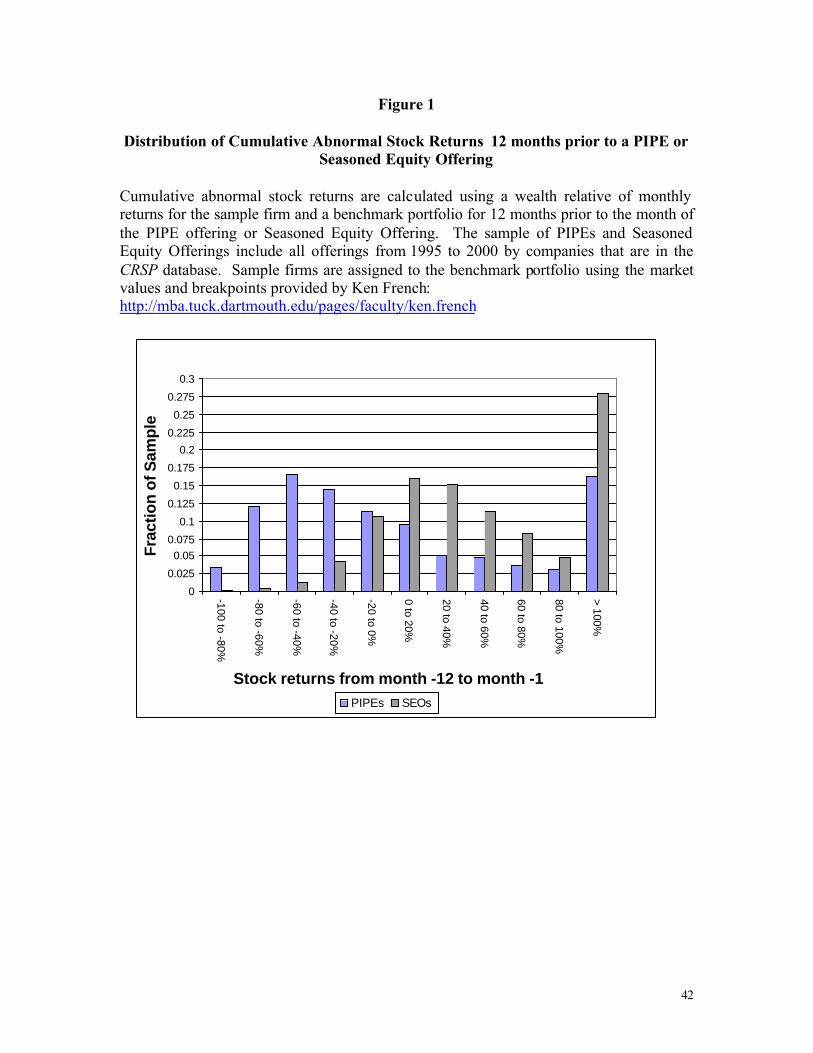
42
Figure 1
Distribution of Cumulative Abnormal Stock Returns 12 months prior to a PIPE or Seasoned Equity Offering
Cumulative abnormal stock returns are calculated using a wealth relative of monthly returns for the sample firm and a benchmark portfolio for 12 months prior to the month of the PIPE offering or Seasoned Equity Offering. The sample of PIPEs and Seasoned Equity Offerings include all offerings from 1995 to 2000 by companies that are in the CRSP database. Sample firms are assigned to the benchmark portfolio using the market values and breakpoints provided by Ken French: http://mba.tuck.dartmouth.edu/pages/faculty/ken.french
0
0.025
0.050.075
0.1
0.125
0.15
0.175
0.2
0.225
0.25
0.275
0.3
-100 to -80%
-80 to -60%
-60 to -40%
-40 to -20%
-20 to 0%
0 to 20%
20 to 40%
40 to 60%
60 to 80%
80 to 100%
> 100%
Stock returns from month -12 to month -1
Frac
tion
of S
ampl
e
PIPEs SEOs

43
Figure 2
Market Adjusted Returns around the Announcement of PIPE Offerings Average cumulative abnormal stock returns are calculated using a wealth relative of daily returns for the sample firm and CRSP’s value-weighted market portfolio. The sample The sample includes 1,989 PIPEs issued between 1995 and 2000 by companies that are in the CRSP database and not missing daily returns during the sample 21 day period. PIPEs are classified as protected if they include a reset provision in which a conversion price or number of shares issued is reset if the stock price decreases following the offering. PIPEs in this category include Floating Rate Convertibles, Convertible Resets, and Common Stock resets. Unprotected PIPEs include Common Stock PIPEs and Structured Equity Lines.
-4%
-2%
0%
2%
4%
6%
8%
10%
12%
-10
-8 -6 -4 -2 0 2 4 6 8 10
Trading Days relative to Pipe Offering Date
Cu
mu
lati
ve M
arke
t-A
dju
sted
R
etu
rn
Protected PIPEs Unprotected PIPEs

Figure 3
Market Adjusted Long Term Returns following a PIPE Offering Average cumulative abnormal stock returns are calculated using a wealth relative of monthly returns for the sample firm and a size and book-to-market matched benchmark portfolio described in Figure 2. The sample includes 1,428 PIPEs issued between 1995 and 2000 by companies that are in the CRSP database and have book to market data in COMPUSTAT. Companies that are delisted during the sample period are assigned CRSP’s delisting return in the month of the delisting and 0% return in the remaining months of the sample period. PIPEs are classified as protected if the include a reset provision in which a conversion price is reset if the stock price decreases following the offering. These include Floating Rate Convertibles, Convertible Resets, and Common Stock resets. Unprotected PIPEs include Common Stock PIPEs and Structured Equity Lines.
-0.25
-0.2
-0.15
-0.1
-0.05
0
0.05
0.1
0.15
0 1 2 3 4 5 6 7 8 9 10 11 12
Month relative to Pipe Offering Date
Cu
mu
lati
ve M
arke
t-A
dju
sted
R
etu
rn
Protected PIPEs Unprotected PIPEs

Figure 4
Distribut ion of Cumulative Abnormal Stock Returns 12 months after a PIPE Offering
Average cumulative abnormal stock returns are calculated using a wealth relative of monthly returns for the sample firm and a size and book-to-market matched benchmark portfolio described in Figure 2. The sample includes 1,428 PIPEs issued between 1995 and 2000 by companies that are in the CRSP database and have book to market data in COMPUSTAT. Companies that are delisted during the sample period are assigned CRSP’s delisting return in the month of the delisting and 0% return in the remaining months of the sample period. PIPEs are classified as protected if the include a reset provision in which a conversion price is reset if the stock price decreases following the offering. These include Floating Rate Convertibles, Convertible Resets, and Common Stock resets. Unprotected PIPEs include Common Stock PIPEs and Structured Equity Lines.
0.00
0.03
0.05
0.08
0.10
0.13
-100 to -90%
-90 to -80%
-80 to -70%
-70 to -60%
-60 to -50%
-50 to -40%
-40 to -30%
-30 to -20%
-20 to -10%
-10 to 0%
0 to 10%
10 to 20%
20 to 30%
30 to 40%
40 to 50%
50 to 60%
60 to 70%
70 to 80%
80 to 90%
90 to 100%
100 to 150%
>150%
Stock returns from month 0 to month 12
Frac
tion
of S
ampl
e
Unprotected Protected