Embed Size (px)
Citation preview

Financial Statements
Lincluden Private Trust
December 31, 2015
S03
E


The accompanying notes are an integral part of the financial statements. 1
Lincluden Private TrustSTATEMENTS OF FINANCIAL POSITIONAs at
(in dollars except per unit amounts)December 31,
2015December 31,
2014ASSETSCurrent assetsInvestments
Non-derivative financial assets 38,823,088 62,173,614 Cash and cash equivalents 754,152 375,758 Receivable for securities sold 3,054,484 - Subscriptions receivable - 6,503 Accrued investment income and other 179,886 264,101
42,811,610 62,819,976 LIABILITIESCurrent liabilitiesRedemptions payable 3,449,040 29,922 Accrued expenses 6,436 2,265
3,455,476 32,187 Net assets attributable to holders of redeemable units 39,356,134 62,787,789
NET ASSETS ATTRIBUTABLE TO HOLDERS OF REDEEMABLE UNITS PER UNIT 12.13 12.19

The accompanying notes are an integral part of the financial statements. 2
Lincluden Private Trust
STATEMENTS OF COMPREHENSIVE INCOMEFor the periods ended December 31 (note1),
(in dollars) 2015 2014INCOMENet gain (loss) on investments
Dividends 1,038,204 1,107,980 Interest for distribution purposes 839,738 910,776 Net realized gain on non-derivative financial assets 4,929,531 75,882 Change in unrealized gain (loss) on non-derivative financial assets (4,659,224) 2,593,314
Net gain on investments 2,148,249 4,687,952 Net realized and unrealized gain on foreign exchange 102,014 55,410 Total income, net 2,250,263 4,743,362 EXPENSESForeign withholding taxes/tax reclaims 72,651 50,030 Audit fees 10,000 10,000 Custodian fees 49,640 30,910 Filing fees 220 780 Legal fees 3,930 365 Unitholder administration costs 11,645 11,645 Unitholder reporting costs 1,570 1,085 Harmonized Sales Tax/Goods and Services Tax 8,059 5,030 Transaction costs 16,463 27,535 Total expenses 174,178 137,380 Expenses absorbed by the Manager - - Net expenses 174,178 137,380 Increase in net assets attributable to holders of redeemable units from operations before income taxes 2,076,085 4,605,982 Income taxes (note 8) - - Increase in net assets attributable to holders of redeemable units from operations 2,076,085 4,605,982
INCREASE IN NET ASSETS ATTRIBUTABLE TO HOLDERS OF REDEEMABLE UNITS FROM OPERATIONS PER UNIT† 0.41 0.90
WEIGHTED AVERAGE NUMBER OF UNITS 5,006,731 5,134,085† The increase in net assets attributable to holders of redeemable units from operations per unit is calculated by dividing the increase in net assets attributable to holders of redeemable units from operations by the weighted average number of units.

The accompanying notes are an integral part of the financial statements. 3
Lincluden Private TrustSTATEMENTS OF CHANGES IN NET ASSETS ATTRIBUTABLE TO HOLDERS OF REDEEMABLE UNITSFor the periods ended December 31 (note1),
(in dollars) 2015 2014NET ASSETS ATTRIBUTABLE TO HOLDERS OF REDEEMABLE UNITS, BEGINNING OF PERIOD 62,787,789 62,996,481
INCREASE IN NET ASSETS ATTRIBUTABLE TO HOLDERS OF REDEEMABLE UNITS FROM OPERATIONS 2,076,085 4,605,982
DISTRIBUTIONS TO HOLDERS OF REDEEMABLE UNITSFrom net investment income (1,754,321) (1,925,870)From net realized gains on investments (315,290) (1,461,005)
(2,069,611) (3,386,875) REDEEMABLE UNIT TRANSACTIONSProceeds from issue 1,548,694 1,655,716 Reinvested distributions 2,069,611 3,386,875 Payments on redemption (27,056,434) (6,470,390)
(23,438,129) (1,427,799) DECREASE IN NET ASSETS ATTRIBUTABLE TO HOLDERS OF REDEEMABLE UNITS (23,431,655) (208,692)
NET ASSETS ATTRIBUTABLE TO HOLDERS OF REDEEMABLE UNITS, END OF PERIOD 39,356,134 62,787,789

The accompanying notes are an integral part of the financial statements. 4
Lincluden Private TrustSTATEMENTS OF CASH FLOWSFor the periods ended December 31 (note1),
(in dollars) 2015 2014CASH FLOWS FROM OPERATING ACTIVITIESIncrease (decrease) in net assets attributable to holders of redeemable units from operations 2,076,085 4,605,982 Adjustments for:
Net realized (gain) on non-derivative financial assets (4,929,531) (75,882) Unrealized (gain) loss on foreign exchange of cash (81,559) 20,840 Change in unrealized (gain) loss on non-derivative financial assets 4,659,224 (2,593,314) Purchases of portfolio investments (24,271,546) (28,597,097) Proceeds from sale of portfolio investments 44,837,895 31,263,873 Accrued investment income and other 84,215 32,057 Accrued expenses 4,171 1,155
Net cash provided by operating activities 22,378,954 4,657,614
CASH FLOWS FROM FINANCING ACTIVITIESProceeds from issue of redeemable units 1,555,197 1,649,447 Amounts paid on redemption of redeemable units (23,637,316) (6,471,465) Net cash used in financing activities (22,082,119) (4,822,018)
Unrealized gain (loss) on foreign exchange of cash 81,559 (20,840) Net increase (decrease) in cash 296,835 (164,404) Cash and cash equivalents, beginning of year 375,758 561,002 CASH AND CASH EQUIVALENTS, END OF PERIOD 754,152 375,758
Interest received(1) 879,930 909,858 Dividends received, net of withholding taxes(1) 981,206 1,061,925
(1) Classified as operating items.

Lincluden Private Trust
Schedule of Investments Number of Shares / Average Carrying As at December 31, 2015 Par Value $ Cost $ Value $
COMMON SHARES — 54.15%Canadian Equities — 31.89%Consumer Discretionary — 1.43%Magna International Inc., Class 'A' 6,145 112,192 344,857 Shaw Communications Inc., Class 'B' 9,220 184,307 219,436
296,499 564,293
Consumer Staples — 1.45%Metro Inc., Class 'A' 10,345 247,869 400,765 North West Co. Inc. (The) 5,980 142,777 171,447
390,646 572,212
Energy — 5.13%Cameco Corp. 15,980 349,180 272,779 Canadian Natural Resources Ltd. 14,110 425,231 426,404 Canadian Oil Sands Ltd. 29,100 290,969 240,657 Cenovus Energy Inc. 18,095 530,685 316,662 Ensign Energy Services Inc. 13,295 161,652 98,117 Husky Energy Inc. 11,200 307,328 160,272 Suncor Energy Inc. 14,054 458,526 502,009
2,523,571 2,016,900
Financials — 14.57%Bank of Montreal 4,415 256,507 344,723 Bank of Nova Scotia 15,700 784,988 878,730 Canadian Imperial Bank of Commerce 5,970 506,914 544,404 Great-West Lifeco Inc. 9,740 244,792 336,322 Home Capital Group Inc. 20,100 740,849 541,092 Intact Financial Corp. 4,055 344,855 359,597 Manulife Financial Corp. 23,705 431,508 491,642 Royal Bank of Canada 13,295 714,647 985,825 Sun Life Financial Inc. 5,350 151,475 230,852 Toronto-Dominion Bank (The) 18,820 657,823 1,020,798
4,834,358 5,733,985
Industrials — 3.54%CAE Inc. 27,885 249,513 428,035 Canadian National Railway Co. 8,095 610,006 626,149 Finning International Inc. 5,895 138,542 110,119 Superior Plus Corp. 21,415 222,367 230,425
1,220,428 1,394,728
Information Technology — 2.25%CGI Group Inc., Class 'A' 9,810 372,684 543,474 Constellation Software Inc. 590 141,758 340,359
514,442 883,833
Materials — 0.91%Barrick Gold Corp. 11,410 381,316 116,838 Potash Corp. of Saskatchewan Inc. 6,410 209,032 151,917 Teck Resources Ltd., Class 'B' 16,840 523,087 89,926
1,113,435 358,681
Telecommunication Services — 2.61%BCE Inc. 9,245 316,092 494,238 Rogers Communications Inc., Class 'B' 6,755 245,601 322,349 TELUS Corp. 5,460 228,928 208,900
790,621 1,025,487
Total Canadian Equities — 31.89% 11,684,000 12,550,119
The accompanying notes are an integral part of the financial statements.

Lincluden Private Trust
Schedule of Investments (continued) Number of Shares / Average CarryingAs at December 31, 2015 Par Value $ Cost $ Value $
United States Equities — 12.96%Consumer Discretionary — 0.52%Bed Bath & Beyond Inc. 1,615 107,252 108,244 General Motors Co. 2,037 47,279 96,277
154,531 204,521
Consumer Staples — 1.67%Coca-Cola Co. (The) 2,560 105,212 152,770 Procter & Gamble Co. (The) 1,556 93,738 171,607 Walgreens Boots Alliance Inc. 1,615 53,173 191,036 Wal-Mart Stores Inc. 1,647 98,418 140,245
350,541 655,658
Energy — 0.66%Chevron Corp. 700 88,848 87,450 Devon Energy Corp. 823 52,676 36,583 Exxon Mobil Corp. 1,247 90,474 134,991
231,998 259,024
Financials — 3.96%American International Group Inc. 2,135 81,418 183,786 Bank of America Corp. 4,662 70,425 108,991 Brookfield Property Partners L.P. 18,684 225,463 601,998 Citigroup Inc. 1,705 80,092 122,566 JPMorgan Chase & Co. 1,248 56,217 114,469 MetLife Inc. 1,948 86,523 130,387 Morgan Stanley 2,835 51,935 125,271 Wells Fargo & Co. 2,254 62,723 170,125
714,796 1,557,593
Health Care — 2.18%Baxalta Inc. 3,170 125,840 171,867 Baxter International Inc. 2,900 133,979 153,683 Johnson & Johnson 1,647 110,954 234,951 Pfizer Inc. 4,266 101,431 191,288 Zimmer Biomet Holdings Inc. 762 44,766 108,591
516,970 860,380
Industrials — 1.31%Deere & Co. 215 20,263 22,779 Emerson Electric Co. 2,104 105,775 139,791 Honeywell International Inc. 1,493 61,458 214,734 Union Pacific Corp. 1,280 138,798 139,043
326,294 516,347
Information Technology — 2.07%Cisco Systems Inc. 3,597 86,330 135,682 Corning Inc. 4,600 60,192 116,807 Microsoft Corp. 3,167 85,864 244,072 Oracle Corp. 3,568 92,014 181,054 Symantec Corp. 4,720 107,519 137,688
431,919 815,303
Telecommunication Services — 0.59%Verizon Communications Inc. 3,628 140,023 232,933
Total United States Equities — 12.96% 2,867,072 5,101,759
The accompanying notes are an integral part of the financial statements.

Lincluden Private Trust
Schedule of Investments (continued) Number of Shares / Average CarryingAs at December 31, 2015 Par Value $ Cost $ Value $
International Equities — 9.30%France — 1.61%AXA, ADR 3,350 72,471 127,110 Orange SA, ADR 5,030 88,658 116,197 Sanofi SA, ADR 2,011 80,860 119,142 Total SA, ADR 1,861 114,140 116,201 Vinci SA 1,730 85,131 154,387
441,260 633,037
Germany — 1.46%Deutsche Boerse AG 1,185 66,342 145,537 Henkel AG & Co. KGaA 1,187 57,981 158,732 SAP SE, ADR 1,160 70,800 127,458 Siemens AG, ADR 1,068 104,821 142,681
299,944 574,408
Hong Kong — 0.24%China Mobile Ltd., ADR 1,190 74,254 93,115
Israel — 0.27%Teva Pharmaceutical Industries Ltd., ADR 1,158 43,769 105,563
Japan — 1.05%Komatsu Ltd. 4,155 102,208 95,575 Nissan Motor Co. Ltd. 12,945 130,159 191,262 SECOM Co. Ltd. 1,345 61,870 127,978
294,237 414,815
Netherlands — 0.93%Akzo Nobel NV 1,560 107,594 145,195 ING Groep NV, ADR 6,486 95,219 121,271 Royal Dutch Shell PLC, ADR, Class 'A' 1,585 108,332 100,894
311,145 367,360
Switzerland — 1.02%ABB Ltd., ADR 4,267 71,086 105,091 Aryzta AG, Registered 2,570 178,276 181,887 Nestlé SA, ADR, Registered 1,099 47,627 113,611
296,989 400,589
United Kingdom — 2.72%Barclays PLC, ADR 5,793 90,870 104,290 Centrica PLC 27,540 147,374 122,976 GlaxoSmithKline PLC, ADR 2,439 105,856 136,706 HSBC Holdings PLC 12,840 150,330 140,959 National Grid PLC 9,880 108,720 189,640 Tate & Lyle PLC 7,870 92,715 96,517 Unilever PLC 2,400 105,574 143,801 Vodafone Group PLC, ADR 3,046 126,987 136,498
928,426 1,071,387
Total International Equities — 9.30% 2,690,024 3,660,274
TOTAL EQUITIES — 54.15% 17,241,096 21,312,152
(refer to the accompanying notes)

Lincluden Private Trust
Schedule of Investments (continued) Number of Shares / Average CarryingAs at December 31, 2015 Par Value $ Cost $ Value $
BONDS — 40.43%Government of Canada — 11.04%Canada Housing Trust No. 1, Floating Rate, 0.80%, 2018/09/15 2,625,000 2,625,142 2,621,290 Government of Canada, 1.50%, 2023/06/01 480,000 441,600 491,181 Government of Canada, 4.00%, 2041/06/01 58,000 75,157 78,791 Government of Canada, 3.50%, 2045/12/01 890,000 1,118,493 1,154,297
4,260,392 4,345,559
Provincial Government — 11.71%Province of Alberta, 3.45%, 2043/12/01 110,000 112,634 113,474 Province of British Columbia, 4.30%, 2042/06/18 245,000 304,164 297,589 Province of Manitoba, 5.70%, 2037/03/05 230,000 269,698 312,965 Province of New Brunswick, 4.55%, 2037/03/26 310,000 304,820 362,285 Province of Ontario, 2.60%, 2025/06/02 261,000 264,163 266,813 Province of Ontario, 4.70%, 2037/06/02 330,000 326,193 407,637 Province of Ontario, 3.45%, 2045/06/02 770,000 799,769 805,540 Province of Ontario, Floating Rate, 0.99%, 2018/12/03 645,000 649,301 645,213 Province of Quebec, 2.75%, 2025/09/01 25,000 25,562 25,828 Province of Quebec, 5.00%, 2038/12/01 293,000 301,406 375,974 Province of Quebec, Series 'B112', 3.50%, 2045/12/01 380,000 388,764 398,805 Province of Quebec, Series 'B114', Floating Rate, 1.05%, 2018/12/19 515,000 517,597 515,404 Province of Saskatchewan, Series 'GC', 4.75%, 2040/06/01 65,000 72,612 81,053
4,336,683 4,608,580
Corporate — 17.26%407 International Inc., Callable, 4.19%, 2042/04/25 35,000 34,952 36,809 407 International Inc., Callable, 3.30%, 2045/03/27 50,000 50,024 44,924 407 International Inc., Callable, 3.83%, 2046/05/11 30,000 29,951 29,591 AltaGas Ltd., Callable, 3.57%, 2023/06/12 80,000 80,946 80,292 AltaLink L.P., Callable, 4.09%, 2045/06/30 35,000 35,000 35,259 AltaLink L.P., Series '2014-3', Callable, 4.05%, 2044/11/21 35,000 35,000 35,266 Bank of Montreal, Callable, 3.40%, 2021/04/23 215,000 218,160 228,952 Bank of Nova Scotia, 3.61%, 2016/02/22 165,000 168,754 165,556 Bank of Nova Scotia, Series 'DPNT', 2.87%, 2021/06/04 140,000 145,503 144,919 Bank of Nova Scotia, Variable Rate, Callable, 3.04%, 2024/10/18 140,000 140,000 144,458 Bell Canada, Callable, 5.52%, 2019/02/26 60,000 63,838 66,389 Cameco Corp., Callable, 4.19%, 2024/06/24 75,000 74,970 77,542 Cameco Corp., Series 'D', Callable, 5.67%, 2019/09/02 200,000 214,988 221,873 Canadian Imperial Bank of Commerce, 1.75%, 2016/06/01 125,000 124,904 125,407 Canadian Imperial Bank of Commerce, 1.70%, 2018/10/09 85,000 85,224 85,422 Canadian Imperial Bank of Commerce, 1.85%, 2020/07/14 80,000 79,852 79,904 Canadian Imperial Bank of Commerce, Variable Rate, 1.02%, 2016/08/11 365,000 365,462 364,968 CU Inc., Callable, 5.56%, 2028/05/26 100,000 100,000 120,689 Enbridge Gas Distribution Inc., Callable, 4.04%, 2020/11/23 35,000 37,100 38,218 Enbridge Pipelines Inc., Callable, 4.49%, 2019/11/12 140,000 154,036 152,203 Enbridge Pipelines Inc., Callable, 4.45%, 2020/04/06 100,000 111,515 108,798 Enmax Corp., Series '3', Callable, Restricted, 3.80%, 2024/12/05 120,000 120,000 124,032 FortisBC Energy Inc., Callable, 3.38%, 2045/04/13 35,000 35,000 31,200 GE Capital Canada Funding Co., 3.55%, 2019/06/11 90,000 89,796 95,682 GE Capital Canada Funding Co., 5.68%, 2019/09/10 95,000 107,409 108,477 Greater Toronto Airports Authority, Series '2004-1’, 6.47%, 2034/02/02 105,000 116,089 144,000 Greater Toronto Airports Authority, Series '97-3', 6.45%, 2027/12/03 50,000 67,143 67,792 Hydro One Inc., Callable, 6.35%, 2034/01/31 105,000 110,629 139,296 Loblaw Cos. Ltd., 6.15%, 2035/01/29 45,000 47,564 53,445 Manitoba Telecom Services Inc., Series '8', Callable, 5.62%, 2019/12/16 70,000 78,562 78,306 Manufacturers Life Insurance Co. (The), Variable Rate, Callable, 4.17%, 2022/06/01 80,000 80,000 82,778 Manulife Financial Corp., Callable, 5.50%, 2018/06/26 460,000 482,347 501,680
The accompanying notes are an integral part of the financial statements.

Lincluden Private Trust
Schedule of Investments (continued) Number of Shares / Average CarryingAs at December 31, 2015 Par Value $ Cost $ Value $
North West Redwater Partnership, Series 'B', Callable, 4.05%, 2044/07/22 65,000 64,832 63,421 North West Redwater Partnership, Series 'D', Restricted, Callable, 3.70%, 2043/02/23 30,000 29,891 27,624 Nova Scotia Power Inc., Series 'X', Callable, 5.61%, 2040/06/15 30,000 29,974 36,575 Reliance L.P., 4.08%, 2021/08/02 105,000 105,000 105,780 Reliance L.P., Callable, 4.57%, 2017/03/15 90,000 90,000 92,002 Rogers Communications Inc., Callable, 4.00%, 2022/06/06 180,000 179,280 191,564 Royal Bank of Canada, 2.82%, 2018/07/12 250,000 255,450 258,207 Royal Bank of Canada, 1.97%, 2022/03/02 100,000 98,150 97,958 Shaw Communications Inc., Callable, 5.50%, 2020/12/07 160,000 169,465 179,571 Shaw Communications Inc., Callable, 4.35%, 2024/01/31 35,000 34,992 36,643 SNC-Lavalin Group Inc., Callable, 6.19%, 2019/07/03 305,000 348,341 345,460 Sun Life Financial Inc., Callable, 4.57%, 2021/08/23 25,000 26,674 27,947 Sun Life Financial Inc., Series '2012-1', Variable Rate, Callable, 4.38%, 2022/03/02 155,000 156,370 159,584 Sun Life Financial Inc., Series 'D', Callable, 5.70%, 2019/07/02 75,000 83,078 84,806 TELUS Corp., 3.60%, 2021/01/26 15,000 14,957 15,808 TELUS Corp., Callable, 5.15%, 2043/11/26 65,000 64,675 66,598 TELUS Corp., Callable, 4.75%, 2045/01/17 35,000 34,752 33,724 Toronto-Dominion Bank (The), 2.95%, 2016/08/02 240,000 245,952 242,699 Toronto-Dominion Bank (The), 3.23%, 2024/07/24 100,000 103,333 104,427 TransCanada PipeLines Ltd., Callable, 3.69%, 2023/07/19 10,000 9,999 10,579 TransCanada PipeLines Ltd., Callable, 4.55%, 2041/11/15 55,000 54,737 55,640 TransCanada PipeLines Ltd., Series 'W', 9.45%, 2018/03/20 160,000 210,109 185,951 Wells Fargo Financial Canada Corp., 2.77%, 2017/02/09 260,000 260,000 264,518 Wells Fargo Financial Canada Corp., 2.78%, 2018/11/15 160,000 159,955 165,459 Westcoast Energy Inc., 6.75%, 2027/12/15 100,000 95,451 124,970
6,610,135 6,791,642
Foreign Bond — 0.42%Brookfield Infrastructure Partners L.P., 3.46%, 2017/10/10 60,000 60,000 61,055 Manulife Finance Delaware L.P., Variable Rate, Callable, 4.45%, 2026/12/15 100,000 98,654 102,501
158,654 163,556
TOTAL BONDS — 40.43% 15,365,864 15,909,337
OTHER FUNDS — 2.55%Lincluden Canadian Small Cap Equity Pooled Fund 12,480 1,309,228 1,002,130
TOTAL OTHER INVESTMENTS — 2.55% 1,309,228 1,002,130
CANADIAN SHORT-TERM NOTES — 1.52%Treasury Bills — 1.52%Government of Canada Treasury Bill, 0.44%, 2016/03/10 600,000 599,454 599,469
TOTAL SHORT-TERM NOTES — 1.52% 599,454 599,469
TRANSACTION COSTS (13,425) ─
TOTAL INVESTMENT PORTFOLIO — 98.65% 34,502,217 38,823,088
OTHER ASSETS, NET OF LIABILITIES — 1.35% 533,046
NET ASSETS ATTRIBUTABLE TO HOLDERS OF REDEEMABLE UNITS — 100.00% 39,356,134
The accompanying notes are an integral part of the financial statements.

Lincluden Private Trust TRUST SPECIFIC NOTES For the periods indicated in Note 1
The accompanying notes are an integral part of these financial statements.
1. The Trust (note 1)
Lincluden Private Trust’s (the “Trust”) actively managed balanced portfolio has an investment objective to earn an attractive long-term rate of return utilizing a value approach.
2. Risks associated with financial instruments (note 4)
i) Interest rate risk
The table below summarizes the Trust’s exposure to interest rate risk by the remaining term to maturity (earlier of maturity date or interest reset date) of the Fund’s portfolio, excluding cash, money market instruments, underlying funds, preferred shares and overdrafts, as applicable.
December 31, 2015 December 31, 2014
Interest rate exposure ($) ($)
Less than 1 year 898,630 1,076,9261-3 years 5,396,202 1,803,8173-5 years 1,559,688 7,537,2945-10 years 2,417,085 8,217,116> 10 years 5,637,732 6,733,590
15,909,337 25,368,743
As at December 31, 2015 had the prevailing interest rates increased or decreased by 0.25%, assuming a parallel shift in the yield curve and all other variables held constant, net assets attributable to holders of redeemable units would have decreased or increased, respectively, by $296,656 or approximately 0.8% (December 31, 2014 – $447,869, or approximately 0.7%). In practice, actual results may differ from this sensitivity analysis and the difference could be material.
ii) Currency risk
The tables below indicate the currencies to which the Trust had significant exposure, net of the impact of currency forward contracts and currency spot contracts, if any, based on the monetary and non-monetary assets and liabilities of the Trust. The tables also illustrate the potential impact on the Trust if the functional currency of the Trust had strengthened or weakened by 10% in relation to each of the other currencies, with all other variables held constant.
Currency�Net currency exposure ($)
Percentage of net assets (%)
Impact on the Fund ($)
Percentage of net assets (%)
U.S. Dollar 7,410,106 18.8 741,011 1.9British Pound 701,023 1.8 70,102 0.2Euro 641,412 1.6 64,141 0.2Japanese Yen 520,665 1.3 52,067 0.1Swiss Franc 181,887 0.5 18,189 0.1
9,455,093 24.0 945,510 2.5
December 31, 2015
Lincluden Private Trust TRUST SPECIFIC NOTES For the periods indicated in Note 1
The accompanying notes are an integral part of these financial statements.
Currency�Net currency exposure ($)
Percentage of net assets (%)
Impact on the Fund ($)
Percentage of net assets (%)
U.S. Dollar 10,582,396 16.8 1,058,240 1.7British Pound 1,075,709 1.7 107,571 0.2Euro 709,514 1.1 70,951 0.1Japanese Yen 475,780 0.8 47,578 0.1Swiss Franc 171,770 0.3 17,177 0.0
13,015,169 20.7 1,301,517 2.1
December 31, 2014
iii) Price risk
Price risk is the risk that the carrying value of financial instruments will fluctuate as a result of changes in market prices (other than those arising from interest rate risk or currency risk) caused by factors specific to a security, its issuer or all factors affecting a market or a market segment. Exposure to price risk is mainly in equities, derivatives and commodities, if applicable. As at December 31, 2015, approximately 56.7% (December 31, 2014 – 52.9%) of the Trust’s net assets were exposed to price risk. If prices of these investments had decreased or increased by 10%, with all other variables held constant, net assets of the Trust would have decreased or increased, respectively, by approximately $2,331,428 (December 31, 2014 – $3,322,935). In practice, actual results may differ from this sensitivity analysis and the difference could be material.
iv) Credit risk
The table below summarizes the credit ratings of the bonds and debentures, excluding cash and money market instruments but including preferred shares and derivatives, as applicable, held by the Trust.
Credit ratings
Percentage of total bonds
and debentures
(%)
Percentage of net assets
(%)
Percentage of total bonds
and debentures
(%)
Percentage of net assets
(%)
AAA 29.7 12.0 28.3 11.4AA 11.6 4.7 24.7 10.0A 44.3 17.9 29.8 12.0BBB 14.4 5.8 16.7 6.8Below BBB (O) ─ ─ 0.5 0.2
100.0 40.4 100.0 40.4
December 31, 2015 December 31, 2014

Lincluden Private Trust TRUST SPECIFIC NOTES For the periods indicated in Note 1
The accompanying notes are an integral part of these financial statements.
v) Liquidity risk
The table below summarizes the Trust’s financial liabilities based on the remaining period to the contractual maturity date.
On demand Less than 3 months On demand
Less than 3 months
($) ($) ($) ($)Current liabilities ─ 3,455,476 ─ 32,187Redeemable units 39,356,134 ─ 62,787,789 ─
39,356,134 3,455,476 62,787,789 32,187
December 31, 2015 December 31, 2014
Redeemable units are redeemable on demand at the holder’s option. However, the Manager does not expect that the contractual maturity disclosed in the table above will be representative of the actual cash outflows, as holders of these instruments typically retain them for a longer term.

Lincluden Private Trust TRUST SPECIFIC NOTES For the periods indicated in Note 1
The accompanying notes are an integral part of these financial statements.
vi) Concentration risk
Concentration risk arises as a result of the concentration of exposures within the same category, geographical location, and asset type or industry sector, as applicable. The table below is a summary of the Trust’s concentration risk:
December 31, 2015 December 31, 2014
EQUITIESCanadian EquitiesConsumer Discretionary 1.4 1.6Consumer Staples 1.5 1.1Energy 5.1 5.2Financials 14.6 14.0Industrials 3.5 2.2Information Technology 2.3 1.7Materials 0.9 2.5Telecommunication Services 2.6 2.6Total Canadian Equities 31.9 30.9
United States Equities Consumer Discretionary 0.5 1.2Consumer Staples 1.6 1.9Energy 0.7 0.8Financials 4.0 2.9Health Care 2.2 1.6Industrials 1.3 1.0Information Technology 2.1 2.3Telecommunication Services 0.6 0.5Total United States Equities 13.0 12.2
International Equities France 1.6 1.5Germany 1.5 1.0Hong Kong 0.2 0.2Israel 0.3 0.3Japan 1.1 1.0Netherlands 0.9 0.9Switzerland 1.0 0.8United Kingdom 2.7 2.5Total International Equities 9.3 8.2TOTAL EQUITIES 54.2 51.3BONDSGovernment of Canada 11.0 10.0Provincial Government 11.7 11.0Corporate 17.3 19.1Foreign 0.4 0.3TOTAL BONDS 40.4 40.4
OTHER FUNDS 2.5 1.8SHORT-TERM NOTES 1.5 5.5TOTAL INVESTMENT PORTFOLIO 98.6 99.0OTHER ASSETS, NET OF LIABILITIES 1.4 1.0NET ASSETS ATTRIBUTABLE TO HOLDERS OF REDEEMABLE UNITS 100.0 100.0
Percentage of Net Assets (%)

Lincluden Private Trust TRUST SPECIFIC NOTES For the periods indicated in Note 1
The accompanying notes are an integral part of these financial statements.
vii) Fair value classification (note 2)
The tables below illustrate the classification of the Trust's financial instruments within the fair value hierarchy.
Level 1 Level 2 Level 3 TotalDecember 31, 2015 ($) ($) ($) ($)
Equities 21,312,152 ─ ─ 21,312,152Short-term notes ─ 599,469 ─ 599,469Bonds ─ 15,909,337 ─ 15,909,337Investments in funds 1,002,130 ─ ─ 1,002,130
22,314,282 16,508,806 ─ 38,823,088
Level 1 Level 2 Level 3 TotalDecember 31, 2014 ($) ($) ($) ($)
Equities 32,203,054 ─ ─ 32,203,054Short-term notes ─ 3,443,710 ─ 3,443,710Bonds ─ 25,368,743 ─ 25,368,743Investments in funds 1,158,107 ─ ─ 1,158,107
33,361,161 28,812,453 ─ 62,173,614
Transfers between levels
During the years ended December 31, 2015 and 2014, there were no significant transfers between Level 1 and Level 2.
3. Offsetting of financial assets and liabilities (note 2)
As at December 31, 2015 and 2014, the Trust did not enter into any agreement whereby the financial instruments were eligible to offset.
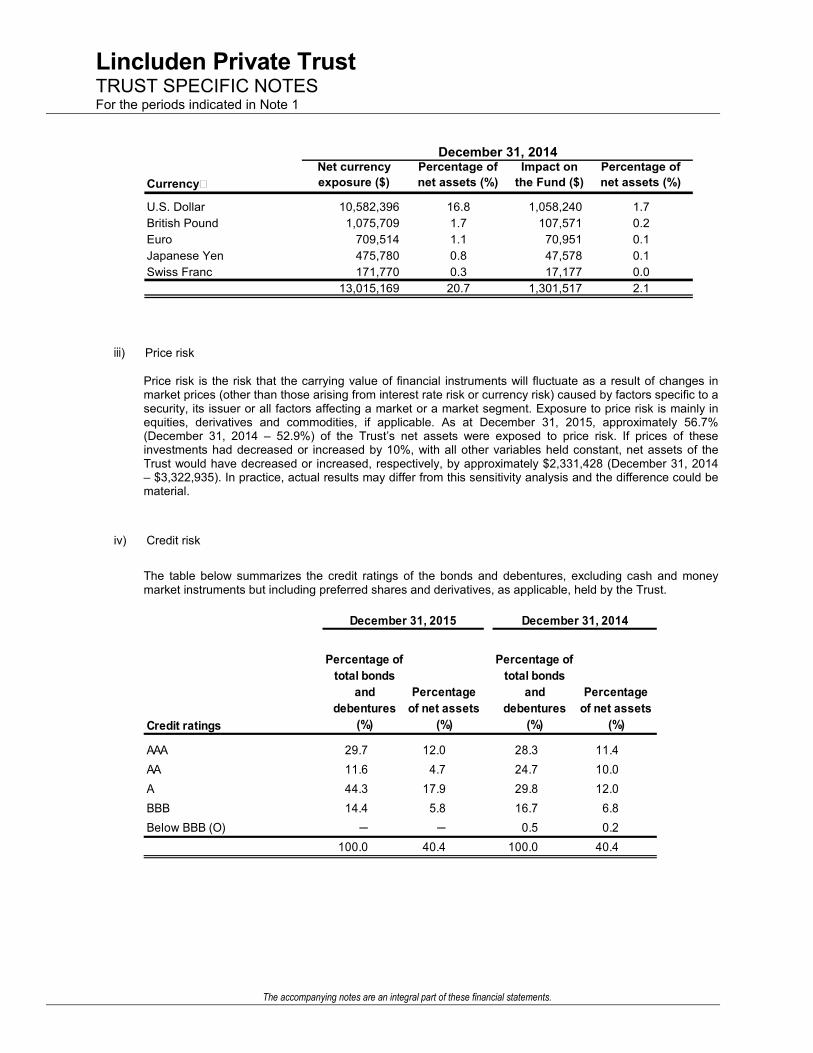
4. Interest in Underlying Funds (note 2) The following tables provide information about the Trust's interest in Underlying Funds.
Ownershippercentage in
Carrying value of Underlying FundUnderlying Fund the Underlying Fund ($) (%)Lincluden Canadian Small Cap Equity Pooled Fund 1,002,130 52.3
1,002,130
December 31, 2015
Lincluden Private Trust TRUST SPECIFIC NOTES For the periods indicated in Note 1
The accompanying notes are an integral part of these financial statements.
Ownershippercentage in
Carrying value of Underlying FundUnderlying Fund Underlying Fund ($) (%)Lincluden Canadian Small Cap Equity Pooled Fund 1,158,107 49.3
1,158,107
December 31, 2014
5. Comparison of net asset value per unit and net assets per unit (note 2)
The table below provides a comparison of the net asset value per unit and net assets per unit. The primary reason for the difference between the net asset value per unit and net assets per unit, if any, is described in note 2.
December 31, 2015 December 31, 2014
Net asset value per unit
($)
Net assets per unit
($)
Net asset value per unit
($)
Net assets per unit
($)
Lincluden Private Trust 12.13 12.13 12.19 12.19
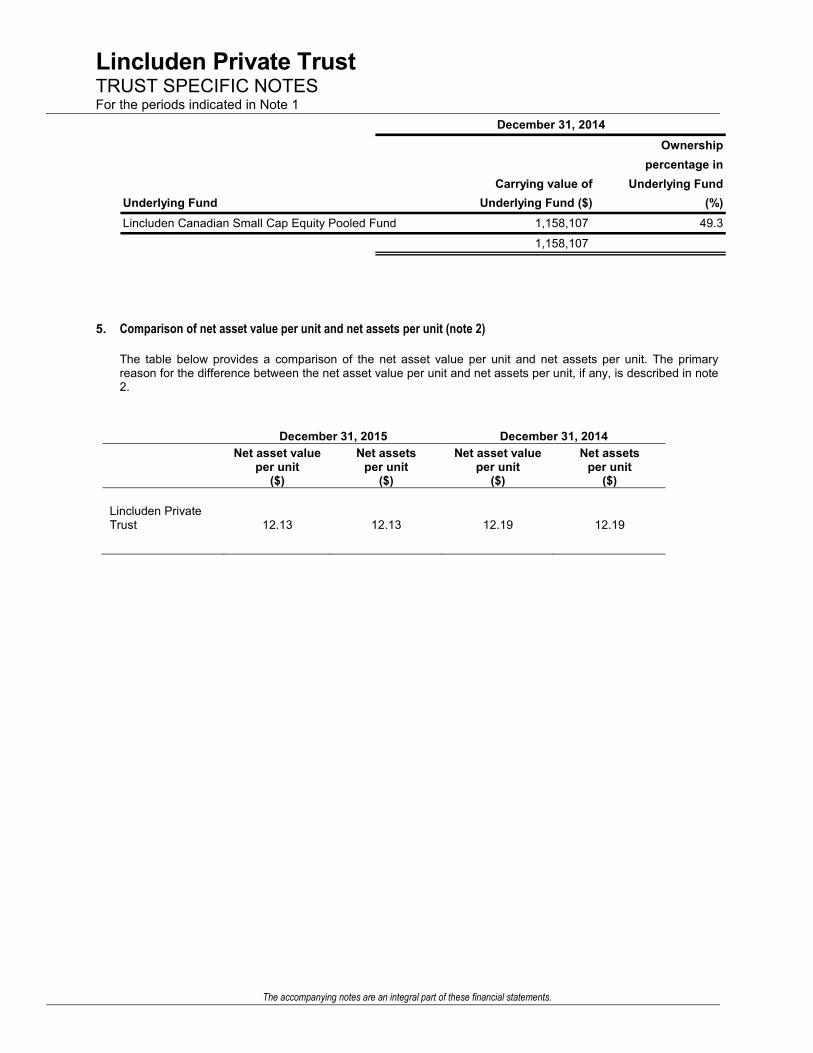
Lincluden Private Trust Notes to Financial Statements For the periods indicated in Note 1 1. The Trust
1832 Asset Management L.P., a wholly owned subsidiary of the Bank of Nova Scotia (“Scotiabank”), is the manager and trustee (where applicable) of the Trust. In this document, “we”, “us”, “our”, the “Manager”, the “Trustee”, and “1832 Asset Management” refer to 1832 Asset Management L.P. The registered office of the Trust is 1 Adelaide St. E, 28th Floor, Toronto, Ontario, M5C 2V9.
Lincluden Private Trust is an open-ended investment unincorporated trust. The Trust is established under the laws of the Province of Ontario pursuant to a Declaration of Trust dated as of March 5, 2003, as amended from time to time.
The Statements of Financial Position is as at December 31, 2015 and 2014, and the Statements of Comprehensive Income, Changes in Net Assets Attributable to Holders of Redeemable Units and Cash Flows are for the periods ended December 31, 2015 and 2014. The Schedule of Investment Portfolio for the Trust is as at December 31, 2015. Throughout this document, reference to the periods refers to the reporting periods described above.
These financial statements were approved and authorized for issue on March 10, 2016 by the Board of Directors of 1832 Asset Management G.P. Inc., as general partner for and on behalf of 1832 Asset Management L.P., in its capacity as Trustee of the Trust.
The investment objective for the Trust is provided in the Trust’s “Trust Specific Notes”. The Trust commenced operations on March 5, 2003.
2. Summary of Significant Accounting Policies
The significant accounting policies applied in the preparation of these financial statements are set out below. These policies have been consistently applied to all the years presented, unless otherwise stated.
Basis of preparation
These annual financial statements of the Trust have been prepared in compliance with International Financial Reporting Standards (“IFRS”) as published by the International Accounting Standards Board (IASB), in accordance with the Canadian securities legalisation.
The preparation of these financial statements in accordance with IFRS requires the use of judgment in applying its accounting policies and to make estimates and assumptions concerning the future. Significant accounting judgements and estimates made by the Management are disclosed in Note 3.
I. Financial instruments Classification The Trust classifies all its investments, including derivatives as financial assets or financial liabilities at fair value through profit and loss (FVTPL). This category has two sub categories: financial assets and financial liabilities are either held for trading or designated at fair value through profit or loss at inception. Financial assets or financial liabilities held for trading are those acquired principally for the purpose of selling or repurchasing in the near future or on initial recognition as part of an identical portfolio of financial instruments that are managed together for which there is evidence of actual short-term profit taking. Derivatives and any short positions are also included in this category.
Financial assets and financial liabilities designated at fair value through profit or loss at inception are those that are managed and their performance evaluated on a fair value basis in accordance with the Trust’s investment strategy as documented in the Simplified Prospectus.

Lincluden Private Trust Notes to Financial Statements For the periods indicated in Note 1
The Trust’s obligations for net assets attributable to holders of redeemable units are presented at the redemption amount.
Recognition and measurement
Regular purchases and sales of investments are recognized on the date on which the Trust commits to purchase or sell its investments at fair value. Transaction costs are expensed as incurred in the Statements of Comprehensive Income. Subsequent to initial recognition, financial assets and liabilities at FVTPL are measured at fair value as presented below. Gains and losses arising from changes in their fair value are included in the Statements of Comprehensive Income for the years in which they arise.
II. Fair value measurement and hierarchy of financial instruments Fair value of a financial instrument is the price that would be received to sell an asset or paid to transfer a liability in an orderly transaction between market participants at the measurement date (i.e. an exit price). The fair value of financial assets and liabilities traded in active markets (such as publicly traded derivatives and marketable securities) are based on quoted market prices at the close of trading on the reporting date. The Trust uses the last traded market price for both financial assets and financial liabilities where the last traded price falls within that day’s bid-ask spread. In circumstances where the last traded price is not within the bid-ask spread, the Manager determines the point within the bid-ask spread that is most representative of fair value based on the specific facts and circumstances. The fair value of financial assets and liabilities that are not traded in an active market, including over the-counter derivatives, is determined using valuation techniques. The Trust uses a variety of methods and make assumptions that are based on market conditions existing at each reporting date. Valuation techniques include the use of comparable recent arm’s length transactions, reference to other instruments that are substantially the same, discounted cash flow analysis, option pricing models and others commonly used by market participants and which make the maximum use of observable inputs. IFRS 13, Fair value measurement, requires the use and disclosure of a fair value hierarchy that categorises into three levels the inputs to valuation techniques used to measure fair value of financial instruments. The fair value hierarchy gives the highest priority to quoted prices (unadjusted) in active markets and the lowest priority to unobservable inputs. The three level hierarchy based on inputs levels are defined as follows: Level 1: Fair value is based on unadjusted quoted prices in active markets for identical assets or liabilities; Level 2: Fair value is based on inputs other than unadjusted quoted prices included in Level 1 that are observable for the assets or liabilities, either directly or indirectly. Level 3: Fair value is based on at least one significant non-observable input that is not supported by market data for the financial assets or liabilities.
Changes in valuation methodology may result in transfers in and out of a level. The Trust’s policy is to recognize these transfers as of the date of the event or circumstance giving rise to the transfer. The three level fair value hierarchy, transfers between levels and a reconciliation of level 3 financial instruments are disclosed in the respective Trust’s “Trust Specific Notes”.
The Manager is responsible for performing the fair value measurements included in the financial statements of the Trust, including level 3 measurements. The Manager obtains pricing from a third party pricing vendor, which is monitored and reviewed by the valuation team daily. At each financial reporting date, the Manager reviews and approves all level 3 fair value measurements. The Trust also has a Valuation Committee which includes the Chief Financial Officer, members of the finance team, as well as members of the investment council and compliance

Lincluden Private Trust Notes to Financial Statements For the periods indicated in Note 1
teams. The committee meets quarterly to perform detailed reviews of the valuations of investments held by the Trust.
Financial instruments are valued at their fair value as summarized below:
(i) North American equities are valued at the closing market price recorded by the security exchange on which the security is principally traded. Non-North American equities are valued at fair value based on information provided by an independent pricing source.
(ii) Fixed income securities, including bonds and mortgage-backed securities, are valued using quotation received from independent pricing sources.
(iii) Short-term debt instruments are carried at amortized cost, which approximates fair value. (iv) Investments in underlying funds are valued based on the Net Asset Value per unit provided by the
Underlying Funds’ manager at the end of each valuation date.
III. Net Assets versus Net Asset Value
The Trust’s accounting policies for measuring the fair value of its investments and derivatives are identical to those used in measuring its net asset value for transactions with unitholders in accordance with Part 14 of National Instrument 81-106 Investment Funds for Continuous Disclosure (“NI 81-106”), except where the last traded market price for financial assets and liabilities are not within the bid-ask spread as described above. A comparison of the net assets per unit in accordance to IFRS (“Net Assets per unit”) and the net assets per unit calculated in accordance to NI 81-106 (“Net Asset Value per unit”) are presented in the Trust’s “Trust Specific Notes”.
IV. Income recognition
Gains and losses arising from changes in fair value of financial instruments, other than derivatives, are shown in the Statements of Comprehensive Income as “Change in unrealized gain (loss) on non-derivative financial assets” and as “Net realized gain (loss) on non-derivative financial assets” when the positions are closed out.
Dividend income and distributions from underlying funds are recognized on the ex-dividend date. Distributions received from income trusts are recognized based on the nature of the underlying components such as dividend income, interest income, capital gains, and return of capital by applying previous year characterizations reported by the trust as current year characterizations are not available until the following year.
Interest for distribution purposes represents the coupon interest received by the Trust, recognized on an accrual basis. The Trust does not amortize premiums paid or discounts received on the purchase of fixed income securities except for zero coupon bonds which are amortized on a straight line basis. Realized gain or loss on the sale of short-term debt instruments are recorded as an adjustment to interest income.
V. Functional and presentation currency and foreign exchange translation
The functional and presentation currency of the Trust is the Canadian dollar. Canadian dollars is the currency of primary economic environment in which the Trust operates or where mixed indicators exist in the primary environment, the Canadian dollar is the currency in which they raise capital. Any other currency other than functional currency represents foreign currency to the Trust. Amounts denominated in foreign currencies are converted into the functional currency as follows:
(i) Fair value of investments, derivative contracts and monetary and non-monetary assets and liabilities at the rates of exchange prevailing as at the valuation date;
(ii) Foreign income and expenses are translated into Canadian dollars at the rates of exchange applicable on the valuation date; and

Lincluden Private Trust Notes to Financial Statements For the periods indicated in Note 1
(iii) Purchase or sale of investments and investment income at the rates of exchange prevailing on the respective dates of such transactions, while purchase or sale of monetary assets at the spot rate agreed upon with the counterparty.
Gain and losses on foreign exchange incurred in the Trust from monetary or non-monetary assets and liabilities are shown in the Statements of Comprehensive Income as “Net realized and change in unrealized gain on foreign exchange”.
VI. Investments in unconsolidated structured entities
The Trust invests in mutual funds and/or exchange-traded funds managed by the Manager or by third party investment managers. The Trust considers all investments in such funds (“Underlying Funds”) to be investments in unconsolidated structured entities based on the fact that the decisions made by these Underlying Funds are not governed by voting rights or any other similar rights held by the Trust. Consequently, the Trust, as Investment Entities accounts for these unconsolidated structured entities at fair value.
The Underlying Funds’ objectives assist the Trust in achieving its primary objectives and whose investment strategies do not include the use of leverage. The Underlying Funds finance their operations by issuing redeemable units or shares which are puttable at the holder’s option, and entitle the holder to a proportional stake in the respective fund’s net assets. The Trust holds redeemable shares or units in each of its Underlying Funds. These investments are included in “Non-derivative financial assets” in the Statements of Financial Position. The change in fair value of each Underlying Fund is included in the Statements of Comprehensive Income in ‘Change in unrealized gain (loss) of non-derivative financial assets’. The exposure to investments in Underlying Funds at fair value is disclosed in the Trust’s “Trust Specific Notes”. The Trust’s maximum exposure to loss from its interests in Underlying Funds is equal to the total carrying value of its investments in Underlying Funds.
Mortgage-backed securities or asset-backed securities are also considered to be unconsolidated structured entities. Mortgage-backed securities are formed by pooling various types of mortgages while asset-backed securities are formed by pooling assets such as auto loans, credit card receivables or student loans. An interest or claim to this future cash flow (interest and principal) is then sold in the form of debt or equity securities, which could be held by the Trust. As unconsolidated structured entities, the Trust accounts for these investments at fair value. As at December 31, 2015 and 2014, the maximum exposure to these securities was less than 5% of the net assets of the Trust.
VII. Redeemable Units Issued by the Trust
In accordance with IAS 32, the Trust’s redeemable units’ entitlements include a contractual obligation to distribute any net income and net realized capital gains at least annually in cash (at the request of the unitholder) and therefore meet the contractual obligation requirement. This violates one of the criteria that are required in order for the redeemable units to be presented as equity under IAS 32. Consequently, the Trust’s outstanding redeemable units are classified as financial liabilities in these financial statements.
VIII. Offsetting of financial instruments
Financial assets and liabilities are offset and the net amount is presented in the Statement of Financial Position only if there is a legal right to offset the amounts and there is an intention either to settle on a net basis or to realize the asset and settle the liability simultaneously. Income and expenses are presented on a net basis only when permitted under IFRS, for gains and losses arising from a group of similar transactions, such as gains and losses from financial instruments at fair value through profit or loss. Financial assets and liabilities that are subject to master netting or comparable agreements and the related potential effect of offsetting are disclosed in the Trust’s “Trust Specific Notes”.
Lincluden Private Trust Notes to Financial Statements For the periods indicated in Note 1
IX. Other financial assets and liabilities
Other financial assets and liabilities other than investment securities are valued at cost or amortized cost. These balances are short-term in nature; therefore, their carrying values approximate fair values.
X. Increase (decrease) in net assets attributable to holders of redeemable units per unit
“Increase (decrease) in net assets attributable to holders of redeemable units per unit” is disclosed in the Statements of Comprehensive Income and represents the increase or decrease in net assets attributable to holders of redeemable units from operations for the period divided by the weighted average number of units outstanding during the period.
XI. Accounting standards issued by not yet effective
The final version of IFRS 9, Financial Instruments, was issued by the IASB in July 2014 and will replace IAS 39 Financial Instruments: Recognition and Measurement. IFRS 9 introduces a presentation model for classification and measurement, a single, forward-looking “expected loss” impairment model and a substantially reformed approach to hedge accounting. This new model uses a principles based approach for determining the classification of financial assets and is driven by cash flow characteristics and the business model in which an asset is held. It also includes changes in respect of own credit risk in measuring liabilities elected to be measured at fair value, so that gains caused by the deterioration of an entity’s own credit risk on such liabilities are no longer recognized in profit or loss. IFRS 9 is effective for the Trust beginning in annual periods on or after January 1, 2018.
3. Significant accounting judgments and estimates The preparation of financial statements requires management to use judgment in applying its accounting policies and to make estimates and assumptions about the future. These estimates are made based on information available as at the date of issuance of the financial statements. Actual results could materially differ from those estimates. The following discusses the most significant accounting judgments and estimates that the Trust has made in preparing the financial statements:
Investment Entities
In accordance with IFRS 10: Consolidated Financial Statements, the Manager has determined that the Trust meets the definition of an Investment Entity which requires that the Trust obtains funds from one or more investors for the purpose of providing investment management services, commits to its investors that its business purpose is to invest funds solely for returns from capital appreciation, investment income, or both; and measures and evaluates the performance of its investments on a fair value basis. Consequently, the Trust does not consolidate, but instead measures these at FVTPL, as required by the accounting standard.
Classification and measurement of investments and application of the fair value option
In classifying and measuring financial instruments held by the Trust, the Manager is required to make significant judgments about whether or not the business of the Trust is to invest on a total return basis for the purpose of applying the fair value option for financial assets under IAS 39: “Financial Instruments -- Recognition and Measurement”. The most significant judgments made include the determination that certain financial instruments are held-for-trading and that the fair value option can be applied to those which are not.

Lincluden Private Trust Notes to Financial Statements For the periods indicated in Note 1
Fair value measurement of derivatives and securities not quoted in an active market
Key areas of estimation, where the Manager has made complex or subjective judgments, include the determination of fair values of financial instruments and derivatives that are not quoted in an active market. The use of valuation techniques for financial instruments and derivatives that are not quoted in an active market requires the Manager to make assumptions that are based on market conditions existing as at the date of the financial statements. Changes in these assumptions as a result of changes in market conditions could affect the reported fair value of financial instruments and derivatives.
4. Discussion of Financial Instrument Risk The Trust’s investment activities expose it to a variety of financial risks: market risk (including interest rate risk, currency risk, and other price risk), credit risk and liquidity risk. The Trust’s investment practices include portfolio monitoring to ensure compliance with stated investment guidelines. The Manager seeks to minimize potential adverse effects of risks on the Trust’s performance by employing and overseeing professional and experienced portfolio advisors that regularly monitor the Trust’s securities and financial market developments. The risks are measured using a method that reflects the expected impact on the results and net assets attributable to unitholders of the Trust from reasonably possible changes in the relevant risk variables.
The Manager maintains a risk management practice that includes monitoring compliance with investment restrictions to ensure that the Trust is being managed in accordance with the Trust’s stated investment objectives, strategies and securities regulations.
The Trust invests in underlying funds. The Trust is indirectly exposed to market risk, credit risk, and liquidity risk in the event that the underlying funds invest in financial instruments that are subject to those risks.
The Trust’s exposure to market risk, credit risk and liquidity risk, where applicable, is disclosed in the Trust’s “Trust Specific Notes”.
(a) Market risk
(i) Interest rate risk Interest rate risk arises from the possibility that changes in interest rates will affect the future cash flows or the fair values of interest-bearing financial instruments. The Trust’s exposure to interest rate risk is concentrated in its investments in debt securities (such as bonds and debentures) and interest rate derivative instruments, if any. Short-term investments and other assets and liabilities are short-term in nature and/or non-interest bearing and are not subject to a significant amount of interest rate risk due to fluctuations in the prevailing levels of market interest rates. (ii) Currency risk The Trust may invest in monetary and non-monetary assets denominated in currencies other than its functional currency. Currency risk is the risk that the value of foreign investments will fluctuate due to changes in the foreign exchange rates of those currencies in relation to the Trust’s functional currency. Other financial assets (including dividends and interest receivable and receivable for investments sold) and financial liabilities that are denominated in foreign currencies do not expose the Trust to significant currency risk. The Trust may enter into foreign exchange forward contracts or currency futures contracts for hedging purposes to reduce its foreign currency risk exposure.

Lincluden Private Trust Notes to Financial Statements For the periods indicated in Note 1
(iii) Price risk Price risk is the risk that the fair value of the Trust’s financial instruments will fluctuate as a result of changes in market prices (other than those arising from interest rate risk or currency risk) caused by factors specific to a security, its issuer or all factors affecting a market or a market segment. Exposure to other price risk is mainly in equities, derivatives and commodities. The maximum risk resulting from these financial instruments is equivalent to its fair value, except for, written options, short sales and futures contracts sold, where possible losses can be unlimited.
(b) Credit risk
Credit risk is the risk that the counterparty to a financial instrument will fail to discharge an obligation or commitment that it has entered into with the Trust. The Trust’s investment in debt instruments represents the main concentration of credit risk. The fair value of debt instruments includes consideration of the creditworthiness of the issuer, and accordingly, represents the maximum credit risk exposure to the Trust. Credit risk may also exist in relation to counterparties to derivatives. All the transactions in listed securities are settled or paid upon delivery using approved brokers. The risk of default with the counterparty is considered minimal, as delivery of securities sold is only made once the broker has received payment. Payment is only made on a purchase once the securities have been received by the broker. The credit ratings reported for counterparties to debt instruments are Standard & Poor’s credit rating or Standard & Poor’s equivalent for credit ratings from other approved rating agencies. In addition, custody and derivative transactions are carried out by counterparties that have a DBRS credit rating of A or higher.
The Trust can also be exposed to credit risk to the extent that the Trust’s custodian may not be able to settle trades for cash. Canadian securities regulations require that the Trust employ a custodian that meets certain capital requirements. These regulations state that, among other things, the Trust’s custodian be either a bank listed in Schedule I, II, or III of the Bank Act (Canada), or a company incorporated in Canada affiliated with a bank with shareholders’ equity of not less than $10,000,000. The Trust’s custodian, CIBC Mellon Global Securities Services, meets all Canadian Securities Administrators’ requirements to act as custodian.
The Trust may enter into securities lending transactions with counterparties whereby the Trust temporarily exchanges securities for collateral with a commitment by the counterparty to deliver the same securities on a future date. Credit risk associated with these transactions is considered minimal as all counterparties have approved credit rating and the market value of cash or securities held as collateral must be at least 104% of the fair value of the securities loaned as at the end of each trading day.
(c) Liquidity risk
The Trust’s exposure to liquidity risk arises primarily from the daily cash redemption of units. The Trust’s primarily invest in securities that are traded in active markets and can be readily disposed of. In addition, the Trust aims to retain sufficient cash and cash equivalent positions to maintain liquidity. The Trust may, from time to time, enter into over-the-counter derivative contracts or invest in securities that are not traded in an active market and may be illiquid. Illiquid securities are identified in the Trust’s Schedule of Investment Portfolio.
(d) Concentration risk
Concentrations of risk arise from financial instruments that have similar characteristics and are affected similarly by changes in economic or other conditions. The identification and disclosure of risks concentration is provided in the Trust’s “Trust Specific Notes”.

Lincluden Private Trust Notes to Financial Statements For the periods indicated in Note 1 5. Management Fees
The Trust has appointed 1832 Asset Management L.P. to administer and regulate the day-to-day operations of the Trust. In return for the services provided, the Manager receives management fees from the Trust’s holders of redeemable units, based on the net asset value of the Trust. These management fees are paid either by redemption of units or the unitholder, if an institution may be invoiced and payment will be delivered to the Manager directly. There is no duplication of management fees, sales charges or redemption fees between the Trust and the Underlying Funds held directly by it.
6. Trustee and Other Fees
The Trust is responsible for its operating expenses relating to the carrying on of its business, including custodial services, legal, audit fees, transfer agency services relating to the issue and redemption of units, and the cost of financial and other reports in compliance with all applicable laws, regulations and policies. Such expenses are calculated and accrued daily based on the average net asset value. The Manager pays for such expenses on behalf of the Trust, except for certain expenses such as interest and taxes, and is then reimbursed by the Trust. The Manager, at its sole discretion, absorbs operating expenses otherwise payable by the Trust. The absorbed expenses are reflected in the Statement of Comprehensive Income. The Manager may cease to absorb expenses at any time.
7. Redeemable Units Units issued and outstanding represent the capital of the Trust. The Trust may issue an unlimited number of units. Each unit is redeemable at the option of the unitholder in accordance with the Declaration of Trust, ranks pari passu with all other units of the Trust and entitles the unitholder to a proportionate undivided interest in the Net Asset Value of the Trust. Unitholders are entitled to distributions when declared. Distributions on units of the Trust are reinvested in additional units of the Trust or at the option of the unitholder, paid in cash. The Trust’s capital is managed in accordance with each of the Trust’s investment objectives, policies and restrictions, as outlined in the Trust’s offering memorandum. The Trust has no specific restrictions or specific capital requirements on the subscriptions or redemptions of units, other than minimum subscription requirements.
The units of the Trust are issued and redeemed at its Net Asset Value per unit which is determined as of the close of business on each day that the Toronto Stock Exchange is open for trading. The Net Asset Value per unit is calculated by dividing the Net Asset Value by the total number of outstanding units.
For the years ended December 31, 2015 and 2014, the following number of units were issued, reinvested and redeemed:
December 31, 2015 December 31, 2014Number of Number ofTrust units Trust units
Beginning units 5,150,171 5,263,004Redeemable units issued 124,470 133,909Redeemable units issued on reinvestments 169,184 275,552Redeemable units redeemed (2,199,981) (522,294)Ending units 3,243,844 5,150,171
8. Income Taxes
The Trust qualifies as a unit trust under the Income Tax Act (Canada). The Trust is subject to tax on its income, including net realized capital gains that are not paid or payable to its unitholders. The Trust distributes sufficient

Lincluden Private Trust Notes to Financial Statements For the periods indicated in Note 1
amounts of its net investment income, including net realized capital gains, less the amount retained to enable the Trust to utilize any available tax losses or tax credits attributable to redemptions, if applicable, during the year by its unitholders such that no income tax will be paid or payable by the Trust. Such net investment income, including net realized capital gains are taxable in the hands of the unitholders. Accordingly, the Trust does not record Canadian income taxes in its financial statements.
In certain circumstances, the Trust may distribute a return of capital. A return of capital is not taxable to unitholders but will reduce the adjusted cost base of the units held.
Losses Carried Forward
The Trust can accumulate capital and non-capital losses. Capital losses can be carried forward indefinitely to reduce future net realized capital gains. Non-capital losses for income tax purposes may be carried forward up to twenty years and applied against all sources of income. Since the Trust does not record income taxes, the tax benefit of capital and non-capital losses have not been reflected in the Statement of Financial Position as a deferred income tax asset.
As at December 31, 2015, the Trust had no non-capital loss carry forwards (December 31, 2014 – nil) and no capital loss carry forwards (December 31, 2014—nil).
Withholding Taxes
The Trust currently incurs withholding taxes imposed by certain countries on investment income and capital gains. Such income and gains are recorded on a gross basis and the related withholding taxes are shown as a separate expense in the Statement of Comprehensive Income.
Uncertain Income Taxes
The Trust invests in securities issued by entities which are domiciled in countries other than Canada. Many of these foreign countries have tax laws that indicate that capital gains taxes may be applicate to non-residents, such as the Trust. Typically, these capital gains taxes are determined on a self-assessment basis; therefore, such taxes may not be deducted by the Trust’s broker on a “withholding” basis.
As at December 31, 2015 and 2014, the Trust has measured uncertain tax liabilities and related interest and penalties with respect to foreign capital gains taxes at nil. While this represents the manager’s best estimate, the estimated value could differ significantly from the amount ultimately payable.
9. Client Brokerage Commissions
Client brokerage commissions are arrangements pursuant to which products or services, other than the execution of portfolio securities transactions, are obtained by a portfolio adviser from or through a broker-dealer in exchange for directing client securities transactions to the broker-dealer. Brokerage commissions on portfolio transactions may also include research services provided to the investment manager (soft dollar commissions).The ascertainable soft dollar arrangements in connection with investment portfolio transactions for the years ended December 31, 2015 was nil (December 31, 2014 – nil).
10. Related Party Transactions The Manager is a wholly-owned subsidiary of The Bank of Nova Scotia (“Scotiabank”). Scotiabank also owns, directly or indirectly, 100% of Scotia Securities Inc., HollisWealth Advisory Services Inc. and Tangerine Investment Funds Limited, each a mutual fund dealer, and Scotia Capital Inc., (which includes HollisWealth, ScotiaMcLeod and Scotia iTRADE), an investment dealer.
The Manager, on behalf of the Trust, may enter into transactions or arrangements with other members of Scotiabank or certain other companies that are related or connected to the Manager (each a “related party”). All transactions

Lincluden Private Trust Notes to Financial Statements For the periods indicated in Note 1
between the Trust and the related parties are in the normal course of business and are carried out at arm’s length terms.
(a) Decision about the purchase and sale of the Trust’s portfolio securities are made by appointed Portfolio Managers of the Trust. Provided that the pricing, service and other terms are comparable to those offered by other dealers, a portion of the portfolio transactions may be executed for the Trust, by Scotia Capital Inc. In such cases, Scotia Capital will receive commissions from the Trust.
(b) As at December 31, 2015 and 2014, the Trust invested in Underlying Funds managed by the Manager. These holdings are disclosed in the Schedule of Investment Portfolio, as applicable. Units held by the Manager in the Trust as at December 31, 2015 was nil (December 31, 2014 – nil).
11. Filing Exemptions
The Trust is relying on the exemption available under section 2.11 of National Instrument 81-106 – Investment Fund Continuous Disclosure which exempts a mutual fund that is not a reporting issuer from publicly filing its financial statements for a financial year or for an interim period.

ManagementResponsibilityForFinancialReporting
The accompanying financial statements of the Trust have been prepared by1832 Asset Management L.P., in its capacity as manager (the “Manager”) of theTrust and have been approved by the Board of Directors of 1832 AssetManagement G.P. Inc., as general partner for and on behalf of 1832 Asset Man-agement L.P., in its capacity as trustee (the “Trustee”) of the Trust. The Boardof Directors of 1832 Asset Management G.P. Inc., as general partner for and onbehalf of 1832 Asset management L.P. is responsible for the information andrepresentations contained in these financial statements.
The Manager maintains appropriate processes to ensure that relevant and reli-able financial information is produced. The financial statements have beenprepared in accordance with International Financial Reporting Standards(“IFRS”) and include certain amounts that are based on estimates and judg-ments made by the Manager. The significant accounting policies which theManager believes are appropriate for the Trust are described in Note 2 to thefinancial statements.
The Finance Committee of the Board of Directors of 1832 Asset ManagementG.P. Inc. is responsible for reviewing the financial statements and recommend-ing them to the Board of Directors of 1832 Asset Management G.P. Inc forapproval, in addition to meeting with management, internal auditors andexternal auditors to discuss internal controls over the financial reporting proc-ess, auditing matters and financial reporting issues.
PricewaterhouseCoopers LLP is the external auditor of the Trust, appointed bythe Trustee of the Trust. The auditor of the Fund has audited the financialstatements in accordance with the Canadian generally accepted auditing stan-dards to enable it to express to the securityholders its opinion on the financialstatements. The auditor’s report is set out herein.
Jordy Chilcott
Co-President
1832 Asset Management L.P.
Abdurrehman Muhammadi
Chief Financial Officer
1832 Asset Management L.P.
March 10, 2016

Independent Auditor’s Report
To the unitholders and trustee of Lincluden Private Trust (the Trust)
We have audited the accompanying financial statements of the Trust, which comprise the statements of financial position as at December 31, 2015 and 2014 and the statements of comprehensive income, the changes in net assets attributable to holders of redeemable units and cash flows for the years then ended and the related notes, which comprise a summary of significant accounting policies and other explanatory information.
Management’s responsibility for the financial statements Management is responsible for the preparation and fair presentation of these financial statements in accordance with International Financial Reporting Standards, and for such internal control as management determines is necessary to enable the preparation of financial statements that are free from material misstatement, whether due to fraud or error.
Auditor’s responsibility Our responsibility is to express an opinion on these financial statements based on our audits. We conducted our audits in accordance with Canadian generally accepted auditing standards. Those standards require that we comply with ethical requirements and plan and perform the audits to obtain reasonable assurance about whether the financial statements are free from material misstatement.
An audit involves performing procedures to obtain audit evidence about the amounts and disclosures in the financial statements. The procedures selected depend on the auditor’s judgment, including the assessment of the risks of material misstatement of the financial statements, whether due to fraud or error. In making those risk assessments, the auditor considers internal control relevant to the entity’s preparation and fair presentation of the financial statements in order to design audit procedures that are appropriate in the circumstances, but not for the purpose of expressing an opinion on the effectiveness of the entity’s internal control. An audit also includes evaluating the appropriateness of accounting policies used and the reasonableness of accounting estimates made by management, as well as evaluating the overall presentation of the financial statements.
We believe that the audit evidence we have obtained in our audits is sufficient and appropriate to provide a basis for our audit opinion.
Opinion In our opinion, the financial statements present fairly, in all material respects, the financial position of the Trust as at December 31, 2015 and 2014 and its financial performance and cash flows for the years then ended in accordance with International Financial Reporting Standards.
Chartered Professional Accountants, Licensed Public Accountants
Toronto, Ontario March 10, 2016


![Consolidated Financial Statements with … OF MANAGEMENT RESPONSIBILITY The accompanying consolidated financial statements of Memorial University of Newfoundland [the “University”]](https://img.dokumen.tips/doc/110x75/5aae76557f8b9a59478c1b1f/consolidated-financial-statements-with-of-management-responsibility-the-accompanying.jpg)