Embed Size (px)
Citation preview
FinancialReviewHow did our business performance create economic value for our shareholders?
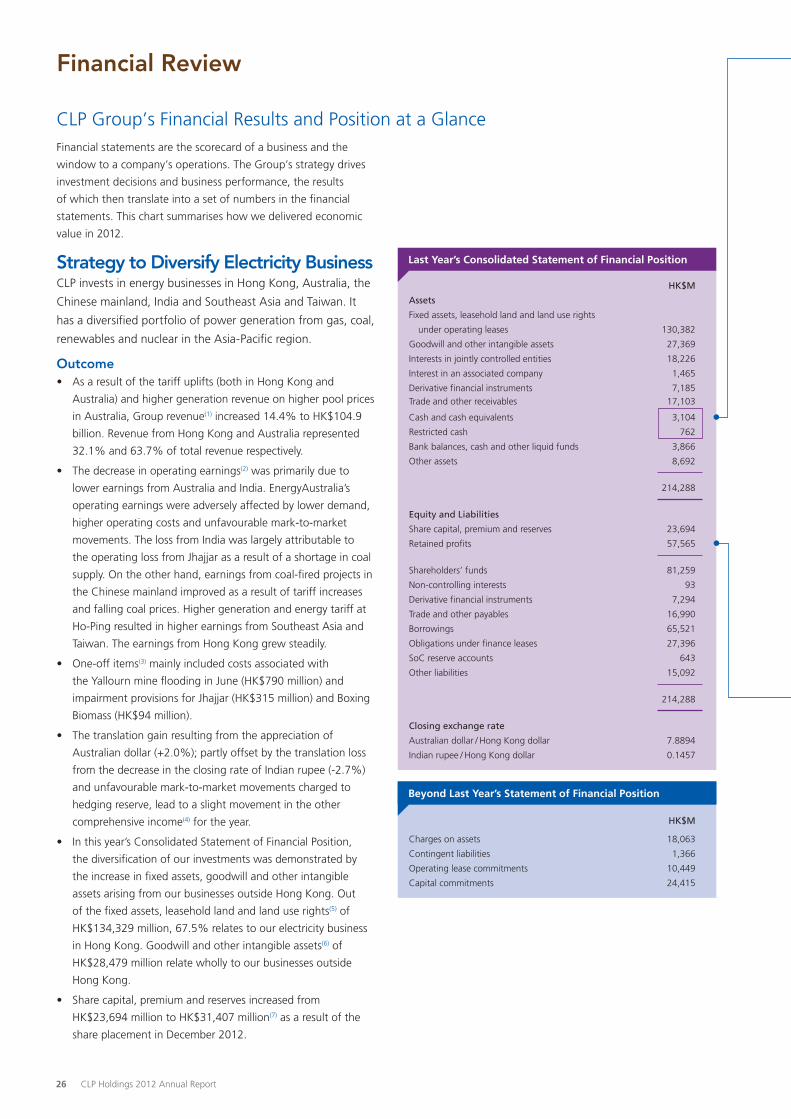
CLP Group’s Financial Results and Position at a GlanceFinancial statements are the scorecard of a business and the
window to a company’s operations. The Group’s strategy drives
investment decisions and business performance, the results
of which then translate into a set of numbers in the financial
statements. This chart summarises how we delivered economic
value in 2012.
StrategytoDiversifyElectricityBusinessCLP invests in energy businesses in Hong Kong, Australia, the
Chinese mainland, India and Southeast Asia and Taiwan. It
has a diversified portfolio of power generation from gas, coal,
renewables and nuclear in the Asia-Pacific region.
Outcome• As a result of the tariff uplifts (both in Hong Kong and
Australia) and higher generation revenue on higher pool prices
in Australia, Group revenue(1) increased 14.4% to HK$104.9
billion. Revenue from Hong Kong and Australia represented
32.1% and 63.7% of total revenue respectively.
• The decrease in operating earnings(2) was primarily due to
lower earnings from Australia and India. EnergyAustralia’s
operating earnings were adversely affected by lower demand,
higher operating costs and unfavourable mark-to-market
movements. The loss from India was largely attributable to
the operating loss from Jhajjar as a result of a shortage in coal
supply. On the other hand, earnings from coal-fired projects in
the Chinese mainland improved as a result of tariff increases
and falling coal prices. Higher generation and energy tariff at
Ho-Ping resulted in higher earnings from Southeast Asia and
Taiwan. The earnings from Hong Kong grew steadily.
• One-off items(3) mainly included costs associated with
the Yallourn mine flooding in June (HK$790 million) and
impairment provisions for Jhajjar (HK$315 million) and Boxing
Biomass (HK$94 million).
• The translation gain resulting from the appreciation of
Australian dollar (+2.0%); partly offset by the translation loss
from the decrease in the closing rate of Indian rupee (-2.7%)
and unfavourable mark-to-market movements charged to
hedging reserve, lead to a slight movement in the other
comprehensive income(4) for the year.
• In this year’s Consolidated Statement of Financial Position,
the diversification of our investments was demonstrated by
the increase in fixed assets, goodwill and other intangible
assets arising from our businesses outside Hong Kong. Out
of the fixed assets, leasehold land and land use rights(5) of
HK$134,329 million, 67.5% relates to our electricity business
in Hong Kong. Goodwill and other intangible assets(6) of
HK$28,479 million relate wholly to our businesses outside
Hong Kong.
• Share capital, premium and reserves increased from
HK$23,694 million to HK$31,407 million(7) as a result of the
share placement in December 2012.
Beyond Last Year’s Statement of Financial Position
Last Year’s Consolidated Statement of Financial Position
HK$M
Assets
Fixed assets, leasehold land and land use rights
under operating leases 130,382
Goodwill and other intangible assets 27,369
Interests in jointly controlled entities 18,226
Interest in an associated company 1,465
Derivative financial instruments 7,185Trade and other receivables 17,103
Cash and cash equivalents 3,104
Restricted cash 762
Bank balances, cash and other liquid funds 3,866
Other assets 8,692
214,288
Equity and Liabilities
Share capital, premium and reserves 23,694
Retained profits 57,565
Shareholders’ funds 81,259
Non-controlling interests 93
Derivative financial instruments 7,294
Trade and other payables 16,990
Borrowings 65,521
Obligations under finance leases 27,396
SoC reserve accounts 643
Other liabilities 15,092
214,288
Closing exchange rate
Australian dollar / Hong Kong dollar 7.8894
Indian rupee / Hong Kong dollar 0.1457
HK$M
Charges on assets 18,063
Contingent liabilities 1,366
Operating lease commitments 10,449
Capital commitments 24,415
Financial Review
26 CLP Holdings 2012 Annual Report
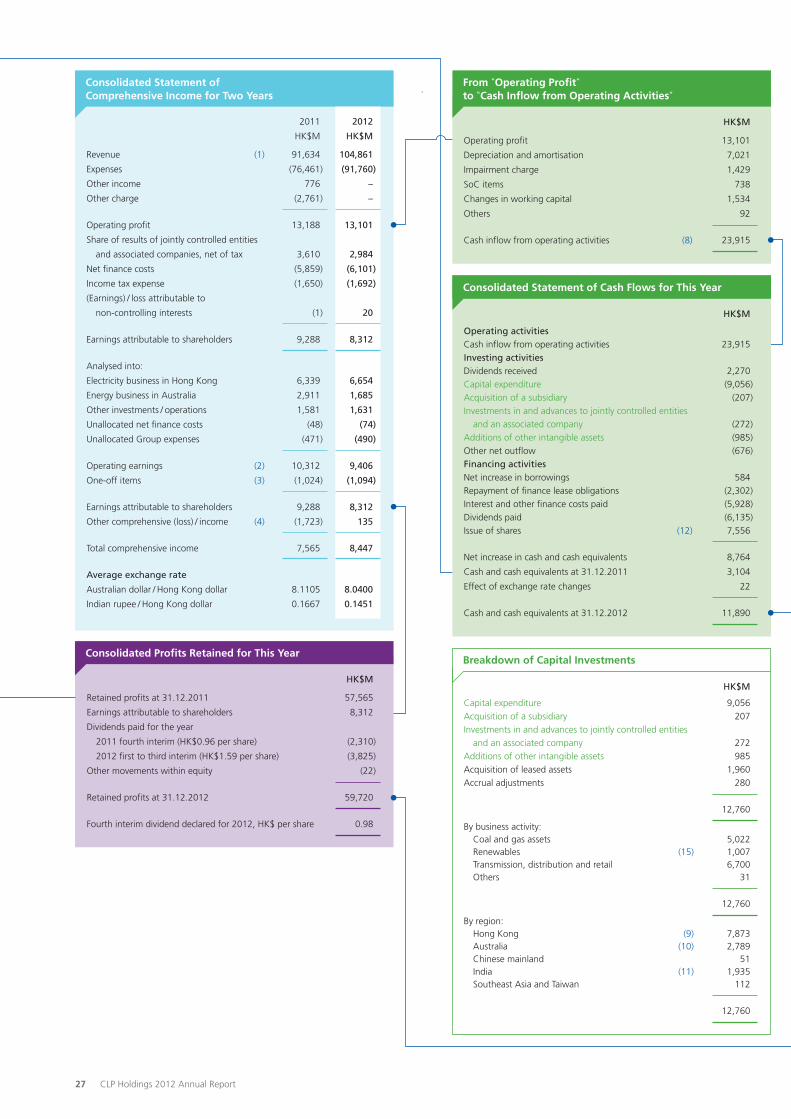
Consolidated Statement of Comprehensive Income for Two Years
Breakdown of Capital Investments
From “Operating Profit”to “Cash Inflow from Operating Activities”
Consolidated Statement of Cash Flows for This Year
Consolidated Profits Retained for This Year
2011 2012
HK$M HK$M
Revenue (1) 91,634 104,861
Expenses (76,461) (91,760)
Other income 776 –
Other charge (2,761) –
Operating profit 13,188 13,101
Share of results of jointly controlled entities
and associated companies, net of tax 3,610 2,984
Net finance costs (5,859) (6,101)
Income tax expense (1,650) (1,692)
(Earnings) / loss attributable to
non-controlling interests (1) 20
Earnings attributable to shareholders 9,288 8,312
Analysed into:
Electricity business in Hong Kong 6,339 6,654
Energy business in Australia 2,911 1,685
Other investments / operations 1,581 1,631
Unallocated net finance costs (48) (74)
Unallocated Group expenses (471) (490)
Operating earnings (2) 10,312 9,406
One-off items (3) (1,024) (1,094)
Earnings attributable to shareholders 9,288 8,312
Other comprehensive (loss) / income (4) (1,723) 135
Total comprehensive income 7,565 8,447
Average exchange rate
Australian dollar / Hong Kong dollar 8.1105 8.0400
Indian rupee / Hong Kong dollar 0.1667 0.1451
HK$M
Retained profits at 31.12.2011 57,565
Earnings attributable to shareholders 8,312
Dividends paid for the year
2011 fourth interim (HK$0.96 per share) (2,310)
2012 first to third interim (HK$1.59 per share) (3,825)
Other movements within equity (22)
Retained profits at 31.12.2012 59,720
Fourth interim dividend declared for 2012, HK$ per share 0.98
HK$M
Operating profit 13,101
Depreciation and amortisation 7,021
Impairment charge 1,429
SoC items 738
Changes in working capital 1,534
Others 92
Cash inflow from operating activities (8) 23,915
HK$M
Operating activitiesCash inflow from operating activities 23,915Investing activitiesDividends received 2,270Capital expenditure (9,056)Acquisition of a subsidiary (207)Investments in and advances to jointly controlled entities and an associated company (272)Additions of other intangible assets (985)Other net outflow (676)Financing activities Net increase in borrowings 584Repayment of finance lease obligations (2,302)Interest and other finance costs paid (5,928)Dividends paid (6,135)Issue of shares (12) 7,556
Net increase in cash and cash equivalents 8,764
Cash and cash equivalents at 31.12.2011 3,104
Effect of exchange rate changes 22
Cash and cash equivalents at 31.12.2012 11,890
HK$M
Capital expenditure 9,056Acquisition of a subsidiary 207Investments in and advances to jointly controlled entities and an associated company 272Additions of other intangible assets 985Acquisition of leased assets 1,960Accrual adjustments 280
12,760
By business activity: Coal and gas assets 5,022 Renewables (15) 1,007 Transmission, distribution and retail 6,700 Others 31
12,760
By region: Hong Kong (9) 7,873 Australia (10) 2,789 Chinese mainland 51 India (11) 1,935 Southeast Asia and Taiwan 112
12,760
27 CLP Holdings 2012 Annual Report

CLP Holdings 2012 Annual Report 28
Strategy to Optimise Financial and Capital StructureCLP’s prudent financial management ensures that adequate resources are available to meet our operating, investing and
financing needs.
Outcome• Operating activities: The operating cash flows(8) from the Hong
Kong SoC business and the expanded Australia business post-
NSW acquisition are the main sources for dividend payments
and future business growth.
• Investing activities: In Hong Kong, we continued development
and enhancement of the power system network and
generating plants(9). In Australia, capital investments of
HK$2,789 million(10) mainly related to the enhancement
works at Yallourn, investment in Pine Dale coal mine and
development of a new billing system. The completion of
Jhajjar and construction of wind projects in India represented
capital investments of HK$1,935 million(11).
• Financing activities: In December, the Company completed
a placement of 120,307,170 shares and raised HK$7,556
million(12). The proceeds will be used for expected
investment needs across CLP’s business. Our total debt to
total capital ratio decreased from 44.6% to 42.1% at 2012
year end. CLPH’s credit ratings of A- by Standard & Poor’s
and A2 by Moody’s were maintained.
Strategy to Manage RisksCLP’s philosophy is to mitigate financial risks through the use
of financial instruments to hedge our exposures to interest rate,
foreign currency and energy price risks.
OutcomeThe derivative assets(13) and liabilities(14) refer to the fair value gains
and losses of the financial instruments respectively at year end.
At 31 December 2012, the Group had net derivative liabilities
of HK$802 million which represents the net amount we would
pay if these contracts were closed out at year end. The increase
in net derivative liabilities is primarily due to the depreciation of
Japanese yen and lower floating interest rate for Australian dollar
against our cross-currency interest rate swaps and interest rate
swaps respectively.
Strategy to Reduce Carbon IntensityCLP continues to invest in renewable energy to reduce the carbon
intensity of its generating portfolio and exploit the opportunities
of low carbon emissions generation.
Outcome• Renewable energy contributed HK$389 million to operating
earnings in 2012.
• Investment of HK$1,007 million(15) during the year mostly in
wind farms across India and the Chinese mainland.
• Renewable energy sources increased from 2,424MW to
2,734MW and represent over 20% of our total generating
capacity.
Today’s Consolidated Statement of Financial Position
Beyond Today’s Statement of Financial Position
HK$M
Assets
Fixed assets, leasehold land and land use rights
under operating leases (5) 134,329
Goodwill and other intangible assets (6) 28,479
Interests in jointly controlled entities 19,197
Interest in an associated company 1,856
Derivative financial instruments (13) 5,044
Trade and other receivables 18,552
Cash and cash equivalents 11,890
Restricted cash 1,136
Bank balances, cash and other liquid funds 13,026
Other assets 8,273
228,756
Equity and Liabilities
Share capital, premium and reserves (7) 31,407
Retained profits 59,720
Shareholders’ funds 91,127
Non-controlling interests 74
Derivative financial instruments (14) 5,846
Trade and other payables 21,732
Borrowings 66,198
Obligations under finance leases 27,055
SoC reserve accounts 1,245
Other liabilities 15,479
228,756
Closing exchange rate
Australian dollar / Hong Kong dollar 8.0469
Indian rupee / Hong Kong dollar 0.1417
HK$M
Charges on assets 19,291
Contingent liabilities 1,566
Operating lease commitments 11,308
Capital commitments 21,805
2008 2009 2010 2011 2012
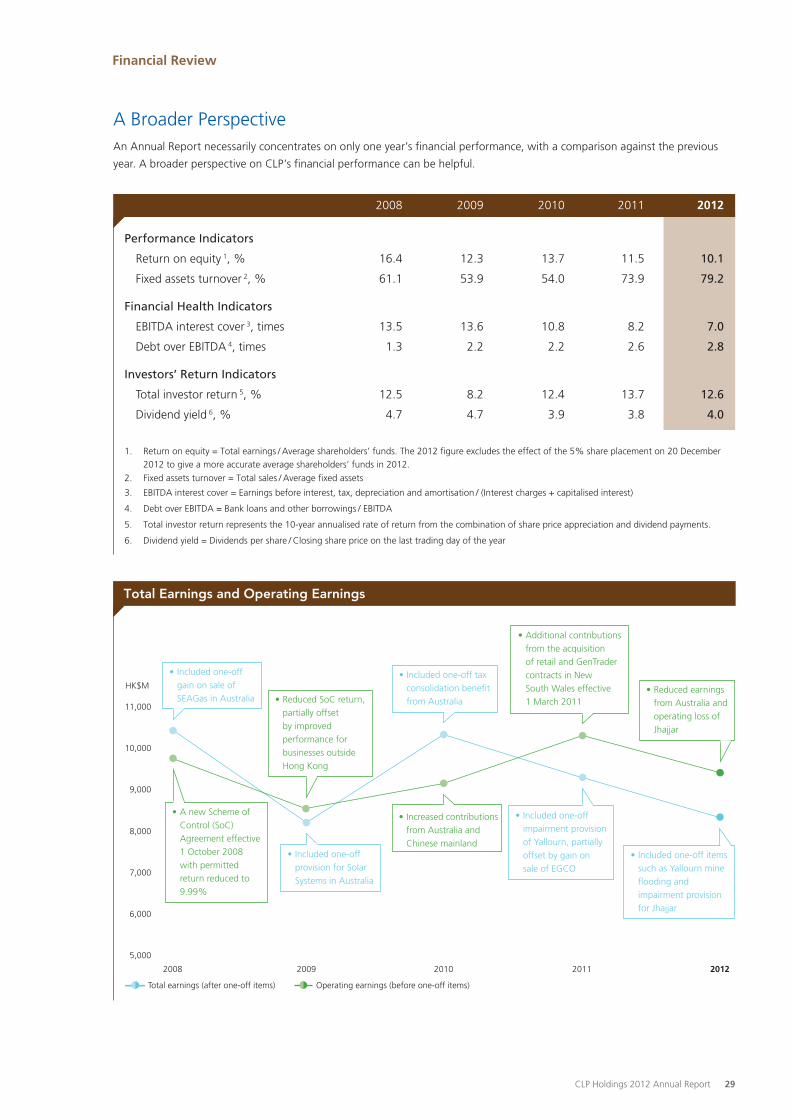
Performance Indicators
Return on equity 1, % 16.4 12.3 13.7 11.5 10.1
Fixed assets turnover 2, % 61.1 53.9 54.0 73.9 79.2
Financial Health Indicators
EBITDA interest cover 3, times 13.5 13.6 10.8 8.2 7.0
Debt over EBITDA 4, times 1.3 2.2 2.2 2.6 2.8
Investors’ Return Indicators
Total investor return 5, % 12.5 8.2 12.4 13.7 12.6
Dividend yield 6, % 4.7 4.7 3.9 3.8 4.0
1. Return on equity = Total earnings / Average shareholders’ funds. The 2012 figure excludes the effect of the 5% share placement on 20 December 2012 to give a more accurate average shareholders’ funds in 2012.
2. Fixed assets turnover = Total sales / Average fixed assets
3. EBITDA interest cover = Earnings before interest, tax, depreciation and amortisation / (Interest charges + capitalised interest)
4. Debt over EBITDA = Bank loans and other borrowings / EBITDA
5. Total investor return represents the 10-year annualised rate of return from the combination of share price appreciation and dividend payments.
6. Dividend yield = Dividends per share / Closing share price on the last trading day of the year
A Broader PerspectiveAn Annual Report necessarily concentrates on only one year’s financial performance, with a comparison against the previous
year. A broader perspective on CLP’s financial performance can be helpful.
HK$M
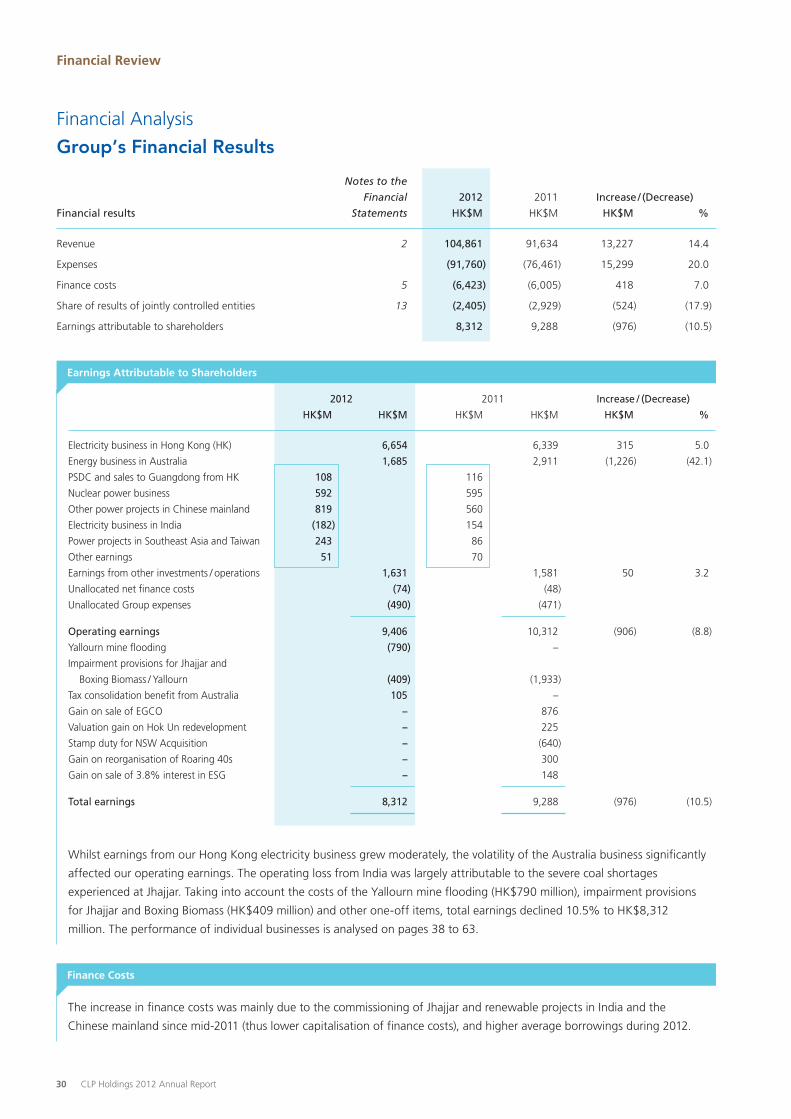
Operating earnings (before one-off items)Total earnings (after one-off items)
Total Earnings and Operating Earnings
20122011201020092008
5,000
6,000
7,000
8,000
9,000
10,000
11,000
• Included one-off gain on sale of SEAGas in Australia • Reduced SoC return,
partially offset by improved performance for businesses outside Hong Kong
• A new Scheme of Control (SoC) Agreement effective 1 October 2008 with permitted return reduced to 9.99%
• Included one-off provision for Solar Systems in Australia
• Additional contributions from the acquisition of retail and GenTrader contracts in New South Wales effective 1 March 2011
• Reduced earnings from Australia and operating loss of Jhajjar
• Included one-off tax consolidation bene�t from Australia
• Included one-off impairment provision of Yallourn, partially offset by gain on sale of EGCO
• Included one-off items such as Yallourn mine �ooding and impairment provision for Jhajjar
• Increased contributions from Australia and Chinese mainland
Financial Review
CLP Holdings 2012 Annual Report 29
The increase in finance costs was mainly due to the commissioning of Jhajjar and renewable projects in India and the
Chinese mainland since mid-2011 (thus lower capitalisation of finance costs), and higher average borrowings during 2012.
Finance Costs
2012 2011 Increase / (Decrease)
HK$M HK$M HK$M HK$M HK$M %
Electricity business in Hong Kong (HK) 6,654 6,339 315 5.0
Energy business in Australia 1,685 2,911 (1,226) (42.1)
PSDC and sales to Guangdong from HK 108 116
Nuclear power business 592 595
Other power projects in Chinese mainland 819 560
Electricity business in India (182) 154
Power projects in Southeast Asia and Taiwan 243 86
Other earnings 51 70
Earnings from other investments / operations 1,631 1,581 50 3.2
Unallocated net finance costs (74) (48)
Unallocated Group expenses (490) (471)
Operating earnings 9,406 10,312 (906) (8.8)
Yallourn mine flooding (790) –
Impairment provisions for Jhajjar and
Boxing Biomass / Yallourn (409) (1,933)
Tax consolidation benefit from Australia 105 –
Gain on sale of EGCO – 876
Valuation gain on Hok Un redevelopment – 225
Stamp duty for NSW Acquisition – (640)
Gain on reorganisation of Roaring 40s – 300
Gain on sale of 3.8% interest in ESG – 148
Total earnings 8,312 9,288 (976) (10.5)
Whilst earnings from our Hong Kong electricity business grew moderately, the volatility of the Australia business significantly
affected our operating earnings. The operating loss from India was largely attributable to the severe coal shortages
experienced at Jhajjar. Taking into account the costs of the Yallourn mine flooding (HK$790 million), impairment provisions
for Jhajjar and Boxing Biomass (HK$409 million) and other one-off items, total earnings declined 10.5% to HK$8,312
million. The performance of individual businesses is analysed on pages 38 to 63.
Earnings Attributable to Shareholders
Notes to the
Financial 2012 2011 Increase / (Decrease)
Financial results Statements HK$M HK$M HK$M %
Revenue 2 104,861 91,634 13,227 14.4
Expenses (91,760) (76,461) 15,299 20.0
Finance costs 5 (6,423) (6,005) 418 7.0
Share of results of jointly controlled entities 13 (2,405) (2,929) (524) (17.9)
Earnings attributable to shareholders 8,312 9,288 (976) (10.5)
Financial Analysis
Group’s Financial Results
Financial Review
30 CLP Holdings 2012 Annual Report
Non-current Assets Working CapitalDebts and Other
Non-current LiabilitiesEquityFinancial Results
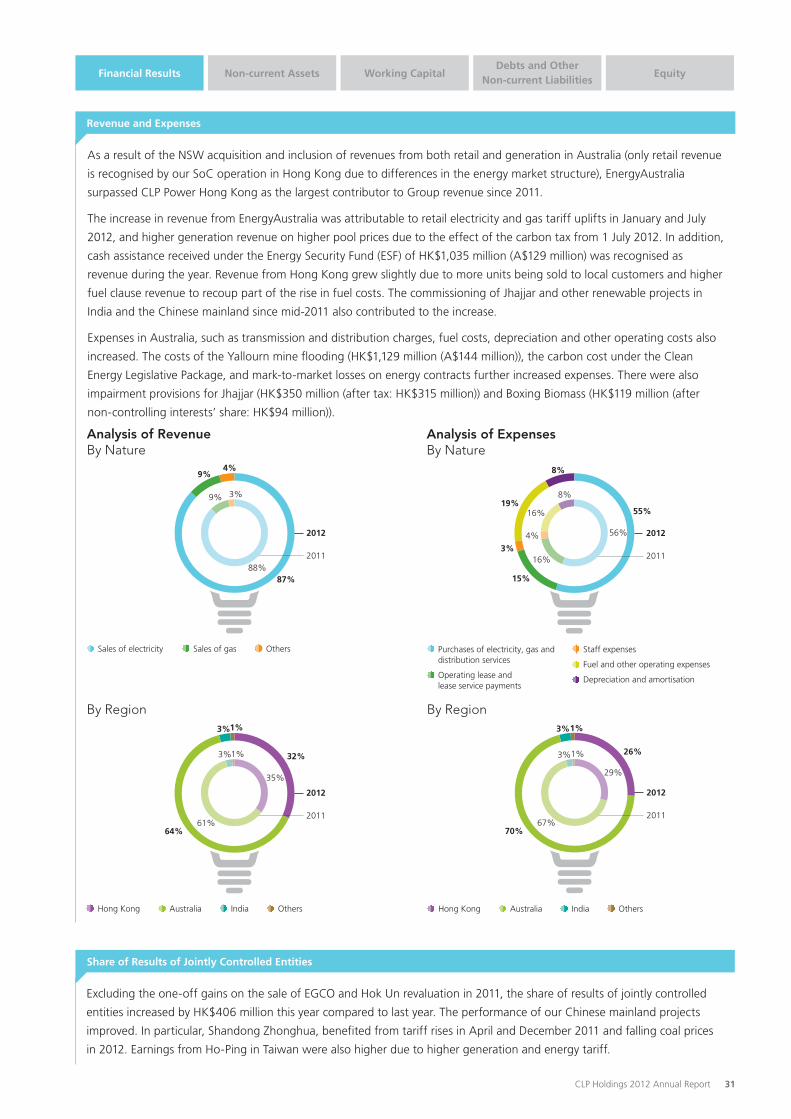
As a result of the NSW acquisition and inclusion of revenues from both retail and generation in Australia (only retail revenue
is recognised by our SoC operation in Hong Kong due to differences in the energy market structure), EnergyAustralia
surpassed CLP Power Hong Kong as the largest contributor to Group revenue since 2011.
The increase in revenue from EnergyAustralia was attributable to retail electricity and gas tariff uplifts in January and July
2012, and higher generation revenue on higher pool prices due to the effect of the carbon tax from 1 July 2012. In addition,
cash assistance received under the Energy Security Fund (ESF) of HK$1,035 million (A$129 million) was recognised as
revenue during the year. Revenue from Hong Kong grew slightly due to more units being sold to local customers and higher
fuel clause revenue to recoup part of the rise in fuel costs. The commissioning of Jhajjar and other renewable projects in
India and the Chinese mainland since mid-2011 also contributed to the increase.
Expenses in Australia, such as transmission and distribution charges, fuel costs, depreciation and other operating costs also
increased. The costs of the Yallourn mine flooding (HK$1,129 million (A$144 million)), the carbon cost under the Clean
Energy Legislative Package, and mark-to-market losses on energy contracts further increased expenses. There were also
impairment provisions for Jhajjar (HK$350 million (after tax: HK$315 million)) and Boxing Biomass (HK$119 million (after
non-controlling interests’ share: HK$94 million)).
Revenue and Expenses
Excluding the one-off gains on the sale of EGCO and Hok Un revaluation in 2011, the share of results of jointly controlled
entities increased by HK$406 million this year compared to last year. The performance of our Chinese mainland projects
improved. In particular, Shandong Zhonghua, benefited from tariff rises in April and December 2011 and falling coal prices
in 2012. Earnings from Ho-Ping in Taiwan were also higher due to higher generation and energy tariff.
Share of Results of Jointly Controlled Entities
Analysis of Revenue By Nature
Sales of electricity Sales of gas Others
2012
2011
87%88%
3%
4%
9%
9%
By Region
Hong Kong Australia India Others
2012
2011
32%
35%
61%64%
1%
1%
3%
3%
Analysis of Expenses By Nature
2012
2011
55%
56%
16%
4%
16%
3%
19%
15%
8%
8%
Purchases of electricity, gas anddistribution services
Operating lease and lease service payments
Staff expenses
Fuel and other operating expenses
Depreciation and amortisation
By Region
2012
2011
26%
29%
67%
3%
3%
70%
1%
1%
Hong Kong Australia India Others
CLP Holdings 2012 Annual Report 31
Financial Review
Notes to the
Financial 2012 2011 Increase
Non-current assets Statements HK$M HK$M HK$M %
Fixed assets 10(A) 132,463 128,571 3,892 3.0
Leasehold land and land use rights under operating leases 10(B) 1,866 1,811 55 3.0
Goodwill and other intangible assets 11 28,479 27,369 1,110 4.1
Interests in jointly controlled entities 13 19,197 18,226 971 5.3
Total assets 228,756 214,288 14,468 6.8
Net assets (total assets less total liabilities) 91,201 81,352 9,849 12.1
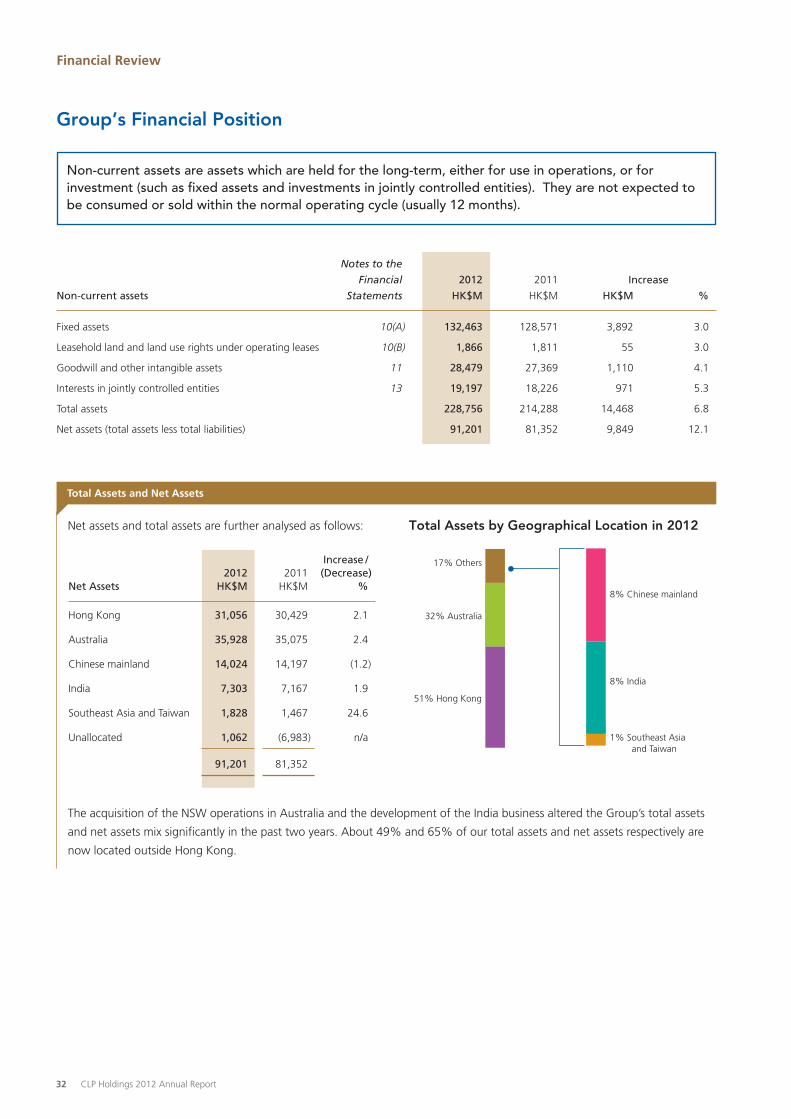
Non-current assets are assets which are held for the long-term, either for use in operations, or for investment (such as fixed assets and investments in jointly controlled entities). They are not expected to be consumed or sold within the normal operating cycle (usually 12 months).
Group’s Financial Position
Net assets and total assets are further analysed as follows:
The acquisition of the NSW operations in Australia and the development of the India business altered the Group’s total assets
and net assets mix significantly in the past two years. About 49% and 65% of our total assets and net assets respectively are
now located outside Hong Kong.
Hong Kong 31,056 30,429 2.1
Australia 35,928 35,075 2.4
Chinese mainland 14,024 14,197 (1.2)
India 7,303 7,167 1.9
Southeast Asia and Taiwan 1,828 1,467 24.6
Unallocated 1,062 (6,983) n/a
91,201 81,352
Increase / 2012 2011 (Decrease )
Net Assets HK$M HK$M %
Total Assets and Net Assets
Total Assets by Geographical Location in 2012
51% Hong Kong
17% Others
32% Australia
8% Chinese mainland
1% Southeast Asia and Taiwan
8% India
32 CLP Holdings 2012 Annual Report
Non-current Assets Working CapitalDebts and Other
Non-current LiabilitiesEquityFinancial Results
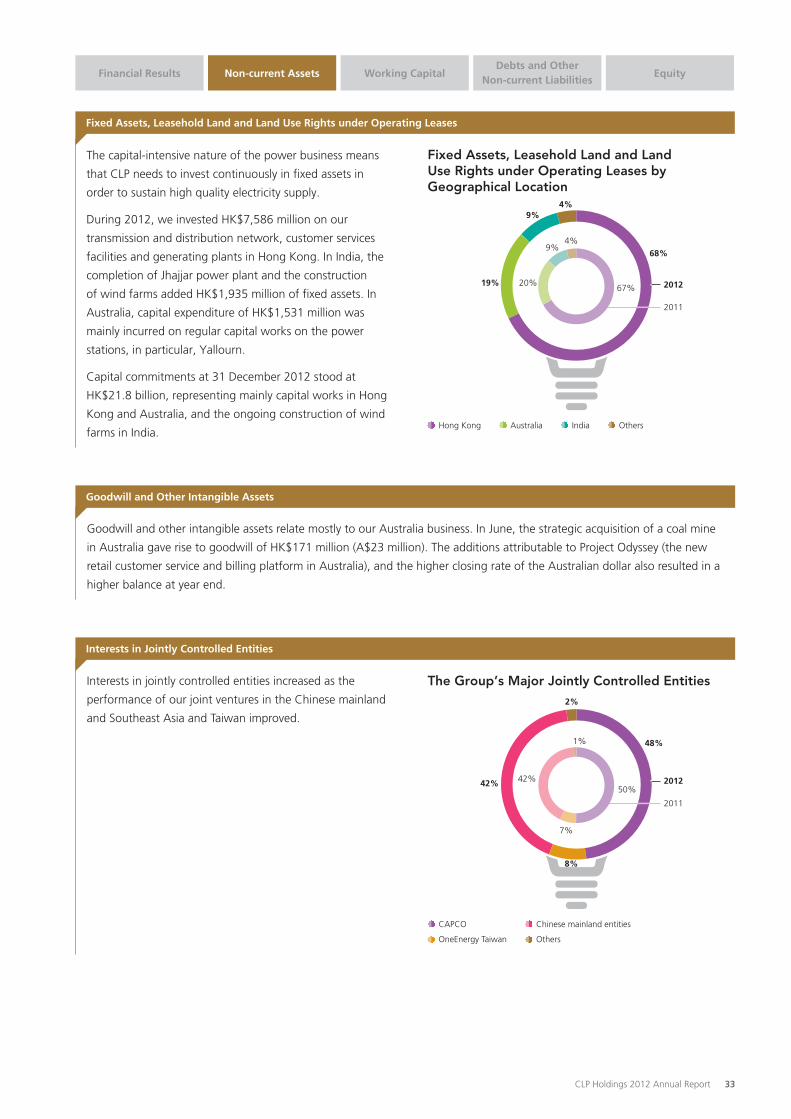
Fixed Assets, Leasehold Land and Land Use Rights under Operating Leases
The capital-intensive nature of the power business means
that CLP needs to invest continuously in fixed assets in
order to sustain high quality electricity supply.
During 2012, we invested HK$7,586 million on our
transmission and distribution network, customer services
facilities and generating plants in Hong Kong. In India, the
completion of Jhajjar power plant and the construction
of wind farms added HK$1,935 million of fixed assets. In
Australia, capital expenditure of HK$1,531 million was
mainly incurred on regular capital works on the power
stations, in particular, Yallourn.
Capital commitments at 31 December 2012 stood at
HK$21.8 billion, representing mainly capital works in Hong
Kong and Australia, and the ongoing construction of wind
farms in India.
Fixed Assets, Leasehold Land and Land Use Rights under Operating Leases byGeographical Location
2012
2011
67%
4%
4%9%
9%
20%19%
68%
Hong Kong Australia India Others
Goodwill and other intangible assets relate mostly to our Australia business. In June, the strategic acquisition of a coal mine
in Australia gave rise to goodwill of HK$171 million (A$23 million). The additions attributable to Project Odyssey (the new
retail customer service and billing platform in Australia), and the higher closing rate of the Australian dollar also resulted in a
higher balance at year end.
Goodwill and Other Intangible Assets
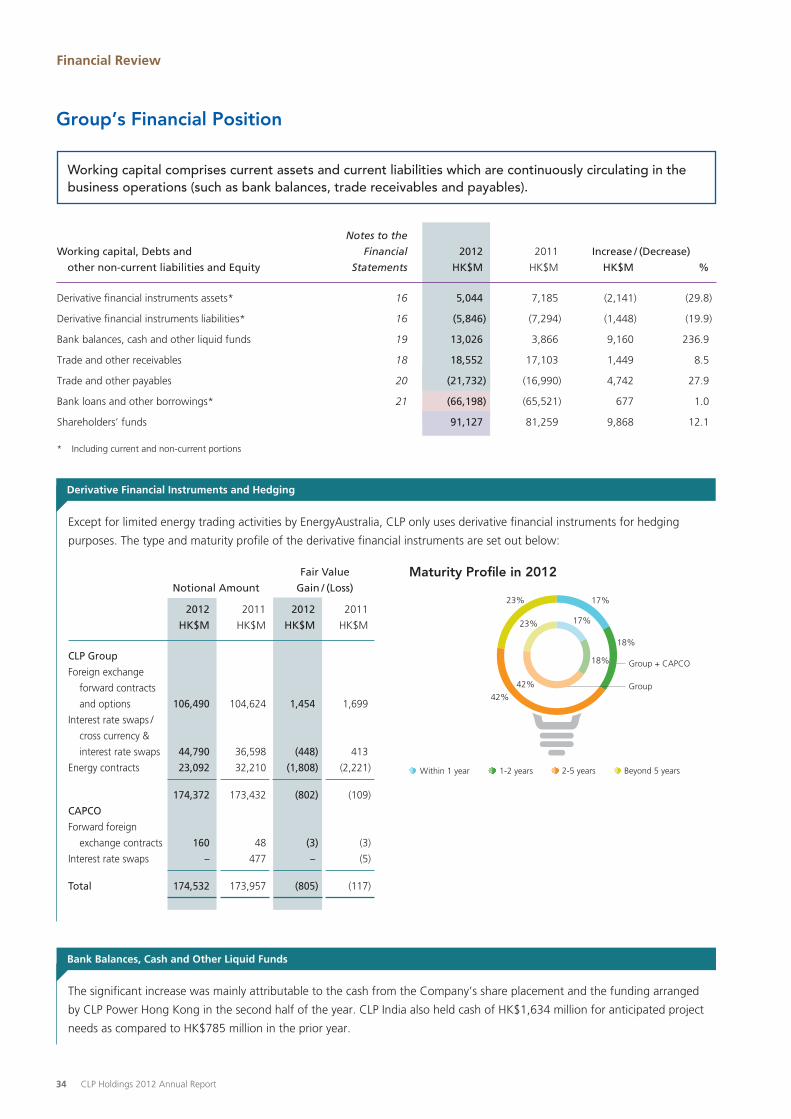
Interests in jointly controlled entities increased as the
performance of our joint ventures in the Chinese mainland
and Southeast Asia and Taiwan improved.
Interests in Jointly Controlled Entities
2012
2011
50%
1%
8%
7%
42%42%
48%
The Group’s Major Jointly Controlled Entities2%
CAPCO
OneEnergy Taiwan
Chinese mainland entities
Others
CLP Holdings 2012 Annual Report 33
Financial Review
Maturity Pro�le in 2012
Group + CAPCO
Group
17%
17%
18%
18%
23%
42%
23%
42%
Within 1 year 1-2 years 2-5 years Beyond 5 years
CLP Group
Foreign exchange
forward contracts
and options 106,490 104,624 1,454 1,699
Interest rate swaps /
cross currency &
interest rate swaps 44,790 36,598 (448) 413
Energy contracts 23,092 32,210 (1,808) (2,221)
174,372 173,432 (802) (109)
CAPCO
Forward foreign
exchange contracts 160 48 (3) (3)
Interest rate swaps – 477 – (5)
Total 174,532 173,957 (805) (117)
Fair Value
Notional Amount Gain / (Loss)
2012 2011 2012 2011
HK$M HK$M HK$M HK$M
Working capital comprises current assets and current liabilities which are continuously circulating in the business operations (such as bank balances, trade receivables and payables).
Derivative Financial Instruments and Hedging
The significant increase was mainly attributable to the cash from the Company’s share placement and the funding arranged
by CLP Power Hong Kong in the second half of the year. CLP India also held cash of HK$1,634 million for anticipated project
needs as compared to HK$785 million in the prior year.
Bank Balances, Cash and Other Liquid Funds
Except for limited energy trading activities by EnergyAustralia, CLP only uses derivative financial instruments for hedging
purposes. The type and maturity profile of the derivative financial instruments are set out below:
Group’s Financial Position
* Including current and non-current portions
Notes to the
Working capital, Debts and Financial 2012 2011 Increase / (Decrease)
other non-current liabilities and Equity Statements HK$M HK$M HK$M %
Derivative financial instruments assets* 16 5,044 7,185 (2,141) (29.8)
Derivative financial instruments liabilities* 16 (5,846) (7,294) (1,448) (19.9)
Bank balances, cash and other liquid funds 19 13,026 3,866 9,160 236.9
Trade and other receivables 18 18,552 17,103 1,449 8.5
Trade and other payables 20 (21,732) (16,990) 4,742 27.9
Bank loans and other borrowings* 21 (66,198) (65,521) 677 1.0
Shareholders’ funds 91,127 81,259 9,868 12.1
34 CLP Holdings 2012 Annual Report

Trade Receivables by Segment
2012
2011
15%
18%
70%
73%
1%11%
1%11%
Hong Kong Australia India Others
To support the funding needs for capital investment
and business development, additional loans were drawn
during the year. CLP Power Hong Kong arranged HK$9.9
billion new financing under the MTN programme and
other banking facilities. EnergyAustralia obtained US$400
million (HK$3.1 billion) under the U.S. private placement
and arranged A$750 million (HK$6 billion) new banking
facilities, most of which are used to refinance its existing
debts. Subsidiaries in India also drew down loans of HK$5.1
billion to finance the construction of Jhajjar and wind farms.
On the other hand, HK$20.7 billion of borrowings were
repaid during the year.
The increase in trade and other receivables was mainly
attributable to our overseas businesses. Trade receivables
increased by HK$2,834 million, in line with the uplifts in
tariffs and higher pool prices at year end in Australia and
additional projects in India coming into operation. This was
partially offset by the return of a deposit (HK$1,159 million)
to CLP for the investment in Yangjiang nuclear power
project in January 2012.
Trade and Other Receivables
Trade Payables by Segment
2012
2011
9%
9%
83%
88%
4%4%
1%2%
Hong Kong Australia India Others
The increase mainly related to Australia and was
attributable to the unamortised deferred revenue of
HK$1,036 million (A$129 million) in respect of the cash
assistance received under the ESF, the provision for carbon
cost under the Clean Energy Legislative Package effective
July 2012, and higher pool purchases payable on higher
pool prices.
Trade and Other Payables
Bank Loans and Other Borrowings
The increase in shareholders’ funds was mainly due to the 5% placement of the Company’s shares for net proceeds of
HK$7,556 million. The placement was completed on 20 December 2012.
Shareholders’ Funds
Non-current Assets Working CapitalDebts and Other
Non-current LiabilitiesEquityFinancial Results
Bank Loans and Other Borrowings by Segment
Hong Kong
Australia
Chinese mainland Corporate
India
2012
2011
51%42%
29%
5%
25%
5%
12%
12%
4%
15%
CLP Holdings 2012 Annual Report 35
Financial Review
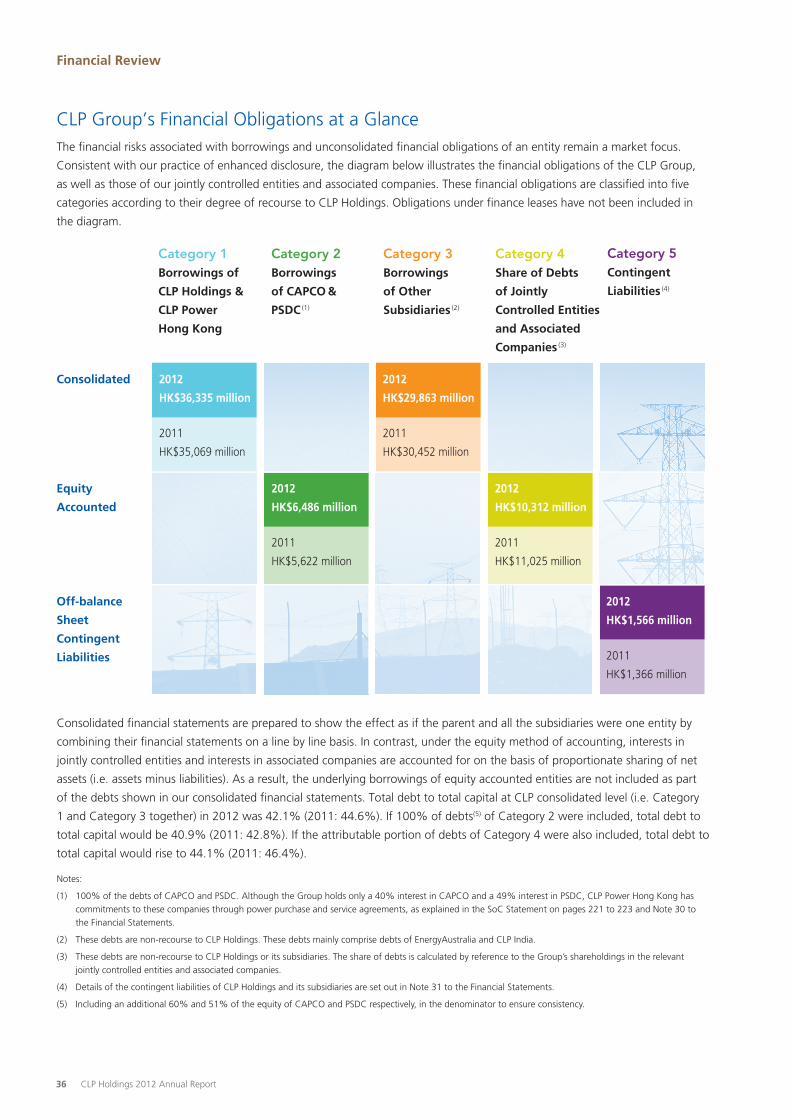
CLP Group’s Financial Obligations at a GlanceThe financial risks associated with borrowings and unconsolidated financial obligations of an entity remain a market focus.
Consistent with our practice of enhanced disclosure, the diagram below illustrates the financial obligations of the CLP Group,
as well as those of our jointly controlled entities and associated companies. These financial obligations are classified into five
categories according to their degree of recourse to CLP Holdings. Obligations under finance leases have not been included in
the diagram.
Consolidated financial statements are prepared to show the effect as if the parent and all the subsidiaries were one entity by
combining their financial statements on a line by line basis. In contrast, under the equity method of accounting, interests in
jointly controlled entities and interests in associated companies are accounted for on the basis of proportionate sharing of net
assets (i.e. assets minus liabilities). As a result, the underlying borrowings of equity accounted entities are not included as part
of the debts shown in our consolidated financial statements. Total debt to total capital at CLP consolidated level (i.e. Category
1 and Category 3 together) in 2012 was 42.1% (2011: 44.6%). If 100% of debts(5) of Category 2 were included, total debt to
total capital would be 40.9% (2011: 42.8%). If the attributable portion of debts of Category 4 were also included, total debt to
total capital would rise to 44.1% (2011: 46.4%).
Notes:
(1) 100% of the debts of CAPCO and PSDC. Although the Group holds only a 40% interest in CAPCO and a 49% interest in PSDC, CLP Power Hong Kong has commitments to these companies through power purchase and service agreements, as explained in the SoC Statement on pages 221 to 223 and Note 30 to the Financial Statements.
(2) These debts are non-recourse to CLP Holdings. These debts mainly comprise debts of EnergyAustralia and CLP India.
(3) These debts are non-recourse to CLP Holdings or its subsidiaries. The share of debts is calculated by reference to the Group’s shareholdings in the relevant jointly controlled entities and associated companies.
(4) Details of the contingent liabilities of CLP Holdings and its subsidiaries are set out in Note 31 to the Financial Statements.
(5) Including an additional 60% and 51% of the equity of CAPCO and PSDC respectively, in the denominator to ensure consistency.
Category 5Contingent
Liabilities (4)
Category 4Share of Debts
of Jointly
Controlled Entities
and Associated
Companies (3)
Category 3Borrowings
of Other
Subsidiaries (2)
Category 2Borrowings
of CAPCO &
PSDC (1)
Category 1Borrowings of
CLP Holdings &
CLP Power
Hong Kong
Off-balance
Sheet
Contingent
Liabilities
Consolidated
Equity
Accounted
2011
HK$35,069 million
2012
HK$36,335 million
2011
HK$5,622 million
2012
HK$6,486 million
2011
HK$30,452 million
2012
HK$29,863 million
2011
HK$11,025 million
2012
HK$10,312 million
2011
HK$1,366 million
2012
HK$1,566 million
36 CLP Holdings 2012 Annual Report