Embed Size (px)
Citation preview


FINANCIAL RATIO ANALYSIS OF
UNITED COMMERCIAL BANK LIMITED
INTERNSHIP REPORT
ON FINANCIAL RATIO ANALYSIS OF
UNITED COMMERCIAL BANK LIMITED
SUBMITTED TO
MR MAHMUDUL HAQ
ASSISTANT PROFESSOR
BRAC BUSINESS SCHOOL
BRAC UNIVERSITY
SUBMITTED BY:
ASHIQUR RAHMAN
ID-08104154
BRAC BUSINESS SCHOOL
DATE OF SUBMISSION
MAY 24, 2012
Page | i
LETTER OF TRANSMITTAL
24th
Mr Mahmudul Haq
May 2012
Assistant Professor
BRAC Business School
BRAC University
Subject: Submission of Internship Report.
Dear Sir,
With due respect, I would like to inform you that, it is a great pleasure for me to submit the
internship report on “Financial Ratio Analysis of United Commercial Bank Limited” as a
requirement for the completion of BBA program. I have tried to make the report a
comprehensive one within the given 3 months of time. I earnestly thank you for your
guidance during the preparation of this report. Any sort of suggestion regarding the report
will be greatly acknowledged and I will be gratified if our report serves its purpose.
While conducting the report, I have gathered lots of knowledge about the performance of
banking operations of commercial consumer lending on first generation banks like United
Commercial Bank.
I therefore, request you to accept this report and give me proper suggestion to work in my
professional life.
Yours faithfully,
………………..
Ashiqur Rahman
ID: 08104154
Page | ii
ACKNOWLEDGEMENT
As a part of my completion of Bachelor of Business Administration program, our department
has assigned me to prepare an internship report. My report is on the topic “Financial Ratio
Analysis of United Commercial Bank Limited” Which is based on my 3 month internship
experience in United Commercial Bank Limited, Kawran Bazaar Branch.
I am greatly indebted to my Faculty Supervisor Mr Mahmudul Haq for giving me the
valuable guidelines, suggestions and information for the report.
For helping me to prepare my report I want to express special thanks to all the employees of
United Commercial Bank, Kawran Bazaar Branch. I am also acknowledging the co-operation
and support that I received from the First Vice President and head of the branch Md. Shamsul
Alam Khan and senior officers. I would also like to thank Mridha Nazmul Ahasan, Executive
Officer, Ms Utpala Karmakar, Junior Officer and also Mrs Ahmed Nur-E-Habiba of Kawran
Bazaar Branch for standing beside me as a friend throughout the period of internship.
I would like to express my deep sense of gratitude to all those who are always a source of
inspiration for me in their involvement, unconditional cooperation and support in the
successful and timely preparation of this report.
Page | iii
EXECUTIVE SUMMERY
This internship report is based on my internship program and financial statements of 2008,
2009 and 2010 of United Commercial Bank Limited. I have done my internship program
under different desks of UCBL Kawran Bazar Branch.
In my internship period, I worked in General Banking, General Advance and Foreign
Exchange departments. It was a great opportunity to experience and gather knowledge
different types of banking operations. My faculty supervisor helped me to choose the topic-
“Ratio Analysis of United Commercial Bank Limited”.
In the new competitive business era, private banking sector is getting more competitive in
Bangladesh. In this sector the most used financial statements are the balance sheet and profit
and loss account where the balance sheet shows the financial position and profit and loss
account shows the net profit or net loss of a bank. Ratio Analysis deals with these statements.
Ratio analysis is the most popular trend to evaluate a bank’s performance over years or with
other companies in an industry. In my report I had to study UCBL’s financial statements for
the last few years then had to analyze and give significant comments regarding the changes in
the financial position. Analysis and interpretation of these financial statements through ratio
analysis has now become an important technique for performance appraisal because the
investors, financial experts, management executives and the bankers are always rely on these
ratios to make important decisions. The management team of any bank, investor and the
government agencies always concern about liquidity ratios and adequacy ratios of a bank
which interprets the efficiency of a bank.
As a part of my B.B.A program, I have spent 12 weeks in UCBL Kawran Bazaar Branch
learning the activities of general banking, general advance and foreign exchange department.
I have analyzed the financial statements of UCBL to find out its ratios by using its past and
current records. After preparing this report I came to know that analysis of financial
statements through ratios helps to overcome the past flaws and make the future decisions and
strategies. Therefore, it is very necessary for every organization whether the company’s size
is to make financial statement and to analyze it by ratios.
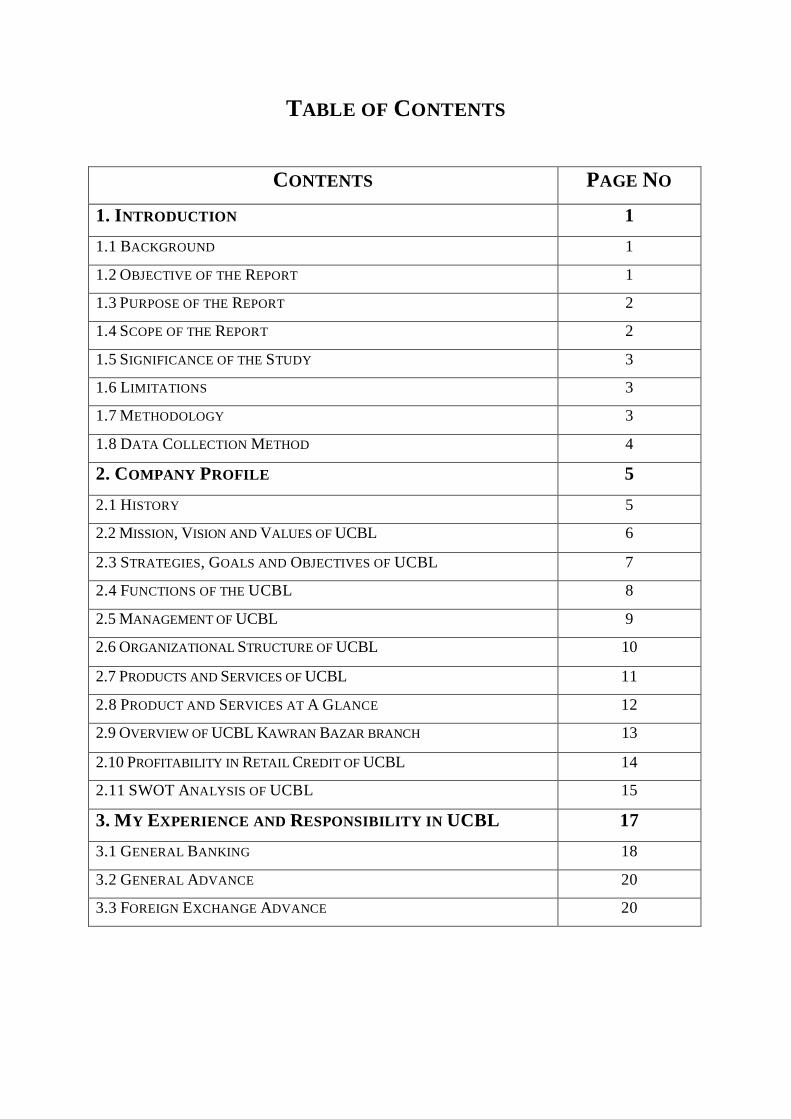
TABLE OF CONTENTS
CONTENTS PAGE NO 1. INTRODUCTION 1 1.1 BACKGROUND 1
1.2 OBJECTIVE OF THE REPORT 1
1.3 PURPOSE OF THE REPORT 2
1.4 SCOPE OF THE REPORT 2
1.5 SIGNIFICANCE OF THE STUDY 3
1.6 LIMITATIONS 3
1.7 METHODOLOGY 3
1.8 DATA COLLECTION METHOD 4
2. COMPANY PROFILE 5 2.1 HISTORY 5
6 2.2 MISSION, VISION AND VALUES OF UCBL
2.3 STRATEGIES, GOALS AND OBJECTIVES OF UCBL 7
2.4 FUNCTIONS OF THE UCBL 8
2.5 MANAGEMENT OF UCBL 9
10 2.6 ORGANIZATIONAL STRUCTURE OF UCBL
2.7 PRODUCTS AND SERVICES OF UCBL 11
2.8 PRODUCT AND SERVICES AT A GLANCE 12
13 2.9 OVERVIEW OF UCBL KAWRAN BAZAR BRANCH
2.10 PROFITABILITY IN RETAIL CREDIT OF UCBL 14
2.11 SWOT ANALYSIS OF UCBL 15
3. MY EXPERIENCE AND RESPONSIBILITY IN UCBL 17 3.1 GENERAL BANKING 18
3.2 GENERAL ADVANCE 20
3.3 FOREIGN EXCHANGE ADVANCE 20
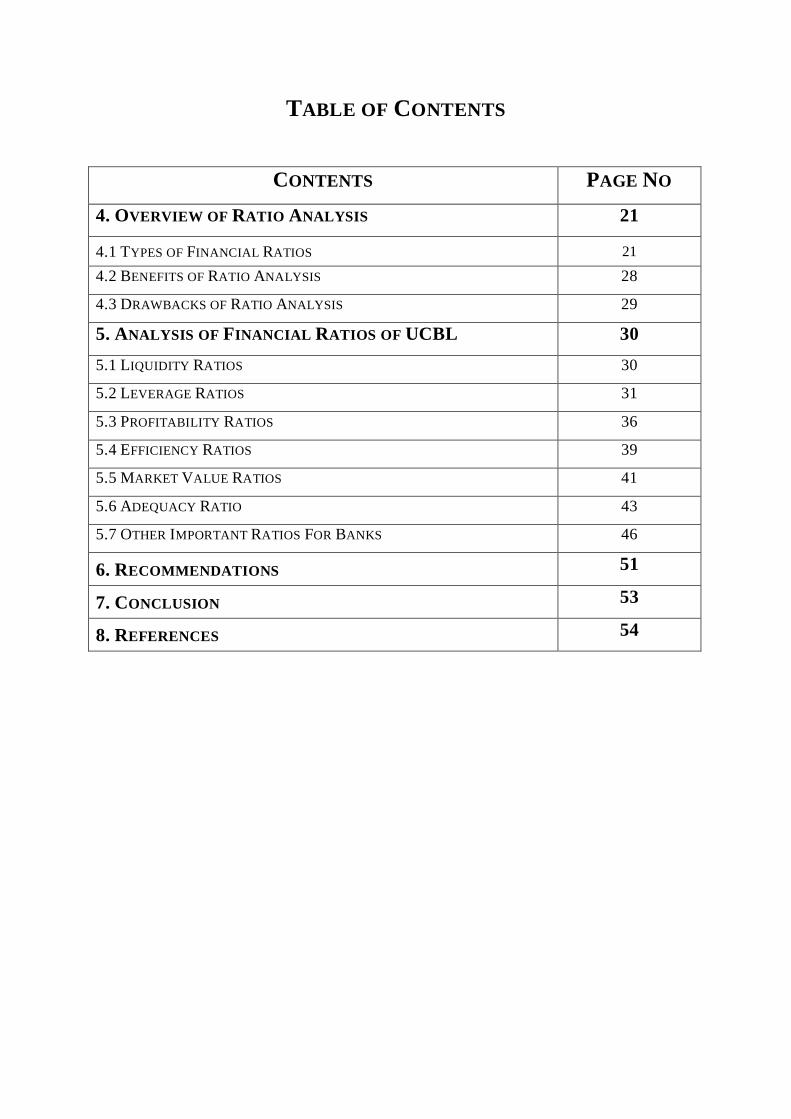
TABLE OF CONTENTS
CONTENTS PAGE NO 4. OVERVIEW OF RATIO ANALYSIS 21
21 4.1 TYPES OF FINANCIAL RATIOS
4.2 BENEFITS OF RATIO ANALYSIS 28
4.3 DRAWBACKS OF RATIO ANALYSIS 29
5. ANALYSIS OF FINANCIAL RATIOS OF UCBL 30 5.1 LIQUIDITY RATIOS 30
5.2 LEVERAGE RATIOS 31
5.3 PROFITABILITY RATIOS 36
5.4 EFFICIENCY RATIOS 39
5.5 MARKET VALUE RATIOS 41
5.6 ADEQUACY RATIO 43
5.7 OTHER IMPORTANT RATIOS FOR BANKS 46
6. RECOMMENDATIONS 51
7. CONCLUSION 53
8. REFERENCES 54
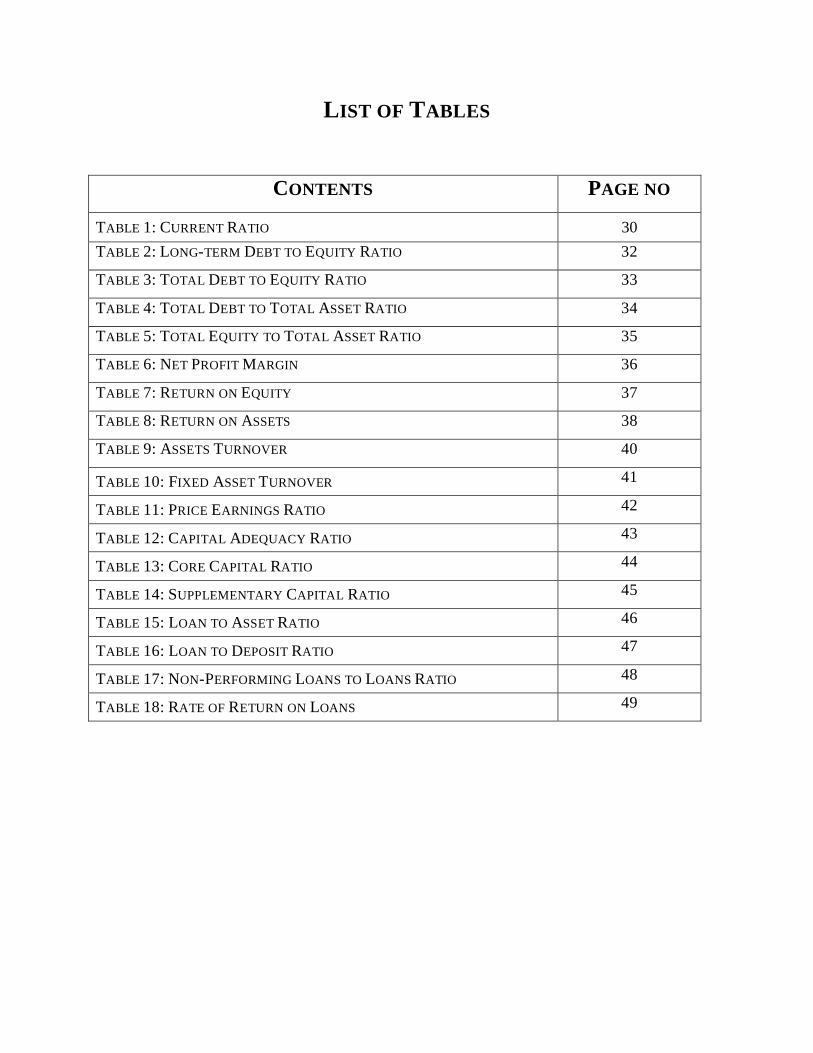
LIST OF TABLES
CONTENTS PAGE NO
30 TABLE 1: CURRENT RATIO
TABLE 2: LONG-TERM DEBT TO EQUITY RATIO 32
TABLE 3: TOTAL DEBT TO EQUITY RATIO 33
TABLE 4: TOTAL DEBT TO TOTAL ASSET RATIO 34
TABLE 5: TOTAL EQUITY TO TOTAL ASSET RATIO 35
TABLE 6: NET PROFIT MARGIN 36
TABLE 7: RETURN ON EQUITY 37
TABLE 8: RETURN ON ASSETS 38
TABLE 9: ASSETS TURNOVER 40
TABLE 10: FIXED ASSET TURNOVER 41
TABLE 11: PRICE EARNINGS RATIO 42
TABLE 12: CAPITAL ADEQUACY RATIO 43
TABLE 13: CORE CAPITAL RATIO 44
TABLE 14: SUPPLEMENTARY CAPITAL RATIO 45
TABLE 15: LOAN TO ASSET RATIO 46
TABLE 16: LOAN TO DEPOSIT RATIO 47
TABLE 17: NON-PERFORMING LOANS TO LOANS RATIO 48
TABLE 18: RATE OF RETURN ON LOANS 49
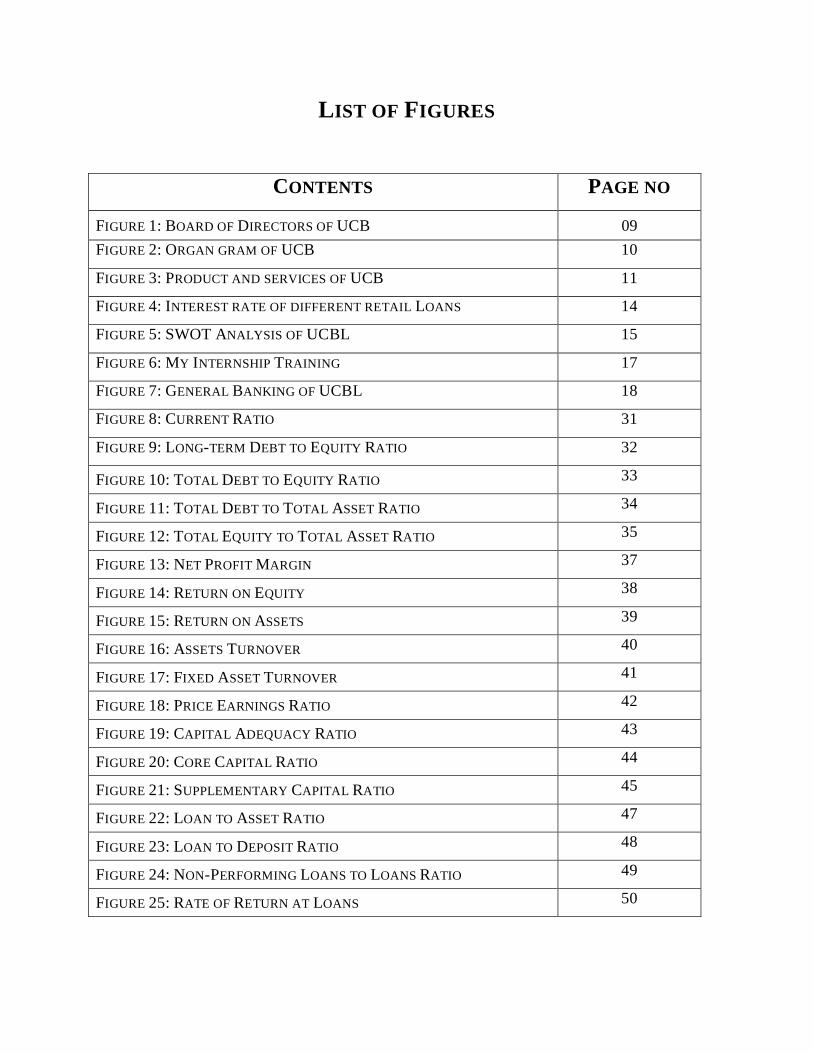
LIST OF FIGURES
CONTENTS PAGE NO
09 FIGURE 1: BOARD OF DIRECTORS OF UCB
FIGURE 2: ORGAN GRAM OF UCB 10
FIGURE 3: PRODUCT AND SERVICES OF UCB 11
FIGURE 4: INTEREST RATE OF DIFFERENT RETAIL LOANS 14
FIGURE 5: SWOT ANALYSIS OF UCBL 15
FIGURE 6: MY INTERNSHIP TRAINING 17
FIGURE 7: GENERAL BANKING OF UCBL 18
FIGURE 8: CURRENT RATIO 31
FIGURE 9: LONG-TERM DEBT TO EQUITY RATIO 32
FIGURE 10: TOTAL DEBT TO EQUITY RATIO 33
FIGURE 11: TOTAL DEBT TO TOTAL ASSET RATIO 34
FIGURE 12: TOTAL EQUITY TO TOTAL ASSET RATIO 35
FIGURE 13: NET PROFIT MARGIN 37
FIGURE 14: RETURN ON EQUITY 38
FIGURE 15: RETURN ON ASSETS 39
FIGURE 16: ASSETS TURNOVER 40
FIGURE 17: FIXED ASSET TURNOVER 41
FIGURE 18: PRICE EARNINGS RATIO 42
FIGURE 19: CAPITAL ADEQUACY RATIO 43
FIGURE 20: CORE CAPITAL RATIO 44
FIGURE 21: SUPPLEMENTARY CAPITAL RATIO 45
FIGURE 22: LOAN TO ASSET RATIO 47
FIGURE 23: LOAN TO DEPOSIT RATIO 48
FIGURE 24: NON-PERFORMING LOANS TO LOANS RATIO 49
FIGURE 25: RATE OF RETURN AT LOANS 50
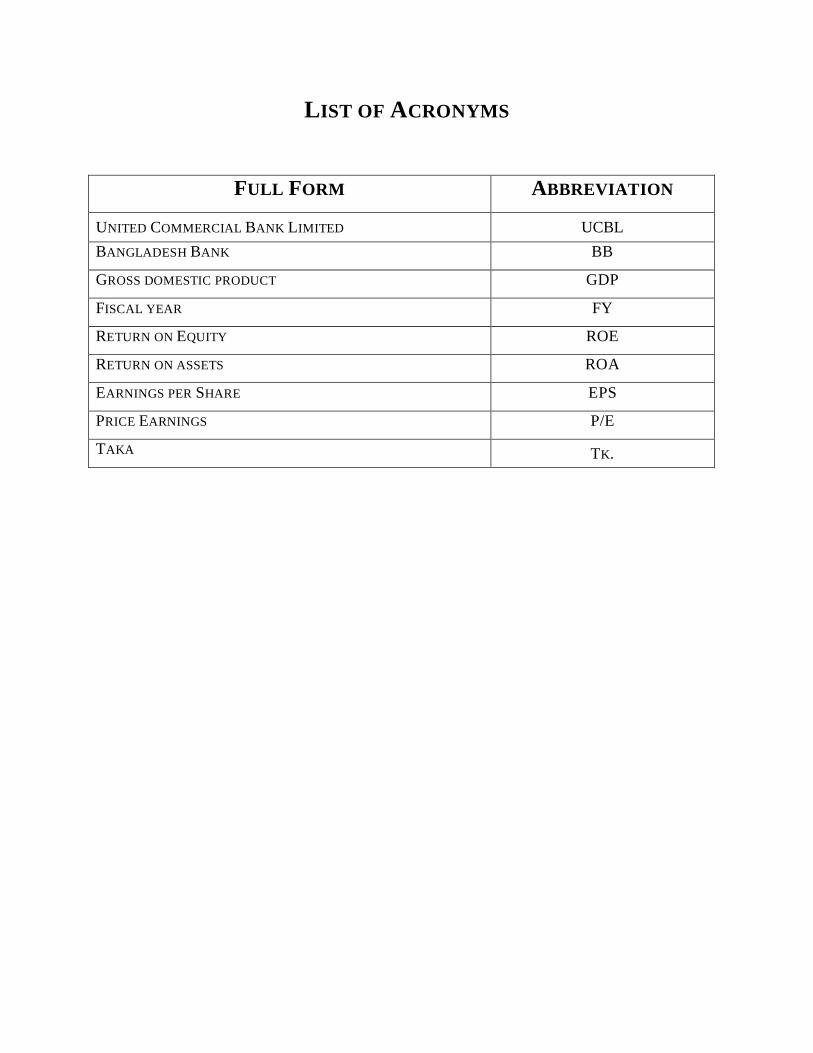
LIST OF ACRONYMS
FULL FORM ABBREVIATION
UCBL UNITED COMMERCIAL BANK LIMITED
BANGLADESH BANK BB
GROSS DOMESTIC PRODUCT GDP
FISCAL YEAR FY
RETURN ON EQUITY ROE
RETURN ON ASSETS ROA
EARNINGS PER SHARE EPS
PRICE EARNINGS P/E
TAKA TK.

Financial Ratio Analysis of United Commercial Bank Limited 1
Banking represents one of the largest and most influential activities of any developed
economy due to the strong linkages virtually existing with any part of the economic system.
Recent developments in retail banking such as the enlargement of services supplied have
often been depicted as technologically driven phenomena. The banks play an important role
in the economy of the country. The contribution of banking sector to the GDP of Bangladesh
is very impressive. In the FY 2008-2009 contribution of financial sectors to the GDP was
8.00%, while the contribution of banking sector was 7.22%. However, this is not a good sign
for the overall economy of Bangladesh but also compare to the whole world this is very
satisfactory outcomes for the Bangladesh economy as the banking sector in rest of the world
was collapsed in the meantime. Therefore, without any question we can say that the banking
sector of the Bangladesh is a progressive economic sector in our country.
1. INTRODUCTION
According to the data of Bangladesh bank, there are 47 different banks in Bangladesh.
Among them, total number of State-owned bank is 04, specialized bank 04, private bank 30,
foreign bank 09. As a result banking is becoming a really prosperous job career. So I have
conducted my 3 months of internship program in United Commercial Bank Kawran Bazar
Branch for gathering practical knowledge about banking sectors. During the period I have
worked with different department of the bank and have learnt the activities of the general
banking general advance and foreign Exchange division etc.
1.1
BACKGROUND
Banking is one of the most important activities in order to ensure the flow of money in the
market. To understand the banking activities, I have selected The United Commercial Bank
to conduct research on its performance and evaluate with several years.
1.2
OBJECTIVE OF THE REPORT
United Commercial Bank Limited (UCBL) deposits has reached a vast amount of Tk. 113071
million balances and Tk. 4732 million as net profit (pre-tax) during 2010 with a 46% growth
rate in deposits and 145% growth rate in net profit (pre-tax) over the year 2009(Annual
Report, 2010). This large amount has been invested in different purpose to provide industry
Financial Ratio Analysis of United Commercial Bank Limited 2
loan, export-import finance, commercial lending, house-building finance and others.
Knowing about the bank’s significant performance over the years my key objective is to
prepare this report.
1.2.1 BROAD OBJECTIVE
The Primary Objective of this report is to “Evaluate the Banking Performance through
Ratios of United Commercial Bank Limited (UCBL) over Years”.
1.2.2 SPECIFIC OBJECTIVE
The report has conducted
To achieve the information regarding the banking environment and its services.
To find out the performance of UCBL over years through ratio analysis.
To estimate the future position of UCBL.
To find out the reason behind UCBL’s enhancements or pitfalls of performance over
years.
1.3
PURPOSE OF THE REPORT
The purpose of this report is to know about the bank properly by analyzing its financial
statements over years.
1.4
SCOPE OF THE REPORT
While preparing the report I had a great opportunity to have real life knowledge about the
overall banking procedure. I had to go to each and every department to collect the necessary
data for my report. I also talked with the employee and clients to know the bank properly.
This report helps me a lot about gaining practical knowledge about the financial sectors
epically the bank.
Financial Ratio Analysis of United Commercial Bank Limited 3
1.5
SIGNIFICANCE OF THE STUDY
This report is prepared to give a concrete idea about the performance and the condition of
UCBL over last three years. I believe that my report will help a lot those who want to get an
overall idea of UCBL as well as its financial statement. Bank management also can be using
the information of my observation for their managerial decision if needed.
1.6
LIMITATIONS
During preparing my report I have to face some problems regarding collecting proper
information which are.
As the duration of the internship program is three months and the process of this
program is job rotation, so I didn’t get sufficient time in each department to
understand their activities.
This report contains many confidential information which was difficult to collect and
disclosure of different important information were not possible due to bank’s safety.
Gathering information about the banking performance was very difficult. That is why
I have to follow more on secondary data like annual report, web sites and some of
banking documents.
Banking sector is a very vast sector where I have a little knowledge about it which
limits my report.
1.7
METHODOLOGY
For this report all data and information are collected from primary and secondary sources.
Primary sources of data are collected through
• Conducted face to face interview
• General discussion with officers
Financial Ratio Analysis of United Commercial Bank Limited 4
Secondary sources of data are collected through
• Websites
• Articles
• UCBL’s Annual Report 2010, 2009 and 2008
• Many Research Report on ratio analysis
1.8
DATA COLLECTION METHOD
This report has been prepared on the basis of experience gathered during the period of
internship form 01th February to 30th April. Within this period I visited three departments
namely General Banking, General Advance and Foreign Exchange departments. I have
collected data and necessary information by practically working in the bank and by
interviewing officials of United Commercial Bank Ltd. These can be treated as primary data.
I also collect data from the annual reports, browsing different websites in relative subject.
Finally, I will come up with my recommendations and conclusions.

Financial Ratio Analysis of United Commercial Bank Limited 5
Sponsored by some dynamic and reputed entrepreneurs and eminent industrialists of the
country and also participated by the Government, UCBL started its operation in mid-1983
and has since been able to establish one of the largest networks of 119 branches among the
first generation banks in the private sector. With its firm commitment to the economic
development of the country, the bank has already made a distinct mark in the realm of private
sector banking through personalized service, innovative practices, dynamic approach and
efficient Management. The Bank, aiming to play a leading role in the economic activities of
the country, is firmly engaged in the development of trade, commerce and industry thorough
a creative credit policy.
2. COMPANY PROFILE
2.1 H
Some leading personalities from industry and business of the country got together in early
eighties of the last century to build up a commercial bank. The result was one of the first
generation private sector banks of the country. Thus the United commercial Bank Limited
(UCBL) came into reality and government was kind enough to participate as a shareholder of
it. UCBL started operating as a commercial bank in 1983. UCBL is committed for sustainable
development of the country. Visionary policy makers along with a dynamic Management
team are leading UCBL to its goal. It has created a clear difference from the competitors with
its fast, friendly and personalized services to its clients. Modern, world class banking is made
available here in Bangladesh by UCBL.
ISTORY
In its journey of almost 30 years United Commercial Bank Ltd. Has create a strong customer
base of around 0.40 million clients. The customer base of UCBL is going high rapidly.
Peoples are influencing to work with UCBL due its modern services and customer values.
Within a long journey of almost 30 years UCBL can able to setup it as an attractive brand in
the Banking sector of Bangladesh. That is why the Bank has already established its network
throughout the six Divisions in Bangladesh. Not only that, still the Bank is establishing its
new branches allover between several locations in Bangladesh due to its customer demands.
Financial Ratio Analysis of United Commercial Bank Limited 6
2.2 MISSION, VISION AND VALUES OF UNITED COMMERCIAL BANK
LIMITED
The effort of United Commercial Bank Limited are focused on delivery of quality service in
all areas of banking activities with the aim to add increased value to shareholders’ investment
and offer highest possible benefits to the customers. There must have the mission as well as
vision what should back every efforts of the organization as it is said, a mission without any
vision is a day dream and a vision without a mission is a nightmare.
To offer financial solutions that create manage and increase our client’s wealth while
improving the quality of life on the communities they serve.
2.2.1 MISSION OF UNITED COMMERCIAL BANK LIMITED
To be the bank of first choice through maximizing value for their clients, shareholders and
employees and contributing to the national economy with social commitment.
2.2.2 VISION OF UNITED COMMERCIAL BANK LIMITED
We put our customers first
2.2.3 CORE VALUES OF UNITED COMMERCIAL BANK LIMITED
We emphasize on professional ethics
We maintain quality at all levels
We believe in being a responsible corporate citizen
We say what we believe in
We foster participative management
Financial Ratio Analysis of United Commercial Bank Limited 7
2.3 STRATEGIES, GOALS AND OBJECTIVES OF UNITED
COMMERCIAL BANK LIMITED
Utilize all available resources to develop various plan and polices
2.3.1 STRATEGIES OF UNITED COMMERCIAL BANK LIMITED
Procedures in each of the objective and goal areas
Synchronized and steady growth of the bank
Implement plants, poleis and procedures
Utilize term of professional employees
Search for a total customized solution for the purpose of full automation step
Develop a plan for offering better customer services
2.3.2 GOALS OF UNITED COMMERCIAL BANK LIMITED
Develop a realistic deposit mobilization plan
Develop appropriate ending risk assessment system
Develop capital plan
Develop a system to make good advance
Develop appropriate management structure, system, procedures and approaches
Develop scientific MIS to monitor bank’s activities
Ensure 100% recovery of all advances
2.3.3 BUSINESS OBJECTIVES OF UNITED COMMERCIAL BANK LIMITED
Ensure a satisfied work force
Make sound loan and investment
Build up a low cost fund base
Meet capital adequacy recruitment at all the time
Focus on fee based income
Install MIS to monitor banks activities
Adopt an appropriate management technology
Financial Ratio Analysis of United Commercial Bank Limited 8
The main task of UCBL is to accept deposits from various customers and institutions through
various accounts.
2.4 FUNCTIONS OF THE UCBL
Provide loans on easy terms and conditions.
The bank invests its funds into profitable sector.
It transfers money through Demand Draft (DD), Pay Order (PO), and Telegraphic
Transfer (TT) etc.
It assists in the foreign exchange by issuing letter of credit.
UCBL insures the securities of valuable documents of clients
Financial Ratio Analysis of United Commercial Bank Limited 9
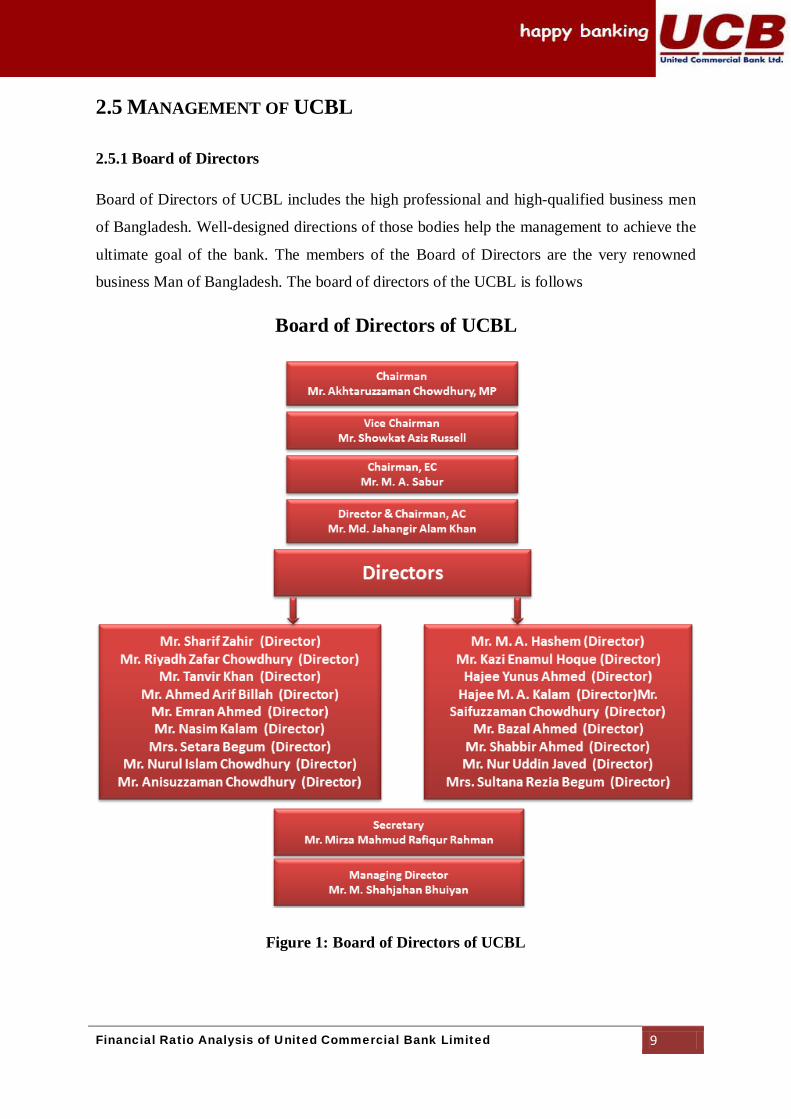
2.5.1 Board of Directors
2.5 MANAGEMENT OF UCBL
Board of Directors of UCBL includes the high professional and high-qualified business men
of Bangladesh. Well-designed directions of those bodies help the management to achieve the
ultimate goal of the bank. The members of the Board of Directors are the very renowned
business Man of Bangladesh. The board of directors of the UCBL is follows
Board of Directors of UCBL
Figure 1: Board of Directors of UCBL
Financial Ratio Analysis of United Commercial Bank Limited 10
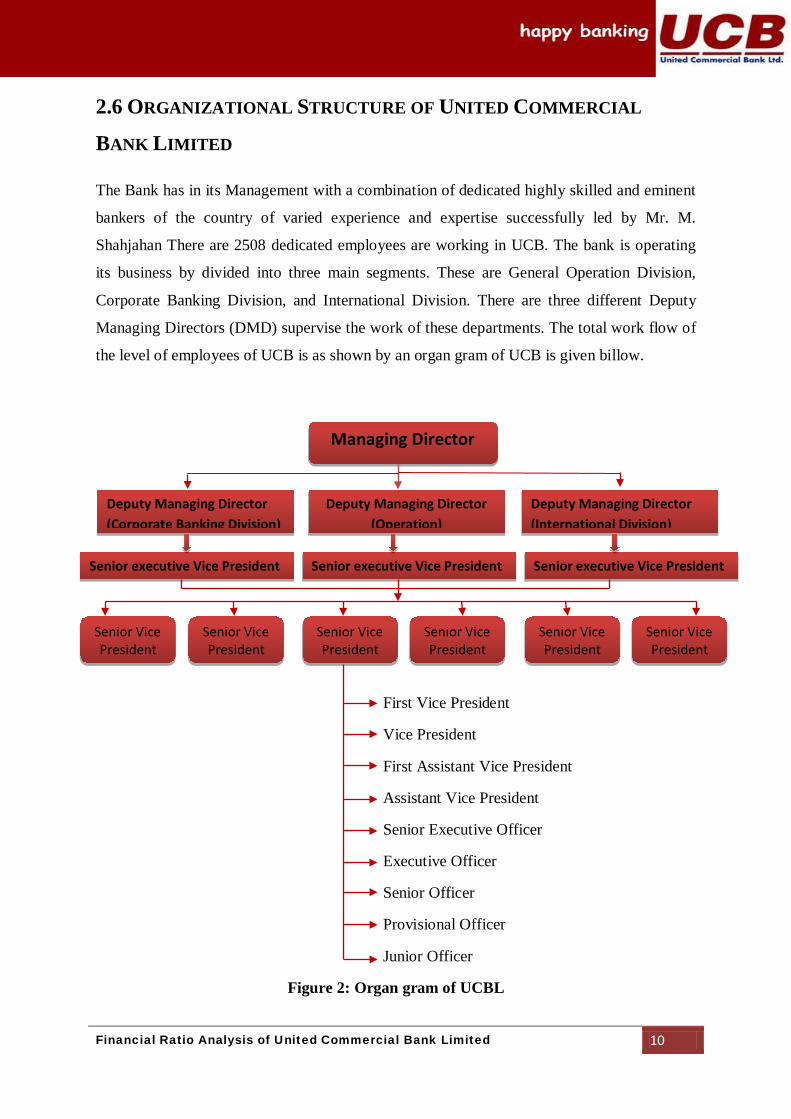
The Bank has in its Management with a combination of dedicated highly skilled and eminent
bankers of the country of varied experience and expertise successfully led by Mr. M.
Shahjahan There are 2508 dedicated employees are working in UCB. The bank is operating
its business by divided into three main segments. These are General Operation Division,
Corporate Banking Division, and International Division. There are three different Deputy
Managing Directors (DMD) supervise the work of these departments. The total work flow of
the level of employees of UCB is as shown by an organ gram of UCB is given billow.
2.6 ORGANIZATIONAL STRUCTURE OF UNITED COMMERCIAL
BANK LIMITED
First Vice President
Vice President
First Assistant Vice President
Assistant Vice President
Senior Executive Officer
Executive Officer
Senior Officer
Provisional Officer
Junior Officer
Figure 2: Organ gram of UCBL
Managing Director
Deputy Managing Director (Operation)
Deputy Managing Director (Corporate Banking Division)
Deputy Managing Director (International Division)
Senior executive Vice President
Senior executive Vice President Senior executive Vice President
Senior Vice President
Senior Vice President
Senior Vice President
Senior Vice President
Senior Vice President
Senior Vice President
Financial Ratio Analysis of United Commercial Bank Limited 11
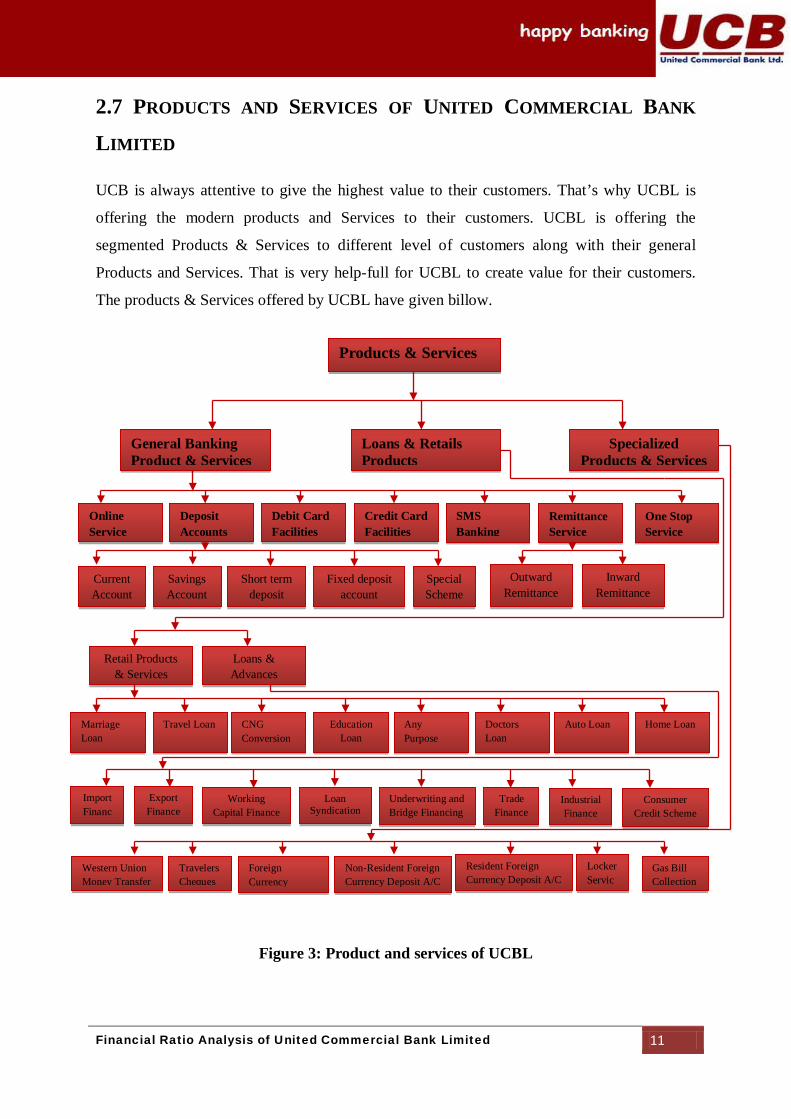
UCB is always attentive to give the highest value to their customers. That’s why UCBL is
offering the modern products and Services to their customers. UCBL is offering the
segmented Products & Services to different level of customers along with their general
Products and Services. That is very help-full for UCBL to create value for their customers.
The products & Services offered by UCBL have given billow.
2.7 PRODUCTS AND SERVICES OF UNITED COMMERCIAL BANK
LIMITED
Figure 3: Product and services of UCBL
Current Account
Savings Account
Short term deposit
Fixed deposit account
Special Scheme
Outward Remittance
Deposit Accounts
Online Service
Credit Card Facilities
Debit Card Facilities
Remittance Service
SMS Banking
One Stop Service
Inward Remittance
Loans & Advances
Retail Products & Services
Home Loan Auto Loan Doctors Loan
CNG Conversion
Any Purpose
Education Loan
Travel Loan Marriage Loan
Import Financ
Export Finance
Working Capital Finance
Loan Syndication
Underwriting and Bridge Financing
Trade Finance
Industrial Finance
Consumer Credit Scheme
Western Union Money Transfer
Travelers Cheques
Foreign Currency
Non-Resident Foreign Currency Deposit A/C
Resident Foreign Currency Deposit A/C
Locker Servic
Gas Bill Collection
General Banking Product & Services
Loans & Retails Products
Specialized Products & Services
Products & Services
Financial Ratio Analysis of United Commercial Bank Limited 12
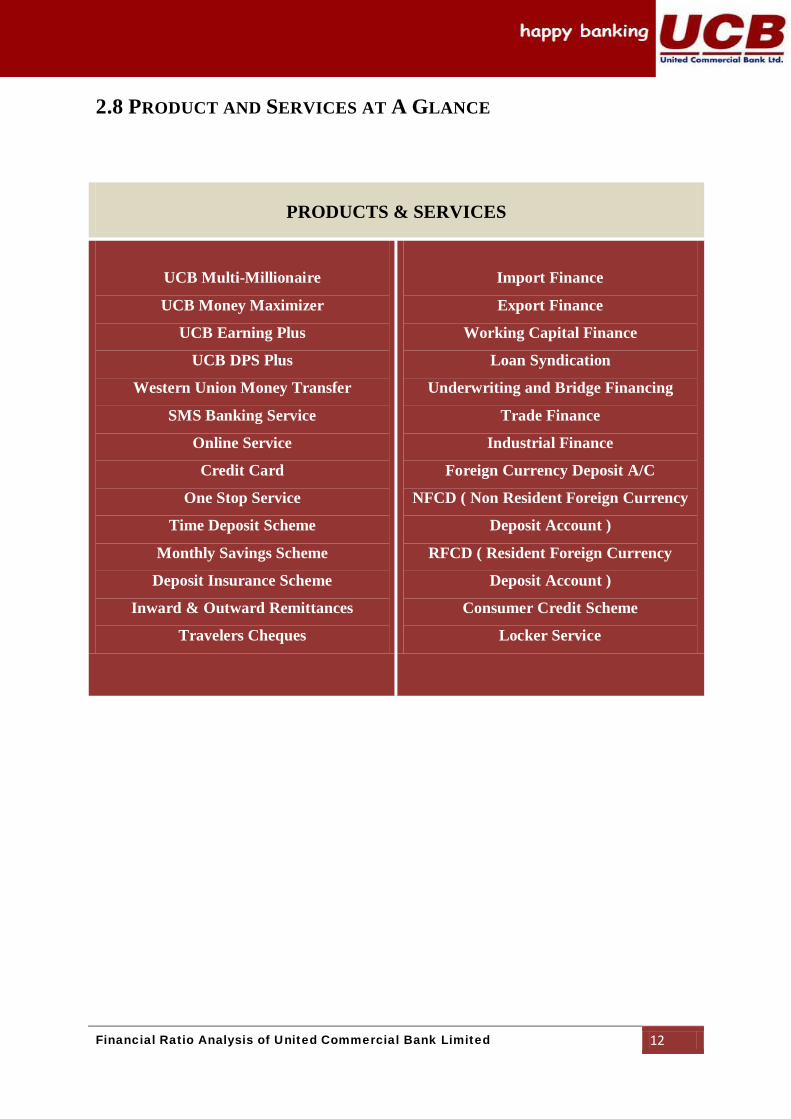
2.8 PRODUCT AND SERVICES AT A GLANCE
PRODUCTS & SERVICES
UCB Multi-Millionaire
UCB Money Maximizer
UCB Earning Plus
UCB DPS Plus
Western Union Money Transfer
SMS Banking Service
Online Service
Credit Card
One Stop Service
Time Deposit Scheme
Monthly Savings Scheme
Deposit Insurance Scheme
Inward & Outward Remittances
Travelers Cheques
Import Finance
Export Finance
Working Capital Finance
Loan Syndication
Underwriting and Bridge Financing
Trade Finance
Industrial Finance
Foreign Currency Deposit A/C
NFCD ( Non Resident Foreign Currency
Deposit Account )
RFCD ( Resident Foreign Currency
Deposit Account )
Consumer Credit Scheme
Locker Service
Financial Ratio Analysis of United Commercial Bank Limited 13
United Commercial Bank Limited Starts it Journey in the Kawran Bazar in 1987 at Titas Gas
Bhaban in Kawran Bazar. United Commercial Bank Ltd. Kawran Bazar was the 15thBranch
of UCB. The bank was the first private commercial bank in that region. From the very
beginning of the Branch, the bank is providing its superior modern services to its clients very
effectively and efficiently. As the Kawarn bazaar branch of UCBL is the in the Kawran
bazaar area that’s why the bank already capture a large customer base. Significant amount of
overall profit of the UCBL Kawran bazar branch is coming from Loans & Advances giving
to the local businesspersons. UCBL, Kawran bazar branch has some loyal customers, so for
the bank is operating activities much more efficiently comparative to other branch of UCBL.
Among the loyal client of the UCBL Kawran bazar, most of them are involved with
Corporate Business, another significant portion of customers are involve with retail business
of fish and vegetables. Besides those others, most valuable customers of the bank are doing
cloth business. Besides that, the bank has some corporate client like The Titas Gas
Transmission & Distribution Company, Mass co Garments Industry etc. Among them Titas
Gas has their mother account with UCBLKBZ, but the most significant amount of customers
is the local general peoples like the Service Providers, and the general peoples. Here one
thing is mention that though the bank is earning a significant portion of its total profit from
the Businessperson but the main source of the bank’s deposits are the foreign remittance.
2.9 OVERVIEW OF UNITED COMMERCIAL BANK LIMITED KAWRAN
BAZAR BRANCH
Financial Ratio Analysis of United Commercial Bank Limited 14
Profitability of a bank is mainly depends on the loans of that bank. More specifically, how
efficiently the banks are utilizing their assets in another term the loans. Banks are not only
always looking for their profits but also need to careful about the risk of those loans. Their
Kawran Bazar branch is very much successful from that perspective. The financial statement
of UCBL Kawran Bazar branch indicate that their provisions for bad debts in this year is (as
of 30 September; 2009) Tk. 184924.62. Therefore, this amount is satisfactory as of the
consideration of the branch location and Loans volume. Now before going to the details
about the profitability of the Retail credit facility of the UCBL Kawran Bazar branch; I would
like to discuss about the credit portfolio of the UCBL.
2.10 PROFITABILITY IN RETAIL CREDIT OF UNITED COMMERCIAL
BANK LIMITED
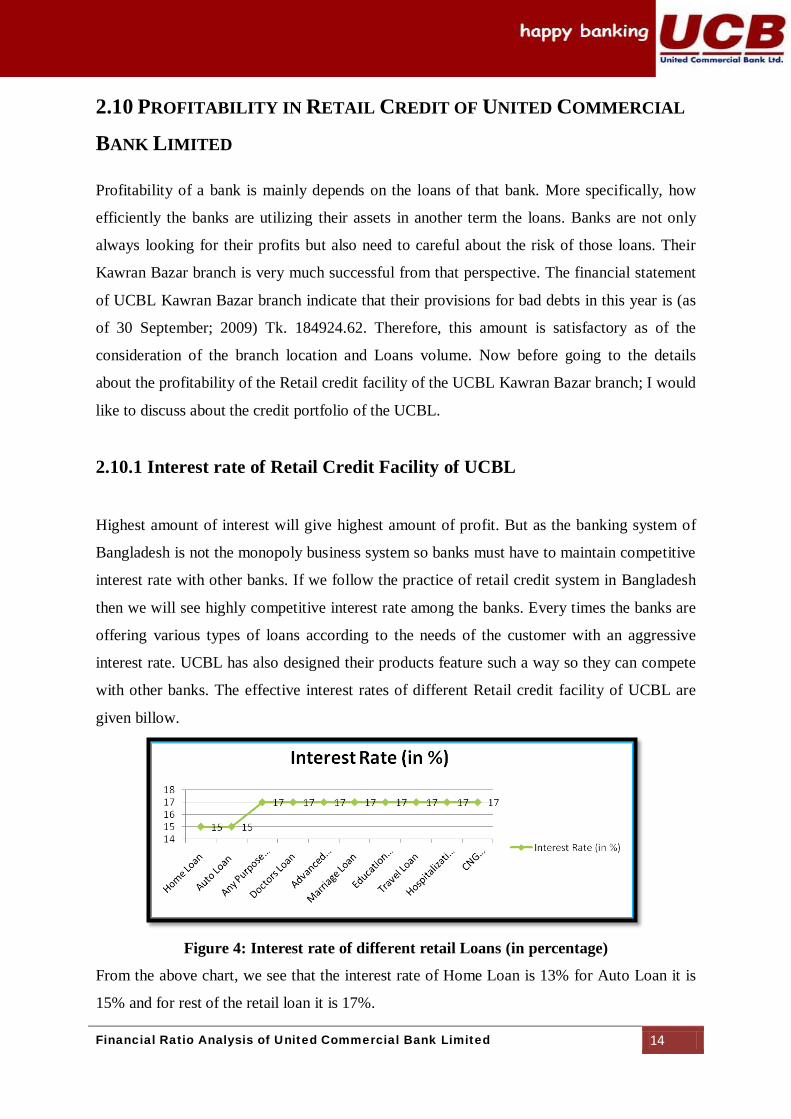
2.10.1 Interest rate of Retail Credit Facility of UCBL
Highest amount of interest will give highest amount of profit. But as the banking system of
Bangladesh is not the monopoly business system so banks must have to maintain competitive
interest rate with other banks. If we follow the practice of retail credit system in Bangladesh
then we will see highly competitive interest rate among the banks. Every times the banks are
offering various types of loans according to the needs of the customer with an aggressive
interest rate. UCBL has also designed their products feature such a way so they can compete
with other banks. The effective interest rates of different Retail credit facility of UCBL are
given billow.
Figure 4: Interest rate of different retail Loans (in percentage)
From the above chart, we see that the interest rate of Home Loan is 13% for Auto Loan it is
15% and for rest of the retail loan it is 17%.
Financial Ratio Analysis of United Commercial Bank Limited 15
SWOT analysis is a strategic planning method used to evaluate the strengths, weaknesses,
opportunities, and Threats involved in a business venture. In banking sectors it is important to
identify the internal and external factors that are favorable and unfavorable to achieve its
objectives. From the SWOT analysis we can figure out ongoing scenario of the bank. So to
have a better view of the present banking practice of UCBL, the SOWT analysis of UCBL is
given below
2.11 SWOT ANALYSIS OF UCBL
Figure 5: SWOT Analysis of UCBL
It is an internal factor. It deals with the organizations own strength. UCBL’s strengths are
2.11.1 STRENGTH
Usage of faster pc bank software which is PC BANK 2000
Efficient administration
Corporation with each other
Fewer default loans.
Membership with SWIFT
Good banker-customer relationship
Energetic as well as smart work force
Strength
Weakness
Opportunities
Threats
SWOT Analysis
Financial Ratio Analysis of United Commercial Bank Limited 16
Well-furnished and air-conditioned bank
Not engage in unfair business practice
Weakness is also an internal factor of SWOT analysis. UCBL’s weaknesses are
2.11.2 WEAKNESS
Existing manual vouchers
Limited consumer credit scheme
Enhance of new private banks
Lack of training facility
Lack of promotional activities
Officers in the junior level are not highly qualified
Opportunities are external factors which indicate the industry’s advantages available for the
companies.
2.11.3 OPPORTUNITIES
Huge business area
Introducing different debit and credit card
Industry’s positive growth
Introducing any branch banking through online
Flexible credit schemes
Reliably to local public
Threats are external factors of SWOT analysis. The threats for UCBL are
2.11.4 THREATS
Different classic services of foreign banks
Better developed card division of other private banks
Uses of modern technologies by the rival banks
Political unrest and government restricted banking strategies The number of rivalry is too high into the banking industry.

Financial Ratio Analysis of United Commercial Bank Limited 17
3. MY EXPERIENCE AND RESPONSIBILITY IN UCBL
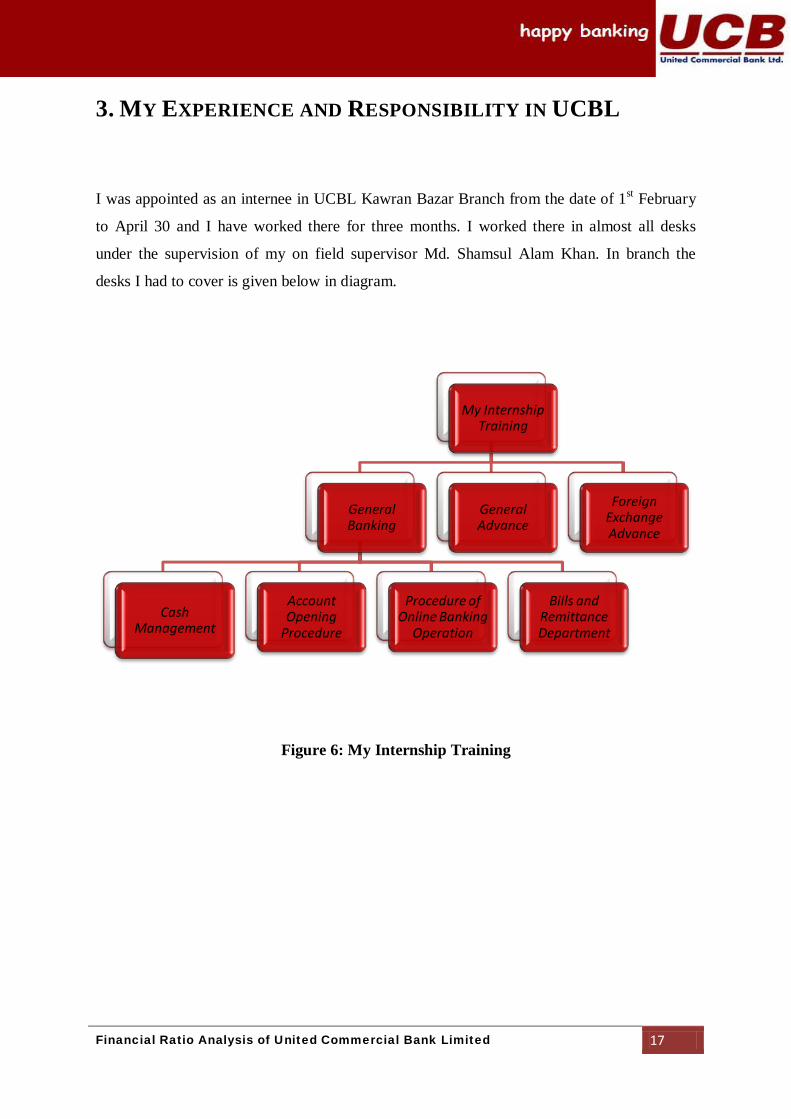
I was appointed as an internee in UCBL Kawran Bazar Branch from the date of 1st
February
to April 30 and I have worked there for three months. I worked there in almost all desks
under the supervision of my on field supervisor Md. Shamsul Alam Khan. In branch the
desks I had to cover is given below in diagram.
Figure 6: My Internship Training
My Internship Training
General Banking
Cash Management
Account Opening
Procedure
Procedure of Online Banking
Operation
Bills and Remittance Department
General Advance
Foreign Exchange Advance
Financial Ratio Analysis of United Commercial Bank Limited 18
To work in a branch of UCBL I have enriched my knowledge through relating my theoretical
knowledge with practical observations. The responsibilities and experience that I have
gathered by working in different departments are given below.
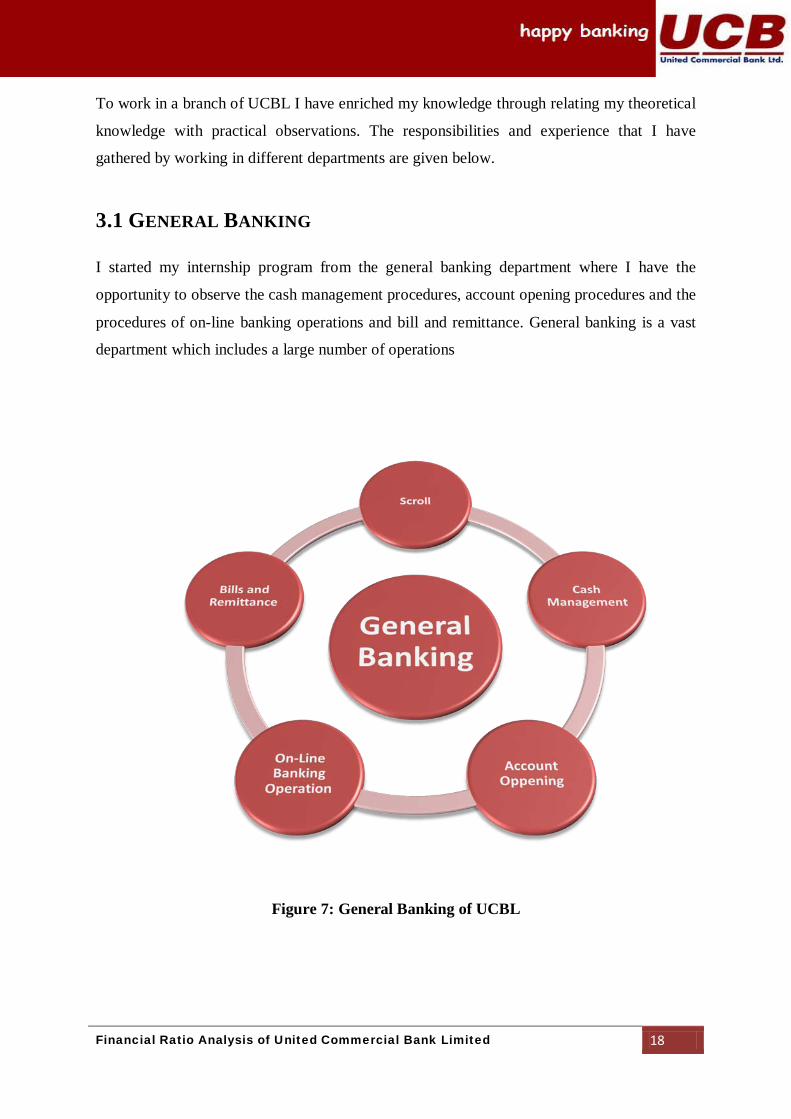
I started my internship program from the general banking department where I have the
opportunity to observe the cash management procedures, account opening procedures and the
procedures of on-line banking operations and bill and remittance. General banking is a vast
department which includes a large number of operations
3.1 GENERAL BANKING
Figure 7: General Banking of UCBL
Financial Ratio Analysis of United Commercial Bank Limited 19
Scroll is a process to record the received transactions in daily basis. If any client wants to
deposit money in his or her account, he will have to go to the scroll officer to take a scroll
number. At the beginning period my training my supervisor assigned me here. Here in this
desk I came to know about the types of accounts UCBL offers and the bills and documents
UCBL works with.
3.1.1 SCROLL
Cash management is one of the most important parts of general banking because bank’s main
business is to manage the cash by receiving cash form customers and paying cash to
customers. As it is the most sensitive part of bank, here I have got minimum responsibilities
to do. In this department I got a great opportunity to enrich my knowledge.
3.1.2 CASH MANAGEMENT
Accounting opening is an important part of general banking. As many as accountholder of a
bank indicates how big the organization is. In this desk I learnt the procedure of opening an
account, categories of accounts, issuing cheque books etc.
3.1.3 ACCOUNT OPENING
This department joins the overall banking system of UCBL into one network. To do its
operation through on-line UCBL uses PC BANK 2000 operating system. In this department I
learn how to input different bills of other branch of UCBL and other banks. Moreover, the
process of clearing the chaques through Bangladesh Bank’s Clearing House has been
experienced here.
3.1.4 ON-LINE BANKING OPERATION
Bills and remittance department is the most busy department where bills and remittances are
issued which the most liquid form after cash. In this department I have learnt how to issue the
payment order, demand draft and the collection of DD, outward bill collection (OBC) and
internal bill collection (IBC) etc.
3.1.5 BILLS AND REMITTANCE
Financial Ratio Analysis of United Commercial Bank Limited 20
General advance department is the most complex department of a bank. This department
deals with the loans and advance. In this department I have come to know about the
difference between the advance and loans, the different types of credit and advance, the
procedures of loans, the features of advance and so on.
3.2 GENERAL ADVANCE
Foreign exchange is a department which includes remittance of currency and financing of
export and imports. Foreign exchange department is the most lucrative department for any
commercial bank as well as UCBL. There are a lot of terms to understand the foreign
exchange department properly. The period of my program is short enough to understand the
department properly, so I have experienced the basic terms of this department. Here I came to
know about the indenter, letter of credit (LC) opening procedures, shipment procedures etc.
3.3 FOREIGN EXCHANGE ADVANCE
It was a great experience for me to do my internship program in UCBL because I have
achieved a lot of practical and professional knowledge through it. The office environment is
very pretty and friendly. All employees and my supervisor are very friendly and helpful.
They always help me to enrich my knowledge. UCBL accepted me cordially and treated me
as a member of that branch. I was very lucky to be an internee of UCBL. All in all, I think
this experience will make my future career path more suitable and easy.

Financial Ratio Analysis of United Commercial Bank Limited 21
4. OVERVIEW OF RATIO ANALYSIS
Ratio Analysis is a tool which is used as a way of analyzing the performance of any company
or organization. It is one of the most important technique of financial analysis in which
quantities are converted into ratios for meaningful comparisons with past ratios and ratios of
other firms in the same or different industries. Ratio analysis determines trends and exposes
strengths or weaknesses of a firm.
4.1 TYPES OF FINANCIAL RATIOS
Ratio analysis is done to compare or evaluate the performance over the years. This analysis
mainly deals with some fields those are liquidity ratio, leverage ratio, profitability ratio, and
efficiency ratio and so on.
These ratios are used to measure the short-term solvency of an organization. These ratios
show the ability of the organization to convert quickly its assets into cash to pay its different
types of short-term debts. The higher the ratios the company is more liquid and the lower the
ratios, the less liquid the company is which may experience the company financial distress to
pay its short-term debt.
4.1.1 LIQUIDITY RATIOS
The ratio is considered to observe the liquidity status of an organization. This ratio is
obtained by dividing the total current assets of a company by its total current liabilities. It
expresses the working capital relationship of current assets available to meet the company's
current obligations.
4.1.1.1 CURRENT RATIO
The formula:
Current Ratio = Total Current Assets/ Total Current Liabilities
Financial Ratio Analysis of United Commercial Bank Limited 22
The ratio is also considered to observe the liquidity status of an organization. This ratio is
obtained by dividing the total quick assets of a company by its total current liabilities. This is
an important ratio because sometimes a company may have heavy inventory as part of its
current assets which might be obsolete or slow moving. For that reason eliminating those
inventories from current assets is doing to measure this ratio. The ratio is regarded as an acid
test ratio. It expresses the true working capital relationship which includes accounts
receivables, prepaid and notes receivables available to meet with the company's current
obligations.
4.1.1.2 QUICK RATIO
The formula:
Quick Ratio = Total Quick Assets/ Total Current Liabilities
Quick Assets = Total Current Assets – Inventory
Leverage Ratios are used to measure the extent of the company's financing with debt relative
to equity and its ability to cover interest and other fixed charges. These ratios address the
company's long-term ability to meet its financial leverage. The higher the ratios the more
indebtedness the company owes. This higher results signal the possibility the company will
be unable to earn enough to satisfy its debt obligations.
4.1.2 LEVERAGE RATIOS
In the risk analysis this ratio is a way to determine a company's leverage. The ratio is
calculated by taking the company's long-term debt and dividing it by the total value of its
preferred and common stock. The company who has higher ratio is thought to be more risky
because it has more liabilities and less equity.
4.1.2.1 LONG-TERM DEBT TO EQUITY RATIO
The formula:
Long-term Debt to Equity Ratio = Long-term Debt / Equity
Financial Ratio Analysis of United Commercial Bank Limited 23
This ratio is obtained by dividing the total liability or debt of a company by its total equity.
The ratio measures how the company is leveraging its debt against the capital employed by
its owners. If the liabilities exceed the net worth then in that case the creditors have more
stake than the shareholders.
4.1.2.2 TOTAL DEBT TO EQUITY RATIO
The formula:
Total Debt to Equity Ratio = Total Debt / Equity
The debt to total assets ratio is an indicator of financial leverage. It tells the percentage of
total assets that were financed by its total debt. The debt to total assets ratio is calculated by
dividing a company’s total liabilities by its total assets. The lower the result of this ratio the
better off the company is.
4.1.2.3 TOTAL DEBT TO TOTAL ASSET RATIO
The formula:
Total Debt to Total Asset Ratio = Total Debt / Total Asset
Total Equity to Total Asset ratio used to help to determine how much shareholders would
receive in the event of companywide liquidation. The ratio is expressed as a percentage
which is calculated by dividing total equity by total assets of the company. It represents the
amount of assets on which shareholders have a residual claim.
4.1.2.4 TOTAL EQUITY TO TOTAL ASSET RATIO
The formula:
Total Equity to Total Asset Ratio = Total Equity / Total Asset
Financial Ratio Analysis of United Commercial Bank Limited 24
Profitability Ratios measure the overall earnings performance of a company and its efficiency
in utilizing assets, liabilities and equity.
4.1.3 PROFITABILITY RATIOS
The Profit Margin of a company determines its ability to survive in competition and adverse
conditions like rising costs, falling prices or declining sales in the future. The ratio measures
the percentage of profits earned per taka of sales or net interest income. Thus this ratio is a
measure of efficiency of a company.
4.1.3.1 NET PROFIT MARGIN
The formula:
Net Profit Margin = Net Profit after Taxation / Net interest Income
Return on equity (ROE) is a measure of profitability ratio that calculates how many taka of
profit a company generates with each taka of shareholders' equity. The Return on Equity of a
company measures the ability of the management of the company to generate adequate
returns for the capital invested by the owners of a company.
4.1.3.2 RETURN ON EQUITY (ROE)
The formula:
Return on Equity = Net Profit after Taxation / Equity
The Return on Assets of a company determines its ability to utilize the assets employed in
that company efficiently and effectively to earn a good return. Return on assets measures the
amount of profit that the company generates as a percentage of the value of its total assets. A
company's return on assets (ROA) is calculated as the ratio of its net income in a given period
to the total value of its assets.
4.1.3.3 RETURN ON ASSETS
The formula:
Return on Assets = Net Profit after Taxation / Total Assets
Financial Ratio Analysis of United Commercial Bank Limited 25
Efficiency Ratios demonstrate how efficiently the company uses its assets and how efficiently
the company manages its operations.
4.1.4 EFFICIENCY RATIOS
Asset turnover measures a firm's efficiency at using its assets in generating revenue and the
higher the number of ratio the company is in better position. It also indicates pricing strategy
as the company with low profit margins tends to have high asset turnover and those with high
profit margins have low asset turnover.
4.1.4.1 ASSETS TURNOVER
The formula:
Assets Turnover = Net interest Income / Total Assets
The fixed asset turnover ratio is the ratio of revenue to net fixed assets. A high ratio indicates
that a company is doing an effective job of generating sales with a relatively small amount of
fixed assets. On the other hand if the ratio is declining over time the company has either
overinvested in fixed assets or it needs to issue new products to revive its sales.
4.1.4.2 FIXED ASSET TURNOVER
The formula:
Fixed Asset Turnover = Net interest Income / Fixed Assets
Market Value Ratios are used for value comparison. These ratios relate the market price of
the firm's common stock and the financial statement figures.
4.1.5 MARKET VALUE RATIOS
The price earnings ratio is the price currently paid on the open market for a share of a
company's stock divided by its earnings per share. The price earnings ratio represents those
earnings in which the investment community is willing to pay to its own company's stock. A
very high multiple indicates that investors believe the company's earnings will improve
dramatically while a low multiple indicates the reverse.
4.1.5.1 PRICE EARNINGS RATIO
Financial Ratio Analysis of United Commercial Bank Limited 26
The formula:
Price Earnings Ratio = Stock Price per Share / Earnings per Share (EPS)
The following ratios are used to assess the adequacy of the liquidity of the banks and ensure
the banks have adequate cash flow to meet all obligations in a timely and cost-effective
manner.
4.1.6 ADEQUACY RATIO
Capital Adequacy Ratio is a measure of a bank's capital which is expressed as a percentage of
a bank's risk weighted credit exposures. This ratio is also known as "Capital to Risk
Weighted Assets Ratio (CRAR). This ratio is used to protect depositors and promote the
stability and efficiency of financial systems around the world. Two types of capital are
measured one is tier one capital which can absorb losses without a bank being required to
conclude its trading and another is tier two capital which can absorb losses in the event of a
winding-up and it provides a lesser degree of protection to depositors.
4.1.6.1 CAPITAL ADEQUACY RATIO
Tier I Capital is a term used to describe the capital adequacy of a bank. Tier I capital is the
core capital which includes equity capital and disclosed reserves. Equity capital includes
instruments that can't be redeemed at the option of the holder which includes common equity,
retained earnings, paid-in capital and disclosed capital reserves.
4.1.6.1.1 TIER I CAPITAL
Tier II Capital is a term used to describe the capital adequacy of a bank. Tier II capital is
secondary bank capital that includes items such as undisclosed reserves, general loss reserves,
subordinated term debt, and more.
4.1.6.1.2 TIER II CAPITAL
The formula:
Capital Adequacy Ratio = Capital Base (Tier I + Tier II) / Risk-weighted Assets
Financial Ratio Analysis of United Commercial Bank Limited 27
Core Capital Ratio is a comparison between a banking firm's core equity capital and total
risk-weighted assets. A firm's core equity capital is known as its Tier I capital which is the
measure of a bank's financial strength based on the sum of its equity capital and disclosed
reserves, and sometimes non-redeemable, non-cumulative preferred stock. A firm's risk-
weighted assets include all assets that the firm holds that are systematically weighted for
credit risk. Central banks typically develop the weighting scale for different asset classes,
such as cash and coins, which have zero risk, versus a letter or credit, which carries more
risk.
4.1.6.2 CORE CAPITAL ADEQUACY RATIO
The formula:
Core Capital Adequacy Ratio = Core Capital (Tier- I) / Risk-weighted Assets
Supplementary Capital Ratio is a comparison between a banking firm's supplementary equity
capital and total risk-weighted assets. A firm's supplementary equity capital is known as its
Tier II capital which is the measure of a bank's financial strength based on the sum of its
capital which includes loan loss reserve or undisclosed capital reserves, preferred stocks with
maturity of at least 20 years, certain revaluation reserves and general loan provisions,
subordinated debt with an original maturity of at least 7 years.
4.1.6.3 SUPPLEMENTARY CAPITAL ADEQUACY RATIO
The formula:
Supplementary Capital Adequacy Ratio = Supplementary Capital (Tier- II) / Risk-weighted
Assets
\
Financial Ratio Analysis of United Commercial Bank Limited 28
This ratio analysis gives quick financial information to a financial institution. By giving a
glance anyone will be able to take any decision regarding the financial statement. Therefore
managers, shareholders, creditors etc. all take interest in ratio analysis.
4.2 BENEFITS OF RATIO ANALYSIS
Ratio analysis simplifies the financial statements.
It helps any institution to compare with different companies of different size with
each other into an industry as well as outside of the industry.
It helps in trend analysis which involves comparing a single company over a
period of time and also forecast the future performance.
The liquidity ratio can be helpful in measuring the liquidity position of any
institution and also shows whether an institution will able to meet its obligations
or not.
The profitability ratios help to find out the operation efficiency of any institution
and also whether that institution using the resources wisely or not.
As ratios are easy to understand it becomes easy for a company to communicate
the ratios to those who are interested in the financial performance of the company.
It highlights important information in simple form quickly. Anyone can easily
judge an institution by just looking at few numbers instead of reading the whole
financial statements.
Financial Ratio Analysis of United Commercial Bank Limited 29
Despite usefulness financial ratio analysis has some disadvantages too. Some of the
drawbacks of ratio analysis are
4.3 DRAWBACKS OF RATIO ANALYSIS
Ratio analysis explains relationships between past information while users are
more concerned about current and future information.
Ratio analysis doesn’t consider inflation.
Ratios may give false results because many institutions show more profit and
accounting data to attract the investors or creditors.
Ratio analysis always deals with the numbers. It doesn’t talk about product
quality, customer service, employee morale and so on which are important for
better financial performance.
Ratios are mostly used to compare performance over a long period of time or
against the rivalry performance. To do those ratios enough information may not
available always.
Different institutions operate in different industries each having different
environmental conditions such as regulation, market structure, etc. Such factors
are so significant that a comparison of two institutions from different industries
might be misleading.

Financial Ratio Analysis of United Commercial Bank Limited 30
5. ANALYSIS OF FINANCIAL RATIOS OF UCBL
Ratio analysis is a study of the relationships between financial variables. It is very important
in fundamental analysis which investigates the financial health of any financial institution.
This ratio analysis gives frank financial information in this current business world. By giving
a glance anyone will be able to know what the position that institution is now. Therefore
managers, shareholders, creditors etc. all take interest in ratio analysis. For example using
liquidity ratios managers can use the information if the institution's liquidity is struggling and
they may have to take out short term finance. For this reason to evaluate the performance of
UCBL the ratio analysis has been selected. Here in this report contains the most common
ratios and analyze to evaluate the performance of UCBL over the year 2008, 2009 and 2010.
As UCBL is a financial institution the liquidity ratios are the most important ratios to
evaluate its liquidity to pay its short term debt and deposits. This ratio shows how quick
UCBL is able to pay or convert its assets into cash. To know how liquid the UCBL is current
ratio and quick ratio is analyzed here.
5.1 LIQUIDITY RATIOS
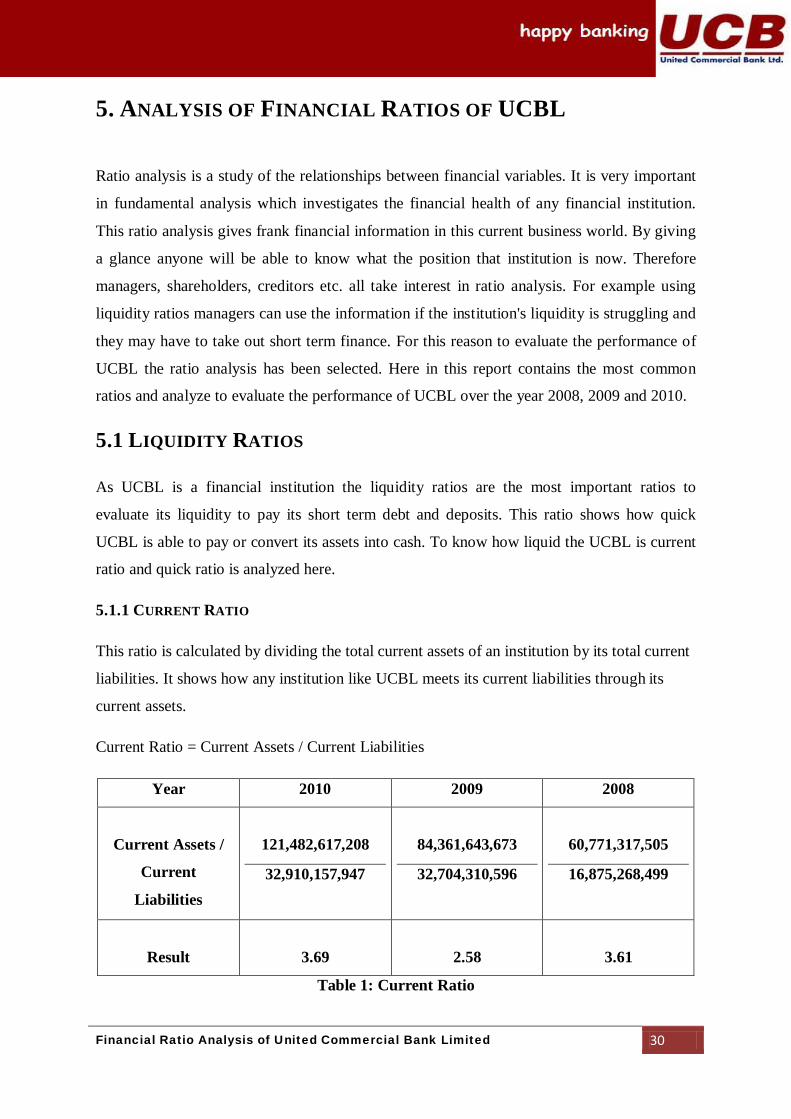
This ratio is calculated by dividing the total current assets of an institution by its total current
liabilities. It shows how any institution like UCBL meets its current liabilities through its
current assets.
5.1.1 CURRENT RATIO
Current Ratio = Current Assets / Current Liabilities
Year 2010 2009 2008
Current Assets /
Current
Liabilities
121,482,617,208
32,910,157,947
84,361,643,673
32,704,310,596
60,771,317,505
16,875,268,499
Result
3.69
2.58
3.61
Table 1: Current Ratio
Financial Ratio Analysis of United Commercial Bank Limited 31
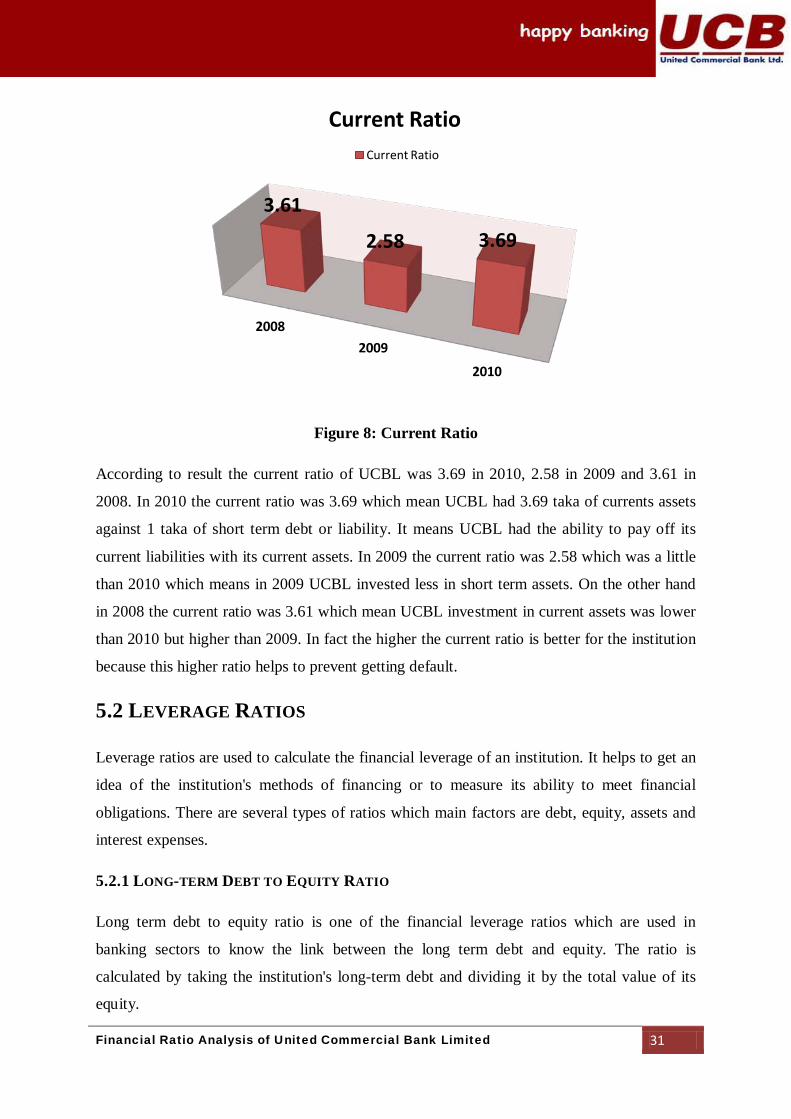
Figure 8: Current Ratio
According to result the current ratio of UCBL was 3.69 in 2010, 2.58 in 2009 and 3.61 in
2008. In 2010 the current ratio was 3.69 which mean UCBL had 3.69 taka of currents assets
against 1 taka of short term debt or liability. It means UCBL had the ability to pay off its
current liabilities with its current assets. In 2009 the current ratio was 2.58 which was a little
than 2010 which means in 2009 UCBL invested less in short term assets. On the other hand
in 2008 the current ratio was 3.61 which mean UCBL investment in current assets was lower
than 2010 but higher than 2009. In fact the higher the current ratio is better for the institution
because this higher ratio helps to prevent getting default.
Leverage ratios are used to calculate the financial leverage of an institution. It helps to get an
idea of the institution's methods of financing or to measure its ability to meet financial
obligations. There are several types of ratios which main factors are debt, equity, assets and
interest expenses.
5.2 LEVERAGE RATIOS
Long term debt to equity ratio is one of the financial leverage ratios which are used in
banking sectors to know the link between the long term debt and equity. The ratio is
calculated by taking the institution's long-term debt and dividing it by the total value of its
equity.
5.2.1 LONG-TERM DEBT TO EQUITY RATIO
2008 2009
2010
3.61
2.58 3.69
Current Ratio Current Ratio
Financial Ratio Analysis of United Commercial Bank Limited 32
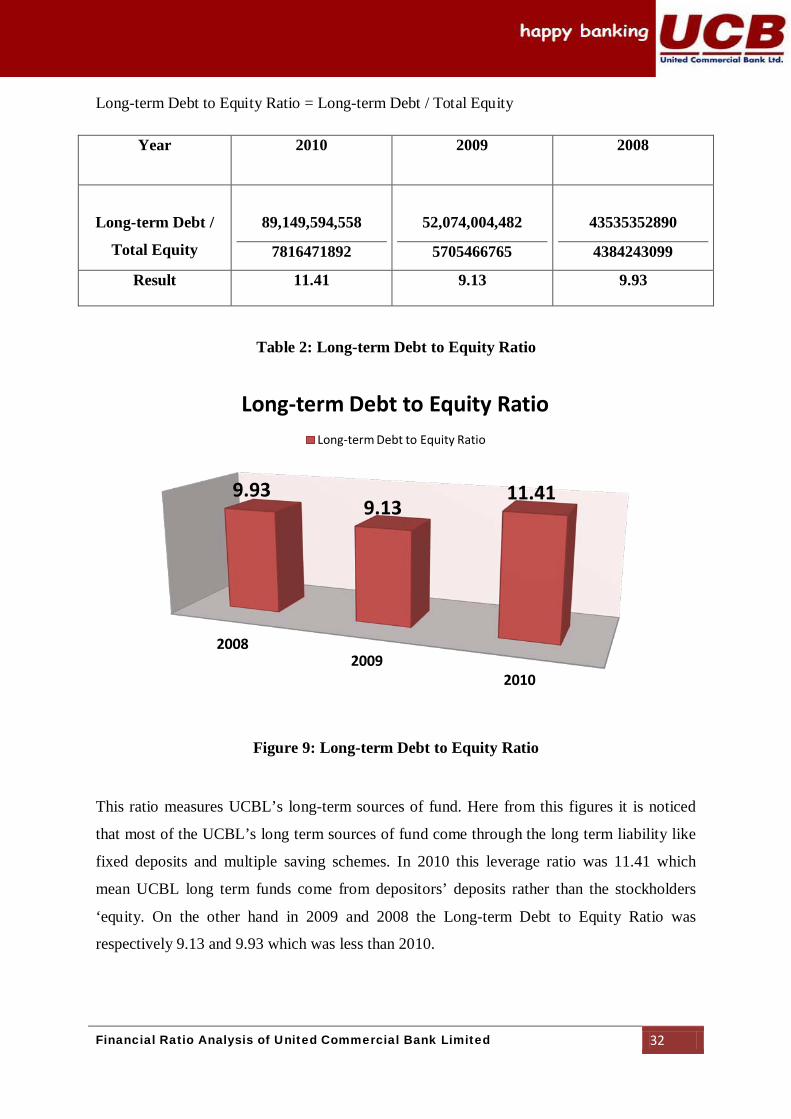
Long-term Debt to Equity Ratio = Long-term Debt / Total Equity
Year 2010 2009 2008
Long-term Debt /
Total Equity
89,149,594,558
7816471892
52,074,004,482
5705466765
43535352890
4384243099
Result 11.41 9.13 9.93
Table 2: Long-term Debt to Equity Ratio
Figure 9: Long-term Debt to Equity Ratio
This ratio measures UCBL’s long-term sources of fund. Here from this figures it is noticed
that most of the UCBL’s long term sources of fund come through the long term liability like
fixed deposits and multiple saving schemes. In 2010 this leverage ratio was 11.41 which
mean UCBL long term funds come from depositors’ deposits rather than the stockholders
‘equity. On the other hand in 2009 and 2008 the Long-term Debt to Equity Ratio was
respectively 9.13 and 9.93 which was less than 2010.
2008 2009
2010
9.93 9.13
11.41
Long-term Debt to Equity Ratio Long-term Debt to Equity Ratio
Financial Ratio Analysis of United Commercial Bank Limited 33
It is one of the banking financial leverage which is calculated by dividing its total liabilities
by stockholders' equity. It mainly indicates the proportion of equity and debt that a bank is
using to finance its assets.
5.2.2 TOTAL DEBT TO EQUITY RATIO
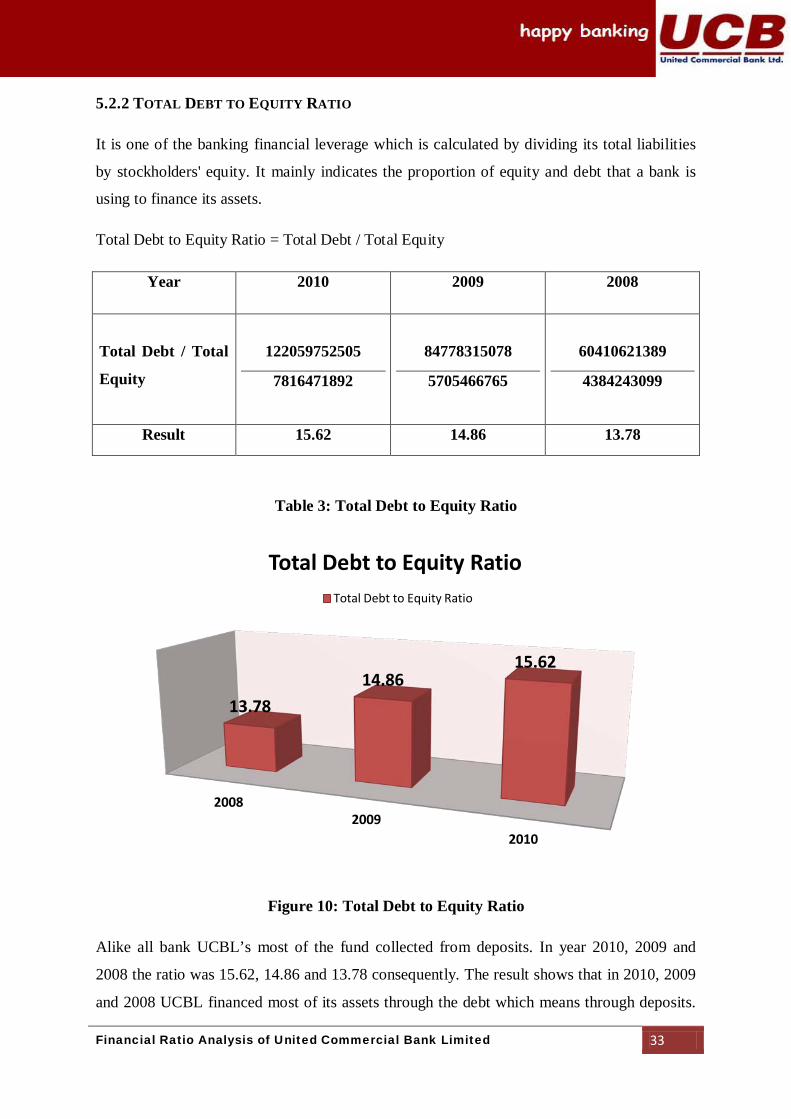
Total Debt to Equity Ratio = Total Debt / Total Equity
Year 2010 2009 2008
Total Debt / Total
Equity
122059752505
7816471892
84778315078
5705466765
60410621389
4384243099
Result 15.62 14.86 13.78
Table 3: Total Debt to Equity Ratio
Figure 10: Total Debt to Equity Ratio
Alike all bank UCBL’s most of the fund collected from deposits. In year 2010, 2009 and
2008 the ratio was 15.62, 14.86 and 13.78 consequently. The result shows that in 2010, 2009
and 2008 UCBL financed most of its assets through the debt which means through deposits.
2008 2009
2010
13.78 14.86
15.62
Total Debt to Equity Ratio Total Debt to Equity Ratio
Financial Ratio Analysis of United Commercial Bank Limited 34
As a result the bank is doing well by increasing its deposits over years like 2010 and 2009.
This higher outcome over years not only increases the risk but also increases the profit.
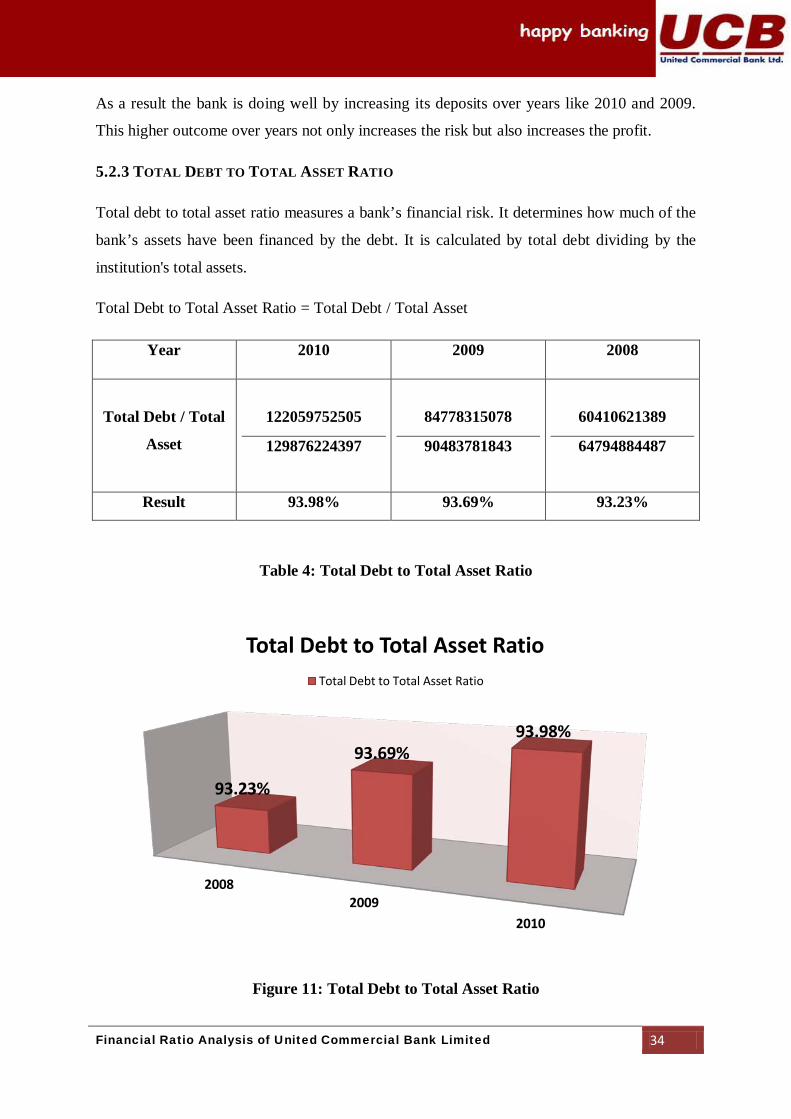
Total debt to total asset ratio measures a bank’s financial risk. It determines how much of the
bank’s assets have been financed by the debt. It is calculated by total debt dividing by the
institution's total assets.
5.2.3 TOTAL DEBT TO TOTAL ASSET RATIO
Total Debt to Total Asset Ratio = Total Debt / Total Asset
Year 2010 2009 2008
Total Debt / Total
Asset
122059752505
129876224397
84778315078
90483781843
60410621389
64794884487
Result 93.98% 93.69% 93.23%
Table 4: Total Debt to Total Asset Ratio
Figure 11: Total Debt to Total Asset Ratio
2008 2009
2010
93.23%
93.69% 93.98%
Total Debt to Total Asset Ratio Total Debt to Total Asset Ratio
Financial Ratio Analysis of United Commercial Bank Limited 35
Almost all of the UCBL’s assets are financed by its debt. It works by taking the deposits from
the general and invest it in different sectors. From the year 2008 to 2010 the ratios were
93.98%, 93.69% and 93.23% which are almost same. The higher ratio may increase more risk
because if UCBL defaults in any investment than the depositors will also default.
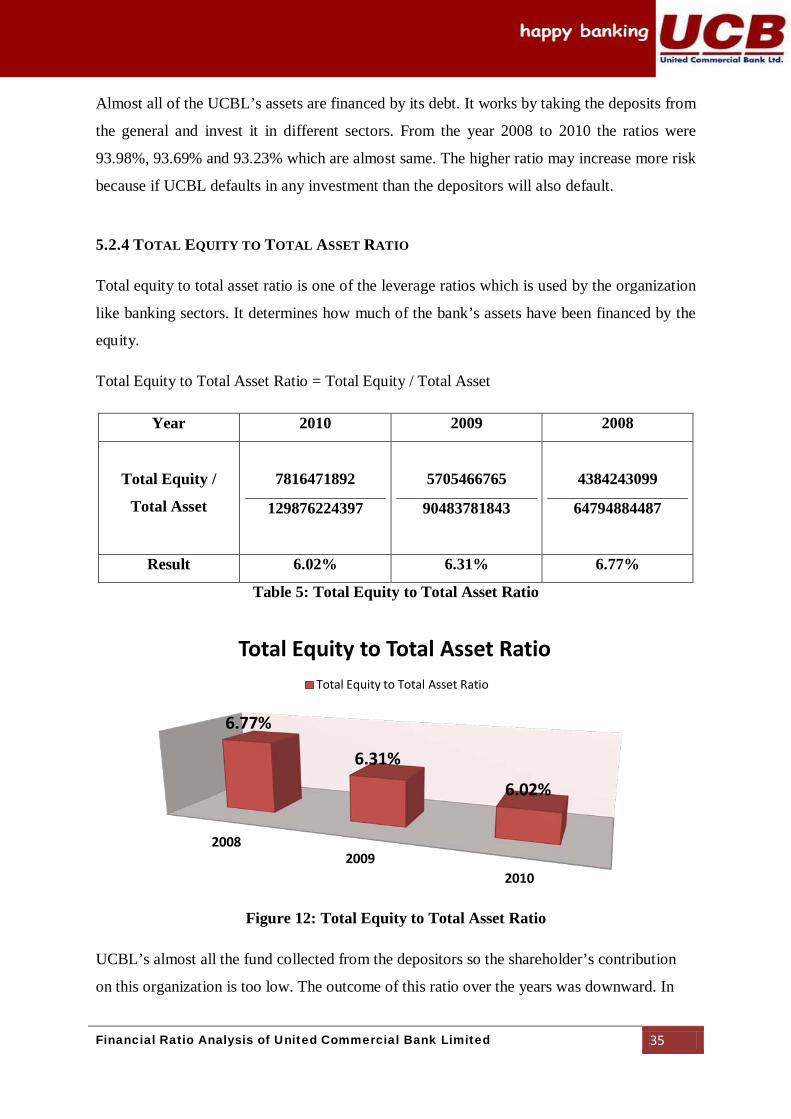
Total equity to total asset ratio is one of the leverage ratios which is used by the organization
like banking sectors. It determines how much of the bank’s assets have been financed by the
equity.
5.2.4 TOTAL EQUITY TO TOTAL ASSET RATIO
Total Equity to Total Asset Ratio = Total Equity / Total Asset
Year 2010 2009 2008
Total Equity /
Total Asset
7816471892
129876224397
5705466765
90483781843
4384243099
64794884487
Result 6.02% 6.31% 6.77%
Table 5: Total Equity to Total Asset Ratio
Figure 12: Total Equity to Total Asset Ratio
UCBL’s almost all the fund collected from the depositors so the shareholder’s contribution
on this organization is too low. The outcome of this ratio over the years was downward. In
2008 2009
2010
6.77%
6.31%
6.02%
Total Equity to Total Asset Ratio Total Equity to Total Asset Ratio
Financial Ratio Analysis of United Commercial Bank Limited 36
year 2010, 2009 and 2008 the ratios were 6.02%, 6.31% and 6.77%. The reason behind this
downward slope was that the bank’s deposits are increasing over years and shareholders are
less exposed to the risk than the depositors or debtors are.
Profitability Ratios measure the overall earnings performance of an institution and its
efficiency in utilizing assets, liabilities and equity.
5.3 PROFITABILITY RATIOS
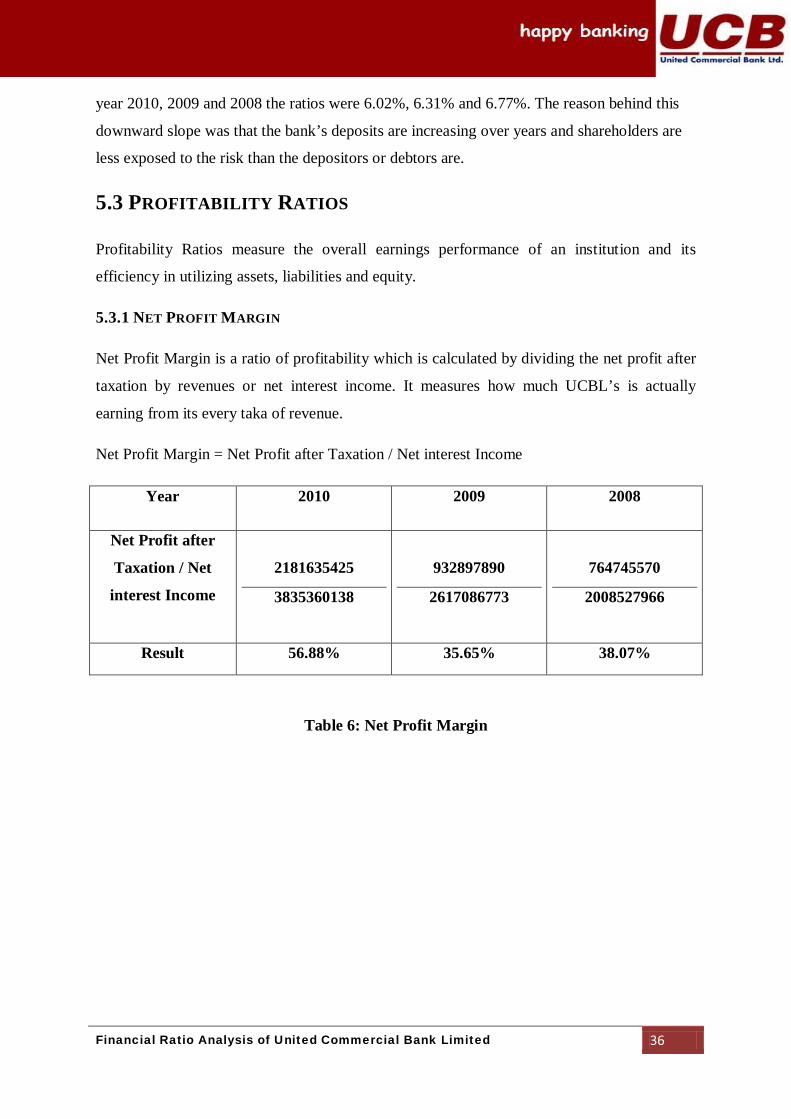
Net Profit Margin is a ratio of profitability which is calculated by dividing the net profit after
taxation by revenues or net interest income. It measures how much UCBL’s is actually
earning from its every taka of revenue.
5.3.1 NET PROFIT MARGIN
Net Profit Margin = Net Profit after Taxation / Net interest Income
Year 2010 2009 2008
Net Profit after
Taxation / Net
interest Income
2181635425
3835360138
932897890
2617086773
764745570
2008527966
Result 56.88% 35.65% 38.07%
Table 6: Net Profit Margin
Financial Ratio Analysis of United Commercial Bank Limited 37
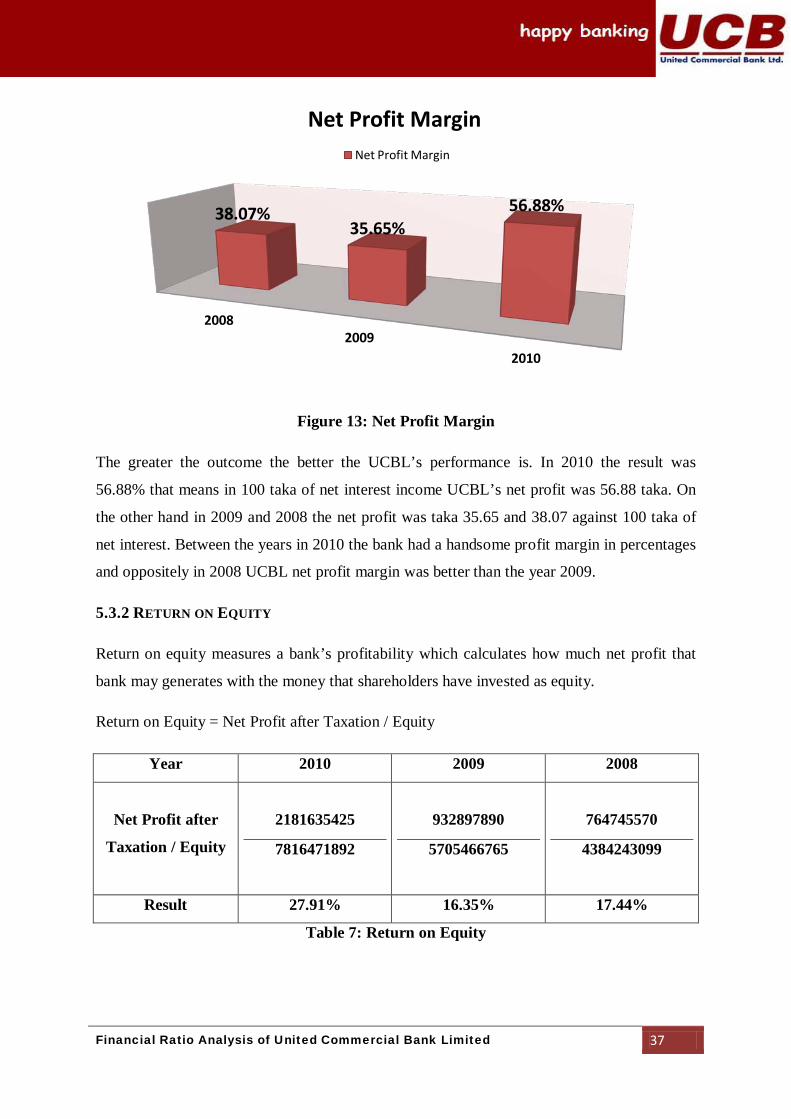
Figure 13: Net Profit Margin
The greater the outcome the better the UCBL’s performance is. In 2010 the result was
56.88% that means in 100 taka of net interest income UCBL’s net profit was 56.88 taka. On
the other hand in 2009 and 2008 the net profit was taka 35.65 and 38.07 against 100 taka of
net interest. Between the years in 2010 the bank had a handsome profit margin in percentages
and oppositely in 2008 UCBL net profit margin was better than the year 2009.
Return on equity measures a bank’s profitability which calculates how much net profit that
bank may generates with the money that shareholders have invested as equity.
5.3.2 RETURN ON EQUITY
Return on Equity = Net Profit after Taxation / Equity
Year 2010 2009 2008
Net Profit after
Taxation / Equity
2181635425
7816471892
932897890
5705466765
764745570
4384243099
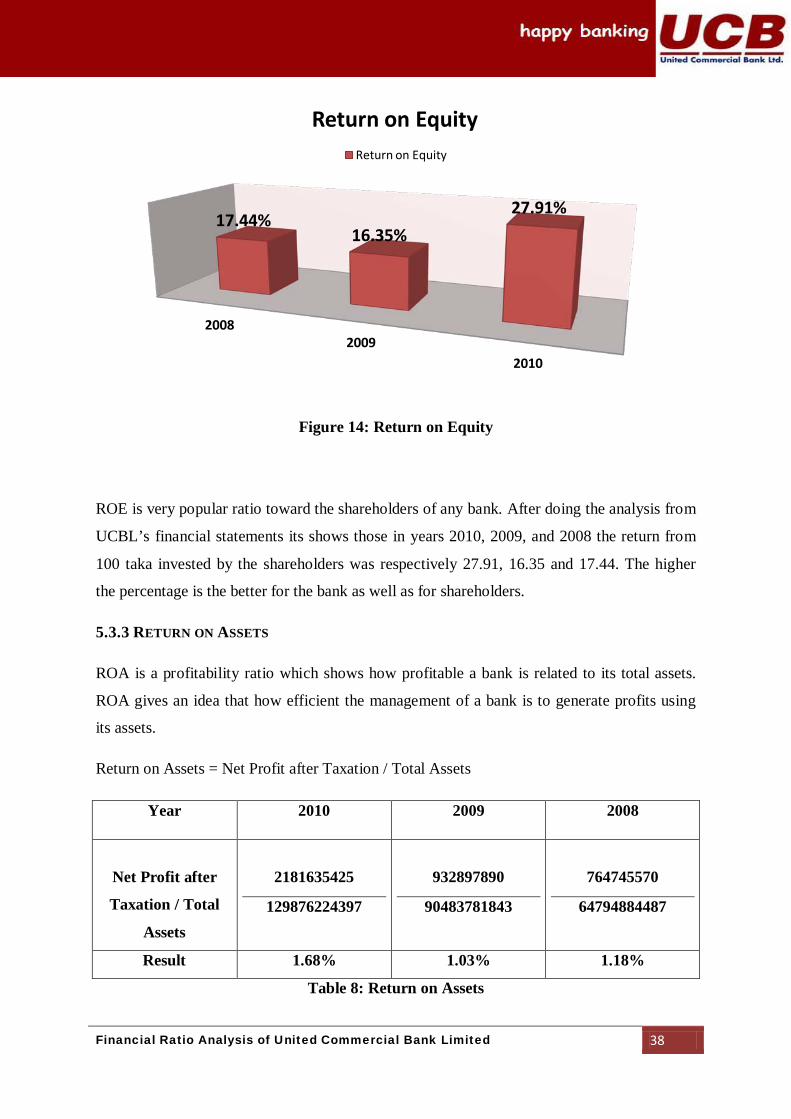
Result 27.91% 16.35% 17.44%
Table 7: Return on Equity
2008 2009
2010
38.07% 35.65%
56.88%
Net Profit Margin Net Profit Margin
Financial Ratio Analysis of United Commercial Bank Limited 38
Figure 14: Return on Equity
ROE is very popular ratio toward the shareholders of any bank. After doing the analysis from
UCBL’s financial statements its shows those in years 2010, 2009, and 2008 the return from
100 taka invested by the shareholders was respectively 27.91, 16.35 and 17.44. The higher
the percentage is the better for the bank as well as for shareholders.
ROA is a profitability ratio which shows how profitable a bank is related to its total assets.
ROA gives an idea that how efficient the management of a bank is to generate profits using
its assets.
5.3.3 RETURN ON ASSETS
Return on Assets = Net Profit after Taxation / Total Assets
Year 2010 2009 2008
Net Profit after
Taxation / Total
Assets
2181635425
129876224397
932897890
90483781843
764745570
64794884487
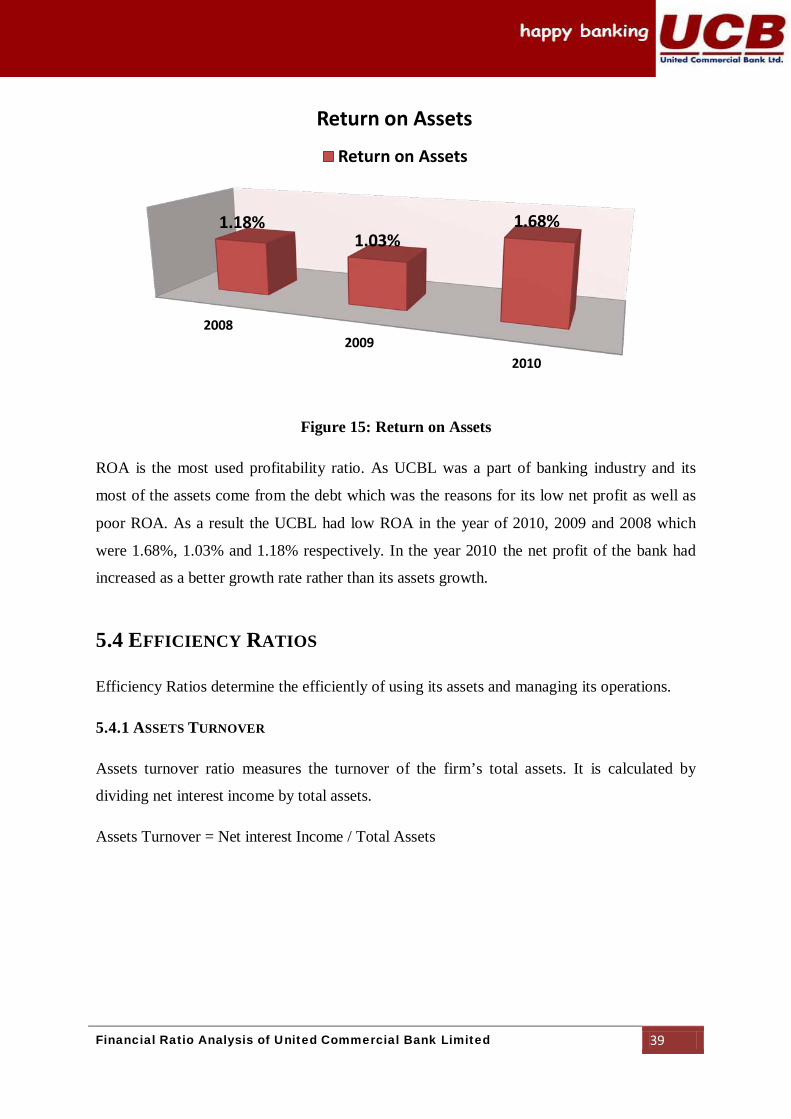
Result 1.68% 1.03% 1.18%
Table 8: Return on Assets
2008 2009
2010
17.44% 16.35%
27.91%
Return on Equity Return on Equity
Financial Ratio Analysis of United Commercial Bank Limited 39
Figure 15: Return on Assets
ROA is the most used profitability ratio. As UCBL was a part of banking industry and its
most of the assets come from the debt which was the reasons for its low net profit as well as
poor ROA. As a result the UCBL had low ROA in the year of 2010, 2009 and 2008 which
were 1.68%, 1.03% and 1.18% respectively. In the year 2010 the net profit of the bank had
increased as a better growth rate rather than its assets growth.
Efficiency Ratios determine the efficiently of using its assets and managing its operations.
5.4 EFFICIENCY RATIOS
Assets turnover ratio measures the turnover of the firm’s total assets. It is calculated by
dividing net interest income by total assets.
5.4.1 ASSETS TURNOVER
Assets Turnover = Net interest Income / Total Assets
2008 2009
2010
1.18% 1.03%
1.68%
Return on Assets
Return on Assets
Financial Ratio Analysis of United Commercial Bank Limited 40
Year 2010 2009 2008
Net interest
Income / Total
Assets
3835360138
129876224397
2617086773
90483781843
2008527966
64794884487
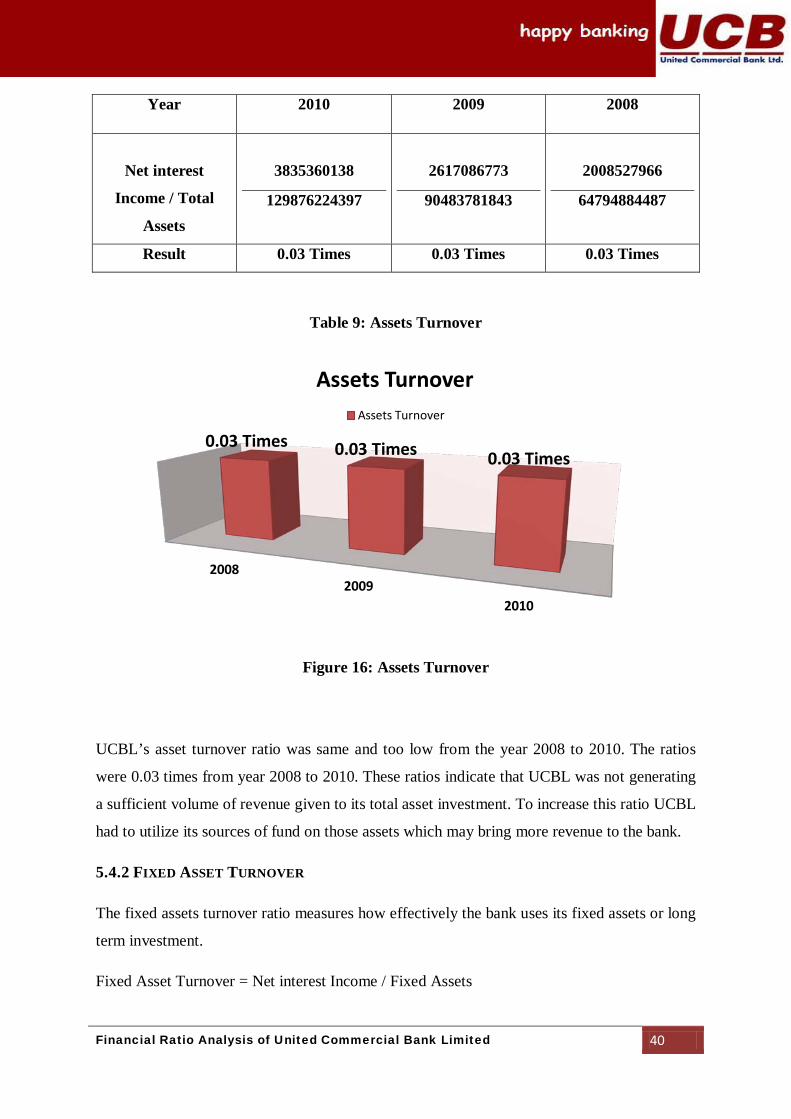
Result 0.03 Times 0.03 Times 0.03 Times
Table 9: Assets Turnover
Figure 16: Assets Turnover
UCBL’s asset turnover ratio was same and too low from the year 2008 to 2010. The ratios
were 0.03 times from year 2008 to 2010. These ratios indicate that UCBL was not generating
a sufficient volume of revenue given to its total asset investment. To increase this ratio UCBL
had to utilize its sources of fund on those assets which may bring more revenue to the bank.
The fixed assets turnover ratio measures how effectively the bank uses its fixed assets or long
term investment.
5.4.2 FIXED ASSET TURNOVER
Fixed Asset Turnover = Net interest Income / Fixed Assets
2008 2009
2010
0.03 Times 0.03 Times 0.03 Times
Assets Turnover Assets Turnover
Financial Ratio Analysis of United Commercial Bank Limited 41
Year 2010 2009 2008
Net interest
Income / Fixed
Assets
3835360138
1966349087
2617086773
1305810015
2008527966
999188451
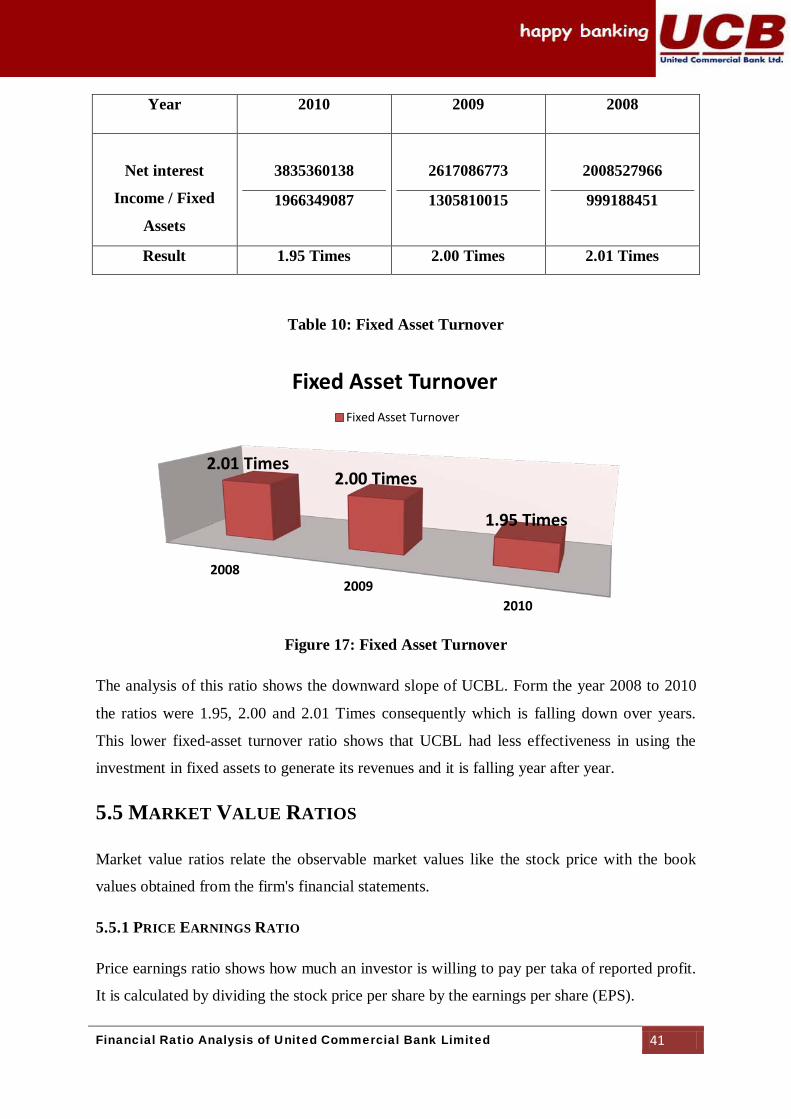
Result 1.95 Times 2.00 Times 2.01 Times
Table 10: Fixed Asset Turnover
Figure 17: Fixed Asset Turnover
The analysis of this ratio shows the downward slope of UCBL. Form the year 2008 to 2010
the ratios were 1.95, 2.00 and 2.01 Times consequently which is falling down over years.
This lower fixed-asset turnover ratio shows that UCBL had less effectiveness in using the
investment in fixed assets to generate its revenues and it is falling year after year.
Market value ratios relate the observable market values like the stock price with the book
values obtained from the firm's financial statements.
5.5 MARKET VALUE RATIOS
Price earnings ratio shows how much an investor is willing to pay per taka of reported profit.
It is calculated by dividing the stock price per share by the earnings per share (EPS).
5.5.1 PRICE EARNINGS RATIO
2008 2009
2010
2.01 Times 2.00 Times
1.95 Times
Fixed Asset Turnover Fixed Asset Turnover
Financial Ratio Analysis of United Commercial Bank Limited 42
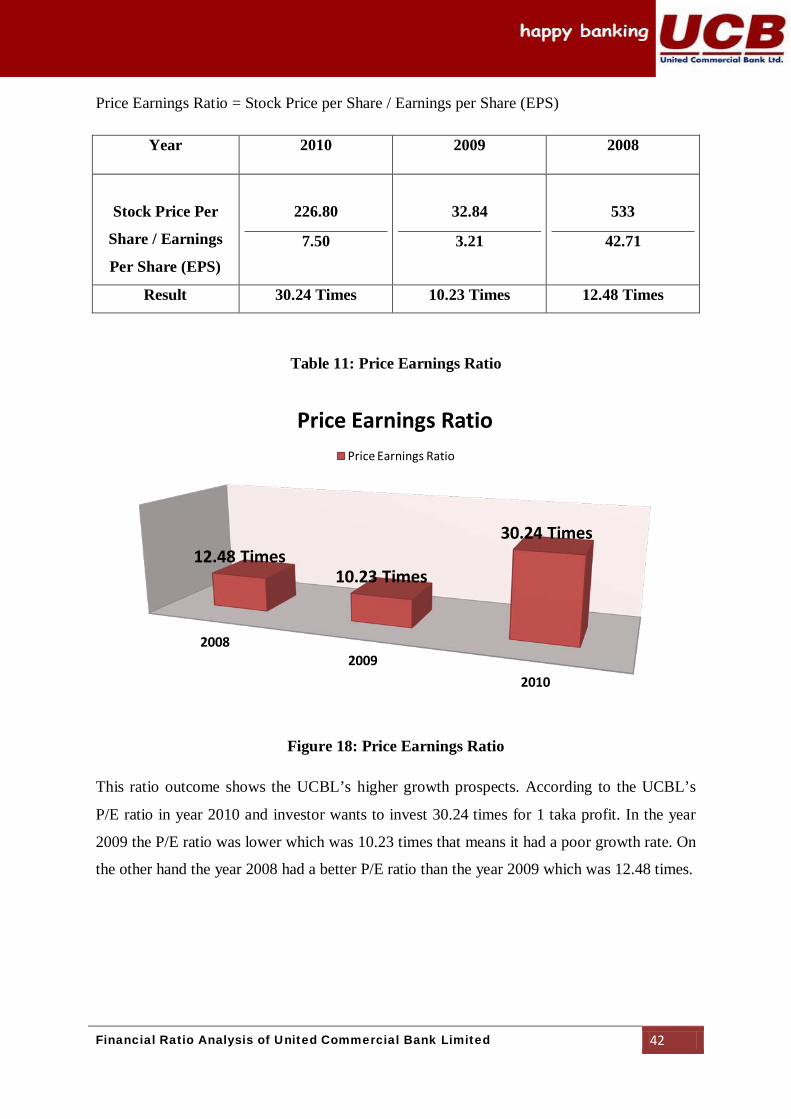
Price Earnings Ratio = Stock Price per Share / Earnings per Share (EPS)
Year 2010 2009 2008
Stock Price Per
Share / Earnings
Per Share (EPS)
226.80
7.50
32.84
3.21
533
42.71
Result 30.24 Times 10.23 Times 12.48 Times
Table 11: Price Earnings Ratio
Figure 18: Price Earnings Ratio
This ratio outcome shows the UCBL’s higher growth prospects. According to the UCBL’s
P/E ratio in year 2010 and investor wants to invest 30.24 times for 1 taka profit. In the year
2009 the P/E ratio was lower which was 10.23 times that means it had a poor growth rate. On
the other hand the year 2008 had a better P/E ratio than the year 2009 which was 12.48 times.
2008 2009
2010
12.48 Times 10.23 Times
30.24 Times
Price Earnings Ratio Price Earnings Ratio
Financial Ratio Analysis of United Commercial Bank Limited 43
5.6 ADEQUACY RATIO
Adequacy Ratio is a ratio of a bank's capital to its risk. It is expressed as a percentage of a
bank's risk weighted credit exposures.
5.6.1 CAPITAL ADEQUACY RATIO
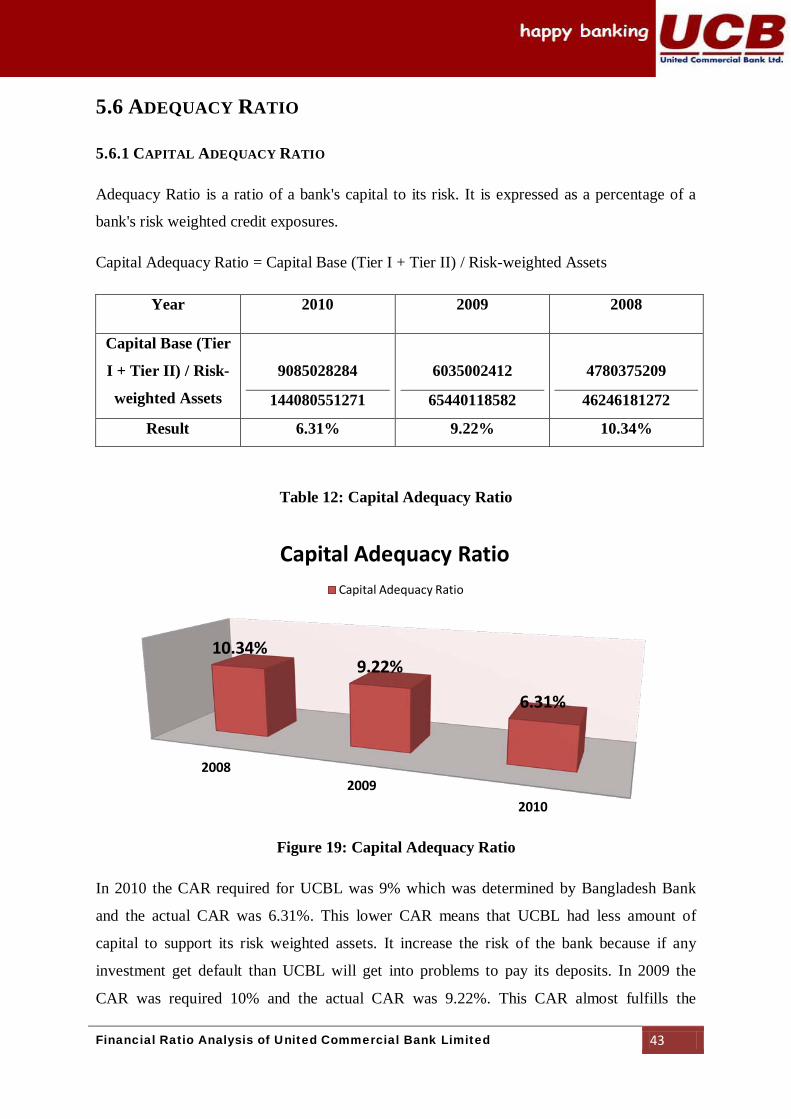
Capital Adequacy Ratio = Capital Base (Tier I + Tier II) / Risk-weighted Assets
Year 2010 2009 2008
Capital Base (Tier
I + Tier II) / Risk-
weighted Assets
9085028284
144080551271
6035002412
65440118582
4780375209
46246181272
Result 6.31% 9.22% 10.34%
Table 12: Capital Adequacy Ratio
Figure 19: Capital Adequacy Ratio
In 2010 the CAR required for UCBL was 9% which was determined by Bangladesh Bank
and the actual CAR was 6.31%. This lower CAR means that UCBL had less amount of
capital to support its risk weighted assets. It increase the risk of the bank because if any
investment get default than UCBL will get into problems to pay its deposits. In 2009 the
CAR was required 10% and the actual CAR was 9.22%. This CAR almost fulfills the
2008 2009
2010
10.34% 9.22%
6.31%
Capital Adequacy Ratio Capital Adequacy Ratio
Financial Ratio Analysis of United Commercial Bank Limited 44
requirement of BB and UCBL had the minimum capital to support its risk weighted assets. In
year 2008 the CAR was required 10% and the CAR was 10.34%. This CAR was higher than
the standard of BB which means UCBL was more secured by its capital to the risk weighted
assets.
Core capital is the minimum amount of capital that a bank has to have to ensure protection of
consumers. It is expressed as a percentage of a bank's risk weighted credit exposures.
5.6.2 CORE CAPITAL RATIO
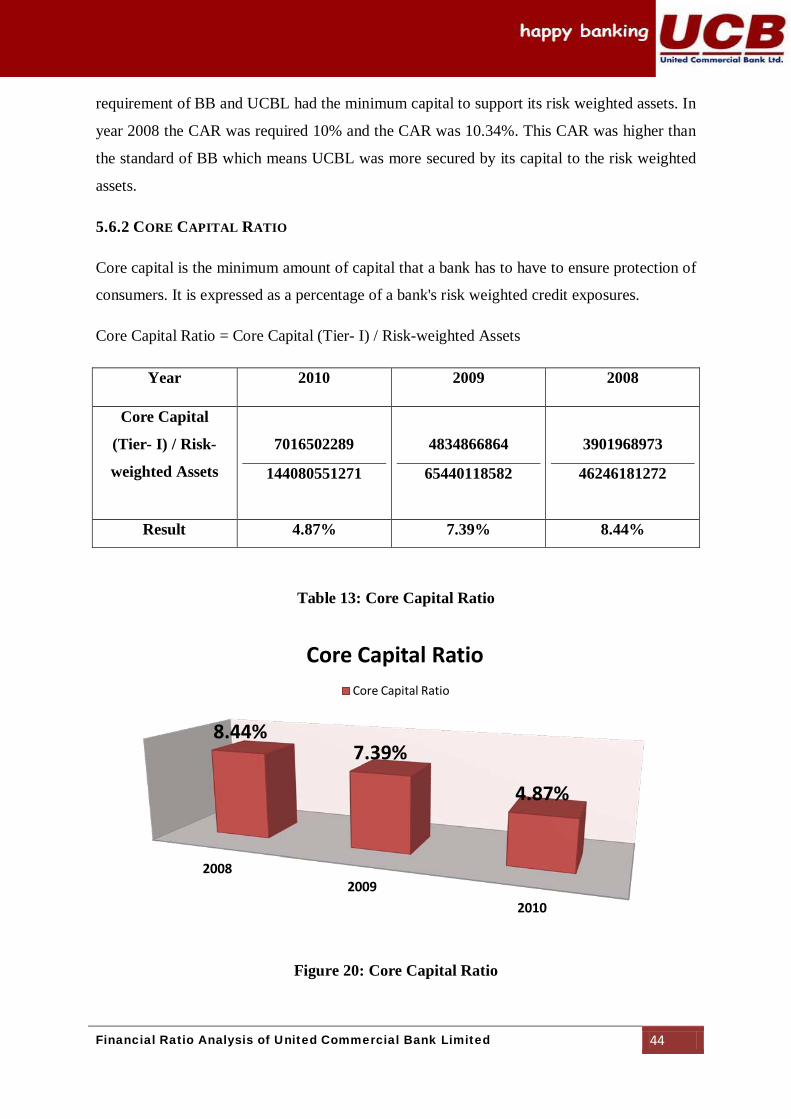
Core Capital Ratio = Core Capital (Tier- I) / Risk-weighted Assets
Year 2010 2009 2008
Core Capital
(Tier- I) / Risk-
weighted Assets
7016502289
144080551271
4834866864
65440118582
3901968973
46246181272
Result 4.87% 7.39% 8.44%
Table 13: Core Capital Ratio
Figure 20: Core Capital Ratio
2008 2009
2010
8.44% 7.39%
4.87%
Core Capital Ratio Core Capital Ratio
Financial Ratio Analysis of United Commercial Bank Limited 45
In 2010 the core capital ratio determined by BB was 4.5% and the UCBL’s ratio was 4.87
which higher than the margin. Here the depositors were more secured to its risk weighted
investments. In 2009 the ratio was 7.39% where the margin was 5% and UCBL was also
secured to its risk weighted assets. At last in year 2008 the ratio was 8.44 where the margin
was 5%. So the bank was not exposer to any risks.
Supplementary capital is secondary bank capital that includes items such as undisclosed
reserves, unclassified loans, assets revaluation reserve and so on.
5.6.3 SUPPLEMENTARY CAPITAL RATIO
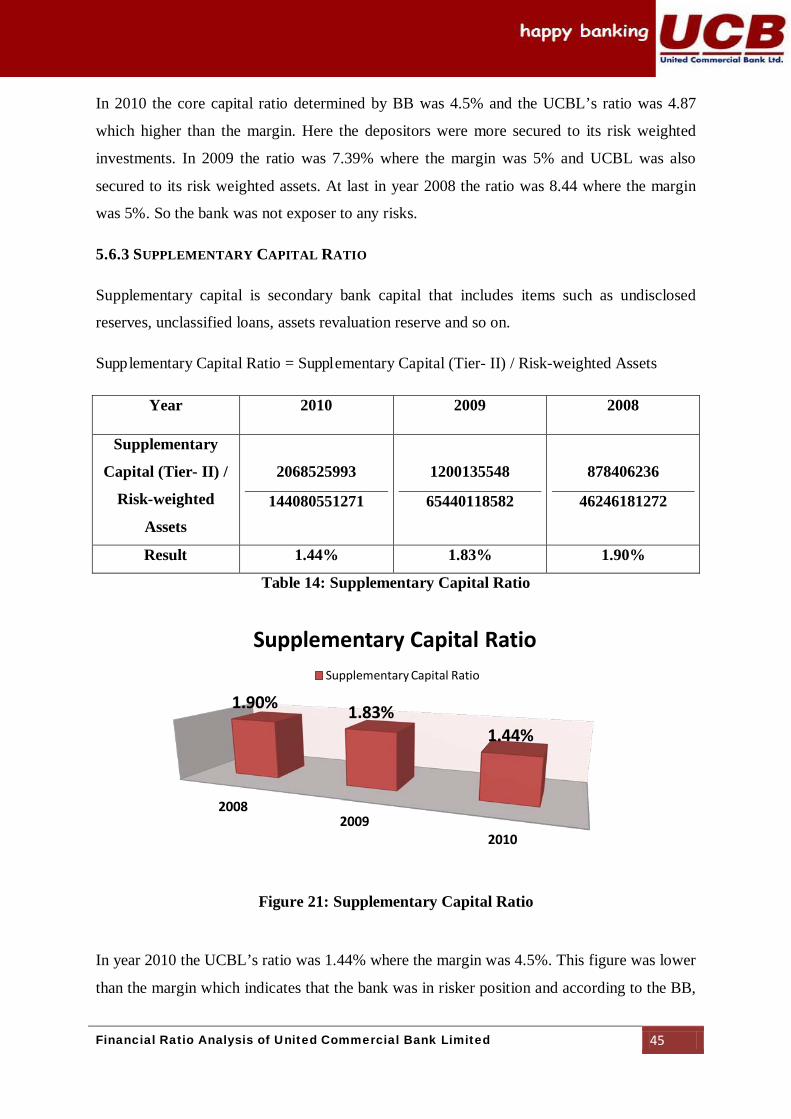
Supplementary Capital Ratio = Supplementary Capital (Tier- II) / Risk-weighted Assets
Year 2010 2009 2008
Supplementary
Capital (Tier- II) /
Risk-weighted
Assets
2068525993
144080551271
1200135548
65440118582
878406236
46246181272
Result 1.44% 1.83% 1.90%
Table 14: Supplementary Capital Ratio
Figure 21: Supplementary Capital Ratio
In year 2010 the UCBL’s ratio was 1.44% where the margin was 4.5%. This figure was lower
than the margin which indicates that the bank was in risker position and according to the BB,
2008 2009
2010
1.90% 1.83% 1.44%
Supplementary Capital Ratio Supplementary Capital Ratio
Financial Ratio Analysis of United Commercial Bank Limited 46
UCBL had to be asked to increase its capital. In year 2009 and 2008 the ratios were 1.83%
and 1.90% where the margin was 5%. Here it is noticed that the supplementary capital ratio
of UCBL were lower in years which implies that UCBL’s supplementary capital is more
exposed to risk by risk weighted assets.
Different financial institutions may have different methodology of adequacy ratio calculation
like UCBL has less supplementary capital than the core capital but its CAR almost matches
its standard.
There are some ratios which indicate that the bank’s solvency and long-term performance.
5.7 OTHER IMPORTANT RATIOS FOR BANKS
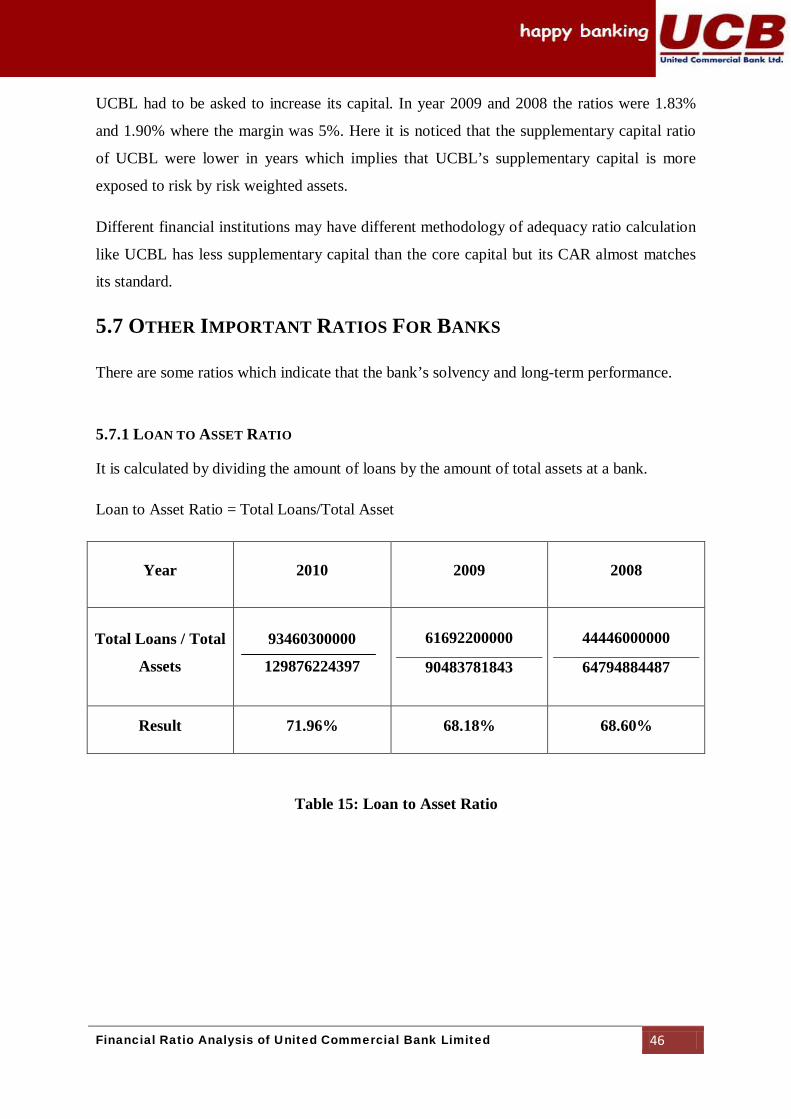
It is calculated by dividing the amount of loans by the amount of total assets at a bank.
5.7.1 LOAN TO ASSET RATIO
Loan to Asset Ratio = Total Loans/Total Asset
Year 2010 2009 2008
Total Loans / Total
Assets
93460300000
129876224397
61692200000
90483781843
44446000000
64794884487
Result 71.96% 68.18% 68.60%
Table 15: Loan to Asset Ratio
Financial Ratio Analysis of United Commercial Bank Limited 47
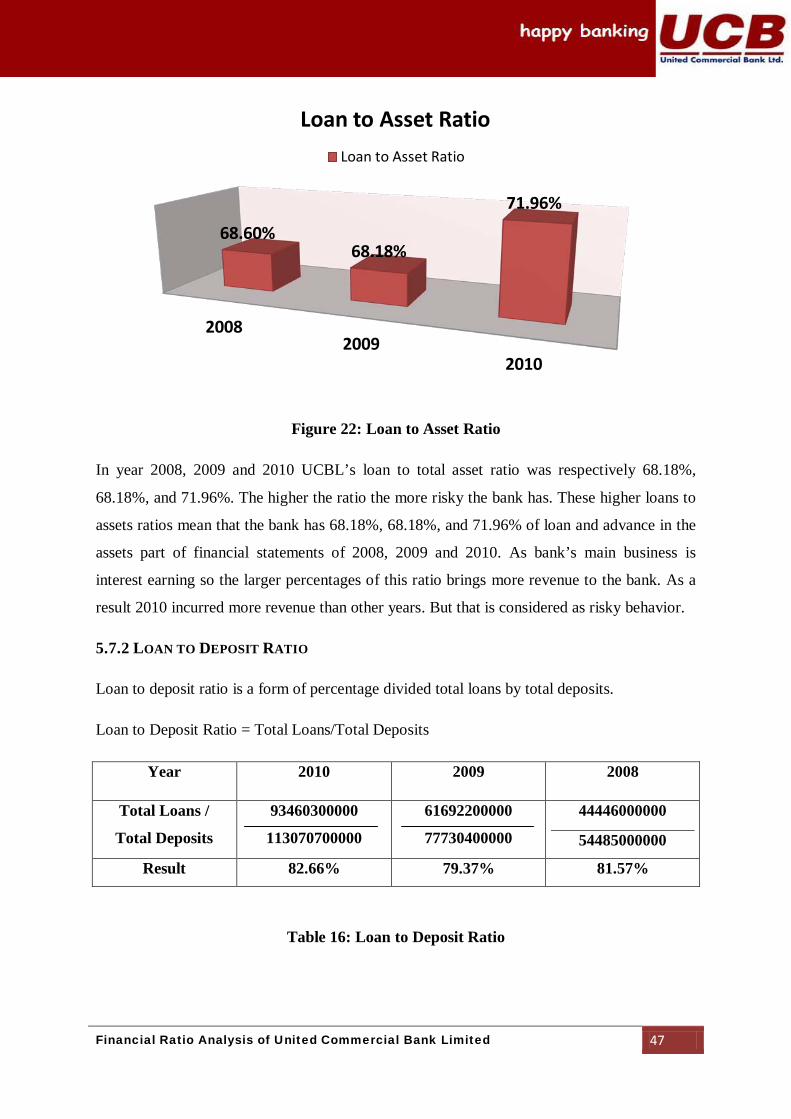
Figure 22: Loan to Asset Ratio
In year 2008, 2009 and 2010 UCBL’s loan to total asset ratio was respectively 68.18%,
68.18%, and 71.96%. The higher the ratio the more risky the bank has. These higher loans to
assets ratios mean that the bank has 68.18%, 68.18%, and 71.96% of loan and advance in the
assets part of financial statements of 2008, 2009 and 2010. As bank’s main business is
interest earning so the larger percentages of this ratio brings more revenue to the bank. As a
result 2010 incurred more revenue than other years. But that is considered as risky behavior.
Loan to deposit ratio is a form of percentage divided total loans by total deposits.
5.7.2 LOAN TO DEPOSIT RATIO
Loan to Deposit Ratio = Total Loans/Total Deposits
Year 2010 2009 2008
Total Loans /
Total Deposits
93460300000
113070700000
61692200000
77730400000
44446000000
54485000000
Result 82.66% 79.37% 81.57%
Table 16: Loan to Deposit Ratio
2008 2009
2010
68.60% 68.18%
71.96%
Loan to Asset Ratio Loan to Asset Ratio
Financial Ratio Analysis of United Commercial Bank Limited 48
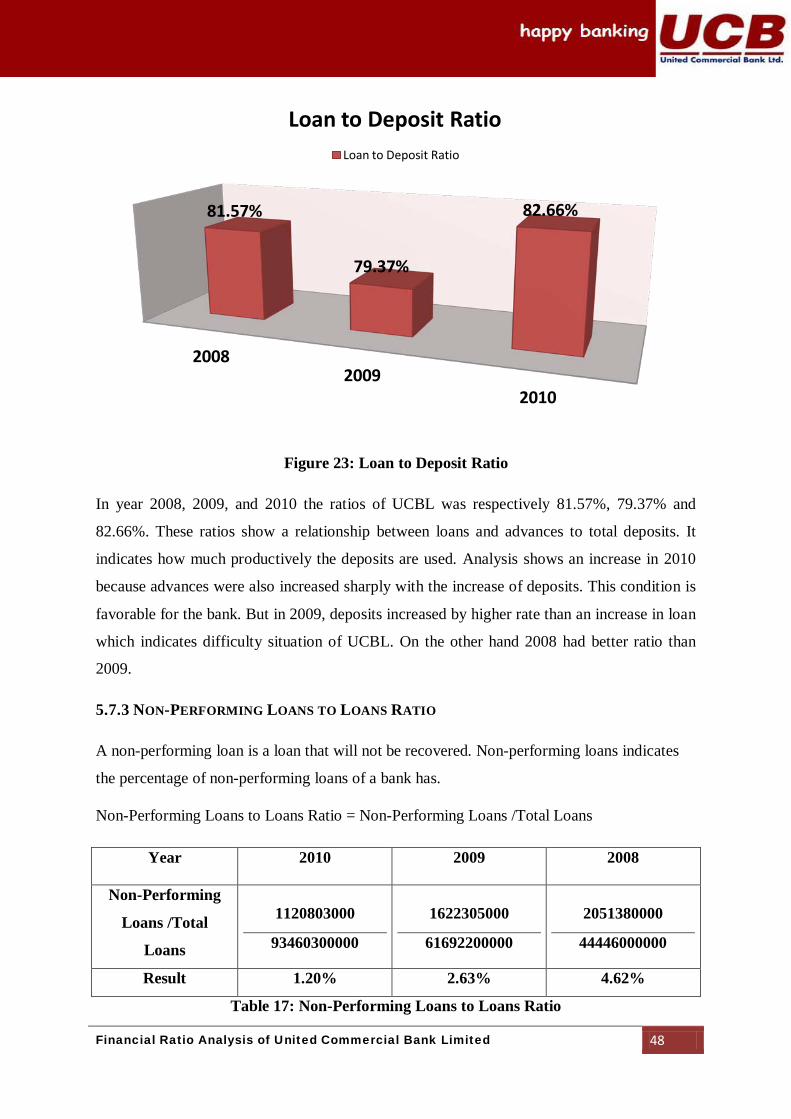
Figure 23: Loan to Deposit Ratio
In year 2008, 2009, and 2010 the ratios of UCBL was respectively 81.57%, 79.37% and
82.66%. These ratios show a relationship between loans and advances to total deposits. It
indicates how much productively the deposits are used. Analysis shows an increase in 2010
because advances were also increased sharply with the increase of deposits. This condition is
favorable for the bank. But in 2009, deposits increased by higher rate than an increase in loan
which indicates difficulty situation of UCBL. On the other hand 2008 had better ratio than
2009.
A non-performing loan is a loan that will not be recovered. Non-performing loans indicates
the percentage of non-performing loans of a bank has.
5.7.3 NON-PERFORMING LOANS TO LOANS RATIO
Non-Performing Loans to Loans Ratio = Non-Performing Loans /Total Loans
Year 2010 2009 2008
Non-Performing
Loans /Total
Loans
1120803000
93460300000
1622305000
61692200000
2051380000
44446000000
Result 1.20% 2.63% 4.62%
Table 17: Non-Performing Loans to Loans Ratio
2008 2009
2010
81.57%
79.37%
82.66%
Loan to Deposit Ratio Loan to Deposit Ratio
Financial Ratio Analysis of United Commercial Bank Limited 49
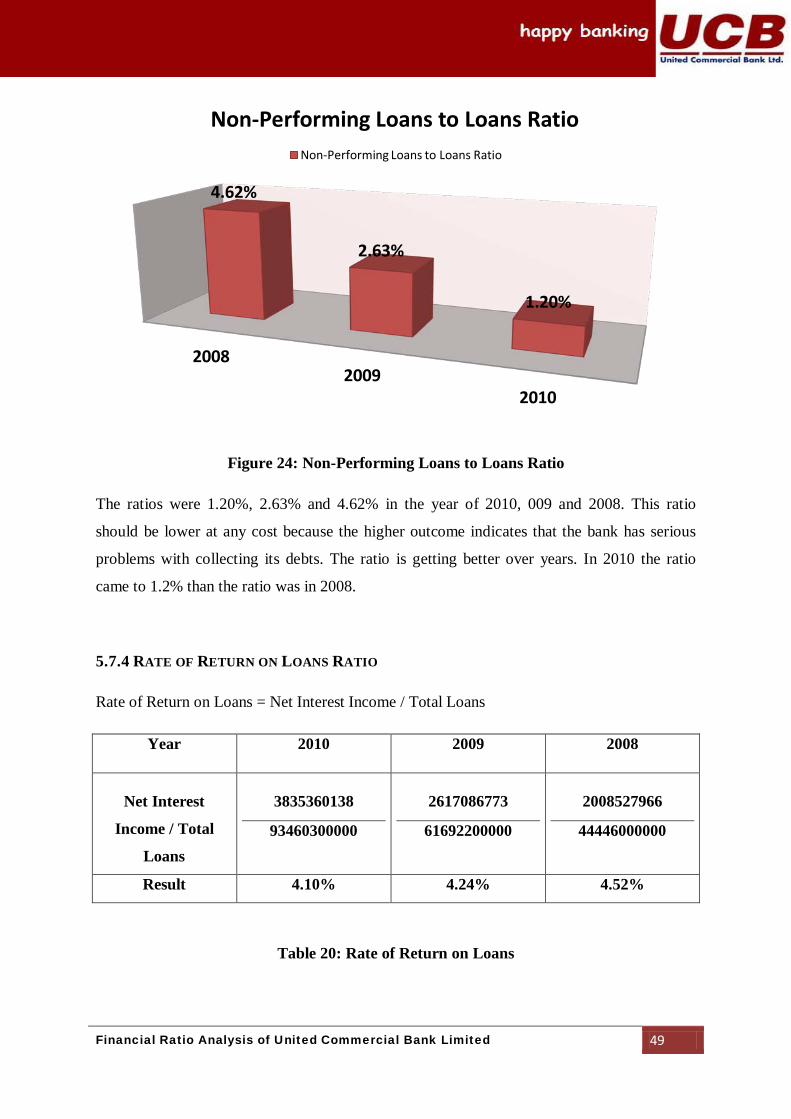
Figure 24: Non-Performing Loans to Loans Ratio
The ratios were 1.20%, 2.63% and 4.62% in the year of 2010, 009 and 2008. This ratio
should be lower at any cost because the higher outcome indicates that the bank has serious
problems with collecting its debts. The ratio is getting better over years. In 2010 the ratio
came to 1.2% than the ratio was in 2008.
Rate of Return on Loans = Net Interest Income / Total Loans
5.7.4 RATE OF RETURN ON LOANS RATIO
Year 2010 2009 2008
Net Interest
Income / Total
Loans
3835360138
93460300000
2617086773
61692200000
2008527966
44446000000
Result 4.10% 4.24% 4.52%
Table 20: Rate of Return on Loans
2008 2009
2010
4.62%
2.63%
1.20%
Non-Performing Loans to Loans Ratio Non-Performing Loans to Loans Ratio
Financial Ratio Analysis of United Commercial Bank Limited 50
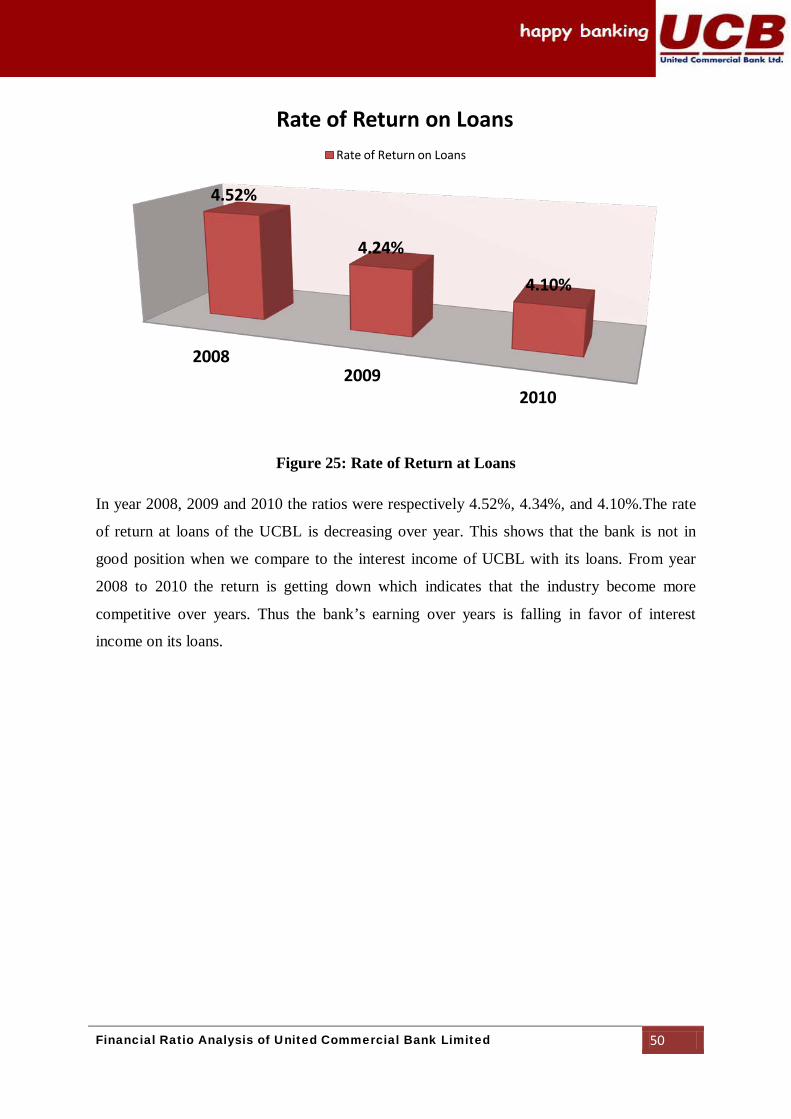
Figure 25: Rate of Return at Loans
In year 2008, 2009 and 2010 the ratios were respectively 4.52%, 4.34%, and 4.10%.The rate
of return at loans of the UCBL is decreasing over year. This shows that the bank is not in
good position when we compare to the interest income of UCBL with its loans. From year
2008 to 2010 the return is getting down which indicates that the industry become more
competitive over years. Thus the bank’s earning over years is falling in favor of interest
income on its loans.
2008 2009
2010
4.52%
4.24%
4.10%
Rate of Return on Loans Rate of Return on Loans

Financial Ratio Analysis of United Commercial Bank Limited 51
6. RECOMMENDATIONS
United Commercial Bank Ltd. is an established privatized bank in our country. This bank is
doing well over years. Based on my three months of internship program, my
recommendations towards the UCBL’s operations are
UCBL Kawran Bazar branch is one of the very busy branches of UCBL. But the
space of that branch is too short to do its activities properly. So I think it should
enlarge the branch space to accomplish its work effectively.
UCBL’s most of the works are done with papers where many bank uses computerized
systems. UCBL should use more computerized system to increase the efficiency in
work.
From my three months of internship program I came to know that card division
department is not good enough to satisfy the clients properly. It should give more
emphasize on this card division department.
UCBL Kawran Bazar branch has no scanner machine to read other bank’s cheques.
For that reason they have to rely on Dhanmondi Branch. So it should arrange the
scanner machine to easier its work.
It should be more concern in their management quality to improve its satisfactory
position.
This Branch should be more innovative and diversified in its service.
UCBL’s information system should be developed to deal with its local and
international clients properly.
UCBL should introduce new short term DPS like other banks to increase its deposits.
UCBL had good liquidity ratios during year 2008 and 2010. In 2009 it had less
liquidity ratios than the others. It should give more concern about these types of
fluctuations in ratios.
UCBL had fair leverage ratios in where it uses the debt most to increase revenue
rather than the equity. It may increase the risk of the bank. So, to minimize the risk I
think UCBL should finance more equity.
Financial Ratio Analysis of United Commercial Bank Limited 52
UCBL had less supplementary assets in comparison to the Bangladesh Bank’s
standard. To secure the depositors UCBL should give concern to raise its
supplementary assets.
From year 2008 to 2010 there was a lower growth in 2009 compare to 2008 and 2010.
It indicates that UCBL has no consistency in growth over years. UCBL should ensure
a better growth over year to reach a strong position.


Financial Ratio Analysis of United Commercial Bank Limited 53
7. CONCLUSION
Private commercial banks are playing a vital role in the development of our economy.
Government and Bangladesh Bank also play a crucial role in banking sector by regulating the
overall banking systems and setting rules and regulation in the activities of commercial
banks. In recent years of banking sector, UCBL has shown better performance comparing
with other first generation banking.
It was great pleaser for me to do my internship program in reputed organization like UCBL.
The three months of practical orientation helps me to provide a wide range of scope to
observe the operations of bank. Overall the bank must make appositive attempt to be more
outward looking in their goals and aware of what is happening. I hope, in spite of all my
limitation the experience of sharing works in such environment will help me a lot in my
future professional life. I wish continuous success and healthy business portfolio of UCBL
Kawan Bazar Branch, Dhaka.

Financial Ratio Analysis of United Commercial Bank Limited 54
8. REFERENCES
To prepare this report I collect data mainly from annual reports of UCBL, different books
regarding ratio analysis, the websites of BB and UCBL and others websites about ratio
analysis. The references are given below
Annual Reports
Annual Report of UCBL 2010
Annual Report of UCBL 2009
Annual Report of UCBL 2008
Books
Stanley, B. b., & Geoffrey, A. H. (2008 - 2009). Foundation of Financial Management. International: McGraw-Hill.
Brigham, E. F., & Gapenski, L. C. (1995). Intermediate Financial Management (Fifth ed.).
International: The Dryden Press.
Madura, J. (2008). Finencial Market and Institution. USA: Thomson South- Western.
Websites
http://www.bangladesh-bank.org/fnansys/bankfi.php
http://www.ucbl.com/
http://www.ucbl.com/board_directors.htm
http://www.activemedia-guide.com/busedu_banking.htm
http://www.shkfd.com.hk/glossary/eng/RA.htm
http://www.investinganswers.com/financial-dictionary/businesses-
corporations/return-assets-roa-1627

Financial Ratio Analysis of United Commercial Bank Limited 55
http://www.investopedia.com/terms/a/assetturnover.asp#axzz1v0zJx7qB
http://www.investopedia.com/terms/c/capitaladequacyratio.asp#axzz1v0zJx7qB
http://www.investopedia.com/terms/t/tier-1-capital-
ratio.asp?q=Core%20Capital%20Ratio#axzz1v0zJx7qB
http://www.investopedia.com/terms/t/tier1capital.asp?q=Tier%20I%20Capital#axzz1
v0zJx7qB
http://www.investopedia.com/terms/t/tier2capital.asp?q=Tier%20II%20Capital#axzz1
v0zJx7qB

APPENDIX