Embed Size (px)
Citation preview

Consolidated Financial Statements
Consolidated Income Statement 116Consolidated Statement of Comprehensive Income 117 Consolidated Balance Sheet 118Consolidated Cash Flow Statement 119Consolidated Statement of Changes in Equity 121
Notes to the Consolidated Financial Statements 1 Accounting policies 1222 Segmental analysis 1323 Research and development 1374 Net financing 1375 Taxation 1386 Earnings per ordinary share 1407 Employee information 1418 Auditors’ remuneration 1419 Intangible assets 14210 Property, plant and equipment 14411 Investments 14512 Inventories 14713 Trade and other receivables 14714 Cash and cash equivalents 14815 Borrowings 14816 Trade and other payables 14817 Financial instruments 14918 Provisions for liabilities and charges 15819 Post-retirement benefits 15920 Share capital 16321 Share-based payments 16422 Leases 16523 Contingent liabilities 16624 Related party transactions 16625 Acquisitions 16726 Derivation of summary funds
flow statement 16827 Impact of IFRS 15 170
Company Financial Statements
Company Balance Sheet 172Company Statement of Changes in Equity 172
Notes to the Company Financial Statements 1 Accounting policies 1732 Investments – subsidiary undertakings 1733 Financial liabilities 1734 Share capital 1745 Contingent liabilities 1746 Other information 174
Subsidiaries 175
Joint Ventures and Associates 181
Financial Statements
Rolls-Royce Holdings plc Annual Report 2017 115Financial Statements
FINA
NC
IAL STATEM
ENTS
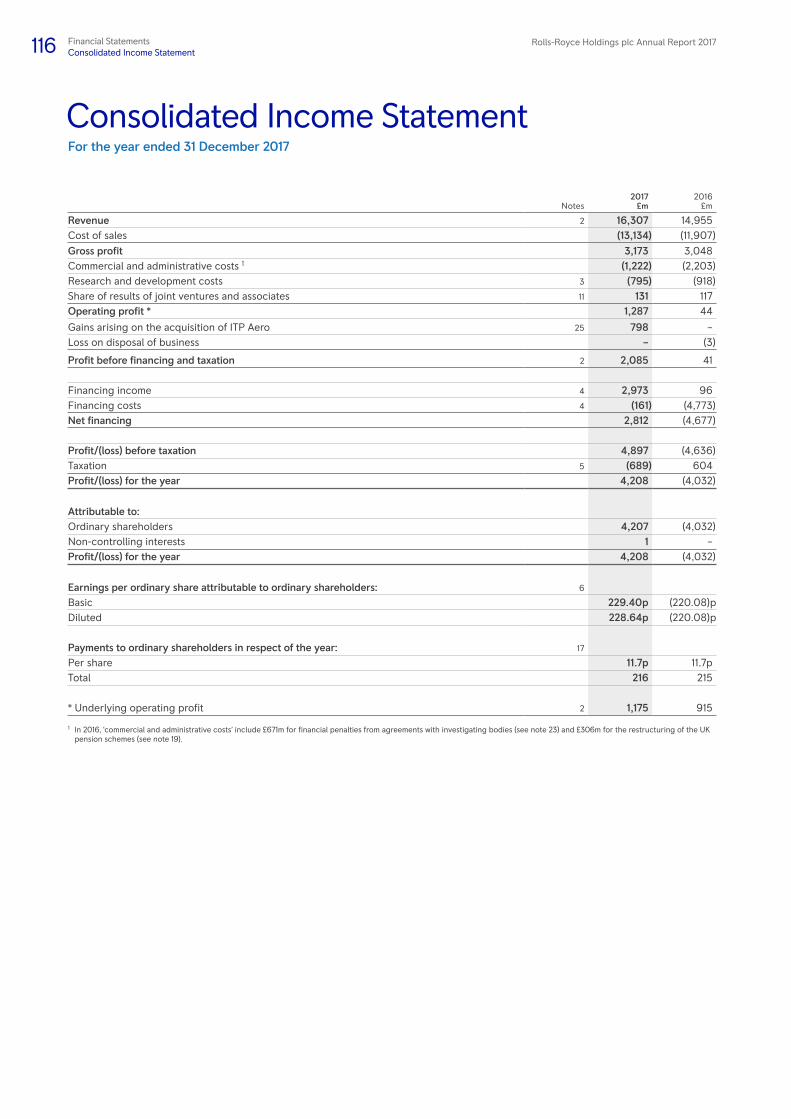
Consolidated Income StatementFor the year ended 31 December 2017
Notes2017
£m2016£m
Revenue 2 16,307 14,955 Cost of sales (13,134) (11,907)Gross profit 3,173 3,048 Commercial and administrative costs 1 (1,222) (2,203)Research and development costs 3 (795) (918)Share of results of joint ventures and associates 11 131 117 Operating profit * 1,287 44
Gains arising on the acquisition of ITP Aero 25 798 –Loss on disposal of business – (3)
Profit before financing and taxation 2 2,085 41
Financing income 4 2,973 96 Financing costs 4 (161) (4,773)Net financing 2,812 (4,677)
Profit/(loss) before taxation 4,897 (4,636)Taxation 5 (689) 604Profit/(loss) for the year 4,208 (4,032)
Attributable to:Ordinary shareholders 4,207 (4,032)Non-controlling interests 1 – Profit/(loss) for the year 4,208 (4,032)
Earnings per ordinary share attributable to ordinary shareholders: 6
Basic 229.40p (220.08)pDiluted 228.64p (220.08)p
Payments to ordinary shareholders in respect of the year: 17
Per share 11.7p 11.7p Total 216 215
* Underlying operating profit 2 1,175 915
1 In 2016, ‘commercial and administrative costs’ include £671m for financial penalties from agreements with investigating bodies (see note 23) and £306m for the restructuring of the UK pension schemes (see note 19).
116 Rolls-Royce Holdings plc Annual Report 2017Financial StatementsConsolidated Income Statement
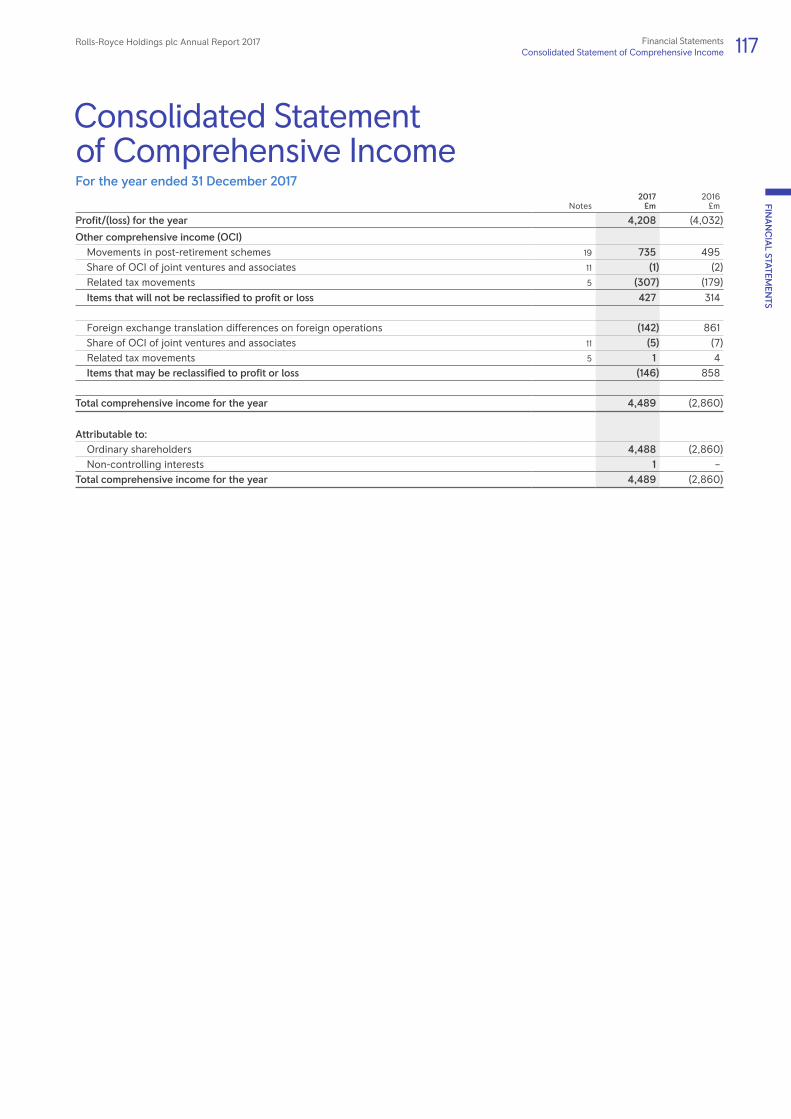
Consolidated Statement of Comprehensive IncomeFor the year ended 31 December 2017
Notes2017
£m2016£m
Profit/(loss) for the year 4,208 (4,032)
Other comprehensive income (OCI)Movements in post-retirement schemes 19 735 495 Share of OCI of joint ventures and associates 11 (1) (2)Related tax movements 5 (307) (179)Items that will not be reclassified to profit or loss 427 314
Foreign exchange translation differences on foreign operations (142) 861 Share of OCI of joint ventures and associates 11 (5) (7)Related tax movements 5 1 4 Items that may be reclassified to profit or loss (146) 858
Total comprehensive income for the year 4,489 (2,860)
Attributable to:Ordinary shareholders 4,488 (2,860)Non-controlling interests 1 –
Total comprehensive income for the year 4,489 (2,860)
Rolls-Royce Holdings plc Annual Report 2017 117Financial StatementsConsolidated Statement of Comprehensive Income
FINA
NC
IAL STATEM
ENTS

Notes2017
£m2016£m
ASSETSIntangible assets 9 7,063 5,080 Property, plant and equipment 10 4,624 4,114 Investments – joint ventures and associates 11 688 844 Investments – other 11 26 38 Other financial assets 17 610 382 Deferred tax assets 5 271 876 Post-retirement scheme surpluses 19 2,125 1,346 Non-current assets 15,407 12,680 Inventories 12 3,660 3,086 Trade and other receivables 13 7,919 6,956 Taxation recoverable 17 32 Other financial assets 17 36 5 Short-term investments 3 3 Cash and cash equivalents 14 2,953 2,771 Assets held for sale 7 5 Current assets 14,595 12,858 TOTAL ASSETS 30,002 25,538
LIABILITIESBorrowings 15 (82) (172)Other financial liabilities 17 (581) (651)Trade and other payables 16 (9,527) (7,957)Current tax liabilities (209) (211)Provisions for liabilities and charges 18 (526) (543)Current liabilities (10,925) (9,534)Borrowings 15 (3,406) (3,185)Other financial liabilities 17 (2,435) (5,129)Trade and other payables 16 (4,178) (3,459)Deferred tax liabilities 5 (1,144) (776)Provisions for liabilities and charges 18 (357) (216)Post-retirement scheme deficits 19 (1,387) (1,375)Non-current liabilities (12,907) (14,140)TOTAL LIABILITIES (23,832) (23,674)
NET ASSETS 6,170 1,864
EQUITYCalled-up share capital 20 368 367 Share premium account 195 181 Capital redemption reserve 162 162 Cash flow hedging reserve (112) (107)Other reserves 673 814 Retained earnings 4,881 445 Equity attributable to ordinary shareholders 6,167 1,862 Non-controlling interests 3 2 TOTAL EQUITY 6,170 1,864
The Consolidated Financial Statements on pages 116 to 171 were approved by the Board on 6 March 2018 and signed on its behalf by:
Warren East Stephen Daintith Chief Executive Chief Financial Officer
Consolidated Balance SheetAt 31 December 2017
118 Rolls-Royce Holdings plc Annual Report 2017Financial StatementsConsolidated Balance Sheet

Consolidated Cash Flow Statement For the year ended 31 December 2017
Notes2017
£m2016£m
Operating profit 1,287 44Loss on disposal of property, plant and equipment 11 5Share of results of joint ventures and associates 11 (131) (117)Dividends received from joint ventures and associates 79 74Amortisation and impairment of intangible assets 9 430 628Depreciation and impairment of property, plant and equipment 10 450 426Impairment of investments 11 14 –Increase in provisions 58 44
Increase in inventories (235) (161)(Increase)/decrease in trade and other receivables (462) 54(Decrease)/increase in amounts payable for financial penalties from agreements with investigating bodies (286) 671Other increase in trade and other payables 1,411 234
Cash flows on other financial assets and liabilities held for operating purposes (661) (608)Net defined benefit post-retirement cost recognised in profit before financing 19 240 510Cash funding of defined benefit post-retirement schemes 19 (249) (271)Share-based payments 21 34 35Net cash inflow from operating activities before taxation 1,990 1,568Taxation paid (180) (157)Net cash inflow from operating activities 1,810 1,411
Cash flows from investing activitiesAdditions of unlisted investments 11 (4) –Additions of intangible assets 9 (973) (631)Disposals of intangible assets 9 7 8Purchases of property, plant and equipment (773) (585)Government grants received 14 15Disposals of property, plant and equipment 4 8
Acquisitions of business 25 263 (6)Consolidation of previously unconsolidated subsidiary 1 – Disposals of other businesses – 7 Increase in share in joint ventures 11 – (154)Other investments in joint ventures and associates 11 (48) (30)Cash and cash equivalents of joint ventures reclassified as joint operations – 5 Net cash outflow from investing activities (1,509) (1,363)
Cash flows from financing activitiesRepayment of loans (160) (434)Proceeds from increase in loans and finance leases 366 93Capital element of finance lease payments (6) (4)Net cash flow from increase/(decrease) in borrowings and finance leases 200 (345)Interest received 14 14Interest paid (64) (84)Interest element of finance lease payments (3) (2)Increase in short-term investments – (1)Issue of ordinary shares (net of expenses) 21 1Purchase of ordinary shares – other (24) (21)Redemption of C Shares (214) (301)Net cash outflow from financing activities (70) (739)
Change in cash and cash equivalents 231 (691)Cash and cash equivalents at 1 January 2,771 3,176Exchange (losses)/gains on cash and cash equivalents (69) 286Cash and cash equivalents at 31 December 2,933 2,771
Rolls-Royce Holdings plc Annual Report 2017 119Financial StatementsConsolidated Cash Flow Statement
FINA
NC
IAL STATEM
ENTS

2017£m
2016£m
Reconciliation of movements in cash and cash equivalents to movements in net fundsChange in cash and cash equivalents 231 (691)Cash flow from (increase)/decrease in borrowings and finance leases (200) 345Cash flow from increase in short-term investments – 1Change in net funds resulting from cash flows 31 (345)Net funds (excluding cash and cash equivalents) on acquisition of ITP Aero (34) –Net funds (excluding cash and cash equivalents) of previously unconsolidated subsidiary (18) –Net funds (excluding cash and cash equivalents) of joint ventures reclassified as joint operations – (9)Exchange (losses)/gains on net funds (59) 240Fair value adjustments 131 (345)Movement in net funds 51 (459)Net funds at 1 January excluding the fair value of swaps (583) (124)Net funds at 31 December excluding the fair value of swaps (532) (583)Fair value of swaps hedging fixed rate borrowings 227 358Net funds at 31 December (305) (225)
The movement in net funds (defined by the Group as including the items shown below) is as follows:
At 1 January
2017£m
Fundsflow£m
Net funds onacquisition of
business£m
Net funds onconsolidation of
previouslyunconsolidated
subsidiary £m
Exchange differences
£m
Fair value adjustments
£mReclassifications
£m
At31 December
2017£m
Cash at bank and in hand 872 (5) – – (29) – – 838 Money-market funds 552 44 – – (7) – – 589 Short-term deposits 1,347 212 – – (33) – – 1,526 Overdrafts – (20) – – – – – (20)Cash and cash equivalents 2,771 231 – – (69) – – 2,933 Short-term investments 3 – – – – – – 3 Other current borrowings (169) 159 (6) (18) 3 – (8) (39)Non-current borrowings (3,121) (280) (28) – (2) 131 8 (3,292)Finance leases (67) (79) – – 9 – – (137)Financial liabilities (3,357) (200) (34) (18) 10 131 – (3,468)Net funds excluding fair value swaps (583) 31 (34) (18) (59) 131 – (532)Fair value of swaps hedging fixed rate borrowings 358 (131) 227 Net funds (225) 31 (34) (18) (59) – – (305)
Consolidated Cash Flow Statement continuedFor the year ended 31 December 2017
120 Rolls-Royce Holdings plc Annual Report 2017Financial StatementsConsolidated Cash Flow Statement
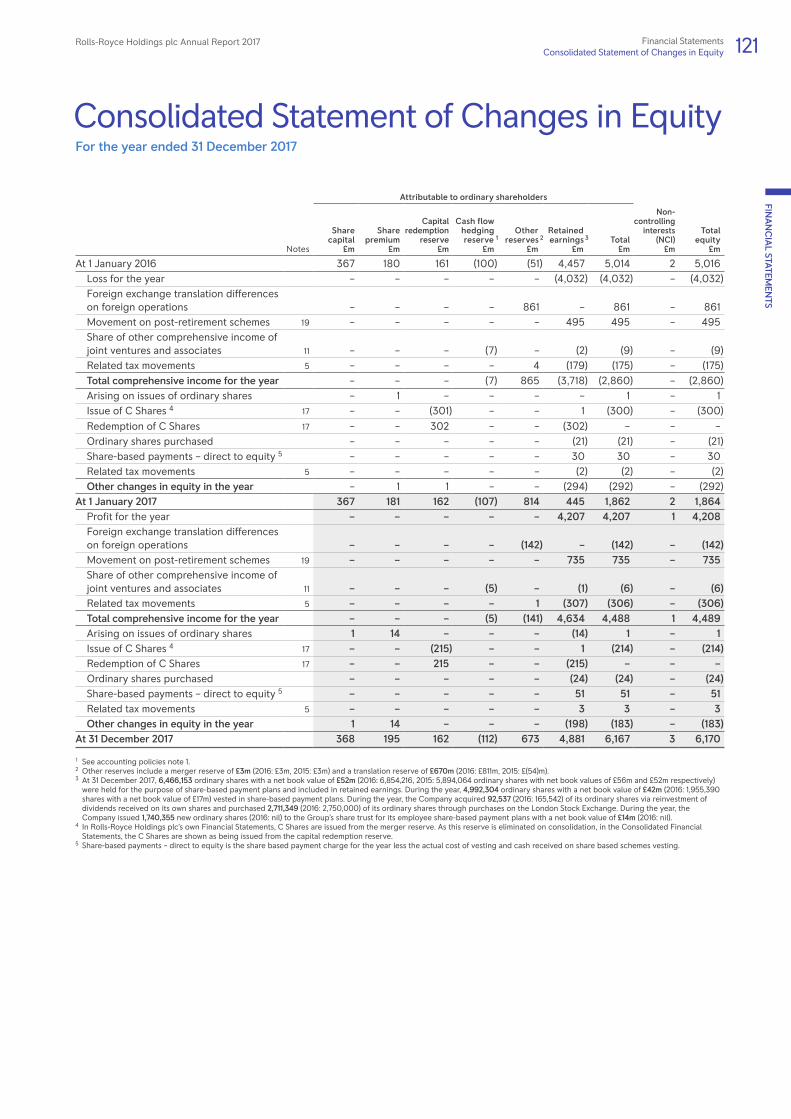
Consolidated Statement of Changes in EquityFor the year ended 31 December 2017
Attributable to ordinary shareholders
Notes
Share capital
£m
Share premium
£m
Capitalredemption
reserve£m
Cash flow hedging reserve 1
£m
Other reserves 2
£m
Retained earnings 3
£mTotal
£m
Non-controlling
interests (NCI)
£m
Totalequity
£m
At 1 January 2016 367 180 161 (100) (51) 4,457 5,014 2 5,016Loss for the year – – – – – (4,032) (4,032) – (4,032)Foreign exchange translation differences on foreign operations – – – – 861 – 861 – 861Movement on post-retirement schemes 19 – – – – – 495 495 – 495Share of other comprehensive income of joint ventures and associates 11 – – – (7) – (2) (9) – (9)Related tax movements 5 – – – – 4 (179) (175) – (175)Total comprehensive income for the year – – – (7) 865 (3,718) (2,860) – (2,860)Arising on issues of ordinary shares – 1 – – – – 1 – 1Issue of C Shares 4 17 – – (301) – – 1 (300) – (300)Redemption of C Shares 17 – – 302 – – (302) – – –Ordinary shares purchased – – – – – (21) (21) – (21)Share-based payments – direct to equity 5 – – – – – 30 30 – 30Related tax movements 5 – – – – – (2) (2) – (2)Other changes in equity in the year – 1 1 – – (294) (292) – (292)
At 1 January 2017 367 181 162 (107) 814 445 1,862 2 1,864Profit for the year – – – – – 4,207 4,207 1 4,208Foreign exchange translation differences on foreign operations – – – – (142) – (142) – (142)Movement on post-retirement schemes 19 – – – – – 735 735 – 735 Share of other comprehensive income of joint ventures and associates 11 – – – (5) – (1) (6) – (6)Related tax movements 5 – – – – 1 (307) (306) – (306)Total comprehensive income for the year – – – (5) (141) 4,634 4,488 1 4,489Arising on issues of ordinary shares 1 14 – – – (14) 1 – 1 Issue of C Shares 4 17 – – (215) – – 1 (214) – (214)Redemption of C Shares 17 – – 215 – – (215) – – – Ordinary shares purchased – – – – – (24) (24) – (24)Share-based payments – direct to equity 5 – – – – – 51 51 – 51 Related tax movements 5 – – – – – 3 3 – 3 Other changes in equity in the year 1 14 – – – (198) (183) – (183)
At 31 December 2017 368 195 162 (112) 673 4,881 6,167 3 6,170
1 See accounting policies note 1.2 Other reserves include a merger reserve of £3m (2016: £3m, 2015: £3m) and a translation reserve of £670m (2016: £811m, 2015: £(54)m).3 At 31 December 2017, 6,466,153 ordinary shares with a net book value of £52m (2016: 6,854,216, 2015: 5,894,064 ordinary shares with net book values of £56m and £52m respectively) were held for the purpose of share-based payment plans and included in retained earnings. During the year, 4,992,304 ordinary shares with a net book value of £42m (2016: 1,955,390 shares with a net book value of £17m) vested in share-based payment plans. During the year, the Company acquired 92,537 (2016: 165,542) of its ordinary shares via reinvestment of dividends received on its own shares and purchased 2,711,349 (2016: 2,750,000) of its ordinary shares through purchases on the London Stock Exchange. During the year, the Company issued 1,740,355 new ordinary shares (2016: nil) to the Group’s share trust for its employee share-based payment plans with a net book value of £14m (2016: nil).
4 In Rolls-Royce Holdings plc’s own Financial Statements, C Shares are issued from the merger reserve. As this reserve is eliminated on consolidation, in the Consolidated Financial Statements, the C Shares are shown as being issued from the capital redemption reserve.
5 Share-based payments – direct to equity is the share based payment charge for the year less the actual cost of vesting and cash received on share based schemes vesting.
Rolls-Royce Holdings plc Annual Report 2017 121Financial StatementsConsolidated Statement of Changes in Equity
FINA
NC
IAL STATEM
ENTS

Notes to the Consolidated Financial Statements1 Accounting policies
The CompanyRolls-Royce Holdings plc (the ‘Company’) is a company domiciled in the United Kingdom. The Consolidated Financial Statements of the Company for the year ended 31 December 2017 consist of the consolidation of the Financial Statements of the Company and its subsidiaries (together referred to as the ‘Group’) and include the Group’s interest in jointly controlled and associated entities.
Basis of preparation and statement of complianceIn accordance with European Union (EU) regulations, these Financial Statements have been prepared in accordance with International Financial Reporting Standards (IFRS) issued by the International Accounting Standards Board (IASB), as adopted for use in the EU effective at 31 December 2017 (Adopted IFRS).
The Company has elected to prepare its individual Company Financial Statements under FRS 101 Reduced Disclosure Framework. They are set out on pages 172 to 174 and the accounting policies in respect of Company Financial Statements are set out on page 173.
These Consolidated Financial Statements have been prepared on the historical cost basis except where Adopted IFRS requires the revaluation of financial instruments to fair value and certain other assets and liabilities on an alternative basis – most significantly post-retirement scheme obligations are valued on the basis required by IAS 19 Employee Benefits – and on a going concern basis as described on page 63.
The Consolidated Financial Statements are presented in sterling which is the Company’s functional currency.
The preparation of Financial Statements in conformity with Adopted IFRS requires management to make judgements and estimates that affect the reported amounts of assets and liabilities at the date of the Financial Statements and the reported amounts of revenue and expenses during the reporting period. Actual results could differ from those estimates.
Key areas of judgement
IntroductionThe Group generates a significant portion of its revenue and profit on aftermarket arrangements arising from the installed original equipment (OE) fleet. As a consequence, the Group will often agree contractual prices for OE deliveries that take into account the anticipated aftermarket arrangements. Accounting policies reflect this aspect of the business model, in particular the policies for the recognition of contractual aftermarket rights and the linkage of OE and actual aftermarket arrangements.
When a civil large engine is sold, the economic benefits received usually far exceed the cash receivable under the contract, due to the rights to valuable aftermarket spare parts business. However, because the value of this right cannot be estimated with enough precision, accounting standards require that the revenue recognised in the accounts on sale of the engine is restricted to a total amount that results in a break even position. The amount of the revenue recognised in excess of cash receivable is recognised as an intangible asset, which is called a contractual aftermarket right (CAR).
There is only one circumstance where accounting standards require the recognition of more of the value of the aftermarket rights when an engine is sold. This occurs where a long-term aftermarket contract (generally a TotalCare agreement – TCA) and an engine sale contract have been negotiated together. In this circumstance, the part of the aftermarket rights covered by the TCA can be valued much more precisely and is recognised at the time of the engine sale through accounting for the engine sale and TCA as a single contract. Nevertheless, the accounting profit recognised is still less than the economic benefits on the sale as there will be other valuable aftermarket rights (for instance for the period beyond the TCA term or for the sale of parts which are outside the scope of the TCA) which cannot be recognised.
The Group enters into arrangements with long-term suppliers to share the risks and rewards of major programmes – risk and revenue sharing arrangements (RRSAs). The accounting policy for these arrangements has been chosen, consistent with Adopted IFRS, to reflect their commercial effect.
The key judgements in determining these accounting policies are described below.
Contractual aftermarket rights On delivery of Civil Aerospace engines, the Group has contractual rights to supply aftermarket parts to the customers and its intellectual rights, warranty arrangements and, where relevant, statutory airworthiness or other regulatory requirements provide reasonable control over this supply. The Directors consider that these rights meet the definition of an intangible asset in IAS 38 Intangible Assets. However, the Directors do not consider that it is possible to determine a reliable fair value for this intangible asset. Accordingly, an intangible asset (CAR) is only recognised on the occasions where the contractual price of the engine is below the cost of manufacture and then only to the extent of this deficit, as this amount is reliably measurable. An equal amount of revenue is recognised at the same point. Where a long-term aftermarket contract is linked to the OE contract (see page 123), the contractual price of the engine (including amounts allocated from the aftermarket contract) is above its cost of manufacture; consequently no CAR is recognised.
Measure of performance on long-term aftermarket contractsA large proportion of the Group’s activities relate to long-term aftermarket contracts, in particular TotalCare and similar arrangements in Civil Aerospace. Under these contracts, the Group’s primary obligation is to maintain customers’ equipment in an operational condition and it achieves this by undertaking various activities, such as engine monitoring, line maintenance and repair and overhaul, over the
122 Rolls-Royce Holdings plc Annual Report 2017Financial StatementsNotes to the Consolidated Financial Statements

1 Accounting policies continuedperiod of the contract. In general, the Directors consider that the stage of performance of the contract should be by reference to the obligation to maintain an operational fleet and that this is best measured by the operation of the fleet. Accordingly, stage of performance is measured by reference to flying hours of each fleet under contract. Consistent with the above, the Directors also consider that, in general, all costs incurred to meet the primary obligation should be included in the accounting for these contracts, even if these costs had not been originally anticipated. This includes the additional costs being incurred to address the Trent 1000 and Trent 900 in-service issues. (In contrast, provision is made when additional costs on non long-term contract arrangements are identified.)
Linkage of OE and long-term aftermarket contracts Where the key terms of a long-term aftermarket contract are substantively agreed (e.g. in a term sheet) at the same time as an OE contract with the operator, the Directors consider these to be linked for accounting purposes and they are treated as a single contract, as this best reflects the overall commercial effect. Where the OE contract is not with the operator (e.g. where it is with an OE manufacturer or a lessor) the contracts are not linked as they were not negotiated on a unified basis.
Sales of spare engines to joint venturesWhether the sales price reflects fair value when the Group sells spare engines to a joint venture company.
Risk and revenue sharing arrangementsRRSAs with key suppliers (workshare partners) are a feature of our Civil Aerospace business. Under these contractual arrangements, the key commercial objectives are that: (i) during the development phase the workshare partner shares in the risks of developing an engine by performing its own development work, providing development parts and paying a non-refundable cash entry fee; and (ii) during the production phase it supplies components in return for a share of the programme revenue as a ‘life of type’ supplier (i.e. as long as the engine remains in service). The share of development costs borne by the workshare partner and of the revenue it receives reflect the partner’s proportionate cost of providing its production parts compared to the overall manufacturing cost of the engine. The share is based on a jointly-agreed forecast at the commencement of the arrangement.
These arrangements are complex and have features that could be indicative of: a collaboration agreement, including sharing of risk and cost in a development programme; a long-term supply agreement; sharing of intellectual property; or a combination of these. In summary, and as described below, the Directors’ view is that the development and production phases of the contract should be considered separately in accounting for the RRSA, which results in the entry fee being matched against the non-recurring costs incurred by the Group.
Having considered the features above, the Directors consider that there is no directly applicable IFRS to determine an accounting policy for the recognition of entry fees of this nature in the income statement. Consequently, in developing an accounting treatment for such entry fees that best reflects the commercial objectives of the contractual arrangement, the Directors have analysed these features in the context of relevant accounting pronouncements (including those of other standard setters where these do not conflict with IFRS) and have weighed the importance of each feature in faithfully representing the overall commercial effect. The most important considerations that need to be balanced are: the transfer of development risk; the workshare partner receiving little standalone value from the payment of the entry fee; and the overall effect being collaboration between the parties which falls short of being a joint venture as the Group controls the programme. Also important in the analysis is the fact that, whilst the Group and the workshare partner share risks and rewards through the life of the contract, these risks and rewards are very different during the development and production phases.
In this context, the entry fee might be considered to represent: an amount paid as an equalisation of development costs; a payment to secure a long-term supply arrangement; a purchase of intellectual property; or some combination thereof. The accounting under these different scenarios could include: recognition of the entry fee to match the associated costs in the income statement; being spread over the life of the programme as a reduction in the cost of supply during production; or being spread over the time period of the access to the intellectual property by the workshare partner.
The Directors consider that the most important features of the arrangement are the risk sharing and that the entry fee represents a contribution to the development costs that the Group incurs in excess of its proportionate programme share. The key judgements taken in reaching this view are: the entry fee is determined by the parties on that basis and the contract specifies that, in the event that a derivative engine is to be developed, additional entry fees will also be calculated on this basis; the workshare partners describe the entry fee in this way; although the workshare partner receives little stand-alone value from paying the entry fee, the entry fee together with its own development activities represent its aggregate investment in the collaboration; the amount of the entry fee does not include any amount in excess of that necessary to equalise forecast development costs; the Group is not ‘on risk’ for the full development costs it incurs but for that amount less the entry fees received.
The resulting accounting policy (described on page 126) represents the commercial effect of the contractual arrangements in that the Group recognises only those development costs to which it is exposed (and thus reflects the significant transfer of development risk to the workshare partner) and the costs of supply of parts during the production phase is measured at the workshare partner’s share of programme revenue (which we consider to be a commercial fair value). The Directors do not consider that accounting which would result in entry fees only being recognised in the production phase would appropriately reflect the sharing of development risk. Accordingly, the Directors believe that the policy adopted best reflects the commercial objectives of the arrangements, the nature of the relationship with the workshare partner and is in accordance with Adopted IFRS.
Rolls-Royce Holdings plc Annual Report 2017 123Financial StatementsNotes to the Consolidated Financial Statements
FINA
NC
IAL STATEM
ENTS
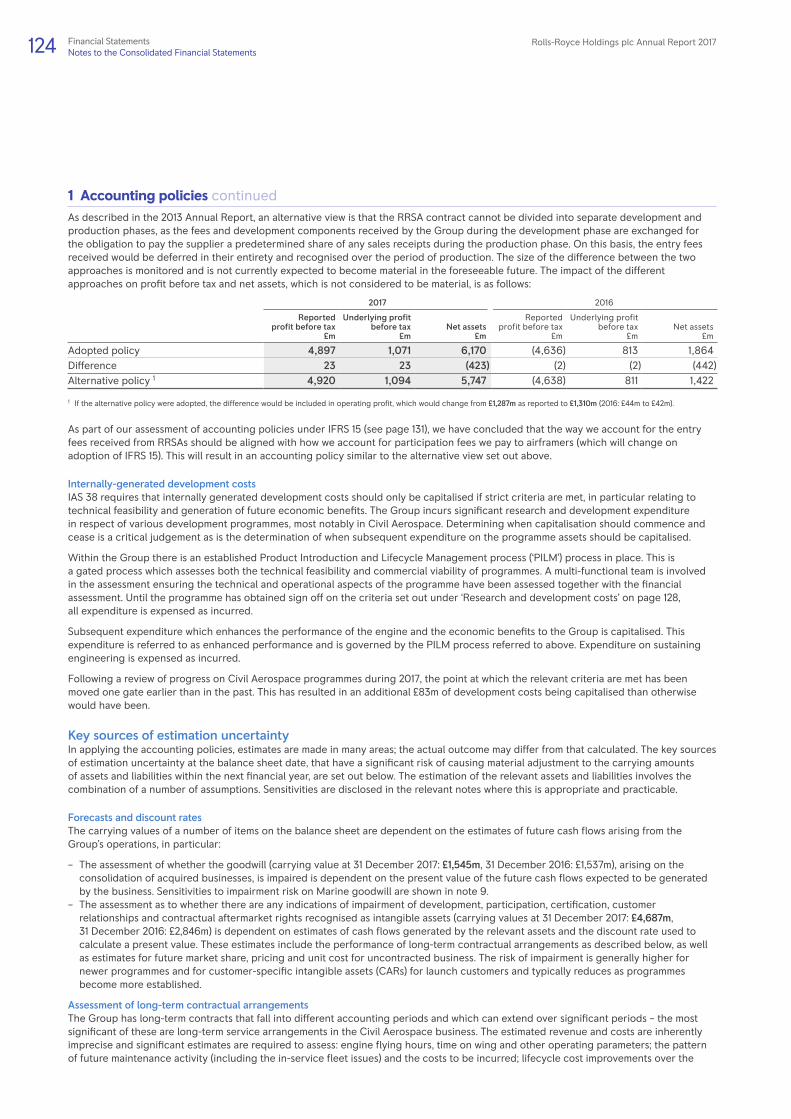
1 Accounting policies continuedAs described in the 2013 Annual Report, an alternative view is that the RRSA contract cannot be divided into separate development and production phases, as the fees and development components received by the Group during the development phase are exchanged for the obligation to pay the supplier a predetermined share of any sales receipts during the production phase. On this basis, the entry fees received would be deferred in their entirety and recognised over the period of production. The size of the difference between the two approaches is monitored and is not currently expected to become material in the foreseeable future. The impact of the different approaches on profit before tax and net assets, which is not considered to be material, is as follows:
2017 2016
Reported profit before tax
£m
Underlying profit before tax
£mNet assets
£m
Reported profit before tax
£m
Underlying profit before tax
£mNet assets
£m
Adopted policy 4,897 1,071 6,170 (4,636) 813 1,864Difference 23 23 (423) (2) (2) (442)Alternative policy 1 4,920 1,094 5,747 (4,638) 811 1,422
1 If the alternative policy were adopted, the difference would be included in operating profit, which would change from £1,287m as reported to £1,310m (2016: £44m to £42m).
As part of our assessment of accounting policies under IFRS 15 (see page 131), we have concluded that the way we account for the entry fees received from RRSAs should be aligned with how we account for participation fees we pay to airframers (which will change on adoption of IFRS 15). This will result in an accounting policy similar to the alternative view set out above.
Internally-generated development costsIAS 38 requires that internally generated development costs should only be capitalised if strict criteria are met, in particular relating to technical feasibility and generation of future economic benefits. The Group incurs significant research and development expenditure in respect of various development programmes, most notably in Civil Aerospace. Determining when capitalisation should commence and cease is a critical judgement as is the determination of when subsequent expenditure on the programme assets should be capitalised.
Within the Group there is an established Product Introduction and Lifecycle Management process (‘PILM’) process in place. This is a gated process which assesses both the technical feasibility and commercial viability of programmes. A multi-functional team is involved in the assessment ensuring the technical and operational aspects of the programme have been assessed together with the financial assessment. Until the programme has obtained sign off on the criteria set out under ‘Research and development costs’ on page 128, all expenditure is expensed as incurred.
Subsequent expenditure which enhances the performance of the engine and the economic benefits to the Group is capitalised. This expenditure is referred to as enhanced performance and is governed by the PILM process referred to above. Expenditure on sustaining engineering is expensed as incurred.
Following a review of progress on Civil Aerospace programmes during 2017, the point at which the relevant criteria are met has been moved one gate earlier than in the past. This has resulted in an additional £83m of development costs being capitalised than otherwise would have been.
Key sources of estimation uncertaintyIn applying the accounting policies, estimates are made in many areas; the actual outcome may differ from that calculated. The key sources of estimation uncertainty at the balance sheet date, that have a significant risk of causing material adjustment to the carrying amounts of assets and liabilities within the next financial year, are set out below. The estimation of the relevant assets and liabilities involves the combination of a number of assumptions. Sensitivities are disclosed in the relevant notes where this is appropriate and practicable.
Forecasts and discount ratesThe carrying values of a number of items on the balance sheet are dependent on the estimates of future cash flows arising from the Group’s operations, in particular:
– The assessment of whether the goodwill (carrying value at 31 December 2017: £1,545m, 31 December 2016: £1,537m), arising on the consolidation of acquired businesses, is impaired is dependent on the present value of the future cash flows expected to be generated by the business. Sensitivities to impairment risk on Marine goodwill are shown in note 9.
– The assessment as to whether there are any indications of impairment of development, participation, certification, customer relationships and contractual aftermarket rights recognised as intangible assets (carrying values at 31 December 2017: £4,687m, 31 December 2016: £2,846m) is dependent on estimates of cash flows generated by the relevant assets and the discount rate used to calculate a present value. These estimates include the performance of long-term contractual arrangements as described below, as well as estimates for future market share, pricing and unit cost for uncontracted business. The risk of impairment is generally higher for newer programmes and for customer-specific intangible assets (CARs) for launch customers and typically reduces as programmes become more established.
Assessment of long-term contractual arrangementsThe Group has long-term contracts that fall into different accounting periods and which can extend over significant periods – the most significant of these are long-term service arrangements in the Civil Aerospace business. The estimated revenue and costs are inherently imprecise and significant estimates are required to assess: engine flying hours, time on wing and other operating parameters; the pattern of future maintenance activity (including the in-service fleet issues) and the costs to be incurred; lifecycle cost improvements over the
124 Rolls-Royce Holdings plc Annual Report 2017Financial StatementsNotes to the Consolidated Financial Statements

1 Accounting policies continuedterm of the contracts and escalation of revenue and costs. The estimates take account of the inherent uncertainties and the risk of non-recovery of any resulting contract balances. In addition, many of the revenues and costs are denominated in currencies other than that of the relevant Group undertaking.
These are translated at an estimated long-term exchange rate, based on historical trends. In 2016, the US dollar long-term exchange rate was reduced by five cents, resulting in a one-off benefit to profit before tax of £35m.
Post-retirement benefitsThe Group’s defined benefit pension schemes and similar arrangements are assessed annually in accordance with IAS 19. The accounting valuation, which is based on assumptions determined with independent actuarial advice, resulted in a net surplus of £738m before deferred taxation being recognised on the balance sheet at 31 December 2017 (31 December 2016: net deficit £29m). The size of the net surplus/deficit is sensitive to the market value of the assets held by the schemes and to actuarial assumptions, which include price inflation, pension and salary increases, the discount rate used in assessing actuarial liabilities, mortality and other demographic assumptions and the levels of contributions. Further details and sensitivities are included in note 19.
ProvisionsAs described in the accounting policy on page 129, the Group measures provisions (carrying value at 31 December 2017: £883m, 31 December 2016: £759m) at the Directors’ best estimate of the expenditure required to settle the obligation at the balance sheet date. These estimates take account of information available and different possible outcomes.
TaxationThe tax payable on profits is determined based on tax laws and regulations that apply in each of the numerous jurisdictions in which the Group operates. Where the precise impact of these laws and regulations is unclear, or uncertain, then reasonable estimates may be used to determine the tax charge included in the Financial Statements.
The main area of uncertainty is in relation to cross-border transactions, entered into in the normal course of business, as the amount of income or profit taxable in each country involved can be subjective and therefore open to interpretation by the relevant tax authorities. This can result in disputes and possibly litigation.
Tax provisions require management to make judgements and estimates of exposures in relation to tax audit issues and other areas of uncertainty. Contingent liabilities in respect of any tax disputes or litigation, are covered in note 23. All provisions are in current liabilities.
Deferred tax assets are recognised to the extent it is probable that future taxable profits will be available, against which the deductible temporary difference can be utilised, based on management’s assumptions relating to the amounts and timing of future taxable profits.
Further details on the Group’s tax position can be found on page 196.
Significant accounting policiesThe Group’s significant accounting policies are set out below. These accounting policies have been applied consistently to all periods presented in these Consolidated Financial Statements and by all Group entities.
Basis of consolidationThe Group Consolidated Financial Statements include the Financial Statements of the Company and its subsidiary undertakings together with the Group’s share of the results of joint arrangements and associates made up to 31 December. In line with common practice in Germany, a small number of immaterial subsidiaries of Rolls-Royce Power Systems are not consolidated and are carried at cost in other investments. As set out in note 25, ITP Aero was acquired on 19 December 2017. It has been assumed that ITP Aero did not have any significant trading activity between the acquisition date and 31 December 2017.
A subsidiary is an entity controlled by the Company. Control exists when the Company has power over an entity, exposure to variable returns from its involvement with an entity and the ability to use its power over an entity so as to affect the Company’s returns.
A joint arrangement is an entity in which the Group holds a long-term interest and which is jointly controlled by the Group and one or more other venturers under a contractual arrangement. Joint arrangements may be either joint ventures or joint operations. An associate is an entity, being neither a subsidiary nor a joint arrangement, in which the Group holds a long-term interest and where the Group has a significant influence. The results of joint ventures and associates are accounted for using the equity method of accounting. Joint operations are accounted for using proportionate accounting.
Any subsidiary undertaking, joint arrangement or associate sold or acquired during the year are included up to, or from, the date of change of control. Transactions with non-controlling interests are recorded directly in equity.
All intra-group transactions, balances, income and expenses are eliminated on consolidation. Adjustments are made to eliminate the profit or loss arising on transactions with joint arrangements and associates to the extent of the Group’s interest in the entity.
Rolls-Royce Holdings plc Annual Report 2017 125Financial StatementsNotes to the Consolidated Financial Statements
FINA
NC
IAL STATEM
ENTS

1 Accounting policies continuedRevenue recognitionRevenue comprises sales to outside customers after discounts, excluding value added taxes.
Sales of products (both OE and spare parts) are recognised when the significant risks and rewards of ownership of the goods are transferred to the customer, the sales price agreed and the receipt of payment can be assured – this is generally on delivery. On occasion, the Group may participate in the financing of OE, most commonly by the provision of guarantees as described in note 18. In such circumstances, the contingent obligations arising under these arrangements are taken into account in assessing when the significant risks and rewards of ownership have been transferred to the customer. As described on page 122, a sale of OE at a contractual price below its cost of manufacture is considered to give rise to revenue to the extent that an intangible asset (contractual aftermarket right) is recognised at the same time.
Sales of services are recognised by reference to the stage of completion based on services performed to date. As described on page 122, the assessment of the stage of completion is dependent on the nature of the contract, but will generally be based on: flying hours or equivalent for long-term aftermarket arrangements where the service is provided on a continuous basis; costs incurred to the extent these relate to services performed up to the reporting date; or achievement of contractual milestones where relevant.
As described on page 123, sales of products and services are treated as though they are a single contract where these components have been negotiated as a single commercial package and are so closely interrelated that they do not operate independently of each other and are considered to form a single transaction with an overall profit margin. The total revenue is allocated between the two components such that the total agreed discount to list prices is allocated to revenue for each of the two components pro rata, based on list prices. The revenue is then recognised for each component on this basis as the products are delivered and services provided, as described above. Where the contractual price of the OE component is below the revenue allocated from the combined arrangement, this will give rise to an asset included in ‘amounts recoverable on contracts’. This asset reduces as services are provided, increases as costs are incurred, and reduces to zero by the end of the contract. Where the balance is a liability, it is recognised in ‘accruals and deferred income’.
Provided that the outcome of construction contracts can be assessed with reasonable certainty, the revenue and costs on such contracts are recognised based on stage of completion and the overall contract profitability. Full provision is made for any estimated losses to completion of contracts, having regard to the overall substance of the arrangements.
Progress payments received, when greater than recorded revenue, are deducted from the value of work in progress except to the extent that payments on account exceed the value of work in progress on any contract where the excess is included in accruals and deferred income within trade and other payables. The amount by which recorded revenue of long-term contracts is in excess of payments on account is classified as amounts recoverable on contracts and is separately disclosed within trade and other receivables.
TotalCare arrangementsAs described above, these are accounted for on a stage of completion basis, with the stage of completion based on the proportion of flying hours completed compared to the total estimated under the contract. In making the assessment of future revenue, costs and the level of profit recognised the Group takes account of: (i) the forecast utilisation of the engines by the operator; (ii) the forecast costs to maintain the engines in accordance with the contractual requirements – the principal variables being the time between shop visits and the cost of each shop visit; and (iii) the recoverability of any contract asset arising. The Group benchmarks the forecast costs against previous programmes, recognising that the reliability of the forecasts will improve as operational experience of the engine increases. To the extent that actual costs differ from forecast costs or that forecast costs change, the cumulative impact is recognised in the period. An allowance is made against forecast contract revenue given the potential for reduced engine flying hours based on historical forecasting accuracy, the risk of aircraft being parked by the customer and the customer’s creditworthiness. Again, changes in this allowance are recognised in the period.
Risk and revenue sharing arrangementsAs described on page 123, the Group enters into arrangements with certain workshare partners under which these suppliers: (i) contribute to the forecast costs of developing an engine by performing their own development work, providing development parts and paying a non-refundable cash entry fee; and (ii) supply components for the production phase for which they receive consideration, which is an agreed proportion of the total programme revenue. Both the suppliers’ contributions to the forecast non-recurring development costs and their consideration are determined by reference to their proportionate forecast scopes of supply relative to that of the engine overall. Once the forecast costs and the scopes of supply have been agreed at the inception of the contract, each party is then accountable for its own incurred costs. No accounting entries are recorded when the suppliers undertake development work or when development components are supplied. Cash sums received are recognised in the income statement, as a reduction in research and development costs incurred, to match the expensing of the Group’s related costs – where the cash sums are received in advance of the related costs being expensed or where the related costs are capitalised as intangible assets, the recognition of the cash received is deferred (in accruals and deferred income) to match the recognition of the related expense or the amortisation of the related intangible asset respectively. The payments to suppliers of their shares of the programme revenue for their production components are charged to cost of sales as programme revenue arise.
The Group has arrangements with partners who do not undertake development work or supply parts. Such arrangements are considered to be financial instruments as defined by IAS 32 Financial Instruments: Presentation and are accounted for using the amortised cost method.
Government investmentWhere a government or similar body has previously invested in a development programme, the Group treats payments to that body as royalty payments, which are matched to related sales.
126 Rolls-Royce Holdings plc Annual Report 2017Financial StatementsNotes to the Consolidated Financial Statements

1 Accounting policies continuedGovernment grantsGovernment grants are recognised in the income statement so as to match them with the related expenses that they are intended to compensate. Where grants are received in advance of the related expenses, they are included in the balance sheet as deferred income. Non-monetary grants are recognised at fair value.
InterestInterest receivable/payable is credited/charged to the income statement using the effective interest method. Where borrowing costs are attributable to the acquisition, construction or production of a qualifying asset, such costs are capitalised as part of the specific asset.
TaxationThe tax charge/credit on the profit or loss for the year comprises current and deferred tax:
– Current tax is the expected tax payable for the year, using tax rates enacted or substantively enacted at the balance sheet date, and any adjustment to tax payable in respect of previous years.
– Deferred tax is provided using the balance sheet liability method, providing for temporary differences between the carrying amounts of the assets and liabilities for financial reporting purposes and the amounts used for tax purposes and is calculated using the enacted or substantively enacted rates that are expected to apply when the asset or liability is settled.
Tax is charged or credited in the income statement or other comprehensive income (OCI) as appropriate, except when it relates to items credited or charged directly to equity in which case the tax is also dealt with in equity.
Deferred tax liabilities are recognised for taxable temporary differences arising on investments in subsidiaries and joint arrangements, except where the Group is able to control the reversal of the temporary difference and it is probable that the temporary difference will not reverse in the foreseeable future. Deferred tax is not recognised on taxable temporary differences arising on the initial recognition of goodwill or for temporary differences arising from the initial recognition of assets and liabilities in a transaction that is not a business combination and that affects neither accounting nor taxable profit.
Deferred tax assets are recognised only to the extent that it is probable that future taxable profits will be available against which the assets can be utilised.
Foreign currency translationTransactions denominated in currencies other than the functional currency of the transacting Group undertaking are translated into the functional currency at the exchange rates ruling on the date of the transaction. Monetary assets and liabilities denominated in foreign currencies are translated into the relevant functional currency at the rate ruling at the year end. Exchange differences arising on foreign exchange transactions and the retranslation of assets and liabilities into functional currencies at the rate ruling at the year end are taken into account in determining profit before taxation.
The trading results of Group undertakings are translated into sterling at the average exchange rates for the year. The assets and liabilities of overseas undertakings, including goodwill and fair value adjustments arising on acquisition, are translated at the exchange rates ruling at the year end. Exchange adjustments arising from the retranslation of the opening net investments, and from the translation of the profits or losses at average rates, are recognised in OCI. The cumulative amount of exchange adjustments was, on transition to IFRS in 2004, deemed to be nil.
Financial instrumentsIAS 39 Financial Instruments: Recognition and Measurement requires the classification of financial instruments into separate categories for which the accounting requirement is different. The Group has classified its financial instruments as follows:
– Short-term investments are generally classified as available for sale. – Short-term deposits (principally comprising funds held with banks and other financial institutions), trade receivables and short-term investments not designated as available for sale are classified as loans and receivables.
– Borrowings, trade payables, financial RRSAs, and C Shares are classified as other liabilities. – Derivatives, comprising foreign exchange, interest rate and commodity contracts are classified as fair value through profit or loss.
Financial instruments are recognised at the contract date and initially measured at fair value. Their subsequent measurement depends on their classification:
– Available for sale assets are held at fair value. Changes in fair value arising from changes in exchange rates are included in the income statement. All other changes in fair value are taken to equity. On disposal, the accumulated changes in value recorded in equity are included in the gain or loss recorded in the income statement.
– Loans and receivables and other liabilities are held at amortised cost and not revalued (except for changes in exchange rates and forecast contractual cash flows, which are included in the income statement) unless they are included in a fair value hedge accounting relationship. Where such a hedging relationship exists, the instruments are revalued in respect of the risk being hedged, with the change in value included in the income statement.
– Fair value through profit or loss items are held at fair value. Changes in fair value are included in the income statement unless the instrument is included in a cash flow hedge. If the instruments are included in an effective cash flow hedging relationship, changes in value are taken to equity. When the hedged forecast transaction occurs, amounts previously recorded in equity are recognised in the income statement.
Financial instruments are derecognised on expiry or when all contractual rights and obligations are transferred.
Rolls-Royce Holdings plc Annual Report 2017 127Financial StatementsNotes to the Consolidated Financial Statements
FINA
NC
IAL STATEM
ENTS

1 Accounting policies continuedHedge accountingThe Group does not generally apply hedge accounting in respect of forward foreign exchange contracts or commodity swaps held to manage the cash flow exposures of forecast transactions denominated in foreign currencies or in commodities respectively.
The Group applies hedge accounting in respect of transactions entered into to manage the fair value and cash flow exposures of its borrowings. Forward foreign exchange contracts are held to manage the fair value exposures of borrowings denominated in foreign currencies and are designated as fair value hedges. Interest rate swaps are held to manage the interest rate exposures and are designated as fair value or cash flow hedges of fixed and floating rate borrowings respectively.
Changes in the fair values of derivatives designated as fair value hedges and changes in fair value of the related hedged item are recognised directly in the income statement.
Changes in the fair values of derivatives that are designated as cash flow hedges and are effective are recognised directly in equity. Any ineffectiveness in the hedging relationships is included in the income statement. The amounts deferred in equity are recognised in the income statement to match the recognition of the hedged item.
Hedge accounting is discontinued when the hedging instrument expires or is sold, terminated, exercised, or no longer qualifies for hedge accounting. At that time, for cash flow hedges and if the forecast transaction remains probable, any cumulative gain or loss on the hedging instrument recognised in equity is retained in equity until the forecast transaction occurs. If a hedged transaction is no longer expected to occur, the net cumulative gain or loss previously recognised in equity is transferred to the income statement.
The portion of a gain or loss on an instrument used to hedge a net investment in a foreign operation that is determined to be an effective hedge is recognised directly in equity. The ineffective portion is recognised immediately in the income statement. Gains and losses accumulated in the translation reserve will be recycled to profit when the foreign operation is sold.
Business combinations and goodwillOn the acquisition of a business, fair values are attributed to the identifiable assets and liabilities and contingent liabilities. Where fair values of acquired contingent liabilities cannot be measured reliably, the assumed contingent liability is not recognised but is disclosed in the same manner as other contingent liabilities.
Goodwill recognised represents the excess of the fair value of the purchase consideration over the fair value to the Group of the net of the identifiable assets acquired and the liabilities assumed. On transition to IFRS on 1 January 2004, business combinations were not retrospectively adjusted to comply with Adopted IFRS and goodwill was recognised based on the carrying value under the previous accounting policies. Goodwill in respect of the acquisition of a subsidiary is recognised as an intangible asset. Goodwill arising on the acquisition of joint arrangements and associates is included in the carrying value of the investment.
Certification costs and participation feesCosts incurred in respect of meeting regulatory certification requirements for new civil aero engine/aircraft combinations including payments made to airframe manufacturers for this and participation fees are carried forward in intangible assets to the extent that they can be recovered out of future sales and are charged to the income statement over the programme life on a straight-line basis, up to a maximum of 15 years from the entry into service of the product.
Research and developmentIn accordance with IAS 38, expenditure incurred on research and development is distinguished as relating either to a research phase or to a development phase. All research phase expenditure is charged to the income statement. Development expenditure (which predominantly relates to Civil Aerospace engine programmes) is capitalised as an internally generated intangible asset (programme asset) only if it meets strict criteria, relating in particular to technical feasibility and generation of future economic benefits.
More specifically, development costs are capitalised from the point at which the following conditions have been met:
– the technical feasibility of completing the programme and the intention and ability (availability of technical, financial and other resources) to complete the programme asset and use or sell it;
– the probability that future economic benefits will flow from the programme asset; and – the ability to measure reliably the expenditure attributable to the programme asset during its development.
Capitalisation continues until the point at which the programme asset meets its originally contracted technical specification (defined internally as the point at which the asset is capable of operating in the manner intended by management).
Subsequent expenditure is capitalised where it enhances the functionality of the programme asset and demonstrably generates an enhanced economic benefit to the Group. All other subsequent expenditure on programme assets is expensed as incurred.
Development expenditure capitalised is amortised on a straight-line basis up to a maximum of 15 years from the entry into service of the programme asset. In accordance with IAS 38, we assess the basis on which we amortise programme assets annually. At the end of 2017, we confirmed that we will commence amortisation of programme assets on a 15 year straight-line basis pro rata over the estimated number of units produced. We will apply this approach prospectively from 1 January 2018.
128 Rolls-Royce Holdings plc Annual Report 2017Financial StatementsNotes to the Consolidated Financial Statements
1 Accounting policies continuedContractual aftermarket rightsAs described under key judgements on page 122, the Group may sell OE to customers at a price below its cost, on the basis that it also receives valuable aftermarket rights. Such a sale is considered to give rise to an intangible asset which is recognised, in accordance with IAS 38, at the same time as the revenue at an amount equal to the cash deficit and is amortised on a straight-line basis over the period that highly probable aftermarket sales are expected to be earned.
Customer relationshipsThe fair value of customer relationships recognised as a result of a business combination relate to the acquired company’s established relationships with its existing customers that result in repeat purchases and customer loyalty. Amortisation occurs on a straight-line basis over its useful economic life, up to a maximum of 15 years.
Software The cost of acquiring software that is not specific to an item of property, plant and equipment is classified as an intangible asset and amortised on a straight-line basis over its useful economic life, up to a maximum of five years.
Property, plant and equipmentProperty, plant and equipment are stated at cost less accumulated depreciation and any provision for impairment in value.
Depreciation is provided on a straight-line basis to write off the cost, less the estimated residual value, of property, plant and equipment over their estimated useful lives. No depreciation is provided on assets in the course of construction. Estimated useful lives are as follows:
– Land and buildings, as advised by the Group’s professional advisers: – freehold buildings – five to 45 years (average 26 years); – leasehold buildings – lower of adviser’s estimates or period of lease; and – no depreciation is provided on freehold land.
– Plant and equipment – five to 25 years (average 12 years). – Aircraft and engines – five to 20 years (average 13 years).
Where the Group obtains effective control of customers’ installed engines as a result of a TotalCare Flex arrangement, the fair value of these engines is recognised as an addition (shown separately in note 10). The corresponding liability is recognised either as deferred revenue or a financial liability depending on the precise nature of the arrangement.
Operating leasesPayments made and rentals received under operating lease arrangements are charged/credited to the income statement on a straight-line basis.
Impairment of non-current assetsImpairment of non-current assets is considered in accordance with IAS 36 Impairment of Assets. Where the asset does not generate cash flows that are independent of other assets, impairment is considered for the cash-generating unit to which the asset belongs. Goodwill and intangible assets not yet available for use are tested for impairment annually. Other intangible assets, property, plant and equipment and investments are assessed for any indications of impairment annually. If any indication of impairment is identified, an impairment test is performed to estimate the recoverable amount.
If the recoverable amount of an asset (or cash-generating unit) is estimated to be below the carrying value, the carrying value is reduced to the recoverable amount and the impairment loss is recognised as an expense. The recoverable amount is the higher of value in use or fair value less costs to sell, if this is readily available. The value in use is the present value of future cash flows using a pre-tax discount rate that reflects the time value of money and the risk specific to the asset.
InventoriesInventories and work in progress are valued at the lower of cost and net realisable value. Cost comprises direct materials and, where applicable, direct labour costs and those overheads, including depreciation of property, plant and equipment, that have been incurred in bringing the inventories to their present location and condition. Net realisable value represents the estimated selling prices less all estimated costs of completion and costs to be incurred in marketing, selling and distribution.
Cash and cash equivalentsCash and cash equivalents include cash at bank and in hand, investments in money-market funds and short-term deposits with a maturity of three months or less on inception. The Group considers overdrafts (repayable on demand) to be an integral part of its cash management activities and these are included in cash and cash equivalents for the purposes of the cash flow statement.
ProvisionsProvisions are recognised when the Group has a present obligation as a result of a past event, and it is probable that the Group will be required to settle that obligation. Provisions are measured at the Directors’ best estimate of the expenditure required to settle the obligation at the balance sheet date, and are discounted to present value where the effect is material.
Rolls-Royce Holdings plc Annual Report 2017 129Financial StatementsNotes to the Consolidated Financial Statements
FINA
NC
IAL STATEM
ENTS

1 Accounting policies continuedPost-retirement benefitsPensions and similar benefits (principally healthcare) are accounted for under IAS 19.
For defined benefit plans, obligations are measured at discounted present value, using a discount rate derived from high-quality corporate bonds denominated in the currency of the plan, whilst plan assets are recorded at fair value. Surpluses in schemes are recognised as assets only if they represent economic benefits available to the Group in the future. A liability is recognised to the extent that the minimum funding requirements in respect of past service will give rise to an unrecognisable surplus.
The service and financing costs of such plans are recognised separately in the income statement: – current service costs are spread systematically over the lives of employees; – past service costs and settlements are recognised immediately; and – financing costs are recognised in the periods in which they arise.
Actuarial gains and losses and movements in unrecognised surpluses and minimum funding liabilities are recognised immediately in OCI.
Payments to defined contribution schemes are charged as an expense as they fall due.
Share-based paymentsThe Group provides share-based payment arrangements to certain employees. These are principally equity-settled arrangements and are measured at fair value (excluding the effect of non-market based vesting conditions) at the date of grant. The fair value is expensed on a straight-line basis over the vesting period. The amount recognised as an expense is adjusted to reflect the actual number of shares or options that will vest, except where additional shares vest as a result of the total shareholder return (TSR) performance condition in the Performance Share Plan (PSP).
Cash-settled share options (grants in the International Sharesave plan) are measured at fair value at the balance sheet date. The Group recognises a liability at the balance sheet date based on these fair values, taking into account the estimated number of options that will actually vest and the relative completion of the vesting period. Changes in the value of this liability are recognised in the income statement for the year.
The cost of shares of Rolls-Royce Holdings plc held by the Group for the purpose of fulfilling obligations in respect of employee share plans is deducted from equity in the consolidated balance sheet. See note 21 for a further description of the share-based payment plans.
Customer financing supportIn connection with the sale of its products, the Group will, on occasion, provide financing support for its customers. These arrangements fall into two categories: credit-based guarantees and asset-value guarantees. In accordance with the requirements of IAS 39 and IFRS 4 Insurance Contracts, credit-based guarantees are treated as insurance contracts. The Group considers asset-value guarantees to be non-financial liabilities and accordingly these are also treated as insurance contracts. As described on page 158, the Directors consider the likelihood of crystallisation in assessing whether provision is required for any contingent liabilities.
The Group’s contingent liabilities relating to financing arrangements are spread over many years and relate to a number of customers and a broad product portfolio, and are reported on a discounted basis.
Revisions to Adopted IFRS in 2017There were no changes to accounting standards that had a material impact on the 2017 Consolidated Financial Statements.
Revisions to IFRS not applicable in 2017Standards and interpretations issued by the IASB are only applicable if endorsed by the EU.
IFRS 9 Financial InstrumentsIFRS 9 (effective for the year beginning 1 January 2018) relates to the accounting for financial instruments and covers: classification and measurement; impairment; and hedge accounting. Except for hedge accounting, retrospective application is required with any adjustment being made to reserves on 1 January 2018. The Group is not required to restate 2017 comparative information and is analysing the impact of adoption on its Financial Statements. This is not expected to be material.
– The Group can sell its trade receivables from certain customers before their due date. The trade receivables of these customers that are not sold will be classified and disclosed as fair value through other comprehensive income from 2018. This will not have a significant impact on the income statement.
– The Group will adopt the simplified approach to provide for losses on receivables and contract assets resulting from transactions within the scope of IFRS 15. The Group has performed a preliminary assessment of the adoption of the standard on the basis of average default risk of customers and will continue to analyse the impact during 2018. We do not anticipate that this will have a significant impact on the income statement.
– The Group has determined that all existing effective hedging relationship will continue to qualify for hedge accounting under IFRS 9. We will continue not to hedge account for forecast foreign exchange transactions. This will not have an impact on the Financial Statements.
130 Rolls-Royce Holdings plc Annual Report 2017Financial StatementsNotes to the Consolidated Financial Statements

1 Accounting policies continuedIFRS 15 Revenue from Contracts with CustomersIFRS 15 provides a single, principles based five-step model to be applied to all sales contracts. It is based on the transfer of control of goods and services to customers and replaces the separate models for goods, services and construction contracts currently included in IAS 11 Construction Contracts and IAS 18 Revenue. There are three broad implications:
– linked accounting will cease to exist so all OE sales will be treated on the same basis; – OE engine cash deficits will no longer be capitalised and recorded as contractual aftermarket rights, they will instead be recognised on delivery; and
– revenue and profits for aftermarket services will be recognised on an activity basis as costs are incurred.
The Group will adopt IFRS 15 on 1 January 2018 using the ‘full’ retrospective approach. The Group has undertaken significant analysis on the impact of IFRS 15 and the most significant accounting judgements, estimates and policies are set out below. Work will continue during 2018 to review and refine policies and procedures required to implement IFRS 15. As a result it is possible that there may be some changes to the impact reported.
Key areas of judgement:Determining the timing of satisfaction of performance obligations: – Where the performance obligation is the supply of goods (principally OE and spare parts) which is satisfied at the point in time that those goods are transferred to the customer, the Group will recognise revenue at that point in time.
– The Group generates a significant proportion of its revenue and profit from aftermarket arrangements arising from the use of the installed OE. These aftermarket contracts, such as TotalCare and CorporateCare agreements in Civil Aerospace, cover a range of services and generally have contractual terms covering more than one year. Under these contracts, the Group’s primary obligation is to maintain customers’ equipment in an operational condition and this is achieved by undertaking various activities, such as repair, overhaul and engine monitoring over the period of the contract. Revenue on these contracts is recognised over the period of the contract and the measure of performance is a matter of judgement. In general, the Directors consider that the stage of performance of the contract is best measured by using the actual costs incurred to date compared to the estimated costs to complete the performance obligations.
– The assessment of stage of completion is generally measured for each contract. However, in certain cases, such as for CorporateCare agreements where there are many contracts covering aftermarket services, each for a small number of engines, the Group will apply the practical expedient offered by IFRS 15 to account for a portfolio of contracts together as it expects that the effects on the Financial Statements would not differ materially from applying the standard to the individual contracts in the portfolio.
The Group has paid participation fees to airframe manufacturers, its customers for OE on certain programmes. Amounts paid are initially treated as contract assets and subsequently charged as a reduction to the OE revenue when it is transferred to the customer. The number of units over which the asset will be charged is a matter of judgement as the orders will grow over the course of the programme.
In assessing the accounting for the participation fee payments we make to our OE customers, we have also assessed the accounting for up-front payments we sometimes receive from the Group’s suppliers under RRSAs to allow them to participate in an engine programme. We have concluded that, consistent with changes to how we will account for participation fees noted above, these receipts should be deferred and recognised against cost of sales over the period of supply. This will also require judgement as to the number of units over which the receipts will be allocated.
The Group has elected to use the practical expedient to expense as incurred any incremental costs of obtaining or fulfilling a contract if the amortisation period of an asset created would have been one year or less.
Key sources of estimation uncertainty:Assessment of long-term contractual arrangements. – The estimated revenue and costs under such agreements are inherently imprecise and significant estimates are required to take into account uncertainties relating to: (i) the forecast utilisation of the engines by the operator and related pricing; (ii) the frequency of engine overhauls where the principal variables are the operating parameters of the engine and operational lives of components; and (iii) the forecast costs to maintain the engines in accordance with the contractual requirements where the cost of each overhaul is dependent on the required work-scope and the cost of parts and labour at the time.
– An allowance is made against the risk of non-recovery of resulting contract balances from reduced utilisation e.g. engine flying hours, based on historical forecasting experience, the risk of aircraft being parked by the customer and the customer’s creditworthiness.
– A significant amount of revenue and cost is denominated in currencies other than that of the relevant Group undertaking. These are translated at estimated long-term exchange rates.
Significant accounting policies:Revenue recognition comprises sales to outside customers after discounts and amounts payable to customers and excludes value added taxes. The Group has elected to use the practical expedient not to adjust revenue for the effect of financing components where the expectation is that the period between the transfer of goods and services to customers and the receipt of payment is less than a year.
Sales of services are recognised by reference to the progress towards complete satisfaction of the performance obligation provided the outcome of contracts can be assessed with reasonable certainty. Full provision is made for any estimated losses to completion of contracts, having regard to the overall substance of the arrangements.
Rolls-Royce Holdings plc Annual Report 2017 131Financial StatementsNotes to the Consolidated Financial Statements
FINA
NC
IAL STATEM
ENTS
1 Accounting policies continuedTotalCare and similar long-term aftermarket service arrangements are accounted for on a stage of completion basis. A contract liability will be created where payment is received ahead of the costs incurred to meet performance obligations. In making the assessment of future revenue, costs and the level of profit recognised, the Group takes account of the inherent uncertainties and the risk of non-recovery of any resulting contract balances. To the extent that actual revenue and costs differ from forecast or that forecasts change, the cumulative impact is recognised in the period. When accounting for a portfolio of long-term service arrangements, such as CorporateCare agreements, the Group uses estimates and assumptions that reflect the size and composition of the portfolio. The new standard has no impact on the timing of the reported cash flows.
The comparative 2017 results to be included in the 2018 Financial Statements will be restated. Certain tables from note 2, have been prepared on the IFRS 15 basis set out above and are shown in note 27. Overall, the adoption of IFRS 15 is expected to result in a reduction in 2017 underlying revenue and operating profit of £1,408m and £854m respectively and a reduction of net assets of £5.2bn at 31 December 2017.
IFRS 16 LeasesIFRS 16 (effective for the year beginning 1 January 2019) will require all leases to be recognised on the balance sheet. Currently, IAS 17 Leases only requires leases categorised as finance leases to be recognised on the balance sheet.
The Group is progressing well in its analysis of how IFRS 16 should be implemented and is developing the data-set, systems and processes that will be required. The most significant leases, by value, relate to property and aircraft engines. The Group expects to apply the standard retrospectively with the cumulative effect of initial application recognised on 1 January 2019. Under this approach the Group will not restate comparative periods.
In broad terms the impact of the standard will be to:
– recognise an additional lease liability equivalent to the present value of the lease commitments at the date of transition. Further work is required to validate the contracts which will represent leases under IFRS 16, including ongoing consideration of some supply chain contracts. The Group is also considering whether there are any re-assessments of lease term required, and the discount rate to be applied. Under the expected transition option, payments will be discounted using incremental borrowing rates at 1 January 2019. The Group holds some leases in non-functional currencies where the value of the lease liability will be dependent on spot exchange rates on transition; and
– recognise a right-of-use asset measured either: as if the standard had applied since commencement of the lease; or at an amount equal to the lease liability on transition.
The Group does not consider that any other standards, amendments or interpretations issued by the IASB, but not yet applicable will have a significant impact on the Financial Statements.
2 Segmental analysisThe analysis by business segment is presented in accordance with IFRS 8 Operating Segments, on the basis of those segments whose operating results are regularly reviewed by the Board (the Chief Operating Decision Maker as defined by IFRS 8), as follows:Civil Aerospace – development, manufacture, marketing and sales of commercial aero engines and aftermarket services.Defence Aerospace – development, manufacture, marketing and sales of military aero engines and aftermarket services.Power Systems – development, manufacture, marketing and sales of reciprocating engines and power systems.Marine – development, manufacture, marketing and sales of marine-power propulsion systems and aftermarket services.Nuclear – development, manufacture, marketing and sales of nuclear systems for civil power generation and naval
propulsion systems.
The operating results are reviewed by the Board and are prepared on an underlying basis, which the Board considers reflects better the economic substance of the Group’s trading during the year and provides financial measures that, together with the results prepared in accordance with Adopted IFRS, allow better analysis of the factors affecting the year’s results compared to the prior year. This approach has been applied consistently. The principles adopted to determine underlying results are:
Underlying revenue and cost of salesWhere revenue and costs are denominated in a currency other than the functional currency of the Group undertaking and the Group hedges the net exposure, these reflect the achieved exchange rates arising on derivative contracts settled to cover the net exposure. This reflects the economic hedging that the Group undertakes. These achieved exchange rates are applied to all relevant revenue and costs, including those for which there is a natural offsetting position, rather than translating the offsetting transactions at spot rates. The underlying profits would be the same under both approaches, but the Board considers that the approach taken provides a better indication of trends over time.
Underlying profit before financingIn addition to the impact of exchange rates on revenue and costs above, adjustments have been made to exclude one-off past service costs or credits on post-retirement schemes, exceptional restructuring costs (associated with the substantial closure or exit of a site, facility or line of business or other major transformation activities), the effect of acquisition accounting (including in 2017, the gains arising on the acquisition of ITP Aero) – so that all segments are measured on a consistent basis, the effect of business disposals, the impairment of goodwill and similar items, and in 2016 financial penalties from agreements with investigating bodies.
132 Rolls-Royce Holdings plc Annual Report 2017Financial StatementsNotes to the Consolidated Financial Statements

2 Segmental analysis continuedUnderlying profit before taxationIn addition to those adjustments in underlying profit before financing:
– includes amounts realised from settled derivative contracts and revaluation of relevant assets and liabilities to exchange rates forecast to be achieved from future settlement of derivative contracts; and
– excludes unrealised amounts arising from revaluations required by IAS 39 Financial Instruments: Recognition and Measurement, changes in value of financial RRSA contracts arising from changes in forecast payments and the net impact of financing costs related to post-retirement scheme benefits.
TaxationThe tax effect of the adjustments above are excluded from the underlying tax charge. In addition, changes in the amount of recoverable advance corporation tax recognised and the impact of changes in tax rates are also excluded.
The tables below and overleaf set out the results of the reportable segments on the basis described above and a reconciliation of these underlying results to those reported in the consolidated income statement.
Civil 1Aerospace
£m
DefenceAerospace
£m
Power Systems
£mMarine
£mNuclear
£m
Inter-segment
£m
Total reportable segments
£m
Year ended 31 December 2017Underlying revenue from sale of original equipment 3,775 928 1,828 534 377 (27) 7,415 Underlying revenue from aftermarket services 4,158 1,264 897 483 430 (37) 7,195 Total underlying revenue at 2016 exchange rates 7,933 2,192 2,725 1,017 807 (64) 14,610 Translation to 2017 exchange rates 90 83 198 60 11 (6) 436 Total underlying revenue at 2017 exchange rates 8,023 2,275 2,923 1,077 818 (70) 15,046 Gross profit 1,157 555 786 214 130 – 2,842 Commercial and administrative costs (370) (126) (310) (193) (71) – (1,070)Research and development costs (403) (77) (166) (44) (22) – (712)Share of results of joint ventures and associates 109 7 (3) – – – 113 Underlying operating profit/(loss) at 2016 exchange rates 493 359 307 (23) 37 – 1,173 Translation to 2017 exchange rates 27 15 23 (2) 1 – 64 Underlying operating profit/(loss) at 2017 exchange rates 520 374 330 (25) 38 – 1,237
Segment assets 15,335 1,741 3,772 1,270 395 (1,360) 21,153 Investments in joint ventures and associates 670 1 15 1 1 – 688 Segment liabilities (13,160) (1,837) (1,256) (761) (426) 1,360 (16,080)Net assets/(liabilities) 2,845 (95) 2,531 510 (30) – 5,761 Investment in intangible assets, property, plant and equipment and joint ventures and associates 1,455 120 118 56 40 – 1,789 Depreciation, amortisation and impairment 525 60 231 38 24 – 878
Year ended 31 December 2016Underlying revenue from sale of original equipment 3,357 890 1,810 631 354 (36) 7,006 Underlying revenue from aftermarket services 3,710 1,319 845 483 423 (40) 6,740 Total underlying revenue 7,067 2,209 2,655 1,114 777 (76) 13,746 Gross profit 1,185 564 702 236 121 – 2,808 Commercial and administrative costs (353) (124) (335) (222) (70) – (1,104)Research and development costs (568) (71) (177) (41) (6) – (863)Share of results of joint ventures and associates 103 15 1 – – – 119 Underlying operating profit/(loss) 367 384 191 (27) 45 – 960
Segment assets 13,030 1,755 3,828 1,518 351 (1,223) 19,259 Investments in joint ventures and associates 826 4 9 2 1 – 842 Segment liabilities (14,510) (1,996) (1,151) (903) (435) 1,223 (17,772)Net (liabilities)/assets (654) (237) 2,686 617 (83) – 2,329 Investment in intangible assets, property, plant and equipment and joint ventures and associates 1,215 112 123 37 19 – 1,506 Depreciation, amortisation and impairment 491 67 207 239 39 – 1,043
1 Included within the results for Civil Aerospace in 2017 is a charge of £227m (2016: £98m) related to in-service engine issues for the Trent 1000 and Trent 900.
Rolls-Royce Holdings plc Annual Report 2017 133Financial StatementsNotes to the Consolidated Financial Statements
FINA
NC
IAL STATEM
ENTS
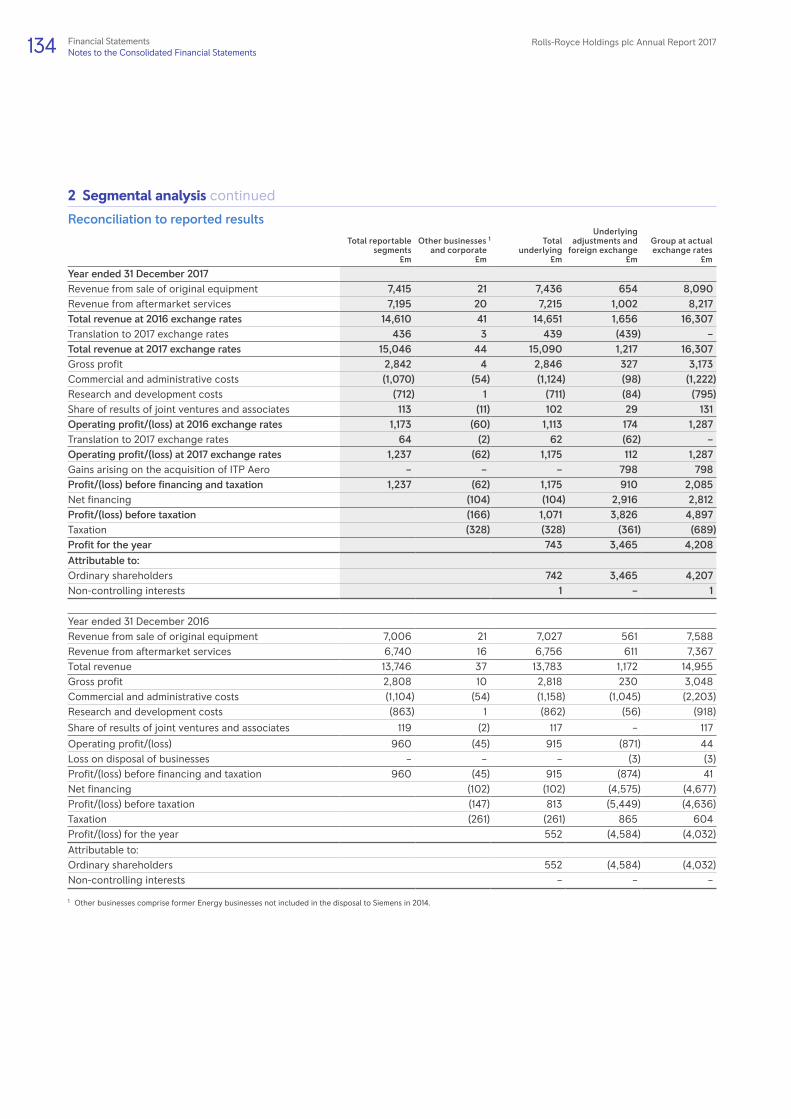
2 Segmental analysis continued
Reconciliation to reported resultsTotal reportable
segments£m
Other businesses 1 and corporate
£m
Totalunderlying
£m
Underlying adjustments and
foreign exchange£m
Group at actualexchange rates
£m
Year ended 31 December 2017Revenue from sale of original equipment 7,415 21 7,436 654 8,090 Revenue from aftermarket services 7,195 20 7,215 1,002 8,217 Total revenue at 2016 exchange rates 14,610 41 14,651 1,656 16,307 Translation to 2017 exchange rates 436 3 439 (439) – Total revenue at 2017 exchange rates 15,046 44 15,090 1,217 16,307 Gross profit 2,842 4 2,846 327 3,173 Commercial and administrative costs (1,070) (54) (1,124) (98) (1,222)Research and development costs (712) 1 (711) (84) (795)Share of results of joint ventures and associates 113 (11) 102 29 131 Operating profit/(loss) at 2016 exchange rates 1,173 (60) 1,113 174 1,287 Translation to 2017 exchange rates 64 (2) 62 (62) – Operating profit/(loss) at 2017 exchange rates 1,237 (62) 1,175 112 1,287Gains arising on the acquisition of ITP Aero – – – 798 798Profit/(loss) before financing and taxation 1,237 (62) 1,175 910 2,085 Net financing (104) (104) 2,916 2,812 Profit/(loss) before taxation (166) 1,071 3,826 4,897Taxation (328) (328) (361) (689)Profit for the year 743 3,465 4,208 Attributable to:Ordinary shareholders 742 3,465 4,207 Non-controlling interests 1 – 1
Year ended 31 December 2016Revenue from sale of original equipment 7,006 21 7,027 561 7,588 Revenue from aftermarket services 6,740 16 6,756 611 7,367 Total revenue 13,746 37 13,783 1,172 14,955 Gross profit 2,808 10 2,818 230 3,048 Commercial and administrative costs (1,104) (54) (1,158) (1,045) (2,203)Research and development costs (863) 1 (862) (56) (918)
Share of results of joint ventures and associates 119 (2) 117 – 117
Operating profit/(loss) 960 (45) 915 (871) 44Loss on disposal of businesses – – – (3) (3)Profit/(loss) before financing and taxation 960 (45) 915 (874) 41 Net financing (102) (102) (4,575) (4,677)Profit/(loss) before taxation (147) 813 (5,449) (4,636)Taxation (261) (261) 865 604 Profit/(loss) for the year 552 (4,584) (4,032)
Attributable to:Ordinary shareholders 552 (4,584) (4,032)Non-controlling interests – – –
1 Other businesses comprise former Energy businesses not included in the disposal to Siemens in 2014.
134 Rolls-Royce Holdings plc Annual Report 2017Financial StatementsNotes to the Consolidated Financial Statements

2 Segmental analysis continued
Underlying adjustments2017 2016
Revenue£m
Profit before
financing£m
Net financing
£mTaxation
£mRevenue
£m
Profit before
financing£m
Net financing
£mTaxation
£m
Underlying performance 15,090 1,175 (104) (328) 13,783 915 (102) (261)Revenue recognised at exchange rate on date of transaction 1,217 – – – 1,172 – – – Realised losses/(gains) on settled derivative contracts 1 – 475 173 (111) – 426 162 (107)Net unrealised fair value changes to derivative contracts 2 – 24 2,648 (463) – – (4,420) 792 Effect of currency on contract accounting – (124) – 21 – 77 – (14)Revaluation of trading assets and liabilities – (6) 84 (12) – 67 (313) 56 Financial RRSAs – foreign exchange differences and changes in forecast payments – – 11 (3) – – (8) (1)Effect of acquisition accounting 3 – (129) – 35 – (115) – 35 Impairment of goodwill – – – – – (219) – – Impairment of assets – (12) – – – – – – Pension restructuring 4 – – – – – (306) – 107 Net post-retirement scheme financing – – 1 (1) – – 3 (2)Disposal of businesses – – – – – (3) – – Exceptional restructuring – (104) – 31 – (129) – 34 Financial penalties from agreements with investigating bodies – – – – – (671) – – Gains arising on the acquisition of ITP Aero – 798 – – – – – – Consolidation of previously non-consolidated subsidiary – (12) – – – – – – Other – – (1) 4 – (1) 1 (5)Recognition of advance corporation tax – – – 163 – – – – Reduction in corporate tax rates 5 – – – (25) – – – (30)
Total underlying adjustments 1,217 910 2,916 (361) 1,172 (874) (4,575) 865 Reported per consolidated income statement 16,307 2,085 2,812 (689) 14,955 41 (4,677) 604
1 Realised losses/(gains) on settled derivative contracts include adjustments to reflect the losses/(gains) in the same year as the related trading cash flows.2 Unrealised fair value changes to derivative contracts included in profit before financing: (i) include those of equity accounted joint ventures; and (ii) exclude those for which the related trading contracts have been cancelled when the fair value changes are recognised immediately in underlying profit.
3 The adjustment eliminates charges recognised as a result of recognising assets in acquired businesses at fair value.4 In the UK, tax is provided on pension surpluses at a rate of 35%, which is the relevant rate if the surpluses were to be returned to the Group. 5 The 2017 reduction in corporate tax rates relates to the reduction in the Federal tax rate in the US. The 2016 comparative relates to the reduction in the UK corporate tax rate.
The reconciliation of underlying earnings per ordinary share is shown in note 6.
Reconciliation to the balance sheet2017
£m2016£m
Reportable segment assets 21,153 19,259 Investments in joint ventures and associates 688 844 Other businesses and corporate 1 2,565 49 Cash and cash equivalents and short-term investments 2,956 2,774 Fair value of swaps hedging fixed rate borrowings 227 358 Income tax assets 288 908 Post-retirement scheme surpluses 2,125 1,346 Total assets 30,002 25,538 Reportable segment liabilities (16,080) (17,772)Other businesses and corporate 1 (1,524) (183)Borrowings (3,488) (3,357)Income tax liabilities (1,353) (987)Post-retirement scheme deficits (1,387) (1,375)Total liabilities (23,832) (23,674)Net assets 6,170 1,864
1 Includes ITP Aero.
Rolls-Royce Holdings plc Annual Report 2017 135Financial StatementsNotes to the Consolidated Financial Statements
FINA
NC
IAL STATEM
ENTS

2 Segmental analysis continued
Geographical segmentsThe Group’s revenue by destination is as follows:
2017£m
2016£m
United Kingdom 1,881 1,821 Germany 973 850 Switzerland 733 745 France 388 294 Spain 329 289 Norway 218 279 Italy 301 232 Russia 63 75 Rest of Europe 736 700 Europe 5,622 5,285 United States 4,419 4,176 Canada 324 341 North America 4,743 4,517South America 173 314 Saudi Arabia 356 486 Rest of Middle East 885 570 Middle East 1,241 1,056 China 1,952 1,417 Singapore 565 518 Japan 294 333 South Korea 248 251 Malaysia 126 117 India 110 99 Rest of Asia 629 508 Asia 3,924 3,243 Africa 281 290 Australasia 230 188 Other 93 62
16,307 14,955
No single customer represented 10% or more of the Group’s revenue.
The carrying amounts of the Group’s non-current assets including investments but excluding other financial instruments, deferred tax assets and post-employment benefit surpluses, by the geographical area in which the assets are located, are as follows:
2017£m
2016£m
United Kingdom 5,367 4,643 Germany 2,872 2,714 United States 1,258 1,046 Nordic countries 502 512 Other 2,402 1,161
12,401 10,076
On 17 January 2018, the Group announced a simplification from five to three businesses and a review of strategic options for our commercial marine operation. Until certain elements of the simplification are sufficiently advanced (including the strategic review of commercial marine), it is not possible to determine reliably the full financial impact.
136 Rolls-Royce Holdings plc Annual Report 2017Financial StatementsNotes to the Consolidated Financial Statements

3 Research and development2017
£m2016£m
Expenditure in the year (1,035) (937)Capitalised as intangible assets 342 99 Amortisation of capitalised costs (150) (147)Impairment of capitalised costs – (2)Net research and development cost (843) (987)Entry fees received 64 73 Entry fees deferred in respect of charges in future years (44) (40)Recognition of previously deferred entry fees 28 36 Net cost recognised in the income statement (795) (918)Underlying adjustments relating to effects of acquisition accounting and foreign exchange 58 56 Net underlying cost recognised in the income statement (737) (862)Translation to 2016 exchange rates 26 – Net underlying cost at 2016 exchange rates (711) (862)
4 Net financing
2017 2016
Notes
Per consolidated
income statement
£m
Underlyingfinancing 2
£m
Per consolidated
income statement
£m
Underlyingfinancing 2
£m
Financing incomeInterest receivable 11 11 14 14 Net fair value gains on foreign currency contracts 1 17 2,611 – 1 – Financial RRSAs – foreign exchange differences and changes in forecast payments 17 – 23 – Net fair value gains on commodity contracts 1 17 37 – 16 – Financing on post-retirement scheme surpluses 19 39 – 42 – Net foreign exchange gains 258 – – –
2,973 11 96 14Financing costsInterest payable (67) (64) (77) (77)Net fair value losses on foreign currency contracts 1 17 – – (4,437) – Financial RRSAs – foreign exchange differences and changes in forecast payments 17 (6) – (31) – Financial charge relating to financial RRSAs 17 (5) (5) (6) (6)Financing on post-retirement scheme deficits 19 (38) – (39) – Net foreign exchange losses – – (145) – Other financing charges (45) (46) (38) (33)
(161) (115) (4,773) (116)Net financing 2,812 (104) (4,677) (102)
Analysed as:Net interest payable (56) (53) (63) (63)Net fair value gains/(losses) on derivative contracts 2,648 – (4,420) – Net post-retirement scheme financing 1 – 3 – Net other financing 219 (51) (197) (39)
Net financing 2,812 (104) (4,677) (102)
1 Net gain/(loss) on fair value items through profit or loss 2,648 – (4,420) –
2 See note 2.
Rolls-Royce Holdings plc Annual Report 2017 137Financial StatementsNotes to the Consolidated Financial Statements
FINA
NC
IAL STATEM
ENTS

5 TaxationUK Overseas Total
2017£m
2016£m
2017£m
2016£m
2017£m
2016£m
Current taxCurrent tax charge for the year 33 12 244 187 277 199 Adjustments in respect of prior years – (8) (10) 4 (10) (4)
33 4 234 191 267 195
Deferred taxDeferred tax charge/(credit) for the year 543 (804) 6 (44) 549 (848)Adjustments in respect of prior years (2) (5) 13 24 11 19 Recognition of advance corporation tax (163) – – – (163) – Deferred tax charge resulting from reduction in tax rates – 30 25 – 25 30
378 (779) 44 (20) 422 (799)
Recognised in the income statement 411 (775) 278 171 689 (604)
Other tax (charges)/creditsOCI Equity
Items that will not be reclassified
Items that may be reclassified
2017£m
2016£m
2017£m
2016£m
2017£m
2016£m
Deferred tax:Movement in post-retirement schemes (307) (179)Share-based payments – direct to equity 3 (2)Net investment hedge 1 4
(307) (179) 1 4 3 (2)
Tax reconciliation2017
£m2016£m
Profit/(loss) before taxation 4,897 (4,636)Less share of results of joint ventures and associates (note 11) (131) (117)Profit/(loss) before taxation excluding joint ventures and associates 4,766 (4,753)
Nominal tax charge/(credit) at UK corporation tax rate 19.25% (2016: 20%) 917 (951)UK tax rate differential 1 (68) 41 Overseas rate differences 2 103 25 Impairment of goodwill – 44 Financial penalties from agreements with investigating bodies – 153 Gains arising on the acquisition of ITP Aero (154) – Other permanent differences 4 11 Benefit to deferred tax from previously unrecognised tax losses and temporary differences – (2)Tax losses in year not recognised in deferred tax 24 30Adjustments in respect of prior years 1 15 Recognition of advance corporation tax (163) – Reduction in closing deferred taxes resulting from decrease in tax rates 25 30
689 (604)
Underlying items (note 2) 328 261 Non-underlying items 361 (865)
689 (604)
1 The UK tax rate differential arises on the difference between the appropriate deferred tax rate and the UK statutory tax rate.2 Overseas rate differences mainly relate to tax on profits in countries, such as the US and Germany, which have higher tax rates than the UK.
138 Rolls-Royce Holdings plc Annual Report 2017Financial StatementsNotes to the Consolidated Financial Statements
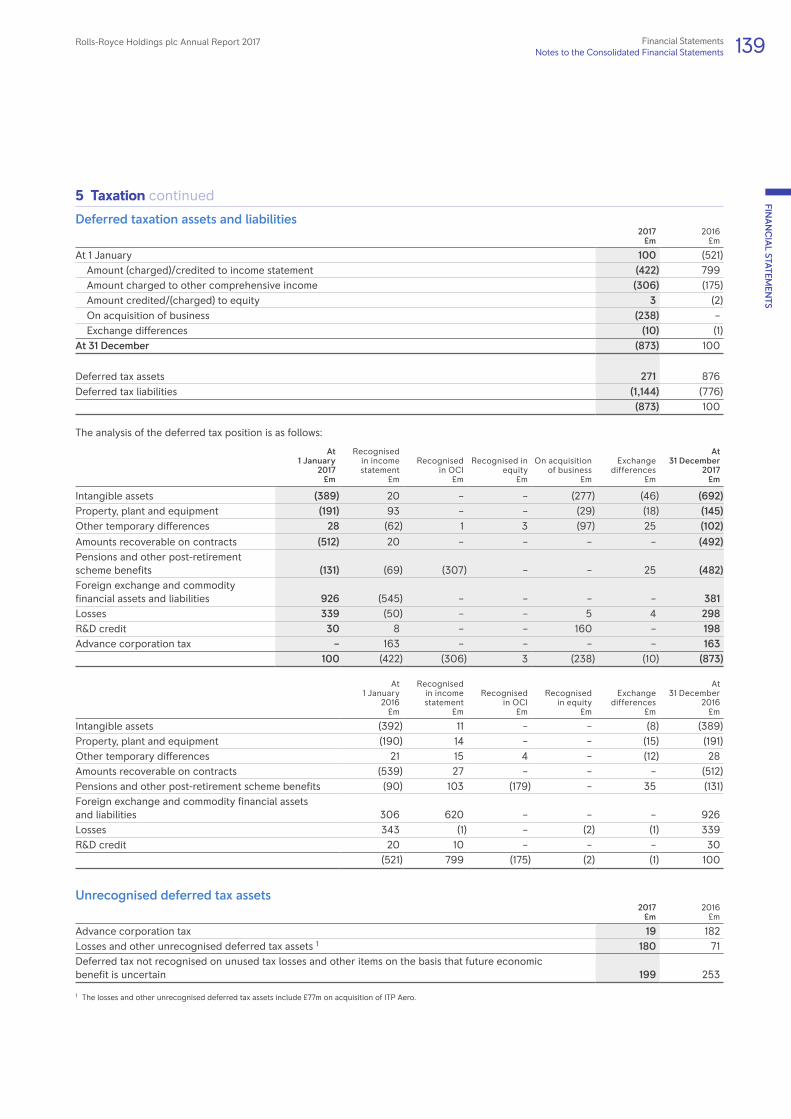
5 Taxation continued
Deferred taxation assets and liabilities2017
£m2016£m
At 1 January 100 (521)Amount (charged)/credited to income statement (422) 799 Amount charged to other comprehensive income (306) (175)Amount credited/(charged) to equity 3 (2)On acquisition of business (238) – Exchange differences (10) (1)
At 31 December (873) 100
Deferred tax assets 271 876Deferred tax liabilities (1,144) (776)
(873) 100
The analysis of the deferred tax position is as follows:
At 1 January
2017£m
Recognisedin incomestatement
£m
Recognisedin OCI
£m
Recognised in equity
£m
On acquisition of business
£m
Exchange differences
£m
At 31 December
2017£m
Intangible assets (389) 20 – – (277) (46) (692)Property, plant and equipment (191) 93 – – (29) (18) (145)Other temporary differences 28 (62) 1 3 (97) 25 (102)Amounts recoverable on contracts (512) 20 – – – – (492)Pensions and other post-retirement scheme benefits (131) (69) (307) – – 25 (482)Foreign exchange and commodity financial assets and liabilities 926 (545) – – – – 381 Losses 339 (50) – – 5 4 298 R&D credit 30 8 – – 160 – 198 Advance corporation tax – 163 – – – – 163
100 (422) (306) 3 (238) (10) (873)
At 1 January
2016£m
Recognisedin incomestatement
£m
Recognisedin OCI
£m
Recognisedin equity
£m
Exchange differences
£m
At 31 December
2016£m
Intangible assets (392) 11 – – (8) (389)Property, plant and equipment (190) 14 – – (15) (191)Other temporary differences 21 15 4 – (12) 28 Amounts recoverable on contracts (539) 27 – – – (512)Pensions and other post-retirement scheme benefits (90) 103 (179) – 35 (131)Foreign exchange and commodity financial assets and liabilities 306 620 – – – 926 Losses 343 (1) – (2) (1) 339 R&D credit 20 10 – – – 30
(521) 799 (175) (2) (1) 100
Unrecognised deferred tax assets2017
£m2016£m
Advance corporation tax 19 182 Losses and other unrecognised deferred tax assets 1 180 71 Deferred tax not recognised on unused tax losses and other items on the basis that future economic benefit is uncertain 199 253
1 The losses and other unrecognised deferred tax assets include £77m on acquisition of ITP Aero.
Rolls-Royce Holdings plc Annual Report 2017 139Financial StatementsNotes to the Consolidated Financial Statements
FINA
NC
IAL STATEM
ENTS

5 Taxation continued
Deferred taxation assets and liabilitiesDeferred tax assets include £285m (2016: £326m) relating to tax losses in the UK and £163m (2016: nil) relating to advance corporation tax.
In both cases, a recoverability assessment has been undertaken, taking account of deferred tax liabilities against which the reversal of the deferred tax asset can be offset and using latest UK forecasts to assess the level of future taxable profits. The assessment takes into account new tax laws that are effective from 1 April 2017 (restricting the offset of tax losses), and the fact that neither asset time expires.
The forecasts show the UK business, which is mainly Civil Aerospace and Defence Aerospace, continues to generate sufficient future taxable profits to support the continued recognition of the deferred tax asset relating to tax losses even though the new tax laws extend the period over which the losses are expected to be used. This is aligned to the business outlook, in particular Civil Aerospace with its growth in original equipment revenue from large engines and engine unit cost improvements.
Prior to the new tax laws, advance corporation tax would not be utilised until after all the UK tax losses had been used. One of the consequences of the change in tax laws is that UK tax payments will be accelerated. Advance corporation tax can be offset against such payments. This is reflected in the forecasts that show it now being used over a similar period to the losses. As a result the advance corporation tax has been recognised as a deferred tax asset in 2017. The resulting credit to the income statement has been excluded from underlying profit.
The US Tax Cuts and Jobs Act was enacted on 22 December 2017. This reduces the Federal tax rate in the US from 35% to 21% with effect from 1 January 2018. As the reduction has been enacted prior to the year end, the closing deferred tax assets and liabilities of US companies within the Group have been calculated at this rate. The resulting charges or credits have been recognised in the income statement except to the extent that they relate to items previously charged or credited to OCI or equity. Accordingly in 2017, £25m has been charged to the income statement and £45m has been charged to OCI.
The Budget 2016 announced that the UK tax rate will reduce to 19% with effect from 1 April 2017 and 17% with effect from 1 April 2020. The rate reduction to 17% was substantively enacted on 6 September 2016. The deferred tax assets and liabilities of UK companies within the Group have therefore been calculated at 17%.
The temporary differences associated with investments in subsidiaries, joint ventures and associates, for which a deferred tax liability has not been recognised, aggregate to £188m (2016: £276m). No deferred tax liability has been recognised on the potential withholding tax due on the remittance of undistributed profits as the Group is able to control the timing of such remittances and it is probable that consent will not be given in the foreseeable future.
6 Earnings per ordinary shareBasic earnings per ordinary share (EPS) are calculated by dividing the profit attributable to ordinary shareholders by the weighted average number of ordinary shares in issue during the year, excluding ordinary shares held under trust, which have been treated as if they had been cancelled.
Diluted EPS are calculated by adjusting the weighted average number of ordinary shares in issue during the year for the bonus element of share options.
2017 2016
Basic
Potentially dilutive
share options Diluted Basic
Potentially dilutive
share options 1 Diluted
Profit/(loss) attributable to ordinary shareholders (£m) 4,207 4,207 (4,032) (4,032)Weighted average number of ordinary shares (millions) 1,834 6 1,840 1,832 – 1,832 EPS (pence) 229.40 (0.76) 228.64 (220.08) – (220.08)
1 As there is a loss, the effect of potentially dilutive ordinary shares is anti-dilutive.
The reconciliation between underlying EPS and basic EPS is as follows:
2017 2016
Pence £m Pence £m
Underlying EPS/Underlying operating profit attributable to ordinary shareholders 40.46 742 30.13 552 Total underlying adjustments to profit before tax (note 2) 208.62 3,826 (297.43) (5,449)Related tax effects (19.68) (361) 47.22 865
EPS/Profit/(loss) attributable to ordinary shareholders 229.40 4,207 (220.08) (4,032)
Diluted underlying EPS 40.33 30.08
140 Rolls-Royce Holdings plc Annual Report 2017Financial StatementsNotes to the Consolidated Financial Statements
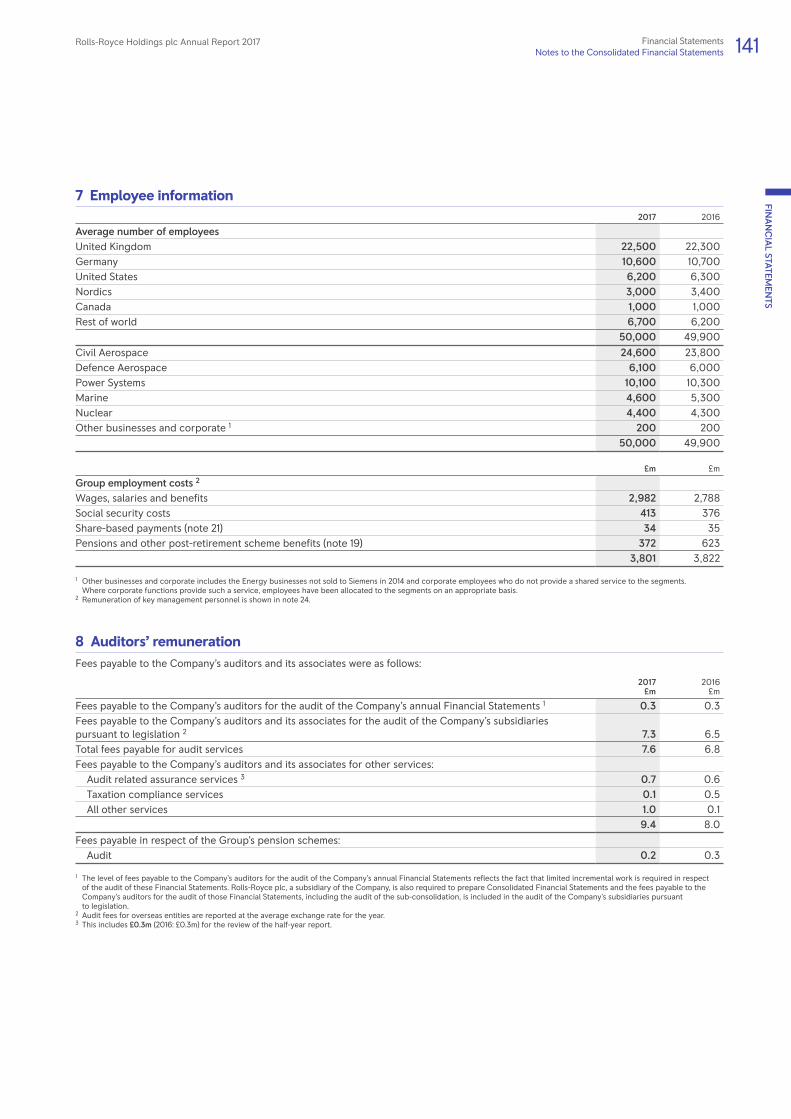
7 Employee information2017 2016
Average number of employeesUnited Kingdom 22,500 22,300 Germany 10,600 10,700 United States 6,200 6,300 Nordics 3,000 3,400 Canada 1,000 1,000 Rest of world 6,700 6,200
50,000 49,900
Civil Aerospace 24,600 23,800 Defence Aerospace 6,100 6,000 Power Systems 10,100 10,300 Marine 4,600 5,300 Nuclear 4,400 4,300 Other businesses and corporate 1 200 200
50,000 49,900
£m £m
Group employment costs 2
Wages, salaries and benefits 2,982 2,788 Social security costs 413 376 Share-based payments (note 21) 34 35 Pensions and other post-retirement scheme benefits (note 19) 372 623
3,801 3,822
1 Other businesses and corporate includes the Energy businesses not sold to Siemens in 2014 and corporate employees who do not provide a shared service to the segments. Where corporate functions provide such a service, employees have been allocated to the segments on an appropriate basis.
2 Remuneration of key management personnel is shown in note 24.
8 Auditors’ remunerationFees payable to the Company’s auditors and its associates were as follows:
2017£m
2016£m
Fees payable to the Company’s auditors for the audit of the Company’s annual Financial Statements 1 0.3 0.3Fees payable to the Company’s auditors and its associates for the audit of the Company’s subsidiaries pursuant to legislation 2 7.3 6.5Total fees payable for audit services 7.6 6.8Fees payable to the Company’s auditors and its associates for other services:Audit related assurance services 3 0.7 0.6Taxation compliance services 0.1 0.5All other services 1.0 0.1
9.4 8.0
Fees payable in respect of the Group’s pension schemes:Audit 0.2 0.3
1 The level of fees payable to the Company’s auditors for the audit of the Company’s annual Financial Statements reflects the fact that limited incremental work is required in respect of the audit of these Financial Statements. Rolls-Royce plc, a subsidiary of the Company, is also required to prepare Consolidated Financial Statements and the fees payable to the Company’s auditors for the audit of those Financial Statements, including the audit of the sub-consolidation, is included in the audit of the Company’s subsidiaries pursuant to legislation.
2 Audit fees for overseas entities are reported at the average exchange rate for the year.3 This includes £0.3m (2016: £0.3m) for the review of the half-year report.
Rolls-Royce Holdings plc Annual Report 2017 141Financial StatementsNotes to the Consolidated Financial Statements
FINA
NC
IAL STATEM
ENTS

9 Intangible assets
Goodwill£m
Certificationcosts and
participation fees
£m
Developmentexpenditure
£m
Contractualaftermarket
rights£m
Customer relationships
£mSoftware
£mOther
£mTotal
£m
CostAt 1 January 2016 1,589 1,145 1,730 799 456 616 543 6,878 Exchange differences 284 26 116 – 84 16 66 592 Additions – 154 100 208 – 116 53 631 Acquisition of business 1 – – – – – 1 2 Disposals – – (2) – – (6) – (8)
At 1 January 2017 1,874 1,325 1,944 1,007 540 742 663 8,095 Exchange differences (5) 8 16 – (3) (3) 8 21 Reclassifications – – (9) – – – 9 – Additions – 160 342 286 – 135 50 973 Acquisition of business – 128 202 70 966 7 44 1,417 Disposals – – – – – (13) – (13)
At 31 December 2017 1,869 1,621 2,495 1,363 1,503 868 774 10,493
Accumulated amortisationAt 1 January 2016 86 373 691 394 139 325 225 2,233 Exchange differences 32 3 48 – 28 8 35 154 Charge for the year 1 – 64 147 39 42 81 33 406 Impairment 219 – 2 – – – 1 222
At 1 January 2017 337 440 888 433 209 414 294 3,015 Exchange differences (13) 1 8 – (4) (1) – (9)Charge for the year 1 – 63 149 57 51 81 29 430 Disposals – – – – – (6) – (6)
At 31 December 2017 324 504 1,045 490 256 488 323 3,430
Net book valueAt 31 December 2017 1,545 1,117 1,450 873 1,247 380 451 7,063 At 31 December 2016 1,537 885 1,056 574 331 328 369 5,080 At 1 January 2016 1,503 772 1,039 405 317 291 318 4,645
1 Charged to cost of sales except development costs, which are charged to research and development costs.
GoodwillIn accordance with the requirements of IAS 36 Impairment of Assets, goodwill is allocated to the Group’s cash-generating units, or groups of cash-generating units, that are expected to benefit from the synergies of the business combination that gave rise to the goodwill as follows:
Cash-generating unit (CGU) or group of CGUsPrimary reporting
segment2017
£m2016£m
Rolls-Royce Power Systems AG Power Systems 868 871 Marine – arising from the acquisitions of Vinters Limited, Scandinavian Electric Holding AS and ODIM ASA Marine 410 401 Rolls-Royce Deutschland Ltd & Co KG Civil Aerospace 244 236 Other Various 23 29
1,545 1,537
142 Rolls-Royce Holdings plc Annual Report 2017Financial StatementsNotes to the Consolidated Financial Statements

9 Intangible assets continuedGoodwill has been tested for impairment during 2017 on the following basis:
– The carrying values of goodwill have been assessed by reference to value in use. These have been estimated using cash flows from the most recent forecasts prepared by management, which are consistent with past experience and external sources of information on market conditions. These forecasts cover the next five years. Growth rates for the period not covered by the forecasts are based on a range of growth rates that reflect the products, industries and countries in which the relevant CGU or group of CGUs operate.
– The key assumptions for the impairment tests are the discount rate and, in the cash flow projections, the programme assumptions, the growth rates and the impact of foreign exchange rates on the relationship between selling prices and costs. Impairment tests are performed using prevailing exchange rates.
The principal value in use assumptions for goodwill balances considered to be individually significant are:
Marine – Trading assumptions (e.g. volume of equipment deliveries, capture of aftermarket and cost escalation) are based on current and known future programmes, estimates of customers’ fleet requirements and long-term economic forecasts, in particular the cyclical recovery of the commercial marine market.
– Cash flows beyond the five-year forecasts are assumed to grow at 2.5% (2016: 2.5%). – Pre-tax discount rate 13% (2016: 13%).
The estimate of value in use is approximately £50m higher than the carrying value and deterioration of key assumptions could result in an impairment. For example, the value in use would reduce by approximately £50m if alternative trading assumptions resulted in forecast cash flows reducing by 10%, by approximately £60m if the discount rate increased by 1% and by approximately £100m if the market recovery were delayed by one year compared to that assumed.
On 17 January 2018, the Group announced a strategic review of commercial marine. Until the review is sufficiently advanced, it is not possible to determine reliably the full financial impact.
Rolls-Royce Power Systems AG – Trading assumptions (e.g. volume of equipment deliveries, pricing achieved and cost escalation) are based on current and known future programmes, estimates of capture of market share and long-term economic forecasts.
– Cash flows beyond the five-year forecasts are assumed to grow at 1.8% (2016: 2%). – Pre-tax discount rate 11.7% (2016 11.7%).
The Directors do not consider that any reasonably possible changes in the key assumptions would cause the value in use of the goodwill to fall below its carrying value.
Rolls-Royce Deutschland Ltd & Co KG – Trading assumptions (e.g. volume of engine deliveries, flying hours of installed fleet and cost escalation) are based on current and known future programmes, estimates of customers’ fleet requirements and long-term economic forecasts.
– Cash flows beyond the five-year forecasts are assumed to grow at 2.5% (2016: 2.5%). – Pre-tax discount rate 13% (2016: 13%).
The Directors do not consider that any reasonably possible changes in the key assumptions would cause the value in use of the goodwill to fall below its carrying value.
Other intangible assetsCertification costs and participation fees, development costs and contractual aftermarket rights have been reviewed for impairment in accordance with the requirements of IAS 36 Impairment of Assets. Where an impairment test was considered necessary, it has been performed on the following basis:
– The carrying values have been assessed by reference to value in use. These have been estimated using cash flows from the most recent forecasts prepared by management, which are consistent with past experience and external sources of information on market conditions over the lives of the respective programmes.
– The key assumptions underlying cash flow projections are assumed market share, programme timings, unit cost assumptions, discount rates, and foreign exchange rates.
– The pre-tax cash flow projections have been discounted at 9–13% (2016: 9-13%), based on the Group’s weighted average cost of capital, adjusted for the estimated programme risk, for example taking account of whether or not the forecast cash flows arise from contracted business.
No impairment is required on this basis. However, a combination of adverse changes in assumptions (e.g. market size and share, unit costs and programme delays) and other variables (e.g. discount rate and foreign exchange rates), could result in impairment in future years. In making this assessment, the Directors noted that the adoption of IFRS 15 on 1 January 2018 would result in the derecognition of contractual aftermarket rights of £873m, which will itself significantly reduce the risk of impairment on other intangible assets.
Rolls-Royce Holdings plc Annual Report 2017 143Financial StatementsNotes to the Consolidated Financial Statements
FINA
NC
IAL STATEM
ENTS

10 Property, plant and equipmentLand and buildings
£m
Plant and equipment
£m
Aircraft and engines
£m
In course of construction
£mTotal
£m
CostAt 1 January 2016 1,375 3,894 339 708 6,316 Exchange differences 141 352 12 55 560 Reclassification of joint ventures to joint operations 7 87 – – 94 Additions – purchased 25 124 51 426 626 Additions – arising from TotalCare Flex contracts (non-cash) – – 75 – 75 Disposals of businesses (1) (3) – – (4)Reclassifications 131 230 63 (424) – Disposals/write-offs (11) (85) (49) – (145)
At 1 January 2017 1,667 4,599 491 765 7,522 Exchange differences (18) (61) (5) (11) (95)Additions – purchased 36 155 127 446 764 Additions – arising from TotalCare Flex contracts (non-cash) – – 1 – 1 Acquisition of business 74 155 28 11 268 Consolidation of previously non-consolidated subsidiary 9 1 – – 10 Reclassifications 92 308 29 (429) – Transfer to assets held for sale (5) (11) – – (16)Disposals/write-offs (13) (111) (4) (9) (137)Adjustment 2 – – 20 – 20
At 31 December 2017 1,842 5,035 687 773 8,337
Accumulated depreciationAt 1 January 2016 416 2,284 125 1 2,826 Exchange differences 44 182 4 – 230 Reclassification of joint ventures to joint operations 1 52 – – 53 Charge for the year 1 63 333 28 – 424 Impairment 1 – – 1 2 Disposals of businesses – (2) – – (2)Reclassifications – (9) 9 – – Disposals/write-offs (10) (75) (40) – (125)
At 1 January 2017 515 2,765 126 2 3,408 Exchange differences (9) (32) (1) – (42)Charge for the year 1 58 351 35 – 444 Impairment 3 3 – – 6 Reclassifications (7) 7 – – – Transfer to assets held for sale (3) (10) – – (13)Disposals/write-offs (3) (100) (1) – (104)Adjustment 2 – – 14 – 14
At 31 December 2017 554 2,984 173 2 3,713
Net book valueAt 31 December 2017 1,288 2,051 514 771 4,624 At 31 December 2016 1,152 1,834 365 763 4,114 At 1 January 2016 959 1,610 214 707 3,490
1 Depreciation charged during the year is included in the income statement or included in the cost of inventory as appropriate.2 The adjustment relates to industrial engines sold with the Energy business in 2014.
144 Rolls-Royce Holdings plc Annual Report 2017Financial StatementsNotes to the Consolidated Financial Statements
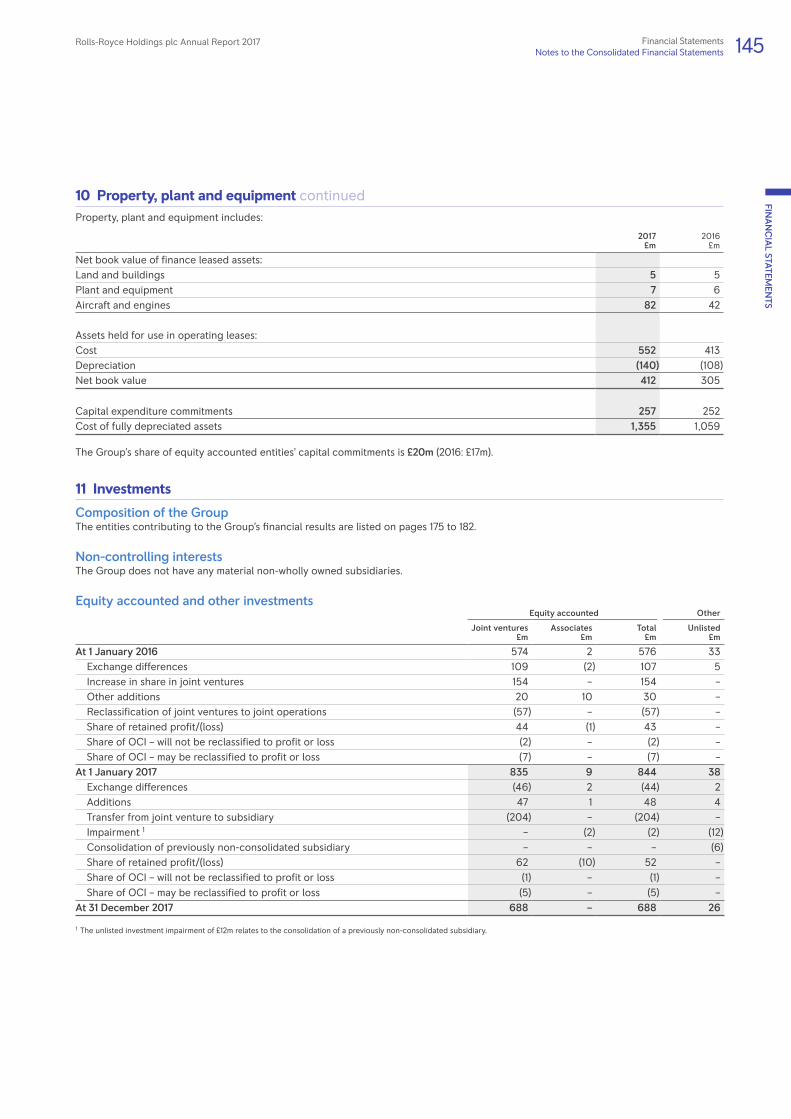
10 Property, plant and equipment continuedProperty, plant and equipment includes:
2017£m
2016£m
Net book value of finance leased assets:Land and buildings 5 5 Plant and equipment 7 6 Aircraft and engines 82 42
Assets held for use in operating leases:Cost 552 413 Depreciation (140) (108)Net book value 412 305
Capital expenditure commitments 257 252 Cost of fully depreciated assets 1,355 1,059
The Group’s share of equity accounted entities’ capital commitments is £20m (2016: £17m).
11 Investments
Composition of the GroupThe entities contributing to the Group’s financial results are listed on pages 175 to 182.
Non-controlling interestsThe Group does not have any material non-wholly owned subsidiaries.
Equity accounted and other investmentsEquity accounted Other
Joint ventures£m
Associates£m
Total£m
Unlisted£m
At 1 January 2016 574 2 576 33Exchange differences 109 (2) 107 5 Increase in share in joint ventures 154 – 154 – Other additions 20 10 30 – Reclassification of joint ventures to joint operations (57) – (57) – Share of retained profit/(loss) 44 (1) 43 – Share of OCI – will not be reclassified to profit or loss (2) – (2) – Share of OCI – may be reclassified to profit or loss (7) – (7) –
At 1 January 2017 835 9 844 38 Exchange differences (46) 2 (44) 2 Additions 47 1 48 4 Transfer from joint venture to subsidiary (204) – (204) – Impairment 1 – (2) (2) (12)Consolidation of previously non-consolidated subsidiary – – – (6)Share of retained profit/(loss) 62 (10) 52 – Share of OCI – will not be reclassified to profit or loss (1) – (1) – Share of OCI – may be reclassified to profit or loss (5) – (5) –
At 31 December 2017 688 – 688 26
1 The unlisted investment impairment of £12m relates to the consolidation of a previously non-consolidated subsidiary.
Rolls-Royce Holdings plc Annual Report 2017 145Financial StatementsNotes to the Consolidated Financial Statements
FINA
NC
IAL STATEM
ENTS

11 Investments continued The following joint ventures are considered to be individually material to the Group:
Principal location Activity Ownership interest
Alpha Partners Leasing Limited (APL) UK Aero engine leasing 50.0%Hong Kong Aero Engine Services Limited (HAESL) Hong Kong Aero engine repair and overhaul 50.0% Singapore Aero Engine Services Pte Limited (SAESL) Singapore Aero engine repair and overhaul 50.0%
Industria de Turbo Propulsores SA (ITP Aero) SpainAero engine component manufacture and maintenance 46.9% 1
1 On 19 December 2017 the Group acquired the remaining share of ITP Aero to take the total shareholding to 100%.
Summarised financial information of the Group’s individually material joint ventures is as follows:
APL HAESL SAESL ITP Aero
2017 £m
2016 £m
2017 £m
2016 £m
2017 £m
2016 £m
2017 £m
2016 £m
Revenue 188 151 954 799 933 763 689 615 Profit for the year 60 58 48 233 40 33 46 50 Total comprehensive income for the year 60 58 48 233 40 33 46 50 Dividends paid during the year (25) (27) (44) (237) (47) (24) – (19)Profit for the year included the following:Depreciation and amortisation (94) (82) (11) (10) (12) (12) (51) (45)Interest income – – – – – – 11 11 Interest expense (34) (24) (1) (1) (2) (2) (15) (16)Income tax (charge)/credit (10) (5) (9) (8) – – – 7
Current assets 185 176 268 248 362 307 – 731 Non-current assets 2,116 1,888 114 105 148 167 – 701 Current liabilities (531) (348) (116) (88) (202) (146) – (497)Non-current liabilities (1,299) (1,296) (91) (79) (138) (143) – (485)Net assets 471 420 175 186 170 185 – 450 Included in the above:Cash and cash equivalents 23 21 9 12 32 7 – 274 Current financial liabilities 1 (503) (292) – (7) – – – (12)Non-current financial liabilities 1 (1,101) (1,111) (83) (71) (137) (143) – (331)
1 Excluding trade and other payables.
Reconciliation to the carrying amount recognised in the Consolidated Financial Statements
Ownership interest 50.0% 50.0% 50.0% 50.0% 50.0% 50.0% n/a 46.9%Group share of net assets above 236 210 88 93 85 93 n/a 211 Goodwill – – 34 38 92 100 n/a – Adjustments for intercompany trading – – – – – – n/a (43)Included in the consolidated balance sheet 236 210 122 131 177 193 n/a 168
On 11 July 2016, the Group announced that it would purchase the outstanding 53.1% shareholding in ITP Aero owned by SENER Grupo de Ingeniería SA (SENER). This followed a decision by SENER to exercise its put option. On 19 December 2017, the Group completed the purchase of ITP Aero to take its shareholding to 100% at a valuation of €718m. Under the agreement, consideration will be settled over a two-year period in eight quarterly instalments of equal value. The updated agreement allows flexibility to settle the consideration either in cash, in the form of Rolls-Royce shares or any mixture of the two. A decision as to whether each payment will be settled in cash, shares or cash and shares will be determined by Rolls-Royce during the payment period.
146 Rolls-Royce Holdings plc Annual Report 2017Financial StatementsNotes to the Consolidated Financial Statements

11 Investments continued The summarised aggregated results of the Group’s share of all equity accounted investments is as follows:
Individually material joint ventures (previous page) Other joint ventures Associates Total
2017 £m
2016 £m
2017 £m
2016 £m
2017 £m
2016 £m
2017 £m
2016 £m
Assets:Non-current assets 1,316 1,503 835 921 – 8 2,151 2,432 Current assets 407 710 424 383 – 1 831 1,094
Liabilities: 1
Current liabilities (425) (524) (394) (266) – – (819) (790)Non-current liabilities (764) (987) (711) (905) – – (1,475) (1,892)
534 702 154 133 – 9 688 844 1 Liabilities include borrowings of (912) (970) (710) (761) – – (1,622) (1,731)
Profit/(loss) for the year 98 84 43 34 (10) (1) 131 117 Other comprehensive income – – (5) (7) – – (5) (7)Total comprehensive income for the year 98 84 38 27 (10) (1) 126 110
12 Inventories2017
£m2016£m
Raw materials 558 529 Work in progress 1,452 1,199 Long-term contracts work in progress 9 18 Finished goods 1,605 1,312 Payments on account 36 28
3,660 3,086
Inventories stated at net realisable value 244 271 Amount of inventory write-down 85 74 Reversal of inventory write-down 4 8
13 Trade and other receivables2017
£m2016£m
Trade receivables 2,492 1,945 Amounts recoverable on contracts 1 3,936 3,514 Amounts owed by joint ventures and associates 180 297 Other receivables 1,120 1,003 Prepayments and accrued income 191 197
7,919 6,956
Analysed as:Financial instruments (note 17):Trade receivables and similar items 3,045 2,470 Other non-derivative financial assets 782 811
Non-financial instruments 4,092 3,675 7,919 6,956
Trade and other receivables expected to be recovered in more than one year:Trade receivables 82 81 Amounts recoverable on contracts 3,328 3,020 Amounts owed by joint ventures and associates 1 – Other receivables 41 109 Prepayments and accrued income 49 69
3,501 3,279
1 Amounts recoverable on contracts include £3,536m (2016: £3,348m) of TotalCare assets.
Rolls-Royce Holdings plc Annual Report 2017 147Financial StatementsNotes to the Consolidated Financial Statements
FINA
NC
IAL STATEM
ENTS

14 Cash and cash equivalents2017
£m2016£m
Cash at bank and in hand 838 872 Money-market funds 589 552 Short-term deposits 1,526 1,347
2,953 2,771
Overdrafts (note 15) (20) – Cash and cash equivalents per cash flow statement (page 119) 2,933 2,771 Cash held as collateral against third party obligations (note 18) 22 38
Cash and cash equivalents at 31 December 2017 include £23m (2016: £34m) that is not available for general use by the Group. This balance relates to cash held in non-wholly owned subsidiaries and joint arrangements.
Balances are presented on a net basis when the Group has both a legal right of offset and the intention to either settle on a net basis or realise the asset and settle the liability simultaneously. A gross overdraft balance of £20m is disclosed at 31 December 2017.
15 BorrowingsCurrent Non-current Total
2017£m
2016£m
2017£m
2016£m
2017£m
2016£m
UnsecuredOverdrafts 20 – – – 20 – Bank loans 39 169 572 271 611 440 6.75% Notes 2019 £500m 1 – – 519 534 519 534 2.375% Notes 2020 US$500m 2 – – 362 403 362 403 2.125% Notes 2021 €750m 2 – – 701 682 701 682 3.625% Notes 2025 US$1,000m 2 – – 726 814 726 814 3.375% Notes 2026 £375m 1 – – 412 417 412 417
SecuredObligations under finance leases 3 23 3 114 64 137 67
82 172 3,406 3,185 3,488 3,357
1 These notes are the subject of interest rate swap agreements under which the Group has undertaken to pay floating rates of interest which form a fair value hedge.2 These notes are the subject of interest rate swap agreements under which the Group has undertaken to pay floating rates of interest, and currency swaps which form a fair value hedge.3 Obligations under finance leases are secured by related leased assets.
16 Trade and other payablesCurrent Non-current Total
2017£m
2016£m
2017£m
2016£m
2017£m
2016£m
Payments received on account 1 1,237 1,246 1,046 1,024 2,283 2,270 Trade payables 2,458 1,981 10 – 2,468 1,981 Amounts owed to joint ventures and associates 46 268 4 3 50 271 Other taxation and social security 125 93 – – 125 93 Other payables 3,144 2,243 1,124 784 4,268 3,027 Accruals and deferred income 2,517 2,126 1,994 1,648 4,511 3,774
9,527 7,957 4,178 3,459 13,705 11,416 1 Includes payments received on account from joint ventures and associates 78 140 25 17 103 157
Included within trade and other payables are government grants of £102m (2016: £75m). During the year, £7m (2016: £11m) of government grants were released to the income statement.
Included in accruals and deferred income are deferred receipts from RRSA workshare partners of £178m (2016: £233m) and £1,033m (2016: £907m) of TotalCare liabilities. Other payables include £378m (2016: £671m) for financial penalties from agreements with investigating bodies and £648m (2016: nil) for deferred consideration in relation to the acquisition of ITP Aero (see note 25).
148 Rolls-Royce Holdings plc Annual Report 2017Financial StatementsNotes to the Consolidated Financial Statements
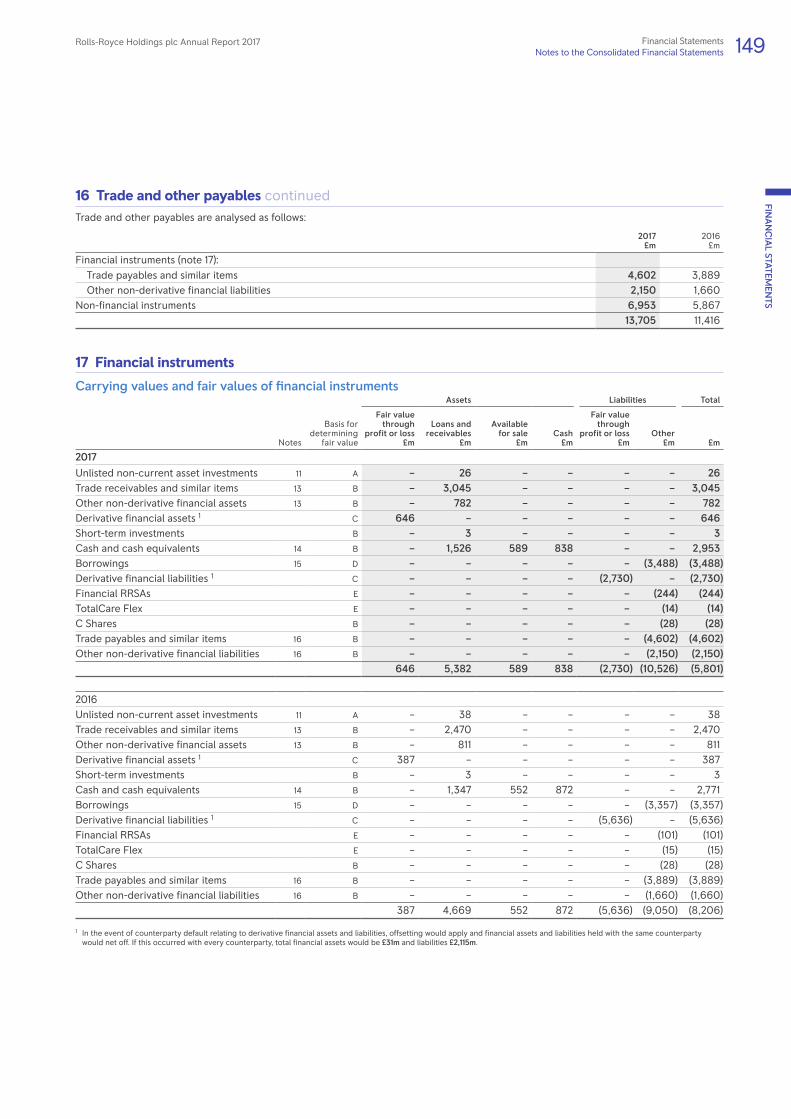
16 Trade and other payables continuedTrade and other payables are analysed as follows:
2017£m
2016£m
Financial instruments (note 17):Trade payables and similar items 4,602 3,889 Other non-derivative financial liabilities 2,150 1,660
Non-financial instruments 6,953 5,867 13,705 11,416
17 Financial instruments
Carrying values and fair values of financial instrumentsAssets Liabilities Total
Notes
Basis for determining fair value
Fair value through
profit or loss£m
Loans and receivables
£m
Available for sale
£mCash
£m
Fair value through
profit or loss£m
Other£m £m
2017Unlisted non-current asset investments 11 A – 26 – – – – 26 Trade receivables and similar items 13 B – 3,045 – – – – 3,045 Other non-derivative financial assets 13 B – 782 – – – – 782 Derivative financial assets 1 C 646 – – – – – 646 Short-term investments B – 3 – – – – 3 Cash and cash equivalents 14 B – 1,526 589 838 – – 2,953 Borrowings 15 D – – – – – (3,488) (3,488)Derivative financial liabilities 1 C – – – – (2,730) – (2,730)Financial RRSAs E – – – – – (244) (244)TotalCare Flex E – – – – – (14) (14)C Shares B – – – – – (28) (28)Trade payables and similar items 16 B – – – – – (4,602) (4,602)Other non-derivative financial liabilities 16 B – – – – – (2,150) (2,150)
646 5,382 589 838 (2,730) (10,526) (5,801)
2016Unlisted non-current asset investments 11 A – 38 – – – – 38 Trade receivables and similar items 13 B – 2,470 – – – – 2,470 Other non-derivative financial assets 13 B – 811 – – – – 811 Derivative financial assets 1 C 387 – – – – – 387 Short-term investments B – 3 – – – – 3 Cash and cash equivalents 14 B – 1,347 552 872 – – 2,771 Borrowings 15 D – – – – – (3,357) (3,357)Derivative financial liabilities 1 C – – – – (5,636) – (5,636)Financial RRSAs E – – – – – (101) (101)TotalCare Flex E – – – – – (15) (15)C Shares B – – – – – (28) (28)Trade payables and similar items 16 B – – – – – (3,889) (3,889)Other non-derivative financial liabilities 16 B – – – – – (1,660) (1,660)
387 4,669 552 872 (5,636) (9,050) (8,206)
1 In the event of counterparty default relating to derivative financial assets and liabilities, offsetting would apply and financial assets and liabilities held with the same counterparty would net off. If this occurred with every counterparty, total financial assets would be £31m and liabilities £2,115m.
Rolls-Royce Holdings plc Annual Report 2017 149Financial StatementsNotes to the Consolidated Financial Statements
FINA
NC
IAL STATEM
ENTS

17 Financial instruments continuedFair values equate to book values for both 2017 and 2016, with the following exceptions:
2017 2016
Book value£m
Fair value£m
Book value£m
Fair value£m
Borrowings (3,488) (3,557) (3,357) (3,413)Financial RRSAs (244) (247) (101) (109)
The fair value of a financial instrument is the price at which an asset could be exchanged, or a liability settled, between knowledgeable, willing parties in an arms-length transaction. Fair values have been determined with reference to available market information at the balance sheet date, using the methodologies described below.
A These primarily comprise unconsolidated companies where fair value approximates to the book value.B Fair values are assumed to approximate to cost either due to the short-term maturity of the instruments or because the interest rate of the investments is reset after periods not exceeding six months.
C Fair values of derivative financial assets and liabilities are estimated by discounting expected future contractual cash flows using prevailing interest rate curves. Amounts denominated in foreign currencies are valued at the exchange rate prevailing at the balance sheet date. These financial instruments are included on the balance sheet at fair value, derived from observable market prices (Level 2 as defined by IFRS 13 Fair Value Measurement).
D Borrowings are carried at amortised cost. Amounts denominated in foreign currencies are valued at the exchange rate prevailing at the balance sheet date. The fair value of borrowings is estimated by discounting contractual future cash flows. (Level 2 as defined by IFRS 13).
E The fair values of RRSAs and TotalCare Flex liabilities are estimated by discounting expected future cash flows. The contractual cash flows are based on future trading activity, which is estimated based on latest forecasts (Level 3 as defined by IFRS 13).
IFRS 13 defines a three-level valuation hierarchy:
Level 1 – quoted prices for similar instruments
Level 2 – directly observable market inputs other than Level 1 inputs
Level 3 – inputs not based on observable market data
Carrying values of other financial assets and liabilities
Foreign exchange contracts
£m
Commodity contracts
£m
Interest rate contracts 1
£m
Total derivatives
£m
Financial RRSAs
£m
TotalCareFlex
£mC Shares
£mTotal
£m
2017Non-current assets 362 16 232 610 – – – 610 Current assets 27 9 – 36 – – – 36 Assets 389 25 232 646 – – – 646 Current liabilities (493) (10) – (503) (50) – (28) (581)Non-current liabilities (2,208) (14) (5) (2,227) (194) (14) – (2,435)Liabilities (2,701) (24) (5) (2,730) (244) (14) (28) (3,016)
(2,312) 1 227 (2,084) (244) (14) (28) (2,370)2016Non-current assets 13 5 364 382 – – – 382 Current assets 4 1 – 5 – – – 5 Assets 17 6 364 387 – – – 387 Current liabilities (566) (24) – (590) (33) – (28) (651)Non-current liabilities (5,002) (38) (6) (5,046) (68) (15) – (5,129)Liabilities (5,568) (62) (6) (5,636) (101) (15) (28) (5,780)
(5,551) (56) 358 (5,249) (101) (15) (28) (5,393)
1 Includes the foreign exchange impact of cross-currency interest rate swaps.
150 Rolls-Royce Holdings plc Annual Report 2017Financial StatementsNotes to the Consolidated Financial Statements

17 Financial instruments continued
Derivative financial instrumentsThe Group uses various financial instruments to manage its exposure to movements in foreign exchange rates. Where the effectiveness of a hedging relationship in a cash flow hedge is demonstrated, changes in the fair value that are deemed effective are included in the cash flow hedge reserve and released to match actual payments on the hedged item. The Group uses commodity swaps to manage its exposure to movements in the price of commodities (jet fuel and base metals). To hedge the currency risk associated with a borrowing denominated in US dollars, the Group has currency derivatives designated as part of fair value hedges. The Group uses interest rate swaps and forward rate agreements to manage its exposure to movements in interest rates.
Movements in the fair values of derivative financial assets and liabilities were as follows:
Foreign exchange instruments Commodity instruments Interest rate instruments Total
2017£m
2016£m
2017£m
2016£m
2017£m
2016£m
2017£m
2016£m
At 1 January (5,551) (1,640) (56) (104) 358 13 (5,249) (1,731)Currency options at inception 1 – (33) – – – – – (33)
Acquisition of business 7 – 2 – – – 9 –Movements in fair value hedges 2 – – – – (131) 345 (131) 345 Movements in other derivative contracts 3 2,611 (4,436) 37 16 – – 2,648 (4,420)Contracts settled 621 558 18 32 – – 639 590
At 31 December (2,312) (5,551) 1 (56) 227 358 (2,084) (5,249)
1 The Group wrote currency options to sell USD and buy GBP as part of a commercial agreement. The fair values of these options on inception was treated as a discount to the customer.2 Loss on related hedged items £131m (2016: £345m loss).3 Included in financing.
Financial risk and revenue sharing arrangements and other financial liabilitiesThe Group has financial liabilities arising from financial RRSAs. These financial liabilities are valued at each reporting date using the amortised cost method. This involves calculating the present value of the forecast cash flows of the arrangements using the internal rate of return at the inception of the arrangements as the discount rate.
Movements in the carrying values were as follows:
Financial RRSAs TotalCare Flex
2017£m
2016£m
2017£m
2016£m
At 1 January (101) (110) (15) –Exchange adjustments included in OCI (14) 5 – – Acquisition of business (157) – – – Additions – – – (14) Financing charge 1 (5) (6) – (1)Excluded from underlying profit:Changes in forecast payments 1 1 5 Exchange adjustments 1 10 (13) 1 (3)
Cash paid to partners 22 18 Other – – – 3
At 31 December (244) (101) (14) (15)
1 Included in financing.
Rolls-Royce Holdings plc Annual Report 2017 151Financial StatementsNotes to the Consolidated Financial Statements
FINA
NC
IAL STATEM
ENTS

17 Financial instruments continued
Risk management policies and hedging activities The principal financial risks to which the Group is exposed are: foreign currency exchange rate risk; liquidity risk; credit risk; interest rate risk; and commodity price risk. The Board has approved policies for the management of these risks.
Foreign currency exchange rate risk – The Group has significant cash flows (most significantly US dollars, followed by the euro) denominated in currencies other than the functional currency of the relevant trading entity. To manage its exposures to changes in values of future foreign currency cash flows, so as to maintain relatively stable long-term foreign exchange rates on settled transactions, the Group enters into derivative forward foreign currency transactions. For accounting purposes, these derivative contracts are generally not designated as hedging instruments.
The Group also has exposures to the fair values of non-derivative financial instruments denominated in foreign currencies. To manage the risk of changes in these fair values, the Group enters into derivative forward foreign exchange contracts, which are designated as fair value hedges for accounting purposes.
The Group regards its interests in overseas subsidiary companies as long-term investments. The Group aims to match its translational exposures by matching the currencies of assets and liabilities.
Liquidity risk – The Group’s policy is to hold financial investments and maintain undrawn committed facilities at a level sufficient to ensure that the Group has available funds to meet its medium-term capital and funding obligations and to meet any unforeseen obligations and opportunities. The Group holds cash and short-term investments, which together with the undrawn committed facilities, enable the Group to manage its liquidity risk.
Credit risk – The Group is exposed to credit risk to the extent of non-payment by either its customers or the counterparties of its financial instruments. The effective monitoring and controlling of credit risk is a key component of the Group’s risk management activities. The Group has credit policies covering both trading and financial exposures. Credit risks arising from treasury activities are managed by a central treasury function in accordance with the Group credit policy. The objective of the policy is to diversify and minimise the Group’s exposure to credit risk from its treasury activities by ensuring the Group transacts strictly with ‘BBB+’ or higher-rated financial institutions based on pre-established limits per financial institution. At the balance sheet date, there were no significant concentrations of credit risk to individual customers or counterparties. The maximum exposure to credit risk at the balance sheet date is represented by the carrying value of each financial asset, including derivative financial instruments.
Interest rate risk – The Group’s interest rate risk is primarily in relation to its fixed rate borrowings (fair value risk), floating rate borrowings and cash and cash equivalents (cash flow risk). Interest rate derivatives are used to manage the overall interest rate profile within the Group policy, which is to maintain a higher proportion of net funds at floating rates of interest as a natural hedge to the net cash position. These are designated as either fair value or cash flow hedges as appropriate.
Commodity risk – The Group has exposures to the price of jet fuel and base metals arising from business operations. To minimise its cash flow exposures to changes in commodity prices, the Group enters into derivative commodity transactions. For accounting purposes, these derivative contracts are generally not designated as hedging instruments.
Other price risk – The Group’s cash equivalent balances represent investments in money-market instruments, with a term of up to three months. The Group does not consider that these are subject to significant price risk.
152 Rolls-Royce Holdings plc Annual Report 2017Financial StatementsNotes to the Consolidated Financial Statements

17 Financial instruments continued
Derivative financial instrumentsThe nominal amounts, analysed by year of contractual maturity, and fair values of derivative financial instruments are as follows:
Contractual maturity Fair value
Nominalamount
£m
Withinone year
£m
Between one and
two years£m
Betweentwo and
five years£m
Afterfive years
£mAssets
£mLiabilities
£m
At 31 December 2017Foreign exchange contracts:Cash-flow hedges 214 97 81 36 – 7 –
Non-hedge accounted 29,130 4,505 3,674 13,051 7,900 382 (2,701)Interest rate contracts:Fair value hedges 2,650 – 500 1,035 1,115 227 – Cash-flow hedges 19 4 4 11 – – – Non-hedge accounted – – – – – 5 (5)
Commodity contracts:Cash-flow hedges 41 8 7 19 7 5 (3)Non-hedge accounted 241 85 68 81 7 20 (21)
32,295 4,699 4,334 14,233 9,029 646 (2,730)At 31 December 2016Foreign exchange contracts:Non-hedge accounted 29,021 3,403 5,056 12,484 8,078 17 (5,568)
Interest rate contracts:Fair value hedges 2,735 – – 1,548 1,187 358 – Non-hedge accounted – – – – – 6 (6)
Commodity contracts:Non-hedge accounted 300 83 80 122 15 6 (62)
32,056 3,486 5,136 14,154 9,280 387 (5,636)
As described above, all derivative financial instruments are entered into for risk management purposes, although these may not be designated into hedging relationships for accounting purposes.
Currency analysisDerivative financial instruments related to foreign exchange risks are denominated in the following currencies:
Currencies purchased forward
Sterling£m
US dollar£m
Euro£m
Other£m
Total£m
At 31 December 2017Currencies sold forward:Sterling – – 127 241 368 US dollar 25,177 – 2,272 802 28,251 Euro 136 177 – 251 564 Other 27 29 89 16 161
At 31 December 2016Currencies sold forward:Sterling – – 246 274 520 US dollar 25,089 – 1,882 903 27,874Euro 35 146 – 196 377 Other 13 101 112 24 250
Other derivative financial instruments are denominated in the following currencies:
2017£m
2016£m
Sterling 875 875 US dollar 1,383 1,515 Euro 693 645
Rolls-Royce Holdings plc Annual Report 2017 153Financial StatementsNotes to the Consolidated Financial Statements
FINA
NC
IAL STATEM
ENTS

17 Financial instruments continuedNon-derivative financial instruments are denominated in the following currencies:
Sterling£m
US dollar£m
Euro£m
Other£m
Total£m
At 31 December 2017Unlisted non-current investments – 5 20 1 26 Trade receivables and similar items 171 2,012 760 102 3,045 Other non-derivative financial assets 227 284 129 142 782 Short-term investments – – – 3 3 Cash and cash equivalents 827 1,055 807 264 2,953 Assets 1,225 3,356 1,716 512 6,809 Borrowings (1,462) (1,225) (767) (34) (3,488)Financial RRSAs – (60) (184) – (244)TotalCare Flex – (14) – – (14)C Shares (28) – – – (28)Trade payables and similar items (1,668) (1,652) (1,149) (133) (4,602)Other non-derivative financial liabilities (702) (536) (845) (67) (2,150)Liabilities (3,860) (3,487) (2,945) (234) (10,526)
(2,635) (131) (1,229) 278 (3,717)
At 31 December 2016Unlisted non-current investments – 1 36 1 38 Trade receivables and similar items 160 1,567 653 90 2,470 Other non-derivative financial assets 284 271 123 133 811 Short-term investments – – – 3 3 Cash and cash equivalents 1,134 831 507 299 2,771 Assets 1,578 2,670 1,319 526 6,093 Borrowings (1,194) (1,374) (783) (6) (3,357)Financial RRSAs 9 (78) (32) – (101)TotalCare Flex – (15) – – (15)C Shares (28) – – – (28)Trade payables and similar items (1,730) (1,437) (573) (149) (3,889)Other non-derivative financial liabilities (889) (588) (138) (45) (1,660)Liabilities (3,832) (3,492) (1,526) (200) (9,050)
(2,254) (822) (207) 326 (2,957)
Currency exposuresThe Group’s actual currency exposures after taking account of derivative foreign currency contracts, which may not be designated as hedging instruments for accounting purposes are as follows:
Functional currency of Group operationsSterling
£mUS dollar
£mEuro
£mOther
£mTotal
£m
At 31 December 2017Sterling 1 – 3 (642) 11 (628)US dollar (10) – (5) 8 (7)Euro 3 212 – 7 222 Other – 4 18 (3) 19 At 31 December 2016Sterling – (1) 3 – 2 US dollar (22) – (2) 19 (5)Euro (2) (1) – 1 (2)Other 3 9 18 2 32
1 The euro exposure primarily relates to deferred consideration payable on the acquisition of ITP Aero. Movements in this balance in relation to foreign exchange (recognised through the consolidated income statement) are partially matched by the related foreign exchange movement in the subsidiary’s net assets, recognised through the consolidated statement of other comprehensive income.
154 Rolls-Royce Holdings plc Annual Report 2017Financial StatementsNotes to the Consolidated Financial Statements

17 Financial instruments continued
Ageing beyond contractual due date of financial assets
Withinterms
£m
Up tothree
monthsoverdue
£m
Betweenthree
months andone yearoverdue
£m
More thanone yearoverdue
£mTotal
£m
At 31 December 2017Unlisted non-current asset investments 26 – – – 26 Trade receivables and similar items 2,723 199 70 53 3,045 Other non-derivative financial assets 781 – 1 – 782 Derivative financial assets 646 – – – 646 Short-term investments 3 – – – 3 Cash and cash equivalents 2,953 – – – 2,953
7,132 199 71 53 7,455
At 31 December 2016Unlisted non-current asset investments 38 – – – 38 Trade receivables and similar items 2,133 218 85 34 2,470 Other non-derivative financial assets 796 13 – 2 811 Derivative financial assets 387 – – – 387 Short-term investments 3 – – – 3 Cash and cash equivalents 2,771 – – – 2,771
6,128 231 85 36 6,480
Contractual maturity analysis of financial liabilitiesGross values
Withinone year
£m
Betweenone and
two years£m
Betweentwo and
five years£m
Afterfive years
£mDiscounting
£m
Carryingvalue
£m
At 31 December 2017Borrowings (186) (831) (1,345) (1,598) 472 (3,488)Derivative financial liabilities 1 (514) (561) (1,448) (785) 578 (2,730)Financial RRSAs (40) (50) (96) (80) 22 (244)TotalCare Flex – – (17) – 3 (14)C Shares (28) – – – – (28)Trade payables and similar items (4,545) (40) (17) – – (4,602)Other non-derivative financial liabilities (1,262) (436) (331) (121) – (2,150)
(6,575) (1,918) (3,254) (2,584) 1,075 (13,256)Derivative financial liabilities comprise:Cash inflows on foreign exchange contracts 3,443 3,310 8,310 4,321 Cash outflows on foreign exchange contracts (3,947) (3,862) (9,748) (5,106)Other net cash flows (10) (9) (10) – Total (514) (561) (1,448) (785)
At 31 December 2016Borrowings (276) (114) (2,007) (1,458) 498 (3,357)Derivative financial liabilities 1 (605) (1,298) (3,196) (1,424) 887 (5,636)Financial RRSAs (24) (26) (66) (2) 17 (101)TotalCare Flex – – (18) – 3 (15)C Shares (28) – – – – (28)Trade payables and similar items (3,860) (15) – (14) – (3,889)Other non-derivative financial liabilities (1,080) (68) (438) (74) – (1,660)
(5,873) (1,521) (5,725) (2,972) 1,405 (14,686)
Derivative financial liabilities comprise:Cash inflows on foreign exchange contracts 3,079 5,013 12,409 7,342 Cash outflows on foreign exchange contracts (3,660) (6,295) (15,582) (8,763)Other net cash flows (24) (16) (23) (3)Total (605) (1,298) (3,196) (1,424)
1 The Group regularly renegotiates the contractual maturities of its foreign exchange contracts. In general, the effect of such negotiations is the settlement of derivative financial liabilities somewhat earlier than the contractual maturity date.
Rolls-Royce Holdings plc Annual Report 2017 155Financial StatementsNotes to the Consolidated Financial Statements
FINA
NC
IAL STATEM
ENTS
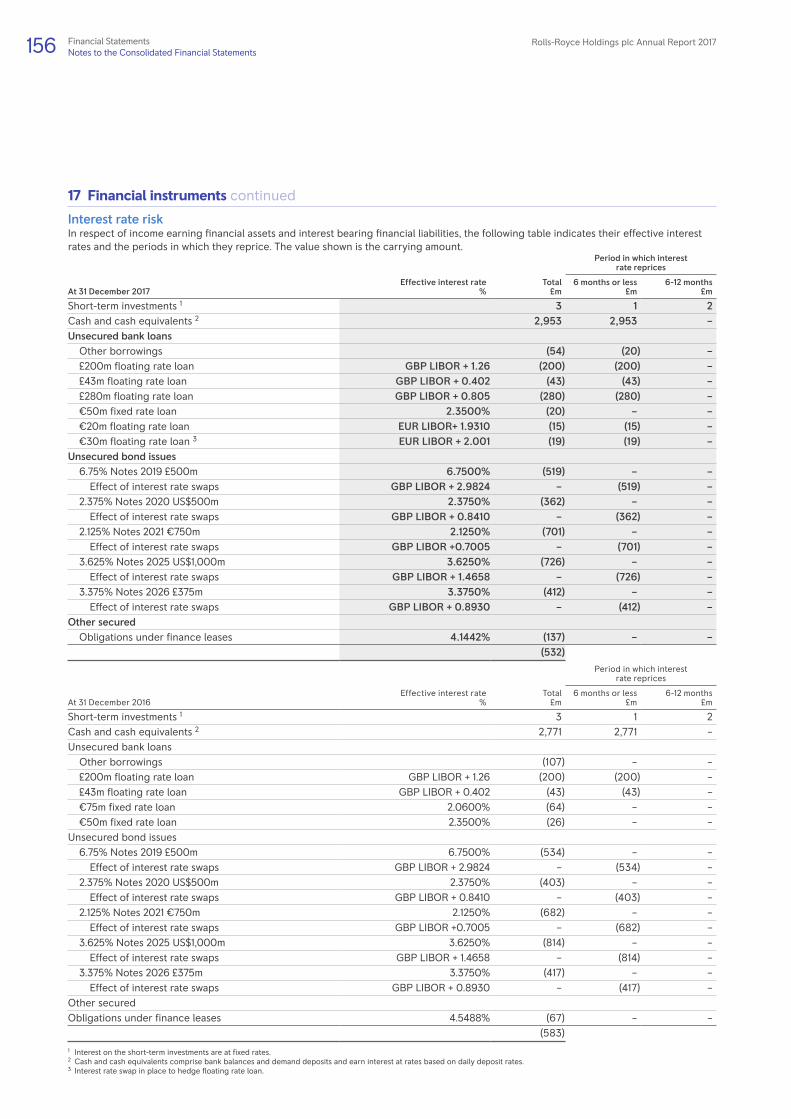
17 Financial instruments continued
Interest rate riskIn respect of income earning financial assets and interest bearing financial liabilities, the following table indicates their effective interest rates and the periods in which they reprice. The value shown is the carrying amount.
Period in which interest rate reprices
At 31 December 2017Effective interest rate
%Total
£m6 months or less
£m6-12 months
£m
Short-term investments 1 3 1 2 Cash and cash equivalents 2 2,953 2,953 – Unsecured bank loansOther borrowings (54) (20) – £200m floating rate loan GBP LIBOR + 1.26 (200) (200) – £43m floating rate loan GBP LIBOR + 0.402 (43) (43) – £280m floating rate loan GBP LIBOR + 0.805 (280) (280) – €50m fixed rate loan 2.3500% (20) – – €20m floating rate loan EUR LIBOR+ 1.9310 (15) (15) – €30m floating rate loan 3 EUR LIBOR + 2.001 (19) (19) –
Unsecured bond issues6.75% Notes 2019 £500m 6.7500% (519) – – Effect of interest rate swaps GBP LIBOR + 2.9824 – (519) – 2.375% Notes 2020 US$500m 2.3750% (362) – – Effect of interest rate swaps GBP LIBOR + 0.8410 – (362) – 2.125% Notes 2021 €750m 2.1250% (701) – – Effect of interest rate swaps GBP LIBOR +0.7005 – (701) – 3.625% Notes 2025 US$1,000m 3.6250% (726) – – Effect of interest rate swaps GBP LIBOR + 1.4658 – (726) – 3.375% Notes 2026 £375m 3.3750% (412) – – Effect of interest rate swaps GBP LIBOR + 0.8930 – (412) –
Other securedObligations under finance leases 4.1442% (137) – –
(532)Period in which interest
rate reprices
At 31 December 2016Effective interest rate
%Total£m
6 months or less£m
6-12 months£m
Short-term investments 1 3 1 2 Cash and cash equivalents 2 2,771 2,771 – Unsecured bank loansOther borrowings (107) – – £200m floating rate loan GBP LIBOR + 1.26 (200) (200) – £43m floating rate loan GBP LIBOR + 0.402 (43) (43) – €75m fixed rate loan 2.0600% (64) – – €50m fixed rate loan 2.3500% (26) – –
Unsecured bond issues6.75% Notes 2019 £500m 6.7500% (534) – – Effect of interest rate swaps GBP LIBOR + 2.9824 – (534) – 2.375% Notes 2020 US$500m 2.3750% (403) – – Effect of interest rate swaps GBP LIBOR + 0.8410 – (403) – 2.125% Notes 2021 €750m 2.1250% (682) – – Effect of interest rate swaps GBP LIBOR +0.7005 – (682) – 3.625% Notes 2025 US$1,000m 3.6250% (814) – – Effect of interest rate swaps GBP LIBOR + 1.4658 – (814) – 3.375% Notes 2026 £375m 3.3750% (417) – – Effect of interest rate swaps GBP LIBOR + 0.8930 – (417) –
Other securedObligations under finance leases 4.5488% (67) – –
(583)
1 Interest on the short-term investments are at fixed rates. 2 Cash and cash equivalents comprise bank balances and demand deposits and earn interest at rates based on daily deposit rates. 3 Interest rate swap in place to hedge floating rate loan.
156 Rolls-Royce Holdings plc Annual Report 2017Financial StatementsNotes to the Consolidated Financial Statements

17 Financial instruments continuedSome of the Group’s borrowings are subject to the Group meeting certain obligations, including customary financial covenants. If the Group fails to meet its obligations these arrangements give rights to the lenders, upon agreement, to accelerate repayment of the facilities. There are no rating triggers contained in any of the Group’s facilities that could require the Group to accelerate or repay any facility for a given movement in the Group’s credit rating.
In addition, the Group has £2,106m (2016: £2,280m) of undrawn committed borrowing facilities of which £2,000m is available for at least the next two years.
Sensitivity analysisSensitivities at 31 December (all other variables held constant) – impact on profit after tax and equity
2017£m
2016£m
Sterling 10% weaker against the US dollar (2,323) (2,552)Sterling 10% stronger against the US dollar 1,856 2,089 Euro 10% weaker against the US dollar (126) (158)Euro 10% stronger against the US dollar 99 133 Sterling 10% weaker against the Euro (14) 26 Sterling 10% stronger against the Euro 11 (21)Commodity prices 10% lower (22) (19)Commodity prices 10% higher 22 19
At 31 December 2017, the Group had no material sensitivity to changes in interest rates on that date. The main interest rate sensitivity for the Group arises as a result of the gross up of net cash and this is mitigated as described under the interest rate risk management policies on page 152.
C Shares and payments to shareholdersThe Company issues non-cumulative redeemable preference shares (C Shares) as an alternative to paying a cash dividend. C Shares in respect of a year are issued in the following year. Shareholders are able to redeem any number of their C Shares for cash. Any C Shares retained attract a dividend of 75% of LIBOR on the 0.1p nominal value of each share, paid on a twice-yearly basis, and have limited voting rights. The Company has the option to compulsorily redeem the C Shares, at any time, if the aggregate number of C Shares in issue is less than 10% of the aggregate number of C Shares issued, or on the acquisition or capital restructuring of the Company.
Movements in issued and fully paid C Shares during the year were as follows:
2017 2016
Millions
Nominalvalue
£m Millions
Nominalvalue£m
At 1 January 28,125 28 28,960 29 Issued 215,235 215 300,993 301 Redeemed (214,931) (215) (301,828) (302)
At 31 December 28,429 28 28,125 28
Payments to shareholders in respect of the year represent the value of C Shares to be issued in respect of the results for the year. Issues of C Shares were declared as follows:
2017 2016
Penceper share £m
Penceper share £m
Interim 4.60 85 4.60 85 Final 7.10 131 7.10 130
11.70 216 11.70 215
Rolls-Royce Holdings plc Annual Report 2017 157Financial StatementsNotes to the Consolidated Financial Statements
FINA
NC
IAL STATEM
ENTS

18 Provisions for liabilities and chargesAt
1 January2017
£m
Exchangedifferences
£m
Acquisition of business
£m
Re-classification 1
£m
Unused amountsreversed
£m
Charged toincome
statement£m
Utilised£m
At31 December
2017£m
Warranties and guarantees 1 474 – 5 (61) (18) 140 (111) 429 Contract loss 54 (1) 63 – (3) 14 (21) 106 Restructuring 44 1 – – (7) 28 (30) 36 Customer financing 19 – – – (3) 5 – 21 Insurance 68 – – – – 27 (32) 63 Tax related interest and penalties – – – 56 – – – 56 Employer liability claims 1 – – – 61 – – – 61 Other 100 (2) – – (26) 114 (75) 111
759 (2) 68 56 (57) 328 (269) 883 Current liabilities 543 526 Non-current liabilities 216 357
1 The reclassification of provisions includes: (i) £61m relating to employer healthcare liability claims as a result of an historic insolvency of the previous provider; and (ii) a provision for tax related interest and penalties of £56m that was previously included in current tax liabilities which has been reclassified following guidance issued by the International Financial Reporting Interpretations Committee (IFRIC) in September 2017. Prior year figures have not been restated.
Provisions for warranties and guarantees primarily relate to products sold and generally cover a period of up to three years.
Provisions for contract loss and restructuring are generally expected to be utilised within two years.
In connection with the sale of its products the Group will, on some occasions, provide financing support for its customers – generally in respect of civil aircraft. The Group’s commitments relating to these financing arrangements are spread over many years, relate to a number of customers and a broad product portfolio and are generally secured on the asset subject to the financing. These include commitments of US$3.3bn (2016: US$3.2bn) (on a discounted basis) to provide borrowing facilities to enable customers to purchase aircraft (of which approximately US$390m (on a discounted basis) could be called during 2018). These facilities may only be used if the customer is unable to obtain financing elsewhere and are priced at a premium to the market rate. Consequently the Directors do not consider that there is a significant exposure arising from the provision of these facilities.
Customer financing provisions cover guarantees provided for asset value and/or financing. It is estimated that the provision will be utilised as follows:
2017£m
2016£m
Potential claims with specific claim dates:In one year or less 11 2 In more than one year but less than five years 5 12 In more than five years 5 5
21 19
Commitments on delivered aircraft in excess of the amounts provided are shown in the table below. These are reported on a discounted basis at the Group’s borrowing rate to reflect better the time span over which these exposures could arise. These amounts do not represent values that are expected to crystallise. The commitments are denominated in US dollars. As the Group does not generally adopt cash flow hedge accounting for future foreign exchange transactions, this amount is reported, together with the sterling equivalent at the reporting date spot rate. The values of aircraft providing security are based on advice from a specialist aircraft appraiser.
2017 2016
£m $m £m $m
Gross commitments 145 196 238 293 Value of security 1 (41) (55) (103) (126)Indemnities (51) (69) (74) (91)Net commitments 53 72 61 76
Net commitments with security reduced by 20% 2 64 86 86 106 1 Security includes unrestricted cash collateral of: 22 29 38 47
2 Although sensitivity calculations are complex, the reduction of relevant security by 20% illustrates the sensitivity to changes in this assumption.
The Group’s captive insurance company retains a portion of the exposures it insures on behalf of the remainder of the Group. Significant delays occur in the notification and settlement of claims and judgement is involved in assessing outstanding liabilities, the ultimate cost and timing of which cannot be known with certainty at the balance sheet date. The insurance provisions are based on information currently available, however it is inherent in the nature of the business that ultimate liabilities may vary. Provisions for outstanding claims are established to cover the outstanding expected liability as well as claims incurred but not yet reported.
Other provisions comprise a number of liabilities with varying expected utilisation rates.
158 Rolls-Royce Holdings plc Annual Report 2017Financial StatementsNotes to the Consolidated Financial Statements

19 Post-retirement benefitsThe Group operates a number of defined benefit and defined contribution schemes:
– The UK defined benefit scheme is funded, with the assets held in a separate trustee-administered fund. Employees are entitled to retirement benefits based on either their final or career-average salaries and length of service.
– Overseas defined benefit schemes are a mixture of funded and unfunded plans and provide benefits in line with local practice. Additionally, in the US, and to a lesser extent in some other countries, the Group’s employment practices include the provision of healthcare and life insurance benefits for retired employees. These schemes are unfunded.
The valuations of the defined benefit schemes are based on the most recent funding valuations, where relevant, updated by the scheme actuaries to 31 December 2017.
The defined benefit schemes expose the Group to actuarial risks such as longevity, interest rate, inflation and investment risks. In the UK, and in the principal US and Canadian pension schemes, the Group has adopted investment policies to mitigate some of these risks. This involves investing a significant proportion of the schemes’ assets in Liability Driven Investment portfolios, which hold investments designed to offset interest rate and inflation rate risks. In addition, in the UK, the scheme has invested in a longevity swap, which is designed to offset longevity risks in respect of approximately two thirds of current pensioners.
Following the buy-out of the liabilities of the Vickers Group Pension Scheme in 2016, the scheme returned its remaining surplus of £5m (net of tax) to the Group in the year. This scheme is expected to be formally wound up in early 2018.
Amounts recognised in the income statement2017 2016
UKschemes
£m
Overseasschemes
£mTotal
£m
UKschemes
£m
Overseasschemes
£mTotal£m
Defined benefit schemes:Current service cost and administrative expenses 1 190 58 248 169 50 219 Past-service (credit)/cost (8) – (8) (22) 1 (21)Settlements 1 – – – 302 10 312
182 58 240 449 61 510 Defined contribution schemes 33 100 133 29 87 116 Operating cost 215 158 373 478 148 626 Net financing (credit)/charge in respect of defined benefit schemes (38) 37 (1) (41) 38 (3)Total income statement charge 177 195 372 437 186 623
1 In 2016, £306m of costs were excluded from the underlying results, these comprised: £301m settlement cost on the buy-out of the Vickers Group Pension Scheme; £3m of administrative expenses on the restructuring all the UK defined benefit plans; and £2m settlement cost in relation to winding-up lump sums on small pensions as a consequence of the restructuring.
The operating cost is charged as follows:
Defined benefit Defined contribution Total
2017£m
2016£m
2017£m
2016£m
2017£m
2016£m
Cost of sales 169 133 92 72 261 205 Commercial and administrative costs 38 343 23 27 61 370 Research and development 33 34 18 17 51 51
240 510 133 116 373 626
Rolls-Royce Holdings plc Annual Report 2017 159Financial StatementsNotes to the Consolidated Financial Statements
FINA
NC
IAL STATEM
ENTS
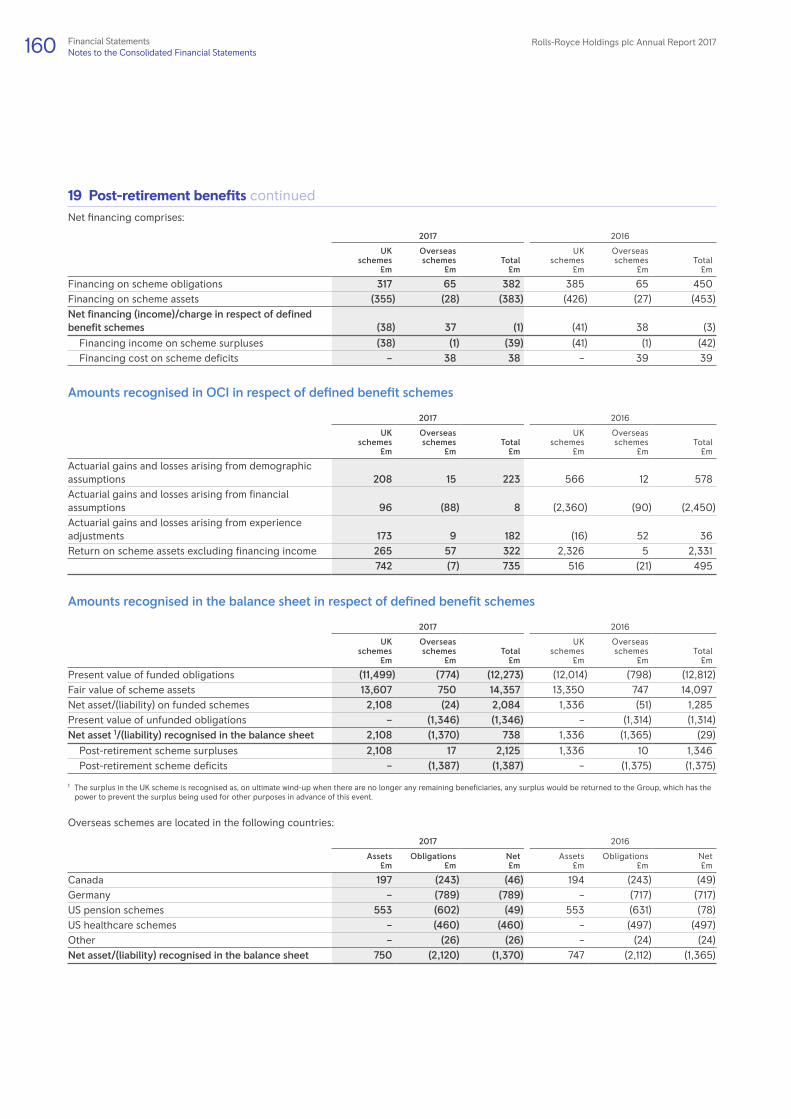
19 Post-retirement benefits continuedNet financing comprises:
2017 2016
UKschemes
£m
Overseasschemes
£mTotal
£m
UKschemes
£m
Overseasschemes
£mTotal£m
Financing on scheme obligations 317 65 382 385 65 450 Financing on scheme assets (355) (28) (383) (426) (27) (453)Net financing (income)/charge in respect of defined benefit schemes (38) 37 (1) (41) 38 (3)
Financing income on scheme surpluses (38) (1) (39) (41) (1) (42)Financing cost on scheme deficits – 38 38 – 39 39
Amounts recognised in OCI in respect of defined benefit schemes
2017 2016
UKschemes
£m
Overseasschemes
£mTotal
£m
UKschemes
£m
Overseasschemes
£mTotal£m
Actuarial gains and losses arising from demographic assumptions 208 15 223 566 12 578 Actuarial gains and losses arising from financial assumptions 96 (88) 8 (2,360) (90) (2,450)Actuarial gains and losses arising from experience adjustments 173 9 182 (16) 52 36 Return on scheme assets excluding financing income 265 57 322 2,326 5 2,331
742 (7) 735 516 (21) 495
Amounts recognised in the balance sheet in respect of defined benefit schemes
2017 2016
UKschemes
£m
Overseasschemes
£mTotal
£m
UKschemes
£m
Overseasschemes
£mTotal£m
Present value of funded obligations (11,499) (774) (12,273) (12,014) (798) (12,812)Fair value of scheme assets 13,607 750 14,357 13,350 747 14,097 Net asset/(liability) on funded schemes 2,108 (24) 2,084 1,336 (51) 1,285 Present value of unfunded obligations – (1,346) (1,346) – (1,314) (1,314)Net asset 1/(liability) recognised in the balance sheet 2,108 (1,370) 738 1,336 (1,365) (29)
Post-retirement scheme surpluses 2,108 17 2,125 1,336 10 1,346 Post-retirement scheme deficits – (1,387) (1,387) – (1,375) (1,375)
1 The surplus in the UK scheme is recognised as, on ultimate wind-up when there are no longer any remaining beneficiaries, any surplus would be returned to the Group, which has the power to prevent the surplus being used for other purposes in advance of this event.
Overseas schemes are located in the following countries:
2017 2016
Assets£m
Obligations£m
Net£m
Assets£m
Obligations£m
Net£m
Canada 197 (243) (46) 194 (243) (49)Germany – (789) (789) – (717) (717)US pension schemes 553 (602) (49) 553 (631) (78)US healthcare schemes – (460) (460) – (497) (497)Other – (26) (26) – (24) (24)Net asset/(liability) recognised in the balance sheet 750 (2,120) (1,370) 747 (2,112) (1,365)
160 Rolls-Royce Holdings plc Annual Report 2017Financial StatementsNotes to the Consolidated Financial Statements
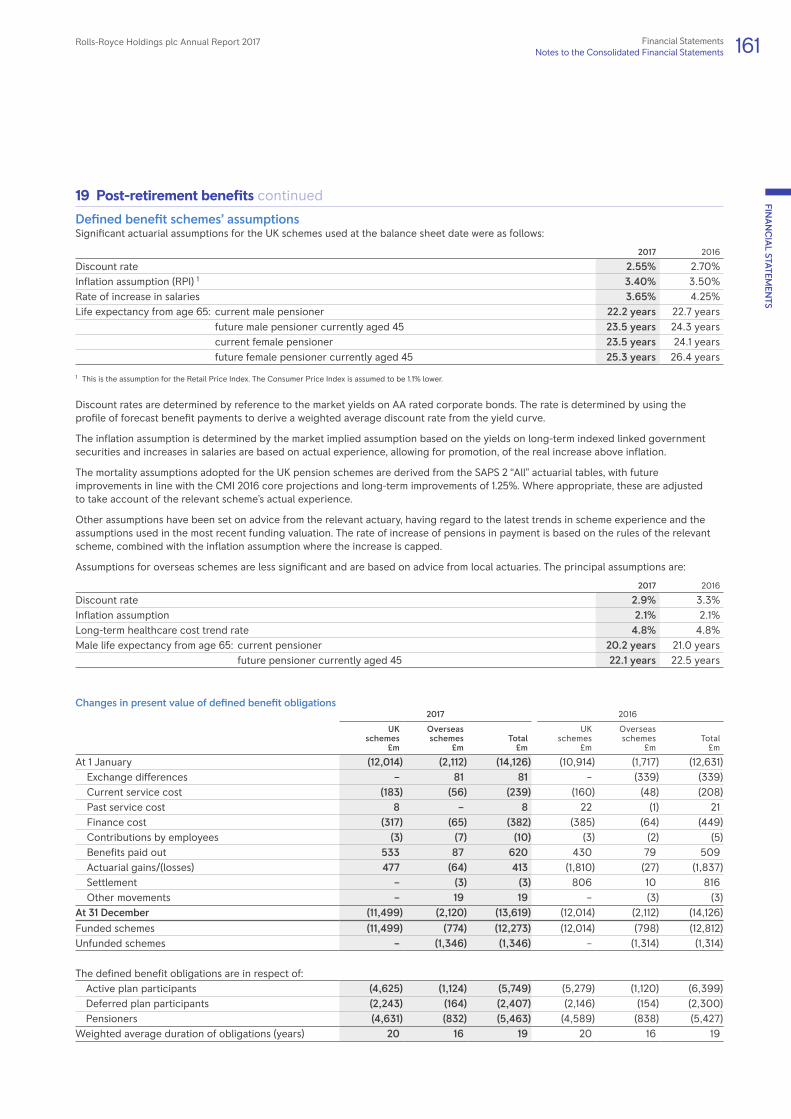
19 Post-retirement benefits continued
Defined benefit schemes’ assumptionsSignificant actuarial assumptions for the UK schemes used at the balance sheet date were as follows:
2017 2016
Discount rate 2.55% 2.70%Inflation assumption (RPI) 1 3.40% 3.50%Rate of increase in salaries 3.65% 4.25%Life expectancy from age 65: current male pensioner 22.2 years 22.7 years future male pensioner currently aged 45 23.5 years 24.3 years current female pensioner 23.5 years 24.1 years future female pensioner currently aged 45 25.3 years 26.4 years
1 This is the assumption for the Retail Price Index. The Consumer Price Index is assumed to be 1.1% lower.
Discount rates are determined by reference to the market yields on AA rated corporate bonds. The rate is determined by using the profile of forecast benefit payments to derive a weighted average discount rate from the yield curve.
The inflation assumption is determined by the market implied assumption based on the yields on long-term indexed linked government securities and increases in salaries are based on actual experience, allowing for promotion, of the real increase above inflation.
The mortality assumptions adopted for the UK pension schemes are derived from the SAPS 2 “All” actuarial tables, with future improvements in line with the CMI 2016 core projections and long-term improvements of 1.25%. Where appropriate, these are adjusted to take account of the relevant scheme’s actual experience.
Other assumptions have been set on advice from the relevant actuary, having regard to the latest trends in scheme experience and the assumptions used in the most recent funding valuation. The rate of increase of pensions in payment is based on the rules of the relevant scheme, combined with the inflation assumption where the increase is capped.
Assumptions for overseas schemes are less significant and are based on advice from local actuaries. The principal assumptions are:
2017 2016
Discount rate 2.9% 3.3%Inflation assumption 2.1% 2.1%Long-term healthcare cost trend rate 4.8% 4.8%Male life expectancy from age 65: current pensioner 20.2 years 21.0 years future pensioner currently aged 45 22.1 years 22.5 years
Changes in present value of defined benefit obligations2017 2016
UKschemes
£m
Overseasschemes
£mTotal
£m
UKschemes
£m
Overseasschemes
£mTotal£m
At 1 January (12,014) (2,112) (14,126) (10,914) (1,717) (12,631)Exchange differences – 81 81 – (339) (339)Current service cost (183) (56) (239) (160) (48) (208)Past service cost 8 – 8 22 (1) 21 Finance cost (317) (65) (382) (385) (64) (449)Contributions by employees (3) (7) (10) (3) (2) (5)Benefits paid out 533 87 620 430 79 509 Actuarial gains/(losses) 477 (64) 413 (1,810) (27) (1,837)Settlement – (3) (3) 806 10 816Other movements – 19 19 – (3) (3)
At 31 December (11,499) (2,120) (13,619) (12,014) (2,112) (14,126)
Funded schemes (11,499) (774) (12,273) (12,014) (798) (12,812)Unfunded schemes – (1,346) (1,346) – (1,314) (1,314)
The defined benefit obligations are in respect of: Active plan participants (4,625) (1,124) (5,749) (5,279) (1,120) (6,399) Deferred plan participants (2,243) (164) (2,407) (2,146) (154) (2,300) Pensioners (4,631) (832) (5,463) (4,589) (838) (5,427)Weighted average duration of obligations (years) 20 16 19 20 16 19
Rolls-Royce Holdings plc Annual Report 2017 161Financial StatementsNotes to the Consolidated Financial Statements
FINA
NC
IAL STATEM
ENTS
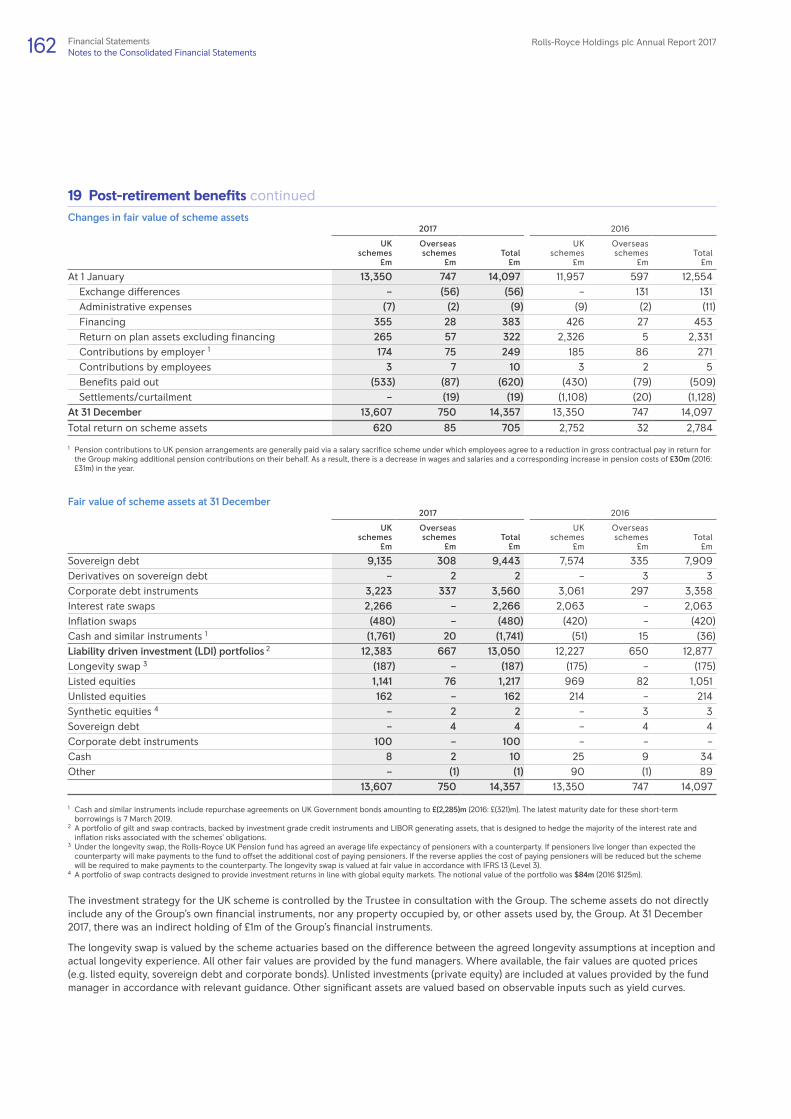
19 Post-retirement benefits continuedChanges in fair value of scheme assets
2017 2016
UKschemes
£m
Overseasschemes
£mTotal
£m
UKschemes
£m
Overseasschemes
£mTotal£m
At 1 January 13,350 747 14,097 11,957 597 12,554 Exchange differences – (56) (56) – 131 131 Administrative expenses (7) (2) (9) (9) (2) (11)Financing 355 28 383 426 27 453 Return on plan assets excluding financing 265 57 322 2,326 5 2,331 Contributions by employer 1 174 75 249 185 86 271 Contributions by employees 3 7 10 3 2 5 Benefits paid out (533) (87) (620) (430) (79) (509)Settlements/curtailment – (19) (19) (1,108) (20) (1,128)
At 31 December 13,607 750 14,357 13,350 747 14,097
Total return on scheme assets 620 85 705 2,752 32 2,784
1 Pension contributions to UK pension arrangements are generally paid via a salary sacrifice scheme under which employees agree to a reduction in gross contractual pay in return for the Group making additional pension contributions on their behalf. As a result, there is a decrease in wages and salaries and a corresponding increase in pension costs of £30m (2016: £31m) in the year.
Fair value of scheme assets at 31 December2017 2016
UKschemes
£m
Overseasschemes
£mTotal
£m
UKschemes
£m
Overseasschemes
£mTotal£m
Sovereign debt 9,135 308 9,443 7,574 335 7,909 Derivatives on sovereign debt – 2 2 – 3 3 Corporate debt instruments 3,223 337 3,560 3,061 297 3,358 Interest rate swaps 2,266 – 2,266 2,063 – 2,063 Inflation swaps (480) – (480) (420) – (420)Cash and similar instruments 1 (1,761) 20 (1,741) (51) 15 (36)Liability driven investment (LDI) portfolios 2 12,383 667 13,050 12,227 650 12,877 Longevity swap 3 (187) – (187) (175) – (175)Listed equities 1,141 76 1,217 969 82 1,051 Unlisted equities 162 – 162 214 – 214 Synthetic equities 4 – 2 2 – 3 3 Sovereign debt – 4 4 – 4 4 Corporate debt instruments 100 – 100 – – – Cash 8 2 10 25 9 34 Other – (1) (1) 90 (1) 89
13,607 750 14,357 13,350 747 14,097
1 Cash and similar instruments include repurchase agreements on UK Government bonds amounting to £(2,285)m (2016: £(321)m). The latest maturity date for these short-term borrowings is 7 March 2019.
2 A portfolio of gilt and swap contracts, backed by investment grade credit instruments and LIBOR generating assets, that is designed to hedge the majority of the interest rate and inflation risks associated with the schemes’ obligations.
3 Under the longevity swap, the Rolls-Royce UK Pension fund has agreed an average life expectancy of pensioners with a counterparty. If pensioners live longer than expected the counterparty will make payments to the fund to offset the additional cost of paying pensioners. If the reverse applies the cost of paying pensioners will be reduced but the scheme will be required to make payments to the counterparty. The longevity swap is valued at fair value in accordance with IFRS 13 (Level 3).
4 A portfolio of swap contracts designed to provide investment returns in line with global equity markets. The notional value of the portfolio was $84m (2016 $125m).
The investment strategy for the UK scheme is controlled by the Trustee in consultation with the Group. The scheme assets do not directly include any of the Group’s own financial instruments, nor any property occupied by, or other assets used by, the Group. At 31 December 2017, there was an indirect holding of £1m of the Group’s financial instruments.
The longevity swap is valued by the scheme actuaries based on the difference between the agreed longevity assumptions at inception and actual longevity experience. All other fair values are provided by the fund managers. Where available, the fair values are quoted prices (e.g. listed equity, sovereign debt and corporate bonds). Unlisted investments (private equity) are included at values provided by the fund manager in accordance with relevant guidance. Other significant assets are valued based on observable inputs such as yield curves.
162 Rolls-Royce Holdings plc Annual Report 2017Financial StatementsNotes to the Consolidated Financial Statements

19 Post-retirement benefits continued
Future contributionsThe Group expects to contribute approximately £230m to its defined benefit schemes in respect of 2018 (UK: £145m, Overseas: £85m).
In the UK, the funding is based on a statutory triennial funding valuation process. This includes a negotiation between the Group and the Trustee on actuarial assumptions used to value obligations (Technical Provisions) which may differ from those used for accounting set out above. The assumptions used to value Technical Provisions must be prudent rather than a best estimate of the liability. Most notably, the Technical Provision discount rate is currently based upon UK Government yields plus 0.5% rather than being based on yields of AA corporate bonds. Following the triennial valuation process, a Schedule of Contributions (SoC) must be agreed which sets out the required contribution for current service cost and any contributions from the employer to eliminate a deficit. The most recent valuation, as at 31 March 2017, agreed by the Trustee in December 2017, showed that the UK scheme was estimated to be 112% funded on the Technical Provisions basis. Employer contributions (inclusive of employee contributions paid by a salary sacrifice arrangement) will subsequently be paid at a rate of 27% in 2018/19 and 28.5% in 2020 (2017: 31.6%). The SoC includes an arrangement for a potential increase in contributions during 2021 to 2023 (capped at £48.3m a year) if the Technical Provisions funding position is below 107% at 31 March 2020. As at 31 December 2017 the Technical Provisions funding position was estimated to be 114%.
SensitivitiesThe calculations of the defined benefit obligations are sensitive to the assumptions set out above. The following table summarises how the estimated impact of a change in a significant assumption would affect the UK defined benefit surplus at 31 December 2017, while holding all other assumptions constant. This sensitivity analysis may not be representative of the actual change in the defined benefit obligation as it is unlikely that the change in assumptions would occur in isolation of one another as some of the assumptions may be correlated.
For the most significant funded schemes, the investment strategies hedge the risks from interest rates and inflation measured on a proxy solvency basis. For the UK scheme, the interest rate and inflation hedging is currently based on UK Government bond yields without any adjustment for any credit spread. The longevity risk of approximately two thirds of UK pensioner liabilities is also hedged. Where appropriate, the table also includes the corresponding movement in the value of the plan assets.
2017£m
2016£m
Reduction in the discount rate of 0.25% 1 Obligation (590) (625)Plan assets (LDI portfolio) 675 630
Increase in inflation of 0.25% 1 Obligation (310) (320)Plan assets (LDI portfolio) 291 272
Real increase in salaries of 0.25% Obligations (105) (115)One year increase in life expectancy Obligations (545) (415)
1 The differences between the sensitivities on obligations and plan assets arise largely due to differences in the methods used to value the obligations for accounting purposes and the adopted proxy solvency basis.
20 Share capitalNon-equity Equity
SpecialShare
of £1
Nominalvalue
£m
Ordinary shares
of 20p eachMillions
Nominalvalue
£m
Issued and fully paidAt 1 January 2016 and 1 January 2017 1 – 1,838 367Shares issued to share trust – – 2 1
At 31 December 2017 1 – 1,840 368
The rights attaching to each class of share are set out on page 198.
In accordance with IAS 32 Financial Instruments: Presentation, the Company’s non-cumulative redeemable preference shares (C Shares) are classified as financial liabilities. Accordingly, movements in C Shares are included in note 17.
Rolls-Royce Holdings plc Annual Report 2017 163Financial StatementsNotes to the Consolidated Financial Statements
FINA
NC
IAL STATEM
ENTS
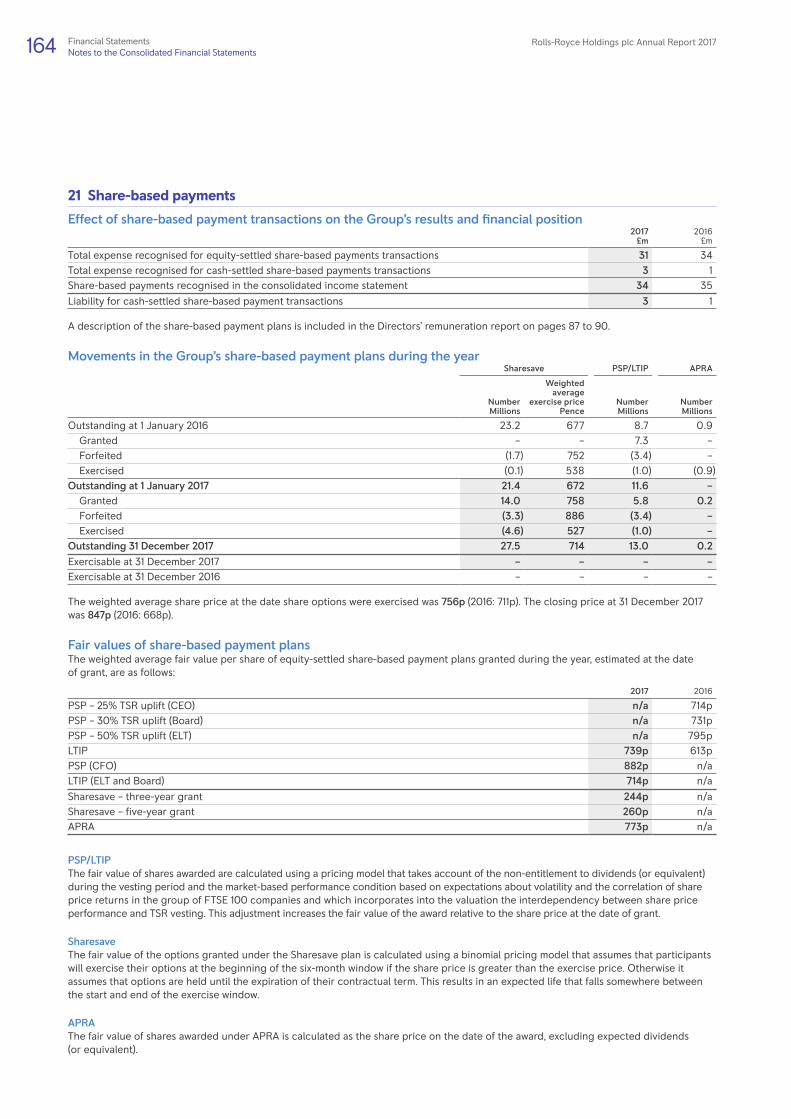
21 Share-based payments
Effect of share-based payment transactions on the Group’s results and financial position2017
£m 2016£m
Total expense recognised for equity-settled share-based payments transactions 31 34 Total expense recognised for cash-settled share-based payments transactions 3 1 Share-based payments recognised in the consolidated income statement 34 35
Liability for cash-settled share-based payment transactions 3 1
A description of the share-based payment plans is included in the Directors’ remuneration report on pages 87 to 90.
Movements in the Group’s share-based payment plans during the yearSharesave PSP/LTIP APRA
NumberMillions
Weighted average
exercise pricePence
NumberMillions
NumberMillions
Outstanding at 1 January 2016 23.2 677 8.7 0.9Granted – – 7.3 – Forfeited (1.7) 752 (3.4) – Exercised (0.1) 538 (1.0) (0.9)
Outstanding at 1 January 2017 21.4 672 11.6 –Granted 14.0 758 5.8 0.2 Forfeited (3.3) 886 (3.4) – Exercised (4.6) 527 (1.0) –
Outstanding 31 December 2017 27.5 714 13.0 0.2 Exercisable at 31 December 2017 – – – – Exercisable at 31 December 2016 – – – –
The weighted average share price at the date share options were exercised was 756p (2016: 711p). The closing price at 31 December 2017 was 847p (2016: 668p).
Fair values of share-based payment plansThe weighted average fair value per share of equity-settled share-based payment plans granted during the year, estimated at the date of grant, are as follows:
2017 2016
PSP – 25% TSR uplift (CEO) n/a 714p PSP – 30% TSR uplift (Board) n/a 731p PSP – 50% TSR uplift (ELT) n/a 795p LTIP 739p 613pPSP (CFO) 882p n/aLTIP (ELT and Board) 714p n/a
Sharesave – three-year grant 244p n/a Sharesave – five-year grant 260p n/a APRA 773p n/a
PSP/LTIPThe fair value of shares awarded are calculated using a pricing model that takes account of the non-entitlement to dividends (or equivalent) during the vesting period and the market-based performance condition based on expectations about volatility and the correlation of share price returns in the group of FTSE 100 companies and which incorporates into the valuation the interdependency between share price performance and TSR vesting. This adjustment increases the fair value of the award relative to the share price at the date of grant.
SharesaveThe fair value of the options granted under the Sharesave plan is calculated using a binomial pricing model that assumes that participants will exercise their options at the beginning of the six-month window if the share price is greater than the exercise price. Otherwise it assumes that options are held until the expiration of their contractual term. This results in an expected life that falls somewhere between the start and end of the exercise window.
APRAThe fair value of shares awarded under APRA is calculated as the share price on the date of the award, excluding expected dividends (or equivalent).
164 Rolls-Royce Holdings plc Annual Report 2017Financial StatementsNotes to the Consolidated Financial Statements

22 Leases
Operating leasesLeases as lessee
2017£m
2016 1£m
Non-cancellable operating lease rentals are payable as follows:Within one year 281 240 Between one and five years 849 706 After five years 741 582
1,871 1,528
1 Non-cancellable operating lease rentals payable at 31 December 2016 were previously disclosed as £1,217m with changes made to correct the exchange rate applied to foreign currency leases and to include leases erroneously omitted, which have been identified during the IFRS 16 transition programme.
– Operating lease rental obligations at 31 December 2017 primarily relate to either aero engines (£1,143m) that are used to support customer’s aircraft fleets or to land and buildings (£630m) used for production, administration or training purposes.
– Both classes of asset contain some contracts where payments are linked to an index such as LIBOR. – Operating leases for aero engines typically contain no specific contractual right to renewal. Certain building operating leases have renewal options with an assessment of the appropriate lease term having being made at inception of each lease.
– Renewal dates for the most significant property leases fall between 2022 and 2025.
During the year £277m was recognised as an expense in the income statement in respect of operating leases (2016: £224m).
Leases as lessor2017
£m 2016£m
Rentals received – credited within revenue from aftermarket services 53 35 Non-cancellable operating lease rentals are receivable as follows:Within one year 14 11 Between one and five years 46 35 After five years 32 27
92 73
The Group acts as a lessor for both land and buildings and aero engines.
– Sublease payments of nil (2016: £1m) and sublease receipts of £36m (2016: £35m) were recognised in the income statement in the year. – The total future minimum sublease payments expected to be made are £1m (2016: £2m) and sublease receipts expected to be received are £51m (2016: £49m).
Finance leasesFinance lease liabilities are payable as follows:
2017 2016
Payments£m
Interest£m
Principal£m
Payments£m
Interest£m
Principal£m
Within one year 28 5 23 6 3 3 Between one and five years 94 18 76 29 11 18 After five years 42 4 38 54 8 46
164 27 137 89 22 67
Rolls-Royce Holdings plc Annual Report 2017 165Financial StatementsNotes to the Consolidated Financial Statements
FINA
NC
IAL STATEM
ENTS

23 Contingent liabilitiesContingent liabilities in respect of customer financing commitments are described in note 18.
In January 2017, after full cooperation, the Company concluded deferred prosecution agreements with the SFO and the US Department of Justice and a leniency agreement with the MPF, the Brazilian federal prosecutors. Prosecutions of individuals may follow and other investigations or enforcement action may be taken by other authorities. In addition, we could still be affected by actions from customers and customers’ financiers. The Directors are not currently aware of any matters that are likely to lead to a financial loss, but cannot anticipate all the possible actions that may be taken or their potential consequences.
Contingent liabilities exist in respect of guarantees provided by the Group in the ordinary course of business for product delivery, performance and reliability. The Group has, in the normal course of business, entered into arrangements in respect of export finance, performance bonds, countertrade obligations and minor miscellaneous items. Various Group undertakings are parties to legal actions and claims which arise in the ordinary course of business, some of which are for substantial amounts. As a consequence of the insolvency of an insurer as previously reported, the Group is no longer fully insured against known and potential claims from employees who worked for certain of the Group’s UK based businesses for a period prior to the acquisition of those businesses by the Group. While the outcome of some of these matters cannot precisely be foreseen, the Directors do not expect any of these arrangements, legal actions or claims, after allowing for provisions already made, to result in significant loss to the Group.
The Group’s share of equity accounted entities’ contingent liabilities is nil (2016: £12m).
24 Related party transactions2017
£m 2016£m
Sales of goods and services to joint ventures and associates 2,469 2,022 Purchases of goods and services from joint ventures and associates (2,224) (1,881)Operating lease payments to joint ventures and associates (127) (101)Guarantees of joint ventures’ and associates’ borrowings 5 5 Dividends received from joint ventures and associates 79 74 RRSA receipts from joint ventures and associates – 22 Other income received from joint ventures and associates 2 2
Included in sales of goods and services to joint ventures and associates are sales of spare engines amounting to £418m (2016: £356m). Profit recognised in the year on such sales amounted to £75m (2016: £119m), including profit on current year sales and recognition of profit deferred on sales in previous years. On an underlying basis (at actual achieved rates on settled derivative transactions), the amounts were £67m (2016: £97m).
The aggregated balances with joint ventures are shown in notes 13 and 16. Transactions with Group pension schemes are shown in note 19.
In the course of normal operations, related party transactions entered into by the Group have been contracted on an arms-length basis.
Key management personnel are deemed to be the Directors (pages 66 to 68) and the members of the ELT (described on page 69). Remuneration for key management personnel is shown below:
2017£m
2016£m
Salaries and short-term benefits 16 13Post-retirement schemes − – Share-based payments 7 1
23 14
More detailed information regarding the Directors’ remuneration, shareholdings, pension entitlements, share options and other long-term incentive plans is shown in the Directors’ Remuneration Report on pages 87 to 90. The charge for share-based payments above is based on when the award is charged to the income statement in accordance with IFRS 2 Share-Based Payments, rather than when the shares vest, which is the basis used in the Directors’ Remuneration Report.
166 Rolls-Royce Holdings plc Annual Report 2017Financial StatementsNotes to the Consolidated Financial Statements

25 Acquisitions
AcquisitionsOn 19 December 2017, the Group completed the acquisition of the 53.1% of the shares of Industria de Turbo Propulsores SA (ITP Aero) owned by SENER Grupo de Ingenieria SA (SENER) which it did not already own.
The consideration of €718m is payable in eight quarterly instalments, commencing on 15 January 2018. At the Group’s election, each instalment may be settled in either cash or Rolls-Royce Holdings plc shares. If the consideration is in shares, a 3% premium is applied. Interest is accrued on the outstanding balance based on LIBOR + 1.5%.
The fair value of the previous joint venture investment in ITP Aero of £204m was re-measured using a discounted cash flow methodology using judgement in estimating future cash flows, assessing the discount rate and establishing a non-controlling interest discount. This gave rise to a gain of £553m.
Given the proximity of the acquisition to the year end, and as permitted by IFRS 3 Business Combinations, the fair value of acquired identifiable assets and liabilities have been presented on a provisional basis. Fair values were determined on the basis of an initial assessment performed by an independent professional expert prior to the acquisition date. Measurement techniques and estimation of future cash flows have been used to assess the value of the intangible assets at the date of acquisition. The total fair value of acquired identifiable assets and liabilities is £1,650m of which a significant value was allocated to intangible assets. The valuation indicated a bargain purchase of £245m, which has been recognised in the income statement.
The acquisition of the controlling interest in ITP Aero on 19 December 2017 did not have a significant impact on the Group’s underlying results for the year.
Recognised amounts of identifiable assets acquired and liabilities assumed
£m
Intangible assets 1,417 Property, plant and equipment 268 Deferred tax assets 148 Inventory 316 Trade and other receivables 497 Taxation recoverable 2 Cash and cash equivalents 263 Trade and other payables (625)Borrowings (34)Other financial assets and liabilities (148)Deferred tax liability (386)Provisions (68)Total identifiable assets and liabilities 1,650 Total consideration (1,405) Bargain purchase gain arising 245
Consideration satisfied by:Deferred consideration to be paid in cash or shares 648 Existing shareholding 757
1,405 Net cash outflow arising on acquisition:Cash consideration – Less: cash and cash equivalents acquired (263)Cash inflow per cash flow statement (263)
Identifiable intangible assets comprise:Technology, patents and licences 245 Customer relationships 833 Trademark 44 In-process development 91 Other 204
1,417
Rolls-Royce Holdings plc Annual Report 2017 167Financial StatementsNotes to the Consolidated Financial Statements
FINA
NC
IAL STATEM
ENTS

26 Derivation of summary funds flow statement
2017 2016
£m £m £m £m Source
* Underlying profit before tax (PBT) – page 169 1,071 813Depreciation and impairment of property, plant and equipment 450 426 Cash flow statement (CFS)Amortisation of intangible assets 430 628 CFSImpairment of goodwill – (219) Reversal of adjustment in underlying PBT Impairment of property, plant and equipment (6) – Reversal of adjustment in underlying PBTAcquisition accounting (129) (115) Reversal of adjustment in underlying PBT * Depreciation and amortisation 745 720Increase in inventories (235) (161) CFS
Non-underlying impairment (6) –Reversal of underlying impairment (included in
£12m impairment of assets)Decrease in trade and other receivables/payables 946 288 CFSRealised losses on settled foreign exchange derivatives in financing (173) (162) Reported to underlying adjustment (note 2)Revaluation of trading assets (6) 67 Reversal of adjustment in underlying PBT * Movement on net working capital 526 32Additions of intangible assets (973) (631) CFSPurchases of property, plant and equipment (773) (585) CFSGovernment grants received 14 15 CFS* Expenditure on PP&E and intangible assets (1,732) (1,201)Realised losses on hedging instruments 475 426 Reversal of adjustment in underlying PBT Net unrealised fair value to changes to derivatives 24 – Reversal of adjustment in underlying PBT Foreign exchange on contract accounting (124) 77 Reversal of adjustment in underlying PBT Exceptional restructuring (104) (129) Reversal of adjustment in underlying PBT Other (3) (1) Reversal of adjustment in underlying PBT Underlying financing 104 102 Reversal of charge in underlying PBTLoss on disposal of property, plant and equipment 11 5 CFS
Joint ventures (52) (43)Joint ventures dividends less share of results –
CFSIncrease in provisions 58 44 CFSCash flows on other financial assets and liabilities included in underlying operating profit (488) (446) Reported to underlying adjustment (note 2)Share-based payments 34 35 CFSAdditions of unlisted investments (4) – CFSDisposal of intangible assets 7 8 CFSDisposal of property, plant and equipment 4 8 CFSInvestments in joint ventures and associates (48) (30) CFSNet interest (53) (72) Interest received and paid – CFSNet funds of JVs reclassified to joint operations – (4) Net cash and borrowings reclassified – CFSIssue of ordinary shares 21 1 CFSPurchase of ordinary shares for share schemes (24) (21) CFS* Other (162) (40)* Trading cash flow 448 324Net defined benefit plans – underlying operating charge 240 204 CFS
Cash funding of defined benefit plans (249) (271) CFS* Contributions to defined benefit schemesin excess of underlying PBT charge (9) (67)
* Tax (180) (157) CFS* Free cash flow 259 100* Shareholder payments (214) (301) Redemption of C Shares – CFS* Payments of penalties to investigating authorities (286) –* Acquisition of ITP Aero 229 –* Other acquisitions and disposals (17) (153) CFSOther 8 –* Foreign exchange (59) 240 CFS* Change in net funds (80) (114)
This table shows the derivation of the summary funds flow statement (lines marked *) on page 51 from the cash flow statement on page 119.
168 Rolls-Royce Holdings plc Annual Report 2017Financial StatementsNotes to the Consolidated Financial Statements

26 Derivation of summary funds flow statement continuedFree cash flow is a measure of financial performance of the business’s cash flow to see what is available for distribution among those stakeholders funding the business (including debt holders and shareholders). Free cash flow is calculated as trading cash flow less recurring tax and post-employment benefit expenses excluding capital expenditures, payments made to shareholders, amounts spent (or received) on business acquisitions and foreign exchange changes on net funds. The Board considers that free cash flow reflects cash generated from the Group’s underlying trading.
2017 2016
£m £m £m £m Source
Reported operating profit 1,287 44 Realised losses on hedging instruments (475) (426) Reported to underlying adjustment (note 2)Net unrealised fair value to changes to derivatives (24) – Reported to underlying adjustment (note 2)Foreign exchange on contract accounting 124 (77) Reported to underlying adjustment (note 2)Revaluation of trading assets and liabilities 6 (67) Reported to underlying adjustment (note 2)Effect of acquisition accounting 129 115 Reported to underlying adjustment (note 2)UK pension restructuring – 306 Reported to underlying adjustment (note 2)Impairments 24 219 Reported to underlying adjustment (note 2)Exceptional restructuring 104 129 Reported to underlying adjustment (note 2)Accrual for deferred prosecution agreement penalties – 671 Reported to underlying adjustment (note 2)Other – 1 Reported to underlying adjustment (note 2)Adjustments to reported operating profit (112) 871Underlying profit before financing 1,175 915 Underlying financing (104) (102) Underlying income statement (note 2)Underlying profit before tax 1,071 813
The table below shows a reconciliation of free cash flow to the change in cash and cash equivalents presented in the Consolidated Cash Flow Statement.
2017 2016
£m £m £m £m
Change in cash and cash equivalents 231 (691)Returns to shareholders 214 301Net cash flow from changes in borrowings and finance leases (200) 345 Increase/decrease in short-term investments – 1 Acquisition of business (263) 6 Consolidation of previously unconsolidated subsidiary (1) –Increase in share in joint ventures – 154 Debt of joint ventures reclassified as joint operations – (9)Disposal of other businesses – (7)Changes in group structure (264) 144Payment of deferred prosecution agreement penalties 286 −Other (8) − Free cash flow 259 100 Exclude cash outflow of ITP Aero 14 –Free cash flow excluding ITP Aero 273 100
Rolls-Royce Holdings plc Annual Report 2017 169Financial StatementsNotes to the Consolidated Financial Statements
FINA
NC
IAL STATEM
ENTS

27 Impact of IFRS 15The segmental analysis shown in note 2 would have been as follows if prepared under the IFRS 15 policies set out in note 1:
CivilAerospace
£m
DefenceAerospace
£m
Power Systems
£mMarine
£mNuclear
£m
Inter-segment
£m
Total reportable segments
£m
Year ended 31 December 2017Underlying revenue from sale of original equipment 2,862 911 1,825 539 377 (27) 6,487 Underlying revenue from aftermarket services 3,671 1,287 896 476 430 (37) 6,723 Total underlying revenue at 2016 exchange rates 6,533 2,198 2,721 1,015 807 (64) 13,210 Translation to 2017 exchange rates 80 84 198 60 11 (5) 428 Total underlying revenue at 2017 exchange rates 6,613 2,282 2,919 1,075 818 (69) 13,638 Gross profit 350 551 786 213 131 – 2,031 Commercial and administrative costs (370) (126) (310) (193) (71) – (1,070)Research and development costs (442) (77) (165) (44) (23) – (751)Share of results of joint ventures and associates 109 7 (3) – – – 113 Underlying operating profit/(loss) at 2016 exchange rates (353) 355 308 (24) 37 – 323 Translation to 2017 exchange rates 23 15 23 (2) 1 – 60 Underlying operating profit/(loss) at 2017 exchange rates (330) 370 331 (26) 38 – 383 2017 accounting policies
Total underlying revenue 8,023 2,275 2,923 1,077 818 (70) 15,046Underlying operating profit 520 374 330 (25) 38 – 1,237
Reconciliation to reported results
Totalreportable segments
£m
Other businesses
and corporate£m
Totalunderlying
£m
Underlying adjustmentsand foreign
exchange£m
Group at actualexchange
rates£m
Group at actualexchange
rates - 2017accounting
policies£m
Year ended 31 December 2017Revenue from sale of original equipment 6,487 22 6,509 771 7,280 8,090 Revenue from aftermarket services 6,723 20 6,743 775 7,518 8,217 Total revenue at 2016 exchange rates 13,210 42 13,252 1,546 14,798 16,307 Translation to 2017 exchange rates 428 2 430 (430) – – Total revenue at 2017 exchange rates 13,638 44 13,682 1,116 14,798 16,307 Gross profit 2,031 4 2,035 244 2,279 3,173 Commercial and administrative costs (1,070) (54) (1,124) (98) (1,222) (1,222)Research and development costs (751) – (751) (83) (834) (795)Share of results of joint ventures and associates 113 (10) 103 29 132 131 Operating profit/(loss) at 2016 exchange rates 323 (60) 263 92 355 1,287 Translation to 2017 exchange rates 60 (2) 58 (58) – – Operating profit/(loss) at 2017 exchange rates 383 (62) 321 34 355 1,287Gains arising on the acquisition of ITP Aero – – – 798 798 798Profit/(loss) before financing and taxation 383 (62) 321 832 1,153 2,085 Net financing (112) (112) 2,966 2,854 2,812 Profit/(loss) before taxation (174) 209 3,798 4,007 4,897Taxation (166) (166) (381) (547) (689)Profit for the year 43 3,417 3,460 4,208
170 Rolls-Royce Holdings plc Annual Report 2017Financial StatementsNotes to the Consolidated Financial Statements

27 Impact of IFRS 15 continued
Underlying adjustments2017
Revenue£m
Profit beforefinancing
£m
Net financing
£mTaxation
£m
Underlying performance 13,682 321 (112) (166)Revenue recognised at exchange rate on date of transaction 1,116 – – – Realised (gains)/losses on settled derivative contracts – 453 195 (111)Net unrealised fair value changes to derivative contracts – 24 2,648 (463)Effect of currency on contract accounting – (180) – 21 Revaluation of trading assets and liabilities – (6) 113 (12)Financial RRSAs – foreign exchange differences and changes in forecast payments – – 11 (3)Effect of acquisition accounting – (129) – 35 Impairment of assets – (12) – – Net post-retirement scheme financing – – 1 (1)Exceptional restructuring – (104) – 31 Gains arising on the acquisition of ITP Aero – 798 – – Consolidation of previously non-consolidated subsidiary – (12) – – Other – – (2) 9 Recognition of advance corporation tax – – – 163 Reduction in corporate tax rates – – – (50)
Total underlying adjustments 1,116 832 2,966 (381)Reported per consolidated income statement 14,798 1,153 2,854 (547)
As processes and procedures are further embedded during 2018, it is possible that some changes to the information above may result.
Rolls-Royce Holdings plc Annual Report 2017 171Financial StatementsNotes to the Consolidated Financial Statements
FINA
NC
IAL STATEM
ENTS

Notes2017
£m2016£m
AssetsNon-current assetsInvestments – subsidiary undertakings 2 12,076 12,046
Current assetsTrade and other receivables 371 – Cash and cash equivalents 2 –
373 –
TOTAL ASSETS 12,449 12,046
LiabilitiesCurrent liabilitiesOther financial liabilities 3 (28) (28)Trade and other payables (1,794) (1,204)TOTAL LIABILITIES (1,822) (1,232)
NET ASSETS 10,627 10,814
EquityCalled-up share capital 4 368 367 Share premium account 195 181 Merger reserve 6,843 7,058 Capital redemption reserve 2,216 2,001 Other reserve 186 156 Retained earnings 819 1,051 TOTAL EQUITY 10,627 10,814
The Financial Statements on pages 172 to 174 were approved by the Board on 6 March 2018 and signed on its behalf by:
Warren East Stephen DaintithChief Executive Chief Financial Officer
Company’s registered number: 7524813
Company Balance SheetAt 31 December 2017
Attributable to ordinary shareholders
Sharecapital
£m
Sharepremium
£m
Mergerreserve
£m
Capitalredemption
reserve£m
Otherreserve 1
£m
Retained earnings
£m
Totalequity
£m
At 1 January 2017 367 181 7,058 2,001 156 1,051 10,814 Profit for the year – – – – – – – Shares issued to share trust 1 14 – – – – 15 Issue of C Shares – – (215) – – – (215)Redemption of C Shares – – – 215 – (215) – Share-based payments – direct to equity – – – – 30 (17) 13
At 31 December 2017 368 195 6,843 2,216 186 819 10,627
1 The ‘Other reserve’ represents the value of share-based payments in respect of employees of subsidiary undertakings for which payment has not been received.
Company Statement of Changes in EquityFor the year ended 31 December 2017
172 Rolls-Royce Holdings plc Annual Report 2017Financial statementsCompany Balance SheetCompany Statement of Changes in Equity
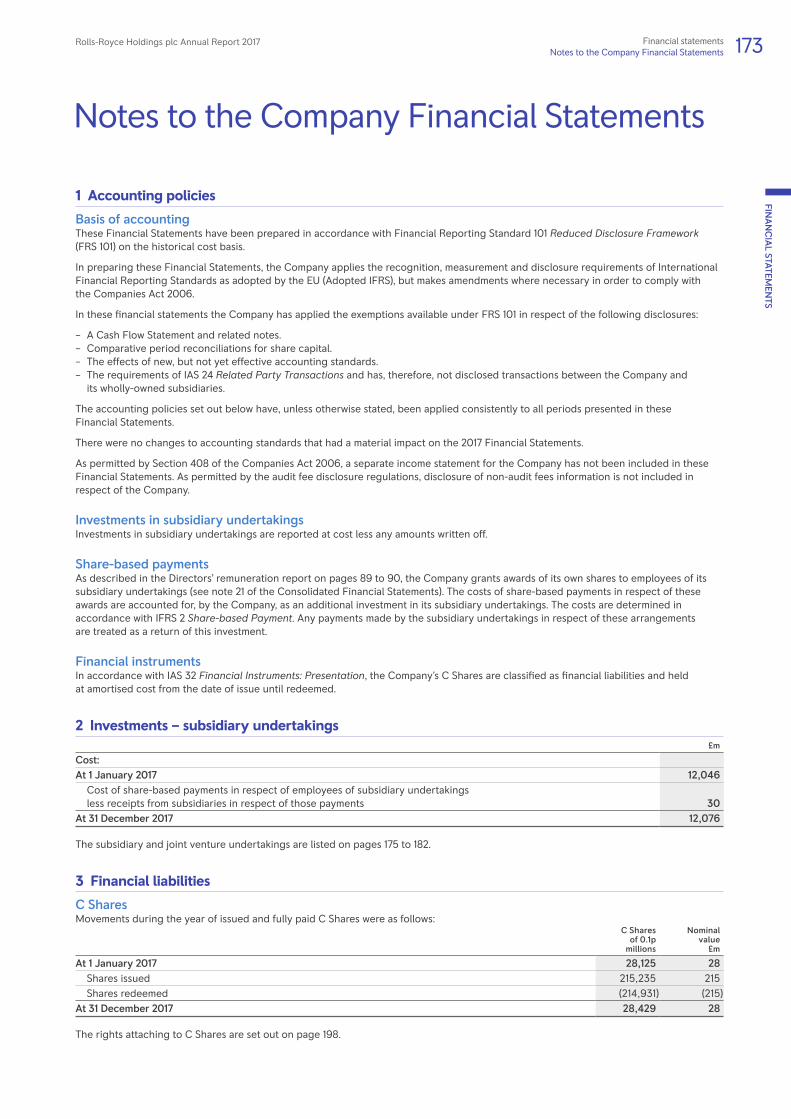
1 Accounting policies
Basis of accountingThese Financial Statements have been prepared in accordance with Financial Reporting Standard 101 Reduced Disclosure Framework (FRS 101) on the historical cost basis.
In preparing these Financial Statements, the Company applies the recognition, measurement and disclosure requirements of International Financial Reporting Standards as adopted by the EU (Adopted IFRS), but makes amendments where necessary in order to comply with the Companies Act 2006.
In these financial statements the Company has applied the exemptions available under FRS 101 in respect of the following disclosures:
– A Cash Flow Statement and related notes. – Comparative period reconciliations for share capital. – The effects of new, but not yet effective accounting standards. – The requirements of IAS 24 Related Party Transactions and has, therefore, not disclosed transactions between the Company and its wholly-owned subsidiaries.
The accounting policies set out below have, unless otherwise stated, been applied consistently to all periods presented in these Financial Statements.
There were no changes to accounting standards that had a material impact on the 2017 Financial Statements.
As permitted by Section 408 of the Companies Act 2006, a separate income statement for the Company has not been included in these Financial Statements. As permitted by the audit fee disclosure regulations, disclosure of non-audit fees information is not included in respect of the Company.
Investments in subsidiary undertakingsInvestments in subsidiary undertakings are reported at cost less any amounts written off.
Share-based paymentsAs described in the Directors’ remuneration report on pages 89 to 90, the Company grants awards of its own shares to employees of its subsidiary undertakings (see note 21 of the Consolidated Financial Statements). The costs of share-based payments in respect of these awards are accounted for, by the Company, as an additional investment in its subsidiary undertakings. The costs are determined in accordance with IFRS 2 Share-based Payment. Any payments made by the subsidiary undertakings in respect of these arrangements are treated as a return of this investment.
Financial instrumentsIn accordance with IAS 32 Financial Instruments: Presentation, the Company’s C Shares are classified as financial liabilities and held at amortised cost from the date of issue until redeemed.
2 Investments – subsidiary undertakings£m
Cost:At 1 January 2017 12,046Cost of share-based payments in respect of employees of subsidiary undertakings less receipts from subsidiaries in respect of those payments 30
At 31 December 2017 12,076
The subsidiary and joint venture undertakings are listed on pages 175 to 182.
3 Financial liabilities
C SharesMovements during the year of issued and fully paid C Shares were as follows:
C Sharesof 0.1p
millions
Nominalvalue
£m
At 1 January 2017 28,125 28 Shares issued 215,235 215 Shares redeemed (214,931) (215)
At 31 December 2017 28,429 28
The rights attaching to C Shares are set out on page 198.
Notes to the Company Financial Statements
Rolls-Royce Holdings plc Annual Report 2017 173Financial statementsNotes to the Company Financial Statements
FINA
NC
IAL STATEM
ENTS

4 Share capitalNon-equity Equity
SpecialShare
of £1
Preference shares of
£1 each
Nominalvalue
£m
Ordinaryshares of20p each
Millions
Nominalvalue
£m
Issued and fully paidAt 1 January 2017 1 – – 1,838 367 Shares issued to share trust – – – 2 1 At 31 December 2017 1 – – 1,840 368
The rights attaching to each class of share are set out on page 198.
In accordance with IAS 32, the Company’s non-cumulative redeemable preference shares (C Shares) are classified as financial liabilities. Accordingly, movements in C Shares are included in note 3.
5 Contingent liabilitiesWhere the Company enters into financial guarantee contracts to guarantee the indebtedness of other companies within its group, the Company considers these to be insurance arrangements, and accounts for them as such. In this respect, the Company treats the guarantee contract as a contingent liability until such time as it becomes probable that the Company will be required to make a payment under the guarantee.
At 31 December 2017, these guarantees amounted to £2,930m (2016: £2,735m).
6 Other information
Emoluments of directorsThe remuneration of the Directors of the Company is shown in the Directors’ remuneration report on pages 87 to 90.
EmployeesThe Company had no employees in 2017.
Share-based paymentsShares in the Company have been granted to employees of the Group as part of share-based payment plans, and are charged in the employing company.
174 Rolls-Royce Holdings plc Annual Report 2017Financial statementsNotes to the Company Financial Statements
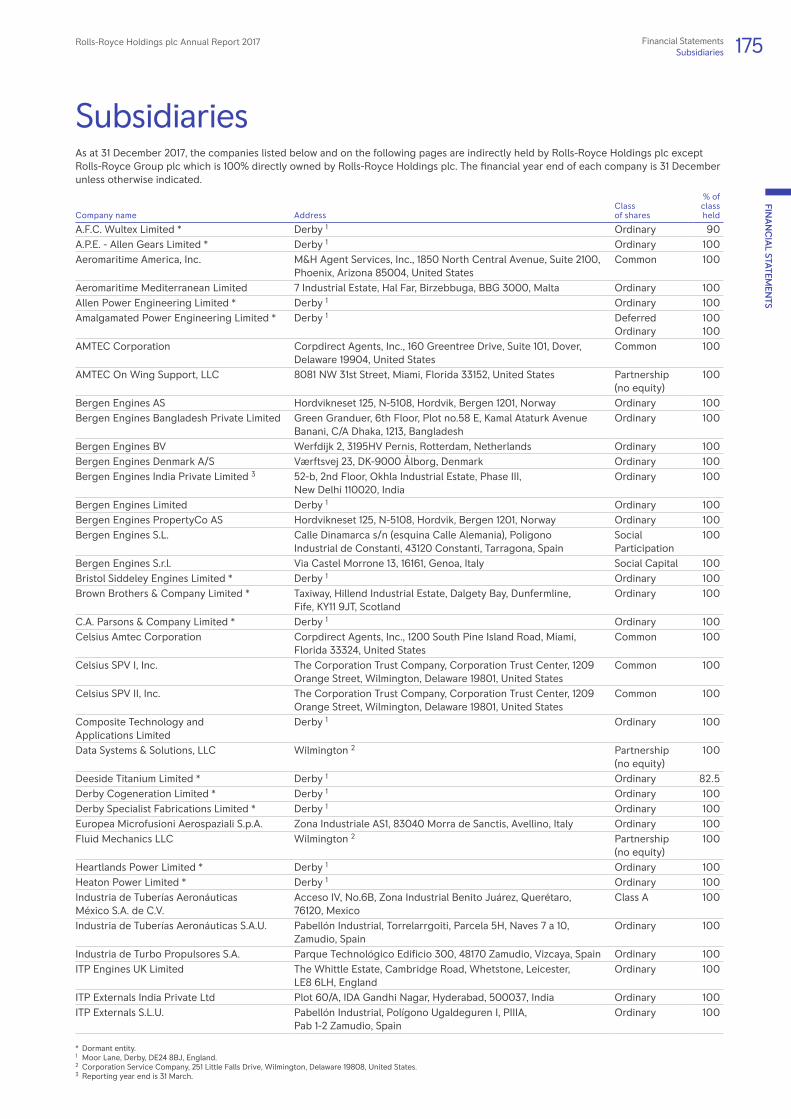
Subsidiaries
* Dormant entity.1 Moor Lane, Derby, DE24 8BJ, England.2 Corporation Service Company, 251 Little Falls Drive, Wilmington, Delaware 19808, United States.3 Reporting year end is 31 March.
Company name AddressClass of shares
% ofclass held
A.F.C. Wultex Limited * Derby 1 Ordinary 90A.P.E. - Allen Gears Limited * Derby 1 Ordinary 100Aeromaritime America, Inc. M&H Agent Services, Inc., 1850 North Central Avenue, Suite 2100,
Phoenix, Arizona 85004, United StatesCommon 100
Aeromaritime Mediterranean Limited 7 Industrial Estate, Hal Far, Birzebbuga, BBG 3000, Malta Ordinary 100Allen Power Engineering Limited * Derby 1 Ordinary 100Amalgamated Power Engineering Limited * Derby 1 Deferred
Ordinary100100
AMTEC Corporation Corpdirect Agents, Inc., 160 Greentree Drive, Suite 101, Dover, Delaware 19904, United States
Common 100
AMTEC On Wing Support, LLC 8081 NW 31st Street, Miami, Florida 33152, United States Partnership (no equity)
100
Bergen Engines AS Hordvikneset 125, N-5108, Hordvik, Bergen 1201, Norway Ordinary 100Bergen Engines Bangladesh Private Limited Green Granduer, 6th Floor, Plot no.58 E, Kamal Ataturk Avenue
Banani, C/A Dhaka, 1213, BangladeshOrdinary 100
Bergen Engines BV Werfdijk 2, 3195HV Pernis, Rotterdam, Netherlands Ordinary 100Bergen Engines Denmark A/S Værftsvej 23, DK-9000 Ålborg, Denmark Ordinary 100Bergen Engines India Private Limited 3 52-b, 2nd Floor, Okhla Industrial Estate, Phase III,
New Delhi 110020, IndiaOrdinary 100
Bergen Engines Limited Derby 1 Ordinary 100Bergen Engines PropertyCo AS Hordvikneset 125, N-5108, Hordvik, Bergen 1201, Norway Ordinary 100Bergen Engines S.L. Calle Dinamarca s/n (esquina Calle Alemania), Poligono
Industrial de Constanti, 43120 Constanti, Tarragona, SpainSocial Participation
100
Bergen Engines S.r.l. Via Castel Morrone 13, 16161, Genoa, Italy Social Capital 100Bristol Siddeley Engines Limited * Derby 1 Ordinary 100Brown Brothers & Company Limited * Taxiway, Hillend Industrial Estate, Dalgety Bay, Dunfermline,
Fife, KY11 9JT, ScotlandOrdinary 100
C.A. Parsons & Company Limited * Derby 1 Ordinary 100Celsius Amtec Corporation Corpdirect Agents, Inc., 1200 South Pine Island Road, Miami,
Florida 33324, United StatesCommon 100
Celsius SPV I, Inc. The Corporation Trust Company, Corporation Trust Center, 1209 Orange Street, Wilmington, Delaware 19801, United States
Common 100
Celsius SPV II, Inc. The Corporation Trust Company, Corporation Trust Center, 1209 Orange Street, Wilmington, Delaware 19801, United States
Common 100
Composite Technology and Applications Limited
Derby 1 Ordinary 100
Data Systems & Solutions, LLC Wilmington 2 Partnership (no equity)
100
Deeside Titanium Limited * Derby 1 Ordinary 82.5Derby Cogeneration Limited * Derby 1 Ordinary 100Derby Specialist Fabrications Limited * Derby 1 Ordinary 100Europea Microfusioni Aerospaziali S.p.A. Zona Industriale AS1, 83040 Morra de Sanctis, Avellino, Italy Ordinary 100Fluid Mechanics LLC Wilmington 2 Partnership
(no equity)100
Heartlands Power Limited * Derby 1 Ordinary 100Heaton Power Limited * Derby 1 Ordinary 100Industria de Tuberías Aeronáuticas México S.A. de C.V.
Acceso IV, No.6B, Zona Industrial Benito Juárez, Querétaro, 76120, Mexico
Class A 100
Industria de Tuberías Aeronáuticas S.A.U. Pabellón Industrial, Torrelarrgoiti, Parcela 5H, Naves 7 a 10, Zamudio, Spain
Ordinary 100
Industria de Turbo Propulsores S.A. Parque Technológico Edificio 300, 48170 Zamudio, Vizcaya, Spain Ordinary 100ITP Engines UK Limited The Whittle Estate, Cambridge Road, Whetstone, Leicester,
LE8 6LH, EnglandOrdinary 100
ITP Externals India Private Ltd Plot 60/A, IDA Gandhi Nagar, Hyderabad, 500037, India Ordinary 100ITP Externals S.L.U. Pabellón Industrial, Polígono Ugaldeguren I, PIIIA,
Pab 1-2 Zamudio, SpainOrdinary 100
As at 31 December 2017, the companies listed below and on the following pages are indirectly held by Rolls-Royce Holdings plc except Rolls-Royce Group plc which is 100% directly owned by Rolls-Royce Holdings plc. The financial year end of each company is 31 December unless otherwise indicated.
Rolls-Royce Holdings plc Annual Report 2017 175Financial StatementsSubsidiaries
FINA
NC
IAL STATEM
ENTS

Company name AddressClass of shares
% ofclass held
ITP Ingeniería y Fabricación S.A. de C.V. Acceso IV, No.6D, Zona Industrial Benito Juárez, Querétaro, 76120, Mexico
Class AClass B
100100
ITP México S.A. de C.V. Acceso IV, No.6, Zona Industrial Benito Juárez, Querétaro, 76120, Mexico
Class AClass B
100100
ITP México Fabricación S.A. de C.V. Acceso IV, No.6, Zona Industrial Benito Juárez, Querétaro, 76120, Mexico
Class A 100
ITP Next Generation Turbines S.L.U. Parque Technológico Edificio 300, 48170 Zamudio, Vizcaya, Spain Ordinary 100John Thompson Cochran Limited * Taxiway, Hillend Industrial Estate, Dalgety Bay, Dunfermline, Fife,
KY11 9JT, Scotland6% Cumulative PreferenceOrdinary
100
100John Thompson Limited * Derby 1 Ordinary 100Kamewa AB * Box 1010, S-68129, Kristinehamn, Sweden Ordinary 100Kamewa do Brazil Equipmentos Maritimos Limitada
401 Rua Visconde de Pitaja 433, Rio de Janeiro, Brazil Quotas 100
Kamewa Holding AB * Box 1010, S-68129, Kristinehamn, Sweden Ordinary 100Karl Maybach-Hilfe GmbH Maybachplatz 1, 88045, Friedrichshafen, Germany Capital Stock 100L'Orange Fuel Injection (Ningbo) Co, Limited #3 Hall, No.55 South Qihang Road, Yinzhou Economic
Development Zone, Ningbo City, 315145, ChinaCapital Stock 100
L'Orange Fuel Injection Trading (Suzhou) Co. Limited
Suite 306, 23-B Times Square, Huachi Street, SIP Suzhou 215021, China
Capital Stock 100
L'Orange GmbH Porschestrasse 8, 70435, Stuttgart, Germany Capital Stock 100L'Orange Unterstützungskasse GmbH Rudolph-L'Orange-Strasse 1, 72293 Glatten, Germany Capital Stock 100MTU Africa (Proprietary) Limited Corner Marconi Road and 3rd Street, Montague Gardens,
Western Cape, 7441, South AfricaCapital Stock 100
MTU America Inc. Wilmington 2 Ordinary 100MTU Asia PTE Limited 10 Tukang Innovation Drive, Singapore 618302 Ordinary 100MTU Benelux B.V. Merwedestraat 86, 3313 CS, Dordrecht, Netherlands Ordinary 100MTU China Company Limited Room 1801-1803 18/F Ascendas Plaza, No.333 Tian Qiao Road, Xuhai
Distrcit, Shanghai, 200030, ChinaOrdinary 100
MTU do Brasil Limitada Via Anhanguera, KM 29203, 05276-000 Sao Paulo - SP, Brazil Ordinary 100MTU Engineering (Suzhou) Company Limited 9 Long Yun Road, Suzhou Industrial Park, Suzhou 215024,
Jiang Su, ChinaOrdinary 100
MTU France S.A.S. 8/10 rue Rosa Luxembourg-Parc des Bellevues, Immeuble Colorado 95610 Erangy-sur-Oise, France
Ordinary 100
MTU Friedrichshafen GmbH Maybachplatz 1, 88045, Friedrichshafen, Germany Capital Stock 100MTU Hong Kong Limited Room 1006, 10/F, Hang Seng Tsimshatsui Building, 18 Carnarvon
Road, Tsimshatsui, Kowloon, Hong KongOrdinary 100
MTU Ibérica Propulsión y Energia S.L. Calle Copérnico 26-28, 28823 Coslada, Madrid, Spain Ordinary 100MTU India Private Limited 3 HM Geneva House, Unit No.303, 3rd Floor, No.14
Cunningham Road, Bangalore, KA 560052, IndiaOrdinary 100
MTU Israel Limited 4 Ha’Alon Street, South Building, Third Floor, 4059300 Kfar Neter, Israel
Ordinary 100
MTU Italia S.r.l. Via Aurelia Nord, 328, 19021 Arcola (SP), Italy Capital Stock 100MTU Japan Co. Limited Resorttrust Building 4-14-3, Nishitenma Kita-ku, Osaka, Japan Ordinary 100MTU Korea Limited 23rd Floor, Olive Tower, 41 Sejongdaero 9 gil, Junggu,
100-737 Seoul, Republic of KoreaOrdinary 100
MTU Middle East FZE S3B5SR06, Jebel Ali Free Zone, P.O. Box 61141, Dubai, United Arab Emirates
Ordinary 100
MTU Motor Türbin Sanayi ve Ticaret. A.Ş. Hatira Sokak, No. 5, Ömerli Mahellesi, 34555 Arnavutköy, Istanbul, Turkey
Ordinary 100
MTU Onsite Energy GmbH Dasinger Strasse 11, 86165, Augsburg, Germany Capital Stock 100MTU Onsite Energy Systems GmbH Rotthofer Strasse 8, 94099 Ruhstorf a.d. Rott, Germany Capital Stock 100MTU Polska Sp. z o.o. Ul. Śląska, Nr 9. Raum, Ort: Stargard Szczeciński, Plz: 73-110, Poland Ordinary 100MTU Reman Technologies GmbH Friedrich-List-Strasse 8, 39122 Magdeburg, Germany Capital Stock 100MTU Rus Limited Liability Company Shabolovka Street 2, 119049, Moscow, Russian Federation Ordinary 100
* Dormant entity.1 Moor Lane, Derby, DE24 8BJ, England.2 Corporation Service Company, 251 Little Falls Drive, Wilmington, Delaware 19808, United States.3 Reporting year end is 31 March.
176 Rolls-Royce Holdings plc Annual Report 2017Financial StatementsSubsidiaries
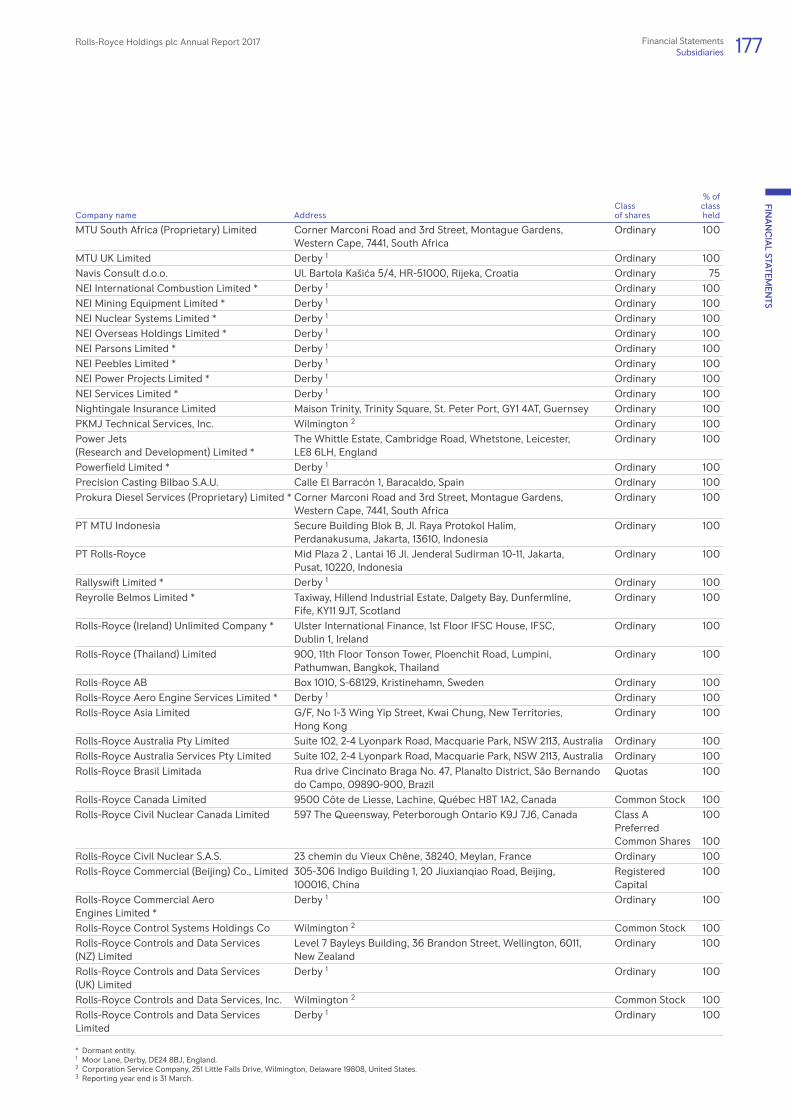
* Dormant entity.1 Moor Lane, Derby, DE24 8BJ, England.2 Corporation Service Company, 251 Little Falls Drive, Wilmington, Delaware 19808, United States.3 Reporting year end is 31 March.
Company name AddressClass of shares
% ofclass held
MTU South Africa (Proprietary) Limited Corner Marconi Road and 3rd Street, Montague Gardens, Western Cape, 7441, South Africa
Ordinary 100
MTU UK Limited Derby 1 Ordinary 100Navis Consult d.o.o. Ul. Bartola Kašića 5/4, HR-51000, Rijeka, Croatia Ordinary 75NEI International Combustion Limited * Derby 1 Ordinary 100NEI Mining Equipment Limited * Derby 1 Ordinary 100NEI Nuclear Systems Limited * Derby 1 Ordinary 100NEI Overseas Holdings Limited * Derby 1 Ordinary 100NEI Parsons Limited * Derby 1 Ordinary 100NEI Peebles Limited * Derby 1 Ordinary 100NEI Power Projects Limited * Derby 1 Ordinary 100NEI Services Limited * Derby 1 Ordinary 100Nightingale Insurance Limited Maison Trinity, Trinity Square, St. Peter Port, GY1 4AT, Guernsey Ordinary 100PKMJ Technical Services, Inc. Wilmington 2 Ordinary 100Power Jets (Research and Development) Limited *
The Whittle Estate, Cambridge Road, Whetstone, Leicester, LE8 6LH, England
Ordinary 100
Powerfield Limited * Derby 1 Ordinary 100Precision Casting Bilbao S.A.U. Calle El Barracón 1, Baracaldo, Spain Ordinary 100Prokura Diesel Services (Proprietary) Limited * Corner Marconi Road and 3rd Street, Montague Gardens,
Western Cape, 7441, South AfricaOrdinary 100
PT MTU Indonesia Secure Building Blok B, Jl. Raya Protokol Halim, Perdanakusuma, Jakarta, 13610, Indonesia
Ordinary 100
PT Rolls-Royce Mid Plaza 2 , Lantai 16 Jl. Jenderal Sudirman 10-11, Jakarta, Pusat, 10220, Indonesia
Ordinary 100
Rallyswift Limited * Derby 1 Ordinary 100Reyrolle Belmos Limited * Taxiway, Hillend Industrial Estate, Dalgety Bay, Dunfermline,
Fife, KY11 9JT, ScotlandOrdinary 100
Rolls-Royce (Ireland) Unlimited Company * Ulster International Finance, 1st Floor IFSC House, IFSC, Dublin 1, Ireland
Ordinary 100
Rolls-Royce (Thailand) Limited 900, 11th Floor Tonson Tower, Ploenchit Road, Lumpini, Pathumwan, Bangkok, Thailand
Ordinary 100
Rolls-Royce AB Box 1010, S-68129, Kristinehamn, Sweden Ordinary 100Rolls-Royce Aero Engine Services Limited * Derby 1 Ordinary 100Rolls-Royce Asia Limited G/F, No 1-3 Wing Yip Street, Kwai Chung, New Territories,
Hong KongOrdinary 100
Rolls-Royce Australia Pty Limited Suite 102, 2-4 Lyonpark Road, Macquarie Park, NSW 2113, Australia Ordinary 100Rolls-Royce Australia Services Pty Limited Suite 102, 2-4 Lyonpark Road, Macquarie Park, NSW 2113, Australia Ordinary 100Rolls-Royce Brasil Limitada Rua drive Cincinato Braga No. 47, Planalto District, São Bernando
do Campo, 09890-900, BrazilQuotas 100
Rolls-Royce Canada Limited 9500 Côte de Liesse, Lachine, Québec H8T 1A2, Canada Common Stock 100Rolls-Royce Civil Nuclear Canada Limited 597 The Queensway, Peterborough Ontario K9J 7J6, Canada Class A
PreferredCommon Shares
100
100Rolls-Royce Civil Nuclear S.A.S. 23 chemin du Vieux Chêne, 38240, Meylan, France Ordinary 100Rolls-Royce Commercial (Beijing) Co., Limited 305-306 Indigo Building 1, 20 Jiuxianqiao Road, Beijing,
100016, ChinaRegistered Capital
100
Rolls-Royce Commercial Aero Engines Limited *
Derby 1 Ordinary 100
Rolls-Royce Control Systems Holdings Co Wilmington 2 Common Stock 100Rolls-Royce Controls and Data Services (NZ) Limited
Level 7 Bayleys Building, 36 Brandon Street, Wellington, 6011, New Zealand
Ordinary 100
Rolls-Royce Controls and Data Services (UK) Limited
Derby 1 Ordinary 100
Rolls-Royce Controls and Data Services, Inc. Wilmington 2 Common Stock 100Rolls-Royce Controls and Data Services Limited
Derby 1 Ordinary 100
Rolls-Royce Holdings plc Annual Report 2017 177Financial StatementsSubsidiaries
FINA
NC
IAL STATEM
ENTS

Company name AddressClass of shares
% ofclass held
Rolls-Royce Corporation Wilmington 2 Common Stock 100Rolls-Royce Côte d'Ivoire Sarl 7 Boulevard Latrille, Abidjan-Cocody, 25 BP 945, Abidjan 25,
Côte d'IvoireOrdinary 100
Rolls-Royce Crosspointe LLC Wilmington 2 Partnership (no equity)
100
Rolls-Royce de Venezuela S.A. * Avenida 3E, entre Calles 78 y 79, Torre Empresarial Claret, Piso 10, Oficina 10-3, Sector Valle Frio Maracaibo, Estado Zulia, Venezuela
Registered Shares
100
Rolls-Royce Defense Products and Solutions, Inc.
Wilmington 2 Common Stock 100
Rolls-Royce Defense Services, Inc. Wilmington 2 Common Stock 100Rolls-Royce Deutschland Ltd & Co KG Eschenweg 11, 15827 Blankenfelde-Mahlow, Germany Ordinary 100Rolls-Royce Energy Angola, Limitada * Rua Rei Katyavala, Edificio Rei Katyavala, Entrada B, Piso 8,
Luanda, AngolaQuota 100
Rolls-Royce Energy Systems Inc. Wilmington 2 Common Stock 100Rolls-Royce Engine Controls Holdings Limited Derby 1 Ordinary 100Rolls-Royce Engine Services Holdings Co. Wilmington 2 Common Stock 100Rolls-Royce Engine Services Limitada Inc. * Bldg. 06 Berthaphil Compound, Jose Abad Santos Avenue,
Clark Special Economic Zone, Clark, Pampanga, PhilippinesCapital Stock 100
Rolls-Royce Erste Beteiligungs GmbH Eschenweg 11, 15827 Blankenfelde-Mahlow, Germany Capital Stock 100Rolls-Royce Finance Company Limited Derby 1 Deferred
Ordinary100100
Rolls-Royce Finance Holdings Co. Wilmington 2 Common Stock 100Rolls-Royce Fuel Cell Systems Limited Derby 1 Ordinary 100Rolls-Royce General Partner Limited Derby 1 Ordinary 100Rolls-Royce Group plc 62 Buckingham Gate, London, SW1E 6AT, England Ordinary 100Rolls-Royce High Temperature Composites, Inc.
Corporation Service Company, 2710 Gateway Oaks Drive, Suite 150N, Sacramento, California 95833, United States
Ordinary 100
Rolls-Royce Holdings Canada Inc. 9500 Côte de Liesse, Lachine, Québec H8T 1A2, Canada Common C 100Rolls-Royce India Limited *3 Derby 1 Ordinary 100Rolls-Royce India Private Limited 3 Birla Tower West, 2nd Floor 25, Barakhamba Road, New Delhi,
110001, IndiaEquity 100
Rolls-Royce Industrial & Marine Power Limited *
Derby 1 Ordinary 100
Rolls-Royce Industrial Power (India) Limited *3 Derby 1 Ordinary 100Rolls-Royce Industrial Power (Overseas Projects) Limited *
Derby 1 Ordinary 100
Rolls-Royce Industrial Power Engineering (Overseas Projects) Limited
Derby 1 Ordinary 100
Rolls-Royce Industrial Power Investments Limited *
Derby 1 2.8% cumulative redeemable preference4.9% cumulative preferenceOrdinary
100
100
100Rolls-Royce Industries Limited * Derby 1 Ordinary 100Rolls-Royce International Limited Derby 1 Ordinary 100Rolls-Royce International LLC Office 41 N, Lit 32-34 Nevsky Prospect, St. Petersburg,
191186, RussiaOrdinary 100
Rolls-Royce International s.r.o. Pobřežní 620/3, Postal code 186 00, Karlin - Prague 8, Czech Republic
Ordinary 100
Rolls-Royce Italia S.r.l. Via Castel Morrone 13, 16161, Genoa, Italy Ordinary 100Rolls-Royce Japan Co., Limited 31st Floor, Kasumigaseki Building, 3-2-5 Kasumigaseki,
Chiyoda-Ku, Tokyo, 100-6031, JapanOrdinary 100
Rolls-Royce JSF Holdings Inc. Wilmington 2 Common Stock 100Rolls-Royce Korea Limited 197 Noksan SanEop Buk-Ro (Songjeong-dong), Gangseo-gu,
Busan 46753, Republic of KoreaOrdinary 100
* Dormant entity.1 Moor Lane, Derby, DE24 8BJ, England.2 Corporation Service Company, 251 Little Falls Drive, Wilmington, Delaware 19808, United States.3 Reporting year end is 31 March.
178 Rolls-Royce Holdings plc Annual Report 2017Financial StatementsSubsidiaries

Company name AddressClass of shares
% ofclass held
Rolls-Royce Leasing Limited Derby 1 Ordinary 100Rolls-Royce Malaysia Sdn. Bhd. Suite 13.03, 13th Floor, Menara Tan & Tan, 207 Jalan Tun Razak,
50400 Kuala Lumpur, MalaysiaOrdinary 100
Rolls-Royce Marine A/S Ostre Havnepromenade 34, 9000, Aalborg, Denmark Ordinary 100Rolls-Royce Marine AS Borgundvegen 340, Ålesund, 6009, Norway Ordinary 100Rolls-Royce Marine Benelux BV Werfdijk 2, 3195 HV Pernis, Rotterdam, Netherlands Ordinary 100Rolls-Royce Marine Chile S.A. Alcantra 200, Office 1303, Las Condes, Santiago, Chile Ordinary 100Rolls-Royce Marine Deutschland GmbH Fährstieg 9, 21107, Hamburg, Germany Ordinary 100Rolls-Royce Marine Electrical Systems Limited *
Derby 1 Ordinary 100
Rolls-Royce Marine España S.A. Calle Dinamarca s/n (esquina Calle Alemania), Poligono Industrial de Constanti, 43120 Constanti, Tarragona, Spain
Ordinary 100
Rolls-Royce Marine France SARL 122 avenue Charles de Gaulle, 92200 Neuilly-sur-Seine, France Ordinary 100Rolls-Royce Marine Hellas S.A. 25 Atki Poseidonos str. & Makrigianni str., Moschato, Athens,
GR-18344, GreeceOrdinary 100
Rolls-Royce Marine Hong Kong Limited G/F, No 1-3 Wing Yip Street, Kwai Chung, New Territories, Hong Kong
Ordinary 100
Rolls-Royce Marine India Private Limited 3 Birla Tower West, 2nd Floor, 25 Barakhamba Road, New Delhi, 110001, India
Ordinary 100
Rolls-Royce Marine Manufacturing (Shanghai) Limited
No.1 Xuanzhong Road, Xuanqiao Town, Pudong New Area, Shanghai, 201399, China
Ordinary 100
Rolls-Royce Marine North America, Inc. Wilmington 2 Common Stock 100Rolls-Royce Marine Power Operations Limited Derby 1 Ordinary 100Rolls-Royce Mexico Administration S. de R.L. de C.V.
Boulevard Adolfo Ruiz Cortinez 3642-403, Fracc Costa de Oro, Verzcruz CP 94299 6, Mexico
Ordinary 100
Rolls-Royce Mexico S. de R.L. de C.V. Boulevard Adolfo Ruiz Cortinez 3642-403, Fracc Costa de Oro, Verzcruz CP 94299 6, Mexico
Ordinary 100
Rolls-Royce Military Aero Engines Limited *3 Derby 1 Ordinary 100Rolls-Royce Money Purchase Pension Plan Limited *4
Derby 1 Ordinary 100
Rolls-Royce Namibia (Proprietary) Limited 2nd Floor, Unit 4, LA Chambers, Ausspann Plaza, Dr Agostinho Neto Road, Ausspannplatz, Windhoek, Namibia
Ordinary 100
Rolls-Royce New Zealand Limited Level 7 Bayleys Building, 36 Brandon Street, Wellington, 6011, New Zealand
Ordinary 100
Rolls-Royce Nigeria Limited * Civic Towers, Plot GA1, Ozumba Mbadiwe Avenue, Victoria Island, Lagos, Nigeria
Ordinary 100
Rolls-Royce North America (USA) Holdings Co.Wilmington 2 Common Stock 100Rolls-Royce North America Holdings, Inc. Wilmington 2 Common Stock 100Rolls-Royce North America, Inc. Wilmington 2 Common Stock 100Rolls-Royce North America Ventures, Inc. Wilmington 2 Common Stock 100Rolls-Royce North American Technologies, Inc.
Wilmington 2 Common Stock 100
Rolls-Royce Nuclear Field Services France S.A.S.
ZA Notre-Dame, 84430, Mondragon, France Ordinary 100
Rolls-Royce Nuclear Field Services, Inc. Corporation Service Company, 80 State Street, Albany, New York 12207, United States
Common Stock 100
Rolls-Royce Oman LLC Bait Al Reem, Business Office #131, Building No 81, Way No 3409, Block No 234, Al Thaqafa Street, Al Khuwair, PO Box 20, Postal Code 103, Oman
Cash shares 100
Rolls-Royce Operations (India) Private Limited Birla Tower West, 2nd Floor, 25 Barakhamba Road, New Delhi, 110001, India
Ordinary 100
Rolls-Royce Overseas Holdings Limited Derby 1 Ordinary 100Rolls-Royce Overseas Investments Limited Derby 1 Ordinary 100Rolls-Royce Oy Ab P.O. Box 220, Suojantie 5, 26101, Rauma, Finland A shares 100Rolls-Royce Placements Limited Derby 1 Ordinary 100
* Dormant entity.1 Moor Lane, Derby, DE24 8BJ, England.2 Corporation Service Company, 251 Little Falls Drive, Wilmington, Delaware 19808, United States.3 Reporting year end is 31 March.4 Reporting year end is 28 February.
Rolls-Royce Holdings plc Annual Report 2017 179Financial StatementsSubsidiaries
FINA
NC
IAL STATEM
ENTS
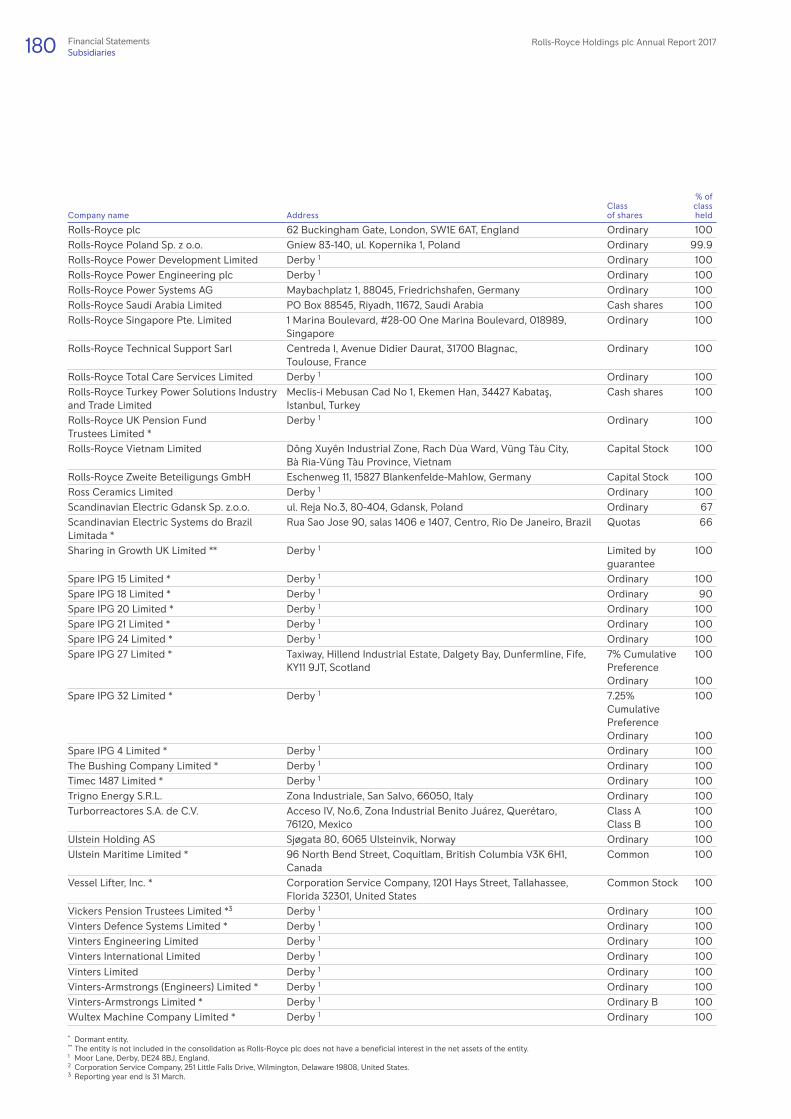
Company name AddressClass of shares
% ofclass held
Rolls-Royce plc 62 Buckingham Gate, London, SW1E 6AT, England Ordinary 100Rolls-Royce Poland Sp. z o.o. Gniew 83-140, ul. Kopernika 1, Poland Ordinary 99.9Rolls-Royce Power Development Limited Derby 1 Ordinary 100Rolls-Royce Power Engineering plc Derby 1 Ordinary 100Rolls-Royce Power Systems AG Maybachplatz 1, 88045, Friedrichshafen, Germany Ordinary 100Rolls-Royce Saudi Arabia Limited PO Box 88545, Riyadh, 11672, Saudi Arabia Cash shares 100Rolls-Royce Singapore Pte. Limited 1 Marina Boulevard, #28-00 One Marina Boulevard, 018989,
SingaporeOrdinary 100
Rolls-Royce Technical Support Sarl Centreda I, Avenue Didier Daurat, 31700 Blagnac, Toulouse, France
Ordinary 100
Rolls-Royce Total Care Services Limited Derby 1 Ordinary 100Rolls-Royce Turkey Power Solutions Industry and Trade Limited
Meclis-i Mebusan Cad No 1, Ekemen Han, 34427 Kabataş, Istanbul, Turkey
Cash shares 100
Rolls-Royce UK Pension Fund Trustees Limited *
Derby 1 Ordinary 100
Rolls-Royce Vietnam Limited Dông Xuyên Industrial Zone, Rach Dùa Ward, Vüng Tàu City, Bà Ria-Vüng Tàu Province, Vietnam
Capital Stock 100
Rolls-Royce Zweite Beteiligungs GmbH Eschenweg 11, 15827 Blankenfelde-Mahlow, Germany Capital Stock 100Ross Ceramics Limited Derby 1 Ordinary 100Scandinavian Electric Gdansk Sp. z.o.o. ul. Reja No.3, 80-404, Gdansk, Poland Ordinary 67Scandinavian Electric Systems do Brazil Limitada *
Rua Sao Jose 90, salas 1406 e 1407, Centro, Rio De Janeiro, Brazil Quotas 66
Sharing in Growth UK Limited ** Derby 1 Limited by guarantee
100
Spare IPG 15 Limited * Derby 1 Ordinary 100Spare IPG 18 Limited * Derby 1 Ordinary 90Spare IPG 20 Limited * Derby 1 Ordinary 100Spare IPG 21 Limited * Derby 1 Ordinary 100Spare IPG 24 Limited * Derby 1 Ordinary 100Spare IPG 27 Limited * Taxiway, Hillend Industrial Estate, Dalgety Bay, Dunfermline, Fife,
KY11 9JT, Scotland7% Cumulative PreferenceOrdinary
100
100Spare IPG 32 Limited * Derby 1 7.25%
Cumulative PreferenceOrdinary
100
100Spare IPG 4 Limited * Derby 1 Ordinary 100The Bushing Company Limited * Derby 1 Ordinary 100Timec 1487 Limited * Derby 1 Ordinary 100Trigno Energy S.R.L. Zona Industriale, San Salvo, 66050, Italy Ordinary 100Turborreactores S.A. de C.V. Acceso IV, No.6, Zona Industrial Benito Juárez, Querétaro,
76120, MexicoClass AClass B
100100
Ulstein Holding AS Sjøgata 80, 6065 Ulsteinvik, Norway Ordinary 100Ulstein Maritime Limited * 96 North Bend Street, Coquitlam, British Columbia V3K 6H1,
CanadaCommon 100
Vessel Lifter, Inc. * Corporation Service Company, 1201 Hays Street, Tallahassee, Florida 32301, United States
Common Stock 100
Vickers Pension Trustees Limited *3 Derby 1 Ordinary 100Vinters Defence Systems Limited * Derby 1 Ordinary 100Vinters Engineering Limited Derby 1 Ordinary 100Vinters International Limited Derby 1 Ordinary 100Vinters Limited Derby 1 Ordinary 100Vinters-Armstrongs (Engineers) Limited * Derby 1 Ordinary 100Vinters-Armstrongs Limited * Derby 1 Ordinary B 100Wultex Machine Company Limited * Derby 1 Ordinary 100
* Dormant entity.** The entity is not included in the consolidation as Rolls-Royce plc does not have a beneficial interest in the net assets of the entity.1 Moor Lane, Derby, DE24 8BJ, England.2 Corporation Service Company, 251 Little Falls Drive, Wilmington, Delaware 19808, United States.3 Reporting year end is 31 March.
180 Rolls-Royce Holdings plc Annual Report 2017Financial StatementsSubsidiaries

Company name AddressClass of shares
% of class held
Group interest held %
Aero Gearbox International SAS ** 18 Boulevard Louis Sequin, 92700 Colombes, France Ordinary 50 50Aerospace Transmission Technologies GmbH **
Adelheidstrasse 40, D-88046, Friedrichshafen, Germany Capital Stock 50 50
Airtanker Holdings Limited Airtanker Hub, RAF Brize Norton, Carterton, Oxfordshire, OX18 3LX, England
Ordinary 20 20
Airtanker Services Limited Airtanker Hub, RAF Brize Norton, Carterton, Oxfordshire, OX18 3LX, England
Ordinary 22 22
Alpha Leasing (US) (No.2) LLC Wilmington 2 Partnership (no equity held)
– 50
Alpha Leasing (US) (No.4) LLC Wilmington 2 Partnership (no equity held)
– 50
Alpha Leasing (US) (No.5) LLC Wilmington 2 Partnership (no equity held)
– 50
Alpha Leasing (US) (No.6) LLC Wilmington 2 Partnership (no equity held)
– 50
Alpha Leasing (US) (No.7) LLC Wilmington 2 Partnership (no equity held)
– 50
Alpha Leasing (US) (No.8) LLC Wilmington 2 Partnership (no equity held)
– 50
Alpha Leasing (US) LLC Wilmington 2 Partnership (no equity held)
– 50
Alpha Partners Leasing Limited 62 Buckingham Gate, London, SW1E 6AT, England Ordinary A 100 50Anecom Aerotest GmbH 122 Freiheitstrasse, Wildau, D-15745, Germany Capital Stock 24.9 24.9CFMS Limited 43 Queen Street, Bristol, BS1 4QP, England Limited by
guarantee– 50
Clarke Chapman Portia Port Services Limited
Maritime Centre, Port of Liverpool, Liverpool, L21 1LA, England
Ordinary A 100 50
Consorcio Español para el Desarrollo Industrial del Helicóptero de Ataque Tigre, A.I.E.
Avda. de Aragón 404, 28022 Madrid, Spain Partnership (no equity held)
– 50
Consorcio Español para el Desarrollo Industrial del Programa Eurofighter, A.I.E.
Paseo de John Lennon, s/n, edificio T22, 2ª planta, Getafe, Madrid, Spain
Partnership (no equity held)
– 50
Egypt Aero Management Services EgyptAir Engine Workshop, Cairo International Airport, Cairo, Egypt
Ordinary 50 50
EPI Europrop International GmbH Dachauer Strasse 655, 80995, Munich, Germany Capital Stock 44 44EPIX Power Systems, LLC The Corporation Trust Company, 1209 Orange Street,
Wilmington, Delaware 19801, United StatesPartnership (no equity held)
– 50
Eurojet Turbo GmbH Lilienthalstrasse 2b, 85399 Halbergmoos, Germany Capital Stock 46 46GE Rolls-Royce Fighter Engine Team LLC
The Corporation Trust Company, 1209 Orange Street, Wilmington, Delaware 19801, United States
Partnership (no equity held)
– 50
Genistics Holdings Limited Derby 1 Ordinary A 100 50Global Aerospace Centre for Icing and Environmental Research Inc.
1000 Marie-Victorin Boulevard, Longueuil Québec J4G 1A1, Canada
Ordinary 50 50
Hong Kong Aero Engine Services Limited
33rd Floor, One Pacific Place, 88 Queensway, Hong Kong
Ordinary 50 50
Hovden Klubbhus AS Stålhaugen 5, Ulsteinvik, 6065, Norway Ordinary 69 69International Aerospace Manufacturing Private Limited **3
Survey No. 3 Kempapura Village, Varthur Hobli, Bangalore, KA 560037, India
Ordinary 50 50
LG Fuel Cell Systems Inc. Wilmington 2 Common Stock 27 27Light Helicopter Turbine Engine Company (unincorporated partnership)
Suite 119, 9238 Madison Boulevard, Madison, Alabama 35758, United States
Partnership (no equity held)
– 50
MEST Co., Limited 97 Bukjeonggongdan 2-gil, Yangsan-si, Gyeongsangnam-do, 50571, Republic of Korea
Normal 46.8 46.8
Joint Ventures and Associates
* Dormant company.** These entities are accounted for as joint operations (see note 1 accounting policies).1 Moor Lane, Derby, DE24 8BJ, England.2 Corporation Service Company, 251 Little Falls Drive, Wilmington, Delaware 19808, United States.3 Reporting year end is 31 March.
Rolls-Royce Holdings plc Annual Report 2017 181Financial StatementsJoint Ventures and Associates
FINA
NC
IAL STATEM
ENTS

Company name AddressClass of shares
% of class held
Group interest held %
Metlase Limited Unipart House, Garsington Road, Cowley, Oxford, OX4 2PG, England
Ordinary B 100 20
MTU Turbomeca Rolls-Royce GmbH Am Söldnermoos 17, 85399 Hallbergmoos, Germany Capital Stock 33.3 33.3MTU Turbomeca Rolls-Royce ITP GmbH
Am Söldnermoos 17, 85399 Hallbergmoos, Germany Capital Stock 50 50
MTU Yuchai Power Company Limited No 7 Danan Road, Yuzhou, Yulin, Guangxi, China, 537005, China
Capital Stock 50 50
N3 Engine Overhaul Services GmbH & Co KG
Gerhard-Höltje-Strasse 1, D-99310, Arnstadt, Germany Capital Stock 50 50
N3 Engine Overhaul Services Verwaltungsgesellschaft Mbh
Gerhard-Höltje-Strasse 1, D-99310, Arnstadt, Germany Capital Stock 50 50
Offshore Simulator Centre AS Borgundvegen 340, 6009, Ålesund, Norway Ordinary 25 25Rolls Laval Heat Exchangers Limited * Derby 1 Ordinary 100 50Rolls-Royce & Partners Finance (US) (No 2) LLC
Wilmington 2 Partnership (no equity held)
– 50
Rolls-Royce & Partners Finance (US) LLC
Wilmington 2 Partnership (no equity held)
– 50
SAFYRR Propulsion Limited Derby 1 B Shares 100 50Shanxi North MTU Diesel Co. Limited No.97 Daqing West Road, Datong City, Shanxi Province,
ChinaOrdinary 49 49
Singapore Aero Engine Services Private Limited
11 Calshot Road, 509932, Singapore Ordinary 50 50
Texas Aero Engine Services LLC The Corporation Trust Company, 1209, Orange Street, Wilmington, Delaware 19801, United States
Partnership (no equity held)
– 50
Techjet Aerofoils Limited ** Tefen Industrial Zone, PO Box 16, 24959, Israel Ordinary AOrdinary B
5050
50
TRT Limited Derby 1 Ordinary B 100 49.9Turbine Surface Technologies Limited **
Derby 1 Ordinary B 100 50
Turbo-Union Limited Derby 1 A SharesOrdinary
37.540
40
UK Nuclear Restoration Limited * Booths Park, Chelford Road, Knutsford, Cheshire, WA16 8QZ, England
Ordinary 20 20
Viking Reisebyra AS Stålhaugen 10, 6065 Ulsteinvik, Norway Ordinary 50 50Xian XR Aero Components Co., Limited **
Xujiawan, Beijiao, Po Box 13, Xian 710021, Shaanxi, China
Ordinary 49 49
* Dormant company.** These entities are accounted for as joint operations (see note 1 accounting policies).1 Moor Lane, Derby, DE24 8BJ, England.2 Corporation Service Company, 251 Little Falls Drive, Wilmington, Delaware 19808, United States.3 Reporting year end is 31 March.
182 Rolls-Royce Holdings plc Annual Report 2017Financial StatementsJoint Ventures and Associates