Embed Size (px)
Citation preview
ARTICLE IN PRESS
Contents lists available at ScienceDirect
International Business Review
International Business Review 17 (2008) 630–641
0969-59
doi:10.1
� Cor
E-m
journal homepage: www.elsevier.com/locate/ibusrev
Finance-specific factors as drivers of cross-border investment—Anempirical investigation
Jens Forssbæck a,b, Lars Oxelheim a,c,�
a Lund Institute of Economic Research, P.O. Box 7080, 220 07 Lund, Swedenb Center for Law, Economics and Financial Institutions, Copenhagen Business School, Copenhagen, Denmarkc The Research Institute of Industrial Economics, P.O. Box 55665, 102 15 Stockholm, Sweden
a r t i c l e i n f o
Article history:
Received 16 January 2008
Received in revised form
16 August 2008
Accepted 22 September 2008
JEL classification:
E22
F21
F23
L23
Keywords:
Cost of capital
Cross-border acquisitions
FDI
Financial strategy
Financial variables
OLI
31/$ - see front matter & 2008 Elsevier Ltd. A
016/j.ibusrev.2008.09.001
responding author at: Lund Institute of Econo
ail addresses: [email protected] (J. For
a b s t r a c t
In this paper we empirically test the role of firm-specific financial characteristics as
drivers of international investment and production. We hypothesize that financial
strength generates advantages that can be exploited through cross-border investment
activity. The hypothesis is tested in a series of binary-response models, using a sample of
1379 European non-financial firms’ international acquisitions. Controlling for traditional
firm- and target-country-specific foreign direct investment (FDI) determinants, we find
strong evidence that financial factors play a significant role in explaining cross-border
investment. We conclude that without explicit consideration of the financial dimension,
firms’ FDI decisions cannot be properly understood.
& 2008 Elsevier Ltd. All rights reserved.
1. Introduction
Several theories and research traditions have contributed to understanding the determinants behind a firm’s decision toundertake foreign direct investment (FDI). One common element in these different, but often overlapping, theories is thatthey focus on real side factors, whereas the financial side of the firm is ignored, or allotted a menial role for the FDIdecision. This in turn may reflect a relatively small role for finance within international business theory more broadly(as noted at a general level by, e.g., Agmon, 2006)—possibly due to a tradition of (implicitly) assuming that financeessentially ‘‘follows fundamentals’’. Indeed, Dunning (1993), for instance, discusses a ‘‘financial asset advantage’’ thatconcerns ‘‘firms’ superior knowledge of, and access to foreign sources of capital’’, but essentially finds this advantage to be aby-product of the size, efficiency and knowledge of the multinational firms.
Contrasting this view, in a conceptual paper, Oxelheim, Randøy, and Stonehill (2001) argue that a firm’s financialcharacteristics are not merely by-products of its competitive strength but constitute a distinct set of explanatory variables.
ll rights reserved.
mic Research, P.O. Box 7080, 220 07 LUND, Sweden. Tel.: +46 46 222 8744; fax: +46 46 222 44 37.
ssbæck), [email protected], [email protected] (L. Oxelheim).

ARTICLE IN PRESS
J. Forssbæck, L. Oxelheim / International Business Review 17 (2008) 630–641 631
By having a superior financial strategy a firm is able to minimize its cost and maximize its availability of capital relative toits competitors, both domestic and foreign. By lowering the discount factor of any investment, such a financial advantageincreases the firm’s likelihood of engaging in FDI.
The present paper brings this argument to the data. As point of departure, we have chosen to focus on theownership–location–internalization (OLI) framework (Dunning, 1977) since, in its ambition of being all-inclusive, itprovides a list of ‘‘standard’’ FDI determinants against which we can test the added explanatory value from includingfinancial factors. We thus construct a number of firm-level financial characteristics ranging from simple cost of capital andcreditworthiness measures to outright financial strategies such as listing the firm’s equity on large and competitive foreignstock exchanges. We then use binary-response models to test if the included financial variables significantly influence afirm’s propensity to undertake FDI, next to a set of traditional FDI determinants suggested by OLI. As far as we are aware,this is the first paper to empirically test the role of firm-level financial factors within a ‘‘full-fledged’’ OLI framework.
The results, based on a sample of 1379 European non-financial firms’ cross-border acquisitions in a total of 44 targetmarkets, show a strongly significant explanatory power of a number of financial characteristics and of financial strategiesundertaken in a period of up to 60 months prior to the investment. These results give a clear indication of the importantrole played by finance-specific factors and support the notion that firms can create ownership advantages by adoptingstrategies to improve their financial strength.
The article is organized in the following way. The next section summarizes the argument for including finance-specificfactors in the OLI framework. In Section 3 the empirical models and testing methodology are explained. We then presentdefinitions of the variables used and the dataset. In Section 5, the results are presented and discussed. In the final sectionwe summarize our findings and provide concluding remarks.
2. Financial determinants of FDI and the OLI paradigm
The basic underlying logic for the inclusion of financial factors in any model proposing to explain FDI is that a firm’s costof and access to capital matter for its ability and propensity to undertake foreign investment. Hence, strategies aimed atlowering the cost and/or increasing the availability of funds—i.e., creating a financial advantage—will improve a firm’slikelihood undertaking FDI.
However, in efficient and internationally integrated financial markets, no firm has a financial advantage over another,since all firms have equal access to finance at equal (risk-adjusted) cost. Arguing for a finance-FDI effect thus requires anassumption of imperfect capital markets that are at least partially internationally segmented. While the theoriesunderpinning the OLI paradigm (especially internalization theory) largely build on imperfections in goods markets, theeffects of financial market imperfections have received less attention. To the extent that they have been acknowledged,they have been discussed as sources of locational advantages or—in a strategic context—as potential sources ofopportunistic, ‘‘reactive’’ managerial behaviour (Aliber, 1970; Dunning, 1993; Kogut & Kulatilaka, 1994). Oxelheim et al.(2001), by contrast, emphasize to the role of ‘‘proactive’’ financial strategies and the potential of such strategies to generateownership advantages.
The basic tenet of an ownership advantage is that to undertake FDI, a firm must have developed firm-specificcharacteristics that enable it to be competitive in the home market. The assumption is that these characteristics aretransferable abroad and of such magnitude that they may compensate for the extra costs and barriers that are associatedwith doing business abroad. Ownership advantages may include various economies of scale and scope (such as size, marketpower, and economies of multi-plant structures), a superior technology, or other types of proprietary knowledge, such asmanagerial and marketing expertise.
A low cost and high availability of capital may thus be categorized as a ‘‘traditional’’ ownership advantage insofar aslarge, research-intensive MNCs reside in countries with liquid, efficient, and integrated financial markets. But as pointedout by Oxelheim et al. (2001) this is not necessarily true for MNCs resident elsewhere or for firms in general. For such afirm, a conscious strategy aimed at improving its financial strength may materialize in an ownership advantage. Therefore,given (partial) segmentation and remaining home bias in world capital markets, there are benefits to be reaped from‘‘proactive’’ financial strategies such as, e.g., cross-listing in a more liquid stock market (Foerster & Karolyi, 1999; Miller,1999; Pagano, Roell, & Zechner, 2002; Sundaram & Logue, 1996; Tolmunen & Torstila, 2005), foreign issues of equity and/ordebt (Moden & Oxelheim, 1997), and ‘‘bonding’’ strategies to reduce information asymmetries (Oxelheim & Randøy, 2003).
Following this argument, financial advantages may be important for all firms but should be particularly important toMNCs resident in small industrial or emerging market countries with relatively illiquid and/or segmented domestic capitalmarkets. Moreover, it may matter to the understanding of the process to distinguish between situations where anownership advantage is created or where an ownership disadvantage is eliminated. For instance, a firm resident in a small,emerging market country, making its way out of a thin and regulated domestic capital market by an innovative financialstrategy, may have eliminated an ownership disadvantage vis-a-vis its competitors in developed countries. But at the sametime it may also have created an ownership advantage vis-a-vis its competitors in other emerging economies, which can beexploited by FDI during a limited period.
Oxelheim et al. (2001) identify three major financial strategies, or groups of strategies, that may qualify as underpinningownership advantages. The first of these is gaining and maintaining a global cost and availability of capital (for example by
ARTICLE IN PRESS
J. Forssbæck, L. Oxelheim / International Business Review 17 (2008) 630–641632
sourcing capital globally, by cross-listing on a larger and more liquid stock exchange, and by maintaining a competitivecredit rating). The second strategy is negotiating financial subsidies and/or reduced taxation to increase free cash flow. Thethird major strategy is the launching and entertainment of a successful, value-creating risk management program.
In this paper we empirically test the hypothesis that financial ownership advantages increase the probability ofundertaking a cross-border acquisition. We hypothesize that a firm is more likely to engage in FDI when it has—amongother things—access to competitively priced equity, when it has cross-listed its stock in a larger, more liquid equity market,when it enjoys a strong investment grade credit rating, and when it is able to negotiate reduced taxation and/or to attractsubsidies. The next section describes the empirical method in more detail.
3. Model and empirical strategy
The basic idea underlying the empirical testing in this paper is that firm-level financial characteristics, which maybe—at least in part—the result of deliberate strategies to improve the financial strength of the firm, influence theprobability that the firm will make a foreign acquisition. This is tested in the framework of a number of binary-responseregression models, where the completion of a foreign acquisition is a discrete variable, which is regressed on firm financialcharacteristics and a set of relevant traditional OLI factors and control variables. This gives a general specification of thefollowing form:
ACQik ¼1 if ACQ�ik40
0 otherwise;
(
where
ACQ�ik ¼ aþ b0Fi þ d0Oi þf0Lk þ g0Ik þ p0Cik þ �ik. (1)
ACQ�ik is the size of acquisitions undertaken by firm i in country k (where k is any country except the country of origin of i),Fi is a vector of finance-specific ownership variables of firm i, Oi is a vector of traditional ownership variables for firm i, Lk
and Ik are location and internalization factors specific to host country k, Cik are control variables which may vary over firmsor across countries, and eik is an error term. Definitions of the included finance-specific and traditional OLI variables, as wellas a presentation of the dataset and its sources, are found in the next section.
Our primary interest lies in firm-specific regressors, particularly the finance-related variables. In order to keep thedataset tractable, however, we had to limit the number of firm-specific variables as well as the number of possibledestination countries. This is because the non-linear specifications (logit or probit models) tend to non-convergence withan excessive number of independent variables, and because the number of observations increases exponentially for eachadded possible destination country. In order to handle this, the testing is conducted in four steps.
In the first step we attempt to find the most parsimonious model specification possible as regards the firm-specific(‘‘O’’ and ‘‘F’’) variables, without losing significant explanatory power. This is done by running the model:
ACQi ¼1 if ACQ�i 40
0 otherwise;
(
where
ACQ�i ¼ aþ b0Fi þ d0Oi þ g0Ci þ �i. (2)
Here, ACQi denotes the decision by firm i to make any foreign investment (regardless of destination country), and it isexplained solely by firm-specific characteristics and firm-specific control dummies. These tests are to be considered asmainly designed to select the most important firm-specific variables, not to give a full account of the investment decisionprocess. A stepwise procedure was applied to exclude non-significant variables.
In the second step we turn to the host-country-specific variables. The number of possible host countries has, asmentioned, been limited due to various practical considerations. First, we eliminated the countries that did not receive any
direct investment from the firms in our sample. Second, several of the remaining countries were eliminated because of lackof adequate data. The non-randomness of this process of elimination of possible destination countries from the entirepopulation (i.e., all countries in the world)—dictated by data availability and other factors which are potentially correlatedwith variables included in the model to be estimated—introduces the risk of sample selection bias as regards the country-specific variables. To take this into consideration, we adopt the relatively standard Heckman (1979) two-step approach tocontrol for possible sample selection bias. We thus first estimate a simple probit model of the selection process. From thisestimation we obtain a country-specific variable, the inverse Mills-ratio (henceforth called l), which—by proxying for theprobability of being included in the sample in the first place—corrects the subsequent binary-response models for thepotential selection bias. The selection model takes the form:
SELj ¼ aþ b0Xj þ �j, (3)
where SELj takes on unit value if country j was selected as a possible destination country for investment in the finalregressions, and zero otherwise, the countries J are a random sample drawn from the population of all possible destination

ARTICLE IN PRESS
Table 1Variable definitions
Variable Description Expected sign
Dependent variable
Acquisition Dummy variable; equals one if a foreign acquisition was undertaken in 2000, zero otherwise
Finance-specific variables
Price/sales Average price/sales ratio: market value divided by total sales in natural logarithm form,
averaged over 1996–2000
+
DPrice/sales Average 1996–1999 p/s ratio subtracted from p/s ratio 2000 +
Cross-listing Dummy variable; equals one if the firm listed on NYSE, NASDAQ, or LSE in any of the years
1996–2000, zero otherwise
+
Debt-cost Average cost of debt: natural logarithm of (1+interest expenditure over total liabilities),
averaged over 1996–2000
�
DDebt-cost Average 1996–1999 cost of debt subtracted from cost of debt 2000 �
Z-score Z00-scorea averaged over 1996–2000 +
DZ-score Average 1996–1999 Z00-score subtracted from Z00-score 2000 +
Debt cost� Z-score Interaction variable with included variables defined as above +/�
Grant Dummy variable; equals one if the firm received a government grant in any of the years
1996–2000, zero otherwise
+
Tax reduction Reduced taxation: 1�total income taxes/EBIT/statutory tax rate, averaged over 1996–2000 +
Free cash flow Internal financing: free cash flow over total assets, averaged over 1996–2000 +
Ownership variables
Firm size Total sales in natural logarithm form, averaged over 1996–2000 +
Intangibles Intangible assets over total assets, averaged over 1996–2000 +
Inventories Inventories and stocks over total assets, averaged over 1996–2000 +
Sales/employee Total sales over number of employees, averaged over 1996–2000 +
Country-specific variables
(Location and internalization
variables+additional variables
used in selection model)
GDP Target market size: GDP in natural logarithm form, averaged over 1996–2000 +
Population Target country population in log form, averaged over 1996–2000 +
Income The log of GDP per capita in the target country, averaged over 1996–2000 +/�
Wage Target country production costs: the log of the average monthly manufacturing wages,
averaged over 1996–2000
�
Tax rate The target country’s statutory corporate income tax rate, in log form, observed in 1999 �
Transparency The target country’s score in Transparency International’s corruption’s perception index
(CPI), observed in 2003; higher index value indicates less corruption
+
Accountability The target country’s score in an index of ‘‘voice and accountability’’ (see Kaufmann et al.,
2003), observed in 2000b; higher index value indicates more democracy
+
Stability The target country’s score in an index of ‘‘political stability’’ (see Kaufmann et al., 2003),
observed in 2000b; higher index value indicates lower political risk
+
Law The target country’s score in an index of ‘‘rule of law’’ (see Kaufmann et al., 2003), observed
in 2000b; higher index value indicates higher judicial integrity
+
a Notes: Z00 ¼ 6.56� (working capital/total assets)+3.26� (retained earnings/total assets)+6.72� (EBIT/total assets)+1.05� (market value of equity/
book value of total liabilities).b In a small number of cases, where data were unavailable for 2000, observations are from 2002.
J. Forssbæck, L. Oxelheim / International Business Review 17 (2008) 630–641 633
countries, and Xj is a vector of country characteristics believed to correlate with the decision to include the country in thefinal sample of possible destination countries (again, see next section for a listing and definitions of the independentvariables).
The third step is to estimate the full model, including both firm-specific and destination-country-specificcharacteristics, as described by Eq. (1). The merging of firm-specific and host-country-specific variables on the righthand side of the model equation gives rise to a set of independent variables which vary in two different dimensions: O, F,and Ci regressors vary across firms; L, I, and Ck regressors vary across countries.1 This means that firm-specificdata are repeated across countries and destination-country data are repeated across firms in the final cross-section ofobservations, with possible ‘‘clustering’’ effects as a result. In order to account for this, we test the full set of variables bydifferent regression methods in a pooled cross-section setting, where we test for the presence of both firm-level andcountry-level effects.
1 The only country-specific control variable used is the lambda variable obtained from the selection model.
ARTICLE IN PRESS
J. Forssbæck, L. Oxelheim / International Business Review 17 (2008) 630–641634
The fourth and final step is to perform hypothesis tests, in order to measure the incremental contribution of finance-related variables to the explanation of cross-border investment.
4. Definitions and dataset
Operationalizations of finance-specific variables that qualify as ownership advantages are as follows. As the main proxyfor strategies to reduce the cost of equity we have included a dummy variable which takes on unit value if the firm hascross-listed its stock in a leading stock market during up to 60 months preceding the investment. Three leading marketswere used: The New York Stock Exchange (NYSE), NASDAQ, and the London Stock Exchange (LSE). As a second proxy for thecost of equity capital we have used the price/sales ratio. This is a proxy of the relative valuation of the firm—and hence ofits cost of equity—similar in interpretation to the price/earnings ratio. However, since negative price/earnings ratios haveno sensible interpretation, whereas the price/sales ratio is necessarily positive, we chose to use the price/sales ratio(see, e.g., Smart & Zutter, 2003).
Firms’ propensity to make foreign investments could also be influenced by the pricing of their liabilities. In order to takethis into account, we included the firms’ effective cost of debt (actual interest paid, as reported in financial statements, overtotal liabilities). The effect of the cost of debt on firms’ propensity to make investments is, however, ambiguous: on the onehand, a reduction in the overall cost of capital through reduced cost of debt would, ceteris paribus, increase the propensityto make an acquisition through a discount-factor effect, indicating a negative relationship; on the other hand, increasedleverage may be a way to finance acquisitions, but would then also in general tend to increase the credit risk premiuminherent in the cost of debt, indicating the possibility of a positive relationship between acquisition likelihood and costof debt.
A fourth variable along the same lines captures the effect of a firm’s credit rating. As a proxy, we used Altman’s Z00-score(see Altman, 2002), which is a continuous variable constructed from a number of balance-sheet items to reveal the firm’scredit risk. The expected sign of this variable is ambiguous with arguments similar to those of the cost of debt variable. Forthis reason, we have added a fifth variable which captures the interaction between the cost of debt and the firm’scredit risk.
The sixth included financial variable is a dummy which indicates the receipt of government grants during up to 60months preceding the investment, whereas a seventh variable shows actual tax payments relative to the statutory tax rate.These last two variables are intended to capture the firm’s capacity to negotiate reduced taxation and/or subsidies(see Oxelheim & Ghauri, 2004). As a final finance-related variable we use free cash flow over total assets to proxy forinternal financing.
Several finance-specific variables are included both in levels and in first differences, with the argument thatboth the cross-sectional variation in financial strength and a successful effort to improve financial strength over aperiod of time can help explain the firm’s propensity to make foreign investments. First differences are calculated as thedifference between the level during the year of the investment and the average level during the preceding four years (asspecified in Table 1).
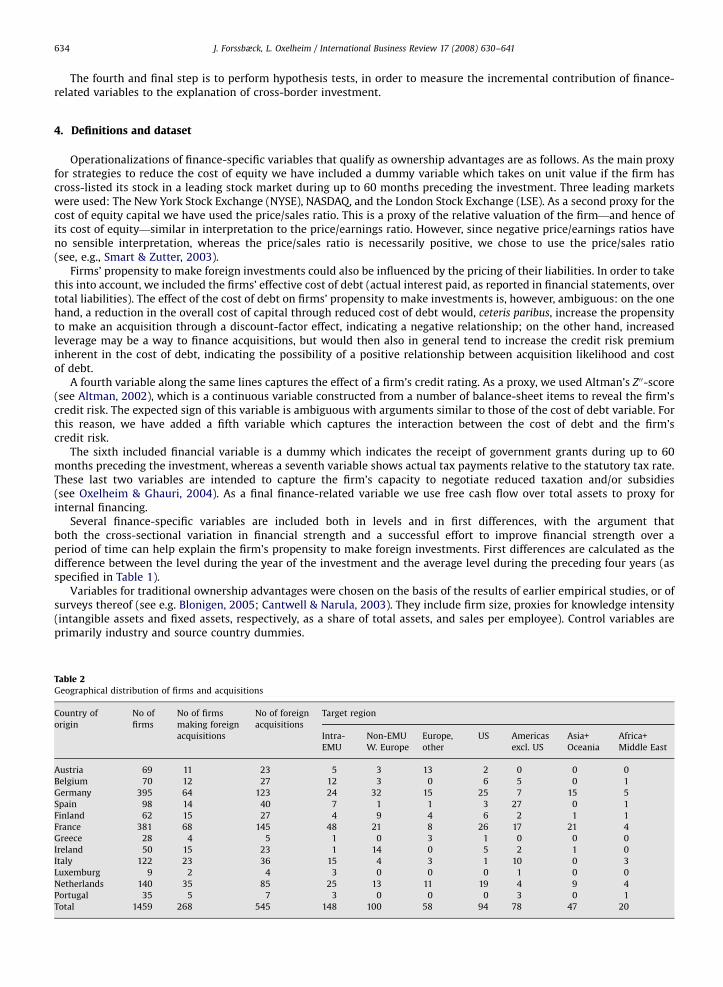
Variables for traditional ownership advantages were chosen on the basis of the results of earlier empirical studies, or ofsurveys thereof (see e.g. Blonigen, 2005; Cantwell & Narula, 2003). They include firm size, proxies for knowledge intensity(intangible assets and fixed assets, respectively, as a share of total assets, and sales per employee). Control variables areprimarily industry and source country dummies.
Table 2Geographical distribution of firms and acquisitions
Country of
origin
No of
firms
No of firms
making foreign
acquisitions
No of foreign
acquisitions
Target region
Intra-
EMU
Non-EMU
W. Europe
Europe,
other
US Americas
excl. US
Asia+
Oceania
Africa+
Middle East
Austria 69 11 23 5 3 13 2 0 0 0
Belgium 70 12 27 12 3 0 6 5 0 1
Germany 395 64 123 24 32 15 25 7 15 5
Spain 98 14 40 7 1 1 3 27 0 1
Finland 62 15 27 4 9 4 6 2 1 1
France 381 68 145 48 21 8 26 17 21 4
Greece 28 4 5 1 0 3 1 0 0 0
Ireland 50 15 23 1 14 0 5 2 1 0
Italy 122 23 36 15 4 3 1 10 0 3
Luxemburg 9 2 4 3 0 0 0 1 0 0
Netherlands 140 35 85 25 13 11 19 4 9 4
Portugal 35 5 7 3 0 0 0 3 0 1
Total 1459 268 545 148 100 58 94 78 47 20
ARTICLE IN PRESS
J. Forssbæck, L. Oxelheim / International Business Review 17 (2008) 630–641 635
Variables for traditional location and internalization advantages are target market size, income level, production costs(proxied by average manufacturing wages), the rate of corporate income taxation, and indices for the level of corruptionand (legal and political) accountability.
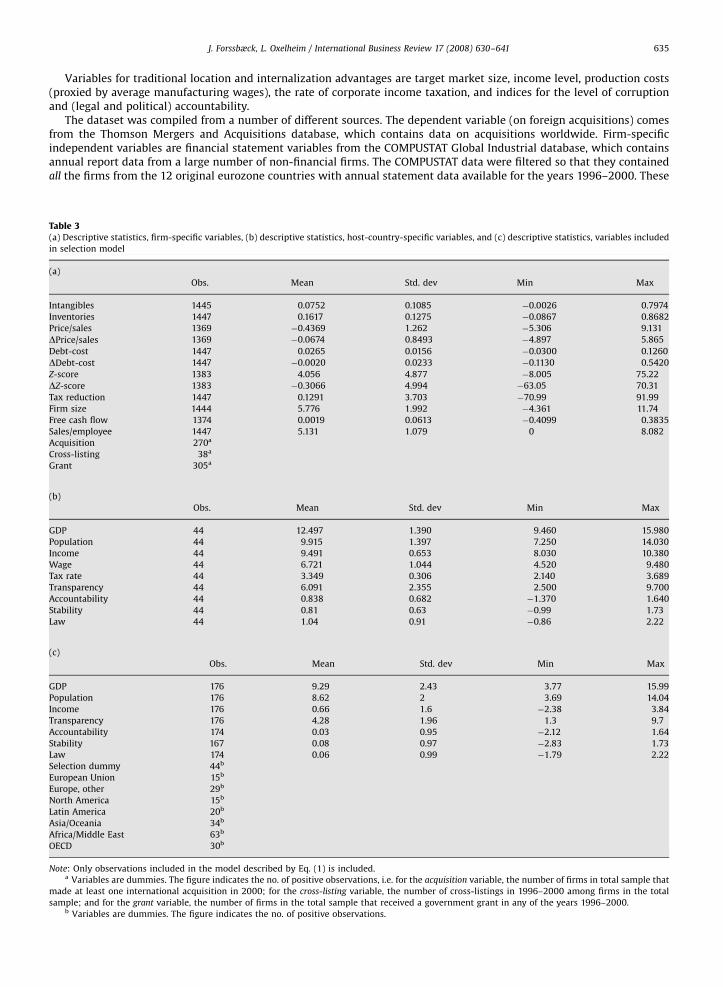
The dataset was compiled from a number of different sources. The dependent variable (on foreign acquisitions) comesfrom the Thomson Mergers and Acquisitions database, which contains data on acquisitions worldwide. Firm-specificindependent variables are financial statement variables from the COMPUSTAT Global Industrial database, which containsannual report data from a large number of non-financial firms. The COMPUSTAT data were filtered so that they containedall the firms from the 12 original eurozone countries with annual statement data available for the years 1996–2000. These
Table 3(a) Descriptive statistics, firm-specific variables, (b) descriptive statistics, host-country-specific variables, and (c) descriptive statistics, variables included
in selection model
(a)
Obs. Mean Std. dev Min Max
Intangibles 1445 0.0752 0.1085 �0.0026 0.7974
Inventories 1447 0.1617 0.1275 �0.0867 0.8682
Price/sales 1369 �0.4369 1.262 �5.306 9.131
DPrice/sales 1369 �0.0674 0.8493 �4.897 5.865
Debt-cost 1447 0.0265 0.0156 �0.0300 0.1260
DDebt-cost 1447 �0.0020 0.0233 �0.1130 0.5420
Z-score 1383 4.056 4.877 �8.005 75.22
DZ-score 1383 �0.3066 4.994 �63.05 70.31
Tax reduction 1447 0.1291 3.703 �70.99 91.99
Firm size 1444 5.776 1.992 �4.361 11.74
Free cash flow 1374 0.0019 0.0613 �0.4099 0.3835
Sales/employee 1447 5.131 1.079 0 8.082
Acquisition 270a
Cross-listing 38a
Grant 305a
(b)
Obs. Mean Std. dev Min Max
GDP 44 12.497 1.390 9.460 15.980
Population 44 9.915 1.397 7.250 14.030
Income 44 9.491 0.653 8.030 10.380
Wage 44 6.721 1.044 4.520 9.480
Tax rate 44 3.349 0.306 2.140 3.689
Transparency 44 6.091 2.355 2.500 9.700
Accountability 44 0.838 0.682 �1.370 1.640
Stability 44 0.81 0.63 �0.99 1.73
Law 44 1.04 0.91 �0.86 2.22
(c)
Obs. Mean Std. dev Min Max
GDP 176 9.29 2.43 3.77 15.99
Population 176 8.62 2 3.69 14.04
Income 176 0.66 1.6 �2.38 3.84
Transparency 176 4.28 1.96 1.3 9.7
Accountability 174 0.03 0.95 �2.12 1.64
Stability 167 0.08 0.97 �2.83 1.73
Law 174 0.06 0.99 �1.79 2.22
Selection dummy 44b
European Union 15b
Europe, other 29b
North America 15b
Latin America 20b
Asia/Oceania 34b
Africa/Middle East 63b
OECD 30b
Note: Only observations included in the model described by Eq. (1) is included.a Variables are dummies. The figure indicates the no. of positive observations, i.e. for the acquisition variable, the number of firms in total sample that
made at least one international acquisition in 2000; for the cross-listing variable, the number of cross-listings in 1996–2000 among firms in the total
sample; and for the grant variable, the number of firms in the total sample that received a government grant in any of the years 1996–2000.b Variables are dummies. The figure indicates the no. of positive observations.
ARTICLE IN PRESS
J. Forssbæck, L. Oxelheim / International Business Review 17 (2008) 630–641636
were matched with the Thomson data, which, in turn, had been filtered to contain only cross-border deals completed in2000, where the acquirer was a firm with eurozone-country origin. The dependent variable assumes unit value forCOMPUSTAT firms that appeared also in the filtered Thomson data.
In addition, data from the NYSE, NASDAQ, and the LSE (fact books and reports) were used to construct thecross-listing dummy. Macroeconomic variables for the host countries were taken from EcoWin and IMF’s International
Financial Statistics (GDP, population, and wage level). Corporate income tax rates were taken from PricewaterhouseCoopers(2000), and the internalization proxies (indices of transparency, political risk, and legal system integrity) are fromTransparency International and from Kaufmann, Kraay, and Mastruzzi (2003). The exact definitions of the variables usedappear in Table 1.
The total number of firms was 1459, distributed across the EMU countries according to Table 2. Allfirm-specific variables were available for 1379 of these firms. The total number of host countries for the Europeanfirms’ cross-border acquisitions was 65, but the number was reduced to 44 in the final regressions due to missingvalues in firm- or country-specific variables. Descriptive statistics for the firm- and country-specific variables appear inTables 3a–c.
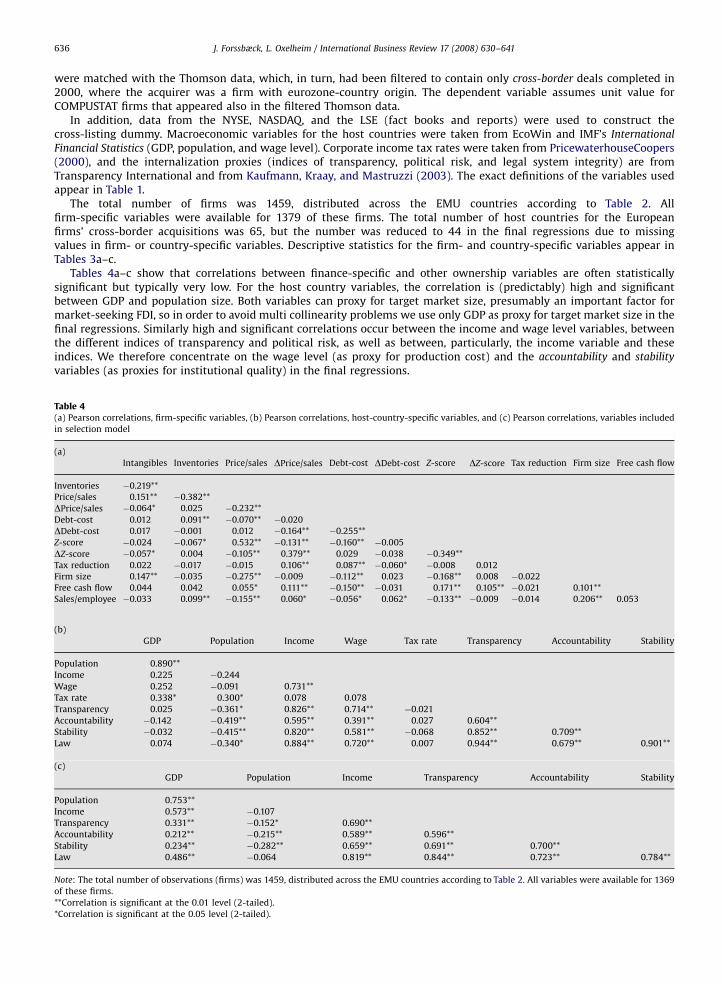
Tables 4a–c show that correlations between finance-specific and other ownership variables are often statisticallysignificant but typically very low. For the host country variables, the correlation is (predictably) high and significantbetween GDP and population size. Both variables can proxy for target market size, presumably an important factor formarket-seeking FDI, so in order to avoid multi collinearity problems we use only GDP as proxy for target market size in thefinal regressions. Similarly high and significant correlations occur between the income and wage level variables, betweenthe different indices of transparency and political risk, as well as between, particularly, the income variable and theseindices. We therefore concentrate on the wage level (as proxy for production cost) and the accountability and stability
variables (as proxies for institutional quality) in the final regressions.
Table 4(a) Pearson correlations, firm-specific variables, (b) Pearson correlations, host-country-specific variables, and (c) Pearson correlations, variables included
in selection model
(a)
Intangibles Inventories Price/sales DPrice/sales Debt-cost DDebt-cost Z-score DZ-score Tax reduction Firm size Free cash flow
Inventories �0.219**
Price/sales 0.151** �0.382**
DPrice/sales �0.064* 0.025 �0.232**
Debt-cost 0.012 0.091** �0.070** �0.020
DDebt-cost 0.017 �0.001 0.012 �0.164** �0.255**
Z-score �0.024 �0.067* 0.532** �0.131** �0.160** �0.005
DZ-score �0.057* 0.004 �0.105** 0.379** 0.029 �0.038 �0.349**
Tax reduction 0.022 �0.017 �0.015 0.106** 0.087** �0.060* �0.008 0.012
Firm size 0.147** �0.035 �0.275** �0.009 �0.112** 0.023 �0.168** 0.008 �0.022
Free cash flow 0.044 0.042 0.055* 0.111** �0.150** �0.031 0.171** 0.105** �0.021 0.101**
Sales/employee �0.033 0.099** �0.155** 0.060* �0.056* 0.062* �0.133** �0.009 �0.014 0.206** 0.053
(b)
GDP Population Income Wage Tax rate Transparency Accountability Stability
Population 0.890**
Income 0.225 �0.244
Wage 0.252 �0.091 0.731**
Tax rate 0.338* 0.300* 0.078 0.078
Transparency 0.025 �0.361* 0.826** 0.714** �0.021
Accountability �0.142 �0.419** 0.595** 0.391** 0.027 0.604**
Stability �0.032 �0.415** 0.820** 0.581** �0.068 0.852** 0.709**
Law 0.074 �0.340* 0.884** 0.720** 0.007 0.944** 0.679** 0.901**
(c)
GDP Population Income Transparency Accountability Stability
Population 0.753**
Income 0.573** �0.107
Transparency 0.331** �0.152* 0.690**
Accountability 0.212** �0.215** 0.589** 0.596**
Stability 0.234** �0.282** 0.659** 0.691** 0.700**
Law 0.486** �0.064 0.819** 0.844** 0.723** 0.784**
Note: The total number of observations (firms) was 1459, distributed across the EMU countries according to Table 2. All variables were available for 1369
of these firms.
**Correlation is significant at the 0.01 level (2-tailed).
*Correlation is significant at the 0.05 level (2-tailed).

ARTICLE IN PRESS
J. Forssbæck, L. Oxelheim / International Business Review 17 (2008) 630–641 637
Since the selection mechanism to the final 44-country sample of host countries largely parallelsFDI location determinants, the ‘‘possible’’ list of variables for the selection model is essentially the same as forthe list of host-country-specific variables (only wage level and corporate income tax level have been deleted fromthe list), but the sample is larger (176 countries). In terms of pairwise correlations between the variables includedin this larger sample (see Table 4c), they follow the pattern of the actual host country sample: GDP and populationsize correlate, as do the various indices of institutional quality, and as do, finally, these indices on the one hand andincome on the other. In order to avoid duplicating variables between the acquisition-likelihood regressions andthe sample-selection regression, thus making the sample-selection correction term simply a function of thevariables in the acquisition-likelihood model (see Wooldridge, 2002), we use population size and income as themain variables in the selection model, alternating accountability or transparency with income, and adding geographicaldummies.
Table 5Estimation results with only firm-level regressors
Linear estimation, all
firm-specific variables
Linear estimation after
stepwise elimination
Probit estimation Logit estimation
Finance-specific variables
Price/sales 0.069 (0.012)*** 0.056 (0.009)*** 0.221 (0.049)*** 0.436 (0.084)***
DPrice/sales 0.017 (0.015)
Cross-listing 0.249 (0.078)*** 0.221 (0.079)*** 0.482 (0.244)** 0.709 (0.417)*
Debt-cost 1.014 (0.894)
DDebt-cost �0.676 (0.477)
Z-score �0.003 (0.005)
DZ-score �0.002 (0.002)
Debt-cost� Z-score 0.087 (0.143)
Grant 0.009 (0.029)
Tax reduction 0.003 (0.002)*
Free cash flow 0.171 (0.136)
Ownership variables
Firm size 0.079 (0.007)*** 0.076 (0.006)*** 0.331 (0.029)*** 0.607 (0.052)***
Intangibles 0.349 (0.119)*** 0.396 (0.108)*** 1.578 (0.393)*** 2.606 (0.702)***
Inventories 0.015 (0.089)
Sales/employee �0.004 (0.010)
Source country dummies All Germany (�) Germany (insign.) Germany (insign.)
France (�) France (�) France (�)
Ireland (+) Ireland (+) Ireland (+)
Spain (�) Spain (�) Spain (�)
Industry dummies All Durables (+) Durables (+) Durables (+)
Electronics (+) Electronics (+) Electronics (+)
Nondurables (�) Nondurables (insign.) Nondurables (�)
Service (+) Service (+) Service (+)
Intercept �0.222 (0.137) �0.248 (0.032)*** �2.964 (0.193)*** �5.317 (0.359)***
Obs. 1298 1367 1367 1367
Adj. R2 0.237 0.205
McFadden pseudo-R2 0.221 0.225
Cases correct 1164 1166
Log-likelihood �516.02 �513.42
Test of exclusion
restrictionsa
84.52*** 58.34*** 27.66*** 31.88***
Dependent variable is the acquisition dummy. Table shows coefficients with standard errors in parentheses (White heteroscedasticity-robust errors for
linear models). For variable definitions, see Table 1.
***t-test indicates significance at the 0.01 level.
**t-test indicates significance at the 0.05 level.
*t-test indicates significance at the 0.10 level.a w2 statistic from Wald test for joint significance of the included finance-related variables. Significance indicates rejection of the null hypothesis that
coefficients for the included finance-related variables are jointly zero.
ARTICLE IN PRESS
J. Forssbæck, L. Oxelheim / International Business Review 17 (2008) 630–641638
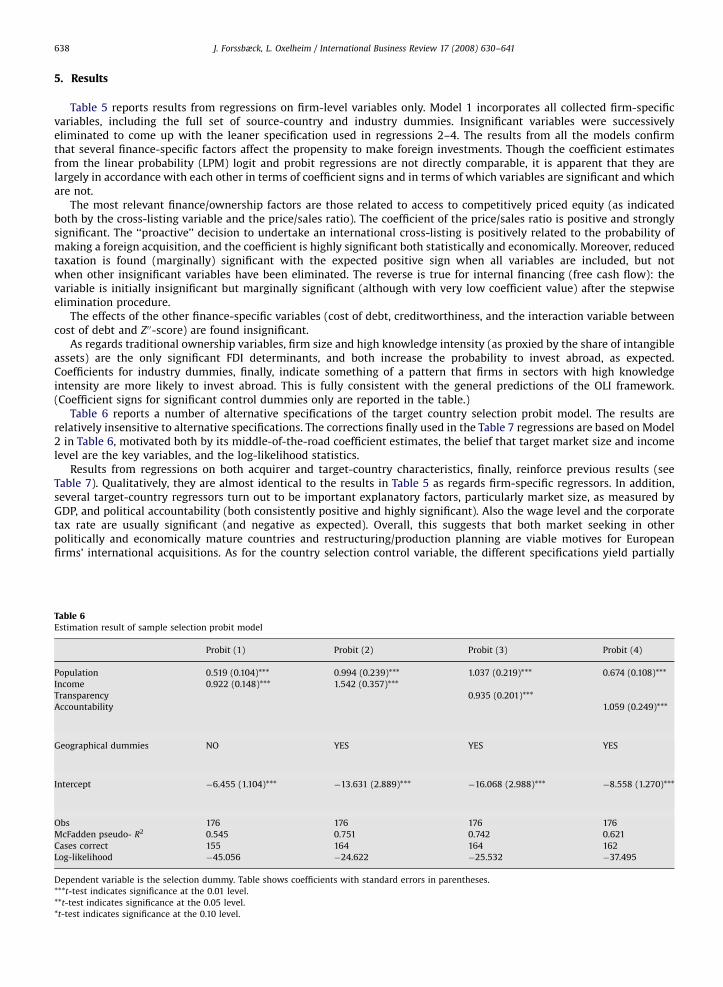
5. Results
Table 5 reports results from regressions on firm-level variables only. Model 1 incorporates all collected firm-specificvariables, including the full set of source-country and industry dummies. Insignificant variables were successivelyeliminated to come up with the leaner specification used in regressions 2–4. The results from all the models confirmthat several finance-specific factors affect the propensity to make foreign investments. Though the coefficient estimatesfrom the linear probability (LPM) logit and probit regressions are not directly comparable, it is apparent that they arelargely in accordance with each other in terms of coefficient signs and in terms of which variables are significant and whichare not.
The most relevant finance/ownership factors are those related to access to competitively priced equity (as indicatedboth by the cross-listing variable and the price/sales ratio). The coefficient of the price/sales ratio is positive and stronglysignificant. The ‘‘proactive’’ decision to undertake an international cross-listing is positively related to the probability ofmaking a foreign acquisition, and the coefficient is highly significant both statistically and economically. Moreover, reducedtaxation is found (marginally) significant with the expected positive sign when all variables are included, but notwhen other insignificant variables have been eliminated. The reverse is true for internal financing (free cash flow): thevariable is initially insignificant but marginally significant (although with very low coefficient value) after the stepwiseelimination procedure.
The effects of the other finance-specific variables (cost of debt, creditworthiness, and the interaction variable betweencost of debt and Z00-score) are found insignificant.
As regards traditional ownership variables, firm size and high knowledge intensity (as proxied by the share of intangibleassets) are the only significant FDI determinants, and both increase the probability to invest abroad, as expected.Coefficients for industry dummies, finally, indicate something of a pattern that firms in sectors with high knowledgeintensity are more likely to invest abroad. This is fully consistent with the general predictions of the OLI framework.(Coefficient signs for significant control dummies only are reported in the table.)
Table 6 reports a number of alternative specifications of the target country selection probit model. The results arerelatively insensitive to alternative specifications. The corrections finally used in the Table 7 regressions are based on Model2 in Table 6, motivated both by its middle-of-the-road coefficient estimates, the belief that target market size and incomelevel are the key variables, and the log-likelihood statistics.
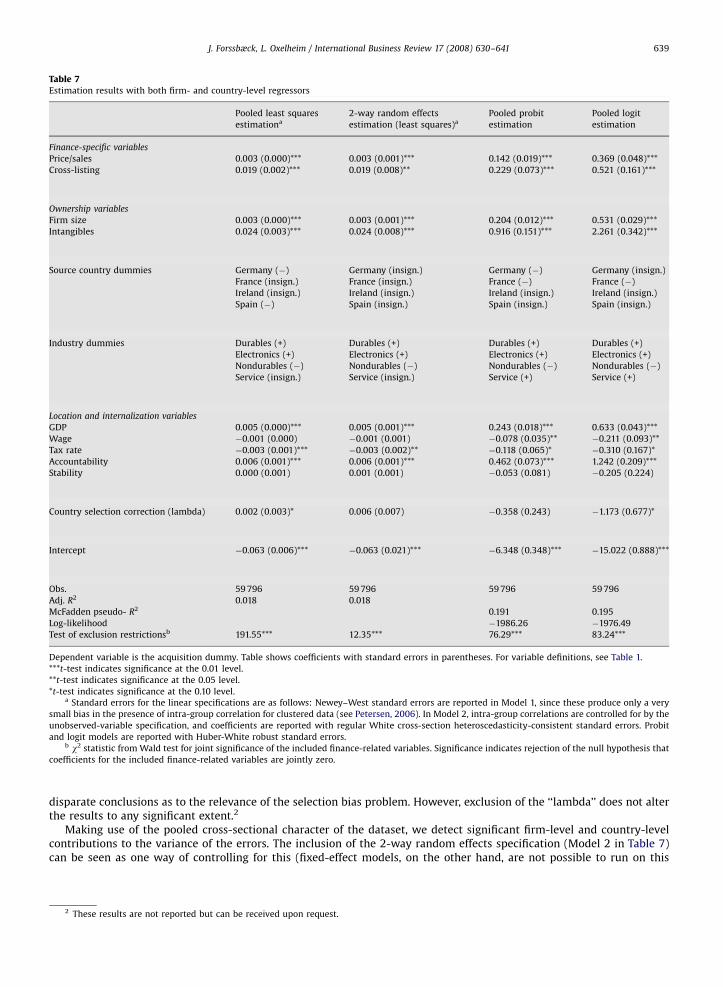
Results from regressions on both acquirer and target-country characteristics, finally, reinforce previous results (seeTable 7). Qualitatively, they are almost identical to the results in Table 5 as regards firm-specific regressors. In addition,several target-country regressors turn out to be important explanatory factors, particularly market size, as measured byGDP, and political accountability (both consistently positive and highly significant). Also the wage level and the corporatetax rate are usually significant (and negative as expected). Overall, this suggests that both market seeking in otherpolitically and economically mature countries and restructuring/production planning are viable motives for Europeanfirms’ international acquisitions. As for the country selection control variable, the different specifications yield partially
Table 6Estimation result of sample selection probit model
Probit (1) Probit (2) Probit (3) Probit (4)
Population 0.519 (0.104)*** 0.994 (0.239)*** 1.037 (0.219)*** 0.674 (0.108)***
Income 0.922 (0.148)*** 1.542 (0.357)***
Transparency 0.935 (0.201)***
Accountability 1.059 (0.249)***
Geographical dummies NO YES YES YES
Intercept �6.455 (1.104)*** �13.631 (2.889)*** �16.068 (2.988)*** �8.558 (1.270)***
Obs 176 176 176 176
McFadden pseudo- R2 0.545 0.751 0.742 0.621
Cases correct 155 164 164 162
Log-likelihood �45.056 �24.622 �25.532 �37.495
Dependent variable is the selection dummy. Table shows coefficients with standard errors in parentheses.
***t-test indicates significance at the 0.01 level.
**t-test indicates significance at the 0.05 level.
*t-test indicates significance at the 0.10 level.
ARTICLE IN PRESS
Table 7Estimation results with both firm- and country-level regressors
Pooled least squares
estimationa
2-way random effects
estimation (least squares)a
Pooled probit
estimation
Pooled logit
estimation
Finance-specific variables
Price/sales 0.003 (0.000)*** 0.003 (0.001)*** 0.142 (0.019)*** 0.369 (0.048)***
Cross-listing 0.019 (0.002)*** 0.019 (0.008)** 0.229 (0.073)*** 0.521 (0.161)***
Ownership variables
Firm size 0.003 (0.000)*** 0.003 (0.001)*** 0.204 (0.012)*** 0.531 (0.029)***
Intangibles 0.024 (0.003)*** 0.024 (0.008)*** 0.916 (0.151)*** 2.261 (0.342)***
Source country dummies Germany (�) Germany (insign.) Germany (�) Germany (insign.)
France (insign.) France (insign.) France (�) France (�)
Ireland (insign.) Ireland (insign.) Ireland (insign.) Ireland (insign.)
Spain (�) Spain (insign.) Spain (insign.) Spain (insign.)
Industry dummies Durables (+) Durables (+) Durables (+) Durables (+)
Electronics (+) Electronics (+) Electronics (+) Electronics (+)
Nondurables (�) Nondurables (�) Nondurables (�) Nondurables (�)
Service (insign.) Service (insign.) Service (+) Service (+)
Location and internalization variables
GDP 0.005 (0.000)*** 0.005 (0.001)*** 0.243 (0.018)*** 0.633 (0.043)***
Wage �0.001 (0.000) �0.001 (0.001) �0.078 (0.035)** �0.211 (0.093)**
Tax rate �0.003 (0.001)*** �0.003 (0.002)** �0.118 (0.065)* �0.310 (0.167)*
Accountability 0.006 (0.001)*** 0.006 (0.001)*** 0.462 (0.073)*** 1.242 (0.209)***
Stability 0.000 (0.001) 0.001 (0.001) �0.053 (0.081) �0.205 (0.224)
Country selection correction (lambda) 0.002 (0.003)* 0.006 (0.007) �0.358 (0.243) �1.173 (0.677)*
Intercept �0.063 (0.006)*** �0.063 (0.021)*** �6.348 (0.348)*** �15.022 (0.888)***
Obs. 59 796 59 796 59 796 59 796
Adj. R2 0.018 0.018
McFadden pseudo- R2 0.191 0.195
Log-likelihood �1986.26 �1976.49
Test of exclusion restrictionsb 191.55*** 12.35*** 76.29*** 83.24***
Dependent variable is the acquisition dummy. Table shows coefficients with standard errors in parentheses. For variable definitions, see Table 1.
***t-test indicates significance at the 0.01 level.
**t-test indicates significance at the 0.05 level.
*t-test indicates significance at the 0.10 level.a Standard errors for the linear specifications are as follows: Newey–West standard errors are reported in Model 1, since these produce only a very
small bias in the presence of intra-group correlation for clustered data (see Petersen, 2006). In Model 2, intra-group correlations are controlled for by the
unobserved-variable specification, and coefficients are reported with regular White cross-section heteroscedasticity-consistent standard errors. Probit
and logit models are reported with Huber-White robust standard errors.b w2 statistic from Wald test for joint significance of the included finance-related variables. Significance indicates rejection of the null hypothesis that
coefficients for the included finance-related variables are jointly zero.
J. Forssbæck, L. Oxelheim / International Business Review 17 (2008) 630–641 639
disparate conclusions as to the relevance of the selection bias problem. However, exclusion of the ‘‘lambda’’ does not alterthe results to any significant extent.2
Making use of the pooled cross-sectional character of the dataset, we detect significant firm-level and country-levelcontributions to the variance of the errors. The inclusion of the 2-way random effects specification (Model 2 in Table 7)can be seen as one way of controlling for this (fixed-effect models, on the other hand, are not possible to run on this
2 These results are not reported but can be received upon request.

ARTICLE IN PRESS
J. Forssbæck, L. Oxelheim / International Business Review 17 (2008) 630–641640
type of data). The qualitative similitude of the results across different specifications and estimation methods seems toindicate the robustness of the results.
Finally, we test whether the inclusion of finance-specific variables makes a significant contribution to the explanatoryvalue of the OLI model. The hypothesis tests indicate a very strong incremental explanatory power of the included financialvariables. Financial factors clearly do matter for the understanding of the decision to undertake a cross-border acquisition.
6. Summary and concluding remarks
In this paper we have empirically tested the hypothesis that firm-level financial characteristics influence the probabilityof undertaking foreign direct investment, and that they make a significant contribution to explaining foreign investmentbehaviour beside more traditional FDI determinants, such as those suggested by the OLI paradigm. We thus argued that afirm is more likely to engage in FDI when it has access to competitively priced equity and debt, when it has cross-listed itsstock in a larger, more liquid equity market, when it enjoys a strong investment grade credit rating, and when it is able tonegotiate reduced taxation and/or to attract subsidies. As far as we are aware, this is the first paper to empirically test firm-level financial characteristics next to a full set of other ownership, location, and internalization determinants of FDI.
Based on binary-response regressions on foreign acquisitions undertaken by European non-financial firms in 2000, wefound strong evidence in favour of this hypothesis. We looked at financial characteristics and measures to improve financialstrength undertaken during up to 60 months prior to the investment. We tested both models with only firm-levelexplanatory variables and models with a combination of firm-specific and target-country-specific regressors, and correctedfor potential selection bias in the sample of target countries. Our results suggest that key financial variables turned out tobe equally important as, or more important than, several more traditional determinants of foreign investment. Specifically,our results show that firms with a lower cost of equity, and firms which have recently cross-listed their equity on a largeand liquid stock exchange, are significantly more likely to make foreign acquisitions. These results are qualitatively robustto alternative model specifications and regression methods.
Our conclusion is that financial characteristics and ‘‘proactive financial strategies’’ make a significant contributiontowards understanding the decision to make a foreign direct investment. As an implication for the OLI framework, ourresults provide strong support for not treating a firm’s financial characteristics merely as a by-product of its competitivestrength but, as argued by Oxelheim et al. (2001) in their conceptual paper, as a distinct set of explanatory variables. Wehave based our tests on the OLI framework, but since we argue that the role of financial strengths is underplayed in all FDItheory our findings should be general in scope.
However, some issues remain for further research. These include testing for alternative definitions of firm financialcharacteristics, possibly with the size of the investment (rather than a dummy variable) as dependent variable. In addition,it is conceivable that a firm’s financial strength is more important for some investment destinations, and less so for others,suggesting possible interaction between firm-level financial variables and target-country variables. Finally, our results holdfor cross-border acquisitions. Since the financing-FDI effect may be different for different types of investment, the influenceof financial factors on entry modes (e.g. greenfield investments) should also be tested.
Acknowledgements
Lars Oxelheim gratefully acknowledges financial support from the Marianne and Marcus Wallenberg Foundation.
References
Agmon, T. (Ed.). (2006). Bringing financial economics into international business research: Taking advantage of a paradigm change (editorial). Journal ofInternational Business Studies, 27(5), 575–578.
Aliber, R. (1970). A theory of foreign direct investment. In C. Kindleberger (Ed.), The international corporation. Cambridge, MA: MIT Press.Altman, E. (2002). Revisiting credit scoring models in a Basel II environment. In M. Ong (Ed.), Credit ratings: Methodologies, rationale and default risk.
London: Risk Books.Blonigen, B. A. (2005). A review of the empirical literature on FDI determinants. Atlantic Economic Journal, 33, 383–403.Cantwell, J., & Narula, R. (2003). International business and the eclectic paradigm. London: Routledge.Dunning, J. H. (1977). Trade, location of economic activity and the MNE: A search for an eclectic approach. In B. Ohlin, P. O. Hesselborn, & P. M. Wijkman
(Eds.), The international allocation of economic activity. London: Macmillan.Dunning, J. H. (1993). Multinational enterprises in the global economy. Wokingham Berks: Addison-Wesley.Foerster, S. R., & Karolyi, G. A. (1999). The effects of market segmentation and investor recognition on asset prices: Evidence from foreign stock listing in
the United States. Journal of Finance, 54(3), 981–1013.Heckman, J. J. (1979). Sample selection bias as a specification error. Econometrica, 47(1), 153–161.Kaufmann, D., Kraay, A., & Mastruzzi, M. (2003). Governance matters III: Governance indicators for 1996–2002. Policy Research Working Paper 3106,
Washington, DC: The World Bank.Kogut, B., & Kulatilaka, N. (1994). Operating flexibility, global manufacturing and the option value of a multinational network. Management Science, 40,
123–139.Miller, D. P. (1999). The market reaction to international cross-listings: Evidence from depository receipts. Journal of Financial Economics, 51, 103–123.Moden, K. M., & Oxelheim, L. (1997). Why issue equity abroad?—Corporate efforts and stock markets responses. Management International Review, 37(3),
223–241.Oxelheim, L., & Ghauri, P. (Eds.). (2004). European union and the race for foreign direct investment in Europe. Oxford: Elsevier.Oxelheim, L., & Randøy, T. (2003). The impact of foreign board membership on firm value. Journal of Banking and Finance, 27(12), 2369–2392.

ARTICLE IN PRESS
J. Forssbæck, L. Oxelheim / International Business Review 17 (2008) 630–641 641
Oxelheim, L., Randøy, T., & Stonehill, A. (2001). On the treatment of finance-specific factors within the OLI paradigm. International Business Review, 10(4),381–398.
Pagano, M., Roell, A., & Zechner, J. (2002). The geography of equity listing: Why do companies list abroad? Journal of Finance, 57(6), 2651–2694.Petersen, M. A. (2006). Estimating standard errors in panel data sets: Comparing approaches. Working Paper No. 329, Kellogg Finance Department.PricewaterhouseCoopers. (2000). Corporate taxes: Worldwide summaries 1999–2000. Hoboken, NJ: Wiley.Smart, S. B., & Zutter, C. J. (2003). Control as a motivation for underpricing: A comparison of dual and single-class IPOs. Journal of Financial Economics, 69,
85–110.Sundaram, A. K., & Logue, D. E. (1996). Valuation effects of foreign company listings on US exchanges. Journal of International Business Studies, 27(1), 66–88.Tolmunen, P., & Torstila, S. (2005). Cross-listings and M&A activity: Transatlantic evidence. Financial Management, 34(1), 123–142.Wooldridge, J. M. (2002). Econometric analysis of cross section and panel data. Cambridge, MA: MIT Press.