Embed Size (px)
Citation preview

National Economic Impacts from TechLink-Brokered Partnerships between the Department of Defense and U.S. Industry, 2000-2014
December 2015
TechLink Business Research Division, Leeds School of Business2310 University Way, Bldg. 2-2 University of Colorado BoulderBozeman, Montana 59715 Boulder, Colorado 80309
Table of Contents
EXECUTIVE SUMMARY ...................................................................................................................................... 1
PURPOSE OF STUDY .......................................................................................................................................... 2
TECHLINK OVERVIEW ........................................................................................................................................ 2
RESEARCH TEAM ............................................................................................................................................... 2
METHODOLOGY .................................................................................................................................................. 3
RESULTS REPORTED BY COMPANIES ............................................................................................................ 6
ECONOMIC-IMPACT ANALYSIS ........................................................................................................................ 9
SUMMARY ........................................................................................................................................................ 11
TechLink 2015 Economic Impact Study
TechLink
National Economic Impacts from TechLink-Brokered Partnershipsbetween the Department of Defense and U.S. Industry, 2000-2014
EXECUTIVE SUMMARY This study quantifies TechLink’s overall contribution to the nation’s economy and defense mission. It examines the economic outcomes and impacts from all technology partnership agreements that TechLink brokered or facilitated for the Department of Defense from calendar year 2000, its first full year of operation, through 2014. These partnerships include license agreements, cooperative research and development agreements (CRADAs), and Small Business Innovation Research (SBIR) contracts. The research team contacted a total of 524 companies and asked them about the outcomes of the 807 different technology partnership agreements that TechLink helped establish during the 2000-‐2014 period. Companies were asked to divulge the total sales of new products and services directly related to their technology partnership agreements. They were also asked about their related sales to the U.S. military, follow-‐on R&D contracts, licensing or sublicensing revenue, and sales by licensees or sublicensees and spin-‐out companies. The response rate was very high—approximately 96 percent. The research team was able to obtain conclusive information on the outcomes of 774 of the 807 total agreements established by TechLink. Well over half of the technology partnership agreements—57 percent—successfully resulted in sales of new products and services or other revenues. Companies reported the following direct economic outcomes from the technology partnerships that TechLink established:
• $1.6 billion in total sales of new products and services, including $705 million in military product sales • $236 million in outside investment from venture capital, angel, and other private-‐sector funding sources • 14 companies acquired by larger corporations primarily because of the technology resulting from the TechLink-‐facilitated agreement • 19 technologies licensed to other companies for commercialization • 18 new spin-‐out companies created to commercialize the technology resulting from the TechLink-‐brokered partnerships.
The research team used IMPLAN economic-‐impact assessment software to estimate the total economic impacts related to the $1.6 billion in total sales of new products or services or other revenues. Results included:
• $4.4 billion in total economic output nationwide • $2.2 billion in value added, representing new wealth creation in the economy • $1.5 billion in labor income • 1,578 new full-‐time jobs per year, with an average wage of $62,466 • $476 million in tax revenues (federal, state, and local).
TechLink
National Economic Impacts from TechLink-Brokered Partnershipsbetween the Department of Defense and U.S. Industry, 2000-2014
PURPOSE OF STUDY This study was undertaken to quantify TechLink’s overall contribution to the national economy and U.S. defense mission. It examines the economic outcomes and impacts from all technology partnership agreements that TechLink brokered or facilitated between the Department of Defense (DoD) and U.S. industry from calendar year 2000 through 2014. Researchers first conducted a survey to determine the total sales of new products and services resulting from the technology partnerships that TechLink established, then used IMPLAN economic impact assessment software to estimate the overall economic output, value added, employment, labor income, and tax revenues generated by the total sales.1 TECHLINK OVERVIEW TechLink is a federally funded technology transfer center located at Montana State University. Since 1999, TechLink has served as DoD’s primary national “partnership intermediary,” helping to develop technology partnership agreements between DoD laboratories and U.S. industry nationwide.2
TechLink’s primary focus is helping DoD labs to transfer their inventions to U.S. companies. TechLink currently brokers or facilitates approximately 60 percent of all DoD’s license agreements with industry. These license agreements enable companies to develop, manufacture, and sell new products and services using DoD inventions. In addition, TechLink helps to establish cooperative research and development agreements (CRADAs) between DoD labs and companies for joint development of new technology. Finally, TechLink helps companies secure competitive research and development (R&D) contracts from DoD to develop new technologies that have both military and commercial applications. These R&D contracts are primarily through the DoD Small Business Innovation Research (SBIR) Program and Broad Agency Announcements (BAAs). TechLink-‐facilitated partnerships for DoD are almost exclusively with small companies that are not traditional defense contractors. These partnerships have resulted in substantial new economic activity, jobs, and transition of innovative technology to the U.S. military. This study estimates these economic impacts as well as the extent of transition of new technology from DoD labs to DoD operational use via licensing to industry for manufacture and DoD acquisition. RESEARCH TEAM This economic-‐impact study was conducted by TechLink in collaboration with the Business Research Division (BRD) of the Leeds School of Business at the University of Colorado Boulder. The BRD has been analyzing local, state, and national economies for more than 95 years and specializes in economic-‐impact studies and customized research projects that help companies, associations, nonprofits, and government agencies make informed business and policy decisions.3
1 This study is an update of previous studies, conducted in 2009 and 2012, of the economic impacts of TechLink agreements. 2 For more information, see www.techlinkcenter.org 3 For more information, see www.colorado.edu/leeds/centers/business-‐research-‐division
TechLink
National Economic Impacts from TechLink-Brokered Partnershipsbetween the Department of Defense and U.S. Industry, 2000-2014
The principal authors of the study are Dr. Will Swearingen of TechLink and Mr. Brian Lewandowski of the BRD. Key members of the research and evaluation team included Mr. Chris Huvaere, Mr. Phillip Luebke, Mr. Andrew Schoneberg, and Mr. Kirkwood Donavin of TechLink, and Dr. Richard Wobbekind of BRD. METHODOLOGY This study was undertaken in three major phases:
(1) During the Data Gathering phase, the research team contacted all companies with agreements that TechLink had brokered or helped establish during the FY 2000-‐2014 time frame. Companies were asked to divulge the total sales of new products and services and other economic results directly related to these agreements. This phase lasted for five months and ran from January through May 2015.
(2) During the Data Analysis phase, the evaluation team analyzed the information gathered and used IMPLAN economic-‐impact assessment software to estimate the economic multipliers and total economic impacts resulting from the sales of new products and services derived from the DoD agreements. This second phase took five months and extended from May through September 2015.
(3) During the final quarter of 2015, the authors prepared the Final Report. Specific activities undertaken during the first two phases are described below.
Data Gathering In January 2015, TechLink initiated this study of the economic outcomes and impacts resulting from its DoD-‐funded technology partnership activities. The period covered by this study was 2000-‐2014, which was effectively the period that TechLink had been assisting DoD with technology transfer at the time of the study. During the first phase, from January through May 2015, two TechLink market research specialists gathered economic data from the companies involved in the study. These researchers contacted all of the companies that TechLink had assisted in establishing a technology partnership agreement with the DoD. A total of 524 companies were contacted by email and telephone about the outcomes of their 807 different technology partnership agreements with the DoD.4 Companies were asked a series of questions that focused on the economic outcomes related to their agreements with the DoD. Companies were informed that their responses would be treated as confidential information and that these responses would be aggregated with the responses of other companies, without company names, before submission to the DoD. Questions asked included the following:
4 Many companies—a total of 154, or 31 percent—had two or more TechLink-‐facilitated agreements with DoD. The median number of agreements for these companies with multiple agreements was 2, although the mean was 3 because of skewing by a few companies with as many as 17 agreements.
TechLink
National Economic Impacts from TechLink-Brokered Partnershipsbetween the Department of Defense and U.S. Industry, 2000-2014
(1) Did your company develop any new products or services based on the technology partnership agreement, including improvements to existing products or services? (2) What were the total cumulative sales of new or improved products or services related to this technology partnership agreement? (3) Of the total sales, what was the dollar value of sales to the U.S. military, either directly or through a prime contractor? (4) In addition to sales of products and services, did the agreement lead to any follow-‐on R&D contracts for further development of the technology? If so, what was the dollar value of those contracts?5 (5) Did you license the technology associated with the agreement to other companies? If so, please estimate the total royalties received from the licensees. What are the names of the licensees, so we can follow up to ask them about their sales? (6) Did you create a start-‐up or spin-‐out company to commercialize the technology? If so, what is the name of the company, so we can follow up to ask them about their sales? (7) Did you receive any significant subsequent investment funding, such as venture capital or angel funding, related to the technology being developed or commercialized?
The company response rate was extremely high—96 percent. The research team was able to obtain definitive information on the outcomes of 774 of the 807 technology partnership agreements. In the case of 12 of the 33 agreements for which no information was available, the 9 associated companies had ceased to exist as corporate entities. They had gone out of business, changed their names, or been acquired by other companies and had left no trails that could be followed. For the remaining 15 companies with 21 agreements, the associated companies either openly refused to participate in the study or were passively non-‐cooperative. In several cases involving non-‐responding companies, the TechLink team was able to get at least partial sales information through Internet searches of the public record. This sales information involved contracts from the U.S. government, usually the Department of Defense. Government web sites consulted included: (1) USAspending.gov, the website of the Office of Management and Budget (OMB), which provides searchable information on all federal contracts awarded (www.usaspending.gov); (2) DIBBS, the Defense Logistics Agency (DLA) Internet Bid Board System, which provides information on all DLA awards to industry (https://www.dibbs.bsm.dla.mil); and (3) the Federal Procurement Data System, a central repository of information on government-‐wide contracts maintained by the General Service Administration (https://www.fpds.gov). TechLink assigned each company with sales results to the appropriate 6-‐digit North American Industry Classification System (NAICS) code or codes specific to that company or commercial outcome. This was an essential step for analysis of the overall economic impacts. NAICS codes are one of the most important inputs to the economic-‐impact model, IMPLAN (described below), because they are used to accurately determine the economic multipliers specific to the particular industrial activity. NAICS is the U.S. federal government’s standard industry classification system. It is a comprehensive production-‐oriented system that groups companies and divisions of companies into industries based on the
5 Contracts for further development of a technology were treated as sales of R&D services and were included in the total sales.
TechLink
National Economic Impacts from TechLink-Brokered Partnershipsbetween the Department of Defense and U.S. Industry, 2000-2014
activities in which they are primarily engaged. NAICS recognizes 1,065 different industries in the United States and assigns a unique code to each industry. To identify the appropriate NAICS codes, multiple sources were referenced, including (1) Hoover’s, www.hoovers.com, (2) the LexisNexis Academic web site, www.lexisnexis.com, (3) a commercial NAICS-‐related website, www.naics.com, that provides a convenient system for looking up NAICS codes by industry sectors and subsectors, and (4) the federal System for Award Management, www.sam.gov, which contains NAICS codes self-‐identified by the companies. For businesses not listed on these sites, the classification tree at the official U.S. government’s NAICS code website, http://www.census.gov/eos/www/naics/, was compared to activity reported by the companies in their interviews with the TechLink team to arrive at the appropriate NAICS codes. TechLink subsequently submitted a final dataset of economic results from its technology partnership agreements to the Business Research Division at the Leeds School of Business, University of Colorado Boulder. The dataset included—for each agreement that had achieved sales—a code number to identify the agreement and conceal the company’s name, the 6-‐digit NAICS code for the corresponding product or service, and the total sales figures. Data Analysis The BRD employed a widely used economic-‐impact analysis software program, IMPLAN, to estimate the economic contribution effects of the total sales resulting from the TechLink-‐brokered agreements. More than 1,500 entities in academia, the private sector, and government use IMPLAN to model economic impacts. It is employed to determine economic impacts on regions ranging in size from zip code area to county, state, and nation (www.implan.com). IMPLAN draws on a mathematical input-‐output framework originally developed by Wassily Leontief, the 1973 Nobel laureate in economics, to study the flow of money through a regional economy. IMPLAN assumes fixed relationships between producers and their suppliers, based on demand, and that inter-‐industry relationships within a given region’s economy largely determine how that economy responds to change. Increases in demand for a certain product or service causes a multiplier effect—a cascade of ripples through the economy. This increased demand affects the producer of the product, the producer’s employees, the producer’s suppliers, the supplier’s employees, and others, ultimately generating a total impact on the economy that significantly exceeds the initial change in demand. For example, Company X licenses a patented laser invention from the Air Force Research Laboratory. It then develops an improved barcode scanner using this technology, which it manufactures and sells nationwide. This requires Company X to hire factory workers, who spend their payroll checks on groceries and other goods. In addition, Company X has to purchase components and raw materials from other companies, employing workers who purchase groceries and other goods, and so on. In this example, direct effects are the sales of the new barcode scanner based on the Air Force technology. Indirect effects are the inter-‐industry purchases of components and raw materials needed to manufacture the barcode scanner. Induced effects are the household expenditures as workers spend their payroll checks on goods and services across a wide spectrum of the economy. Economic impacts are the sum of direct effects, indirect effects, and induced effects.
TechLink
National Economic Impacts from TechLink-Brokered Partnershipsbetween the Department of Defense and U.S. Industry, 2000-2014
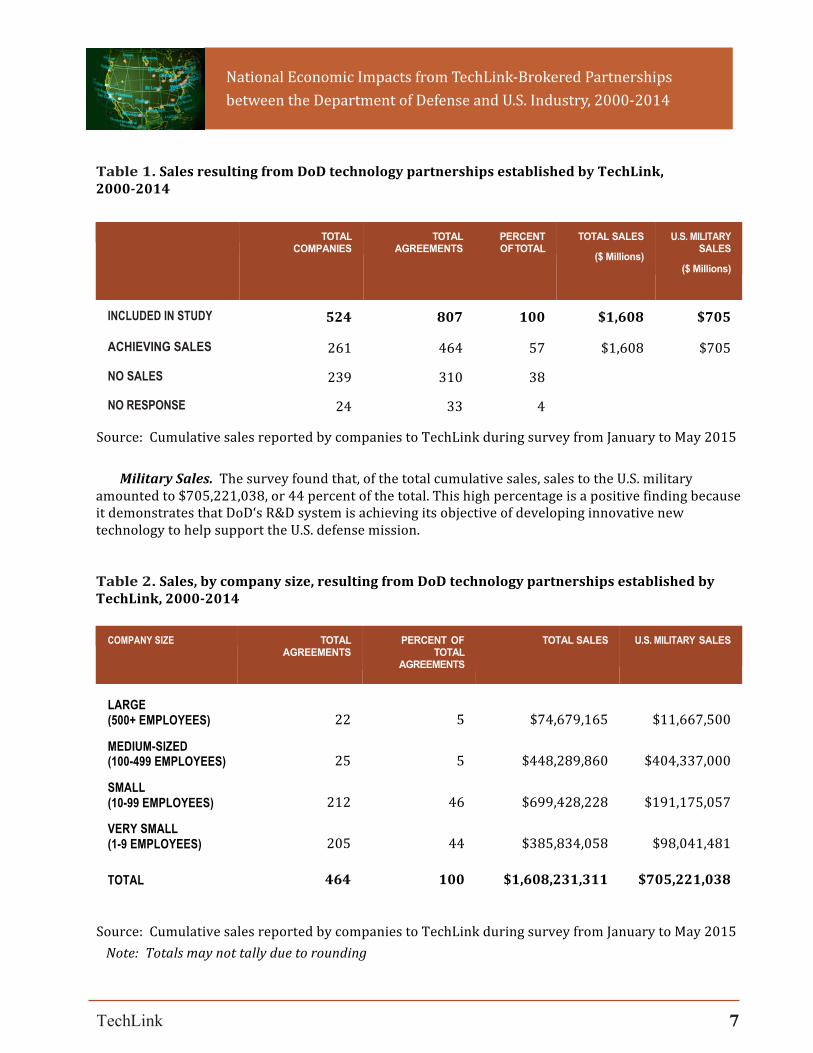
Multipliers are ratios of the overall economic impacts to the initial changes and are typically derived from the following equation: (direct effect + indirect effect + induced effect) / direct effect. Multipliers are very specific to industry sectors and regions. IMPLAN uses NAICS codes to distinguish between 536 industry sectors recognized by the U.S. Department of Commerce. Each sector has a unique output multiplier because it has a different pattern of purchases from firms inside and outside of the regional economy. Each year, IMPLAN is updated using data collected by various federal government agencies. In this study, the BRD converted the NAICS codes provided by TechLink to the 536-‐sector IMPLAN input-‐output model, then applied this model to the total sales figures reported by the companies surveyed. As previously indicated, these sales figures represented all sales of products and services and other revenues generated during the 2000-‐2014 period that were directly attributable to the technology partnership agreements that TechLink brokered or facilitated between DoD and U.S. industry. Using IMPLAN, BRD was able to estimate the sum of the direct, indirect, and induced effects of these sales. The overall purpose of this modeling exercise was to estimate the total economic contribution of these sales to the nation’s economy, including total economic output, value added, employment, labor income, and tax revenues. Data presented are for the year 2014 accounting period and expressed in 2014 dollars. The large majority of the company sales occurred prior to 2014 and some date back to the early 2000s. However, most of these sales are ongoing and there was a need to standardize the year. Use of 2014 as the reference year represents a conservative approach because it does not consider the relatively higher value of the earlier sales figures due to inflation (e.g., a dollar in 2014 was worth 27.3 percent less than a dollar in 2000.) RESULTS REPORTED BY COMPANIES Sales from Agreements The companies contacted reported that 464 (57 percent) of the 807 technology partnership agreements included in the study had successfully resulted in commercialization, generating sales of products or services or other revenues (see Table 1). Total cumulative sales and revenues reported were slightly over $1.6 billion, or $1,608,231,311. The “total sales” category in Table 1 encompasses not only the cumulative sales of all new products and services directly related to the technologies associated with the TechLink agreements (including military sales) but also follow-‐on R&D contracts to further develop these technologies for specific applications, which were defined as sales of R&D services; royalties from licensees of the technologies developed; licensee sales of the licensed technologies, when this information could be obtained; and sales by spin-‐out or start-‐up companies, when this information was available. Companies reported that 310 (38 percent) had not generated sales or other revenues. This category included newer agreements involving technologies that companies were actively working to commercialize as well as agreements that, for many different reasons, had not resulted in commercialization and had been abandoned. A small number of agreements, 33 (4 percent), involved companies from which the research team was unable to obtain information—either because the involved companies were unwilling to participate (21 agreements) or because they were uncontactable (12 agreements).
TechLink
National Economic Impacts from TechLink-Brokered Partnershipsbetween the Department of Defense and U.S. Industry, 2000-2014
Table 1. Sales resulting from DoD technology partnerships established by TechLink, 2000-‐2014
TOTAL COMPANIES
TOTAL AGREEMENTS
PERCENT OF TOTAL
TOTAL SALES
($ Millions)
U.S. MILITARY SALES
($ Millions)
INCLUDED IN STUDY 524 807 100 $1,608 $705
ACHIEVING SALES 261 464 57 $1,608 $705
NO SALES 239 310 38
NO RESPONSE 24 33 4
Source: Cumulative sales reported by companies to TechLink during survey from January to May 2015
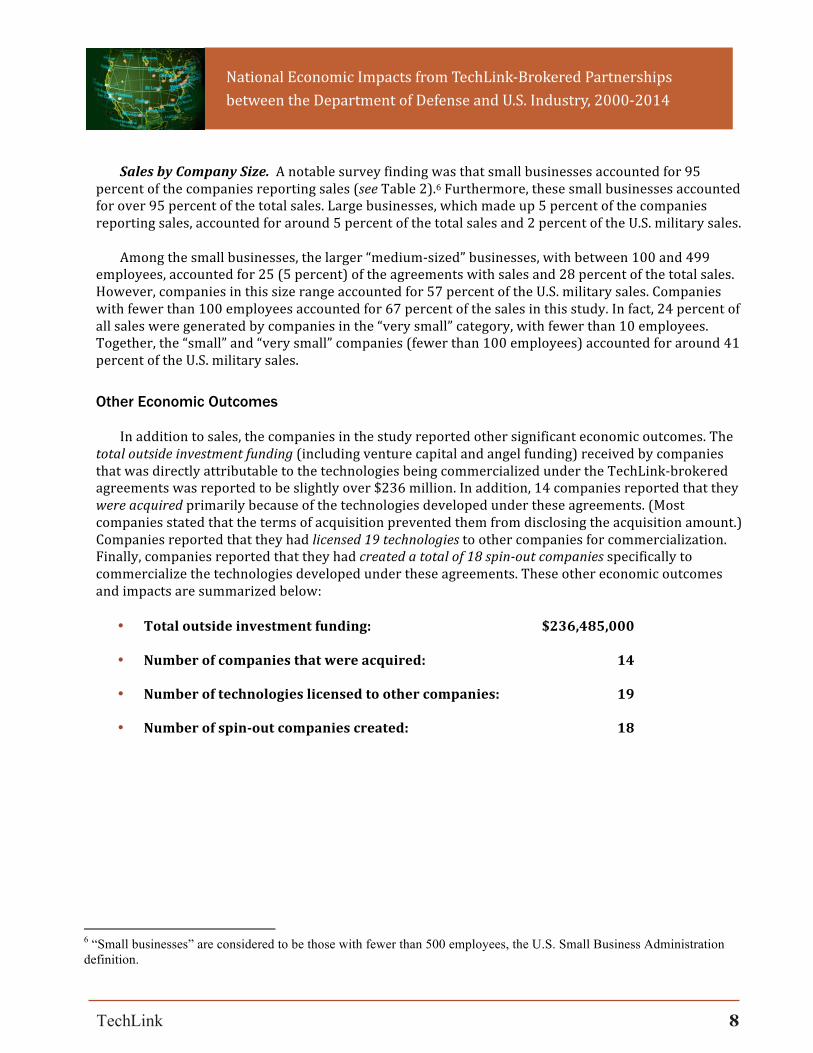
Military Sales. The survey found that, of the total cumulative sales, sales to the U.S. military amounted to $705,221,038, or 44 percent of the total. This high percentage is a positive finding because it demonstrates that DoD‘s R&D system is achieving its objective of developing innovative new technology to help support the U.S. defense mission. Table 2. Sales, by company size, resulting from DoD technology partnerships established by TechLink, 2000-‐2014
COMPANY SIZE TOTAL AGREEMENTS
PERCENT OF TOTAL
AGREEMENTS
TOTAL SALES
U.S. MILITARY SALES
LARGE (500+ EMPLOYEES) 22 5 $74,679,165 $11,667,500
MEDIUM-SIZED (100-499 EMPLOYEES) 25 5 $448,289,860 $404,337,000
SMALL (10-99 EMPLOYEES) 212 46 $699,428,228 $191,175,057
VERY SMALL (1-9 EMPLOYEES) 205 44 $385,834,058 $98,041,481
TOTAL 464 100 $1,608,231,311 $705,221,038
Source: Cumulative sales reported by companies to TechLink during survey from January to May 2015 Note: Totals may not tally due to rounding
TechLink
National Economic Impacts from TechLink-Brokered Partnershipsbetween the Department of Defense and U.S. Industry, 2000-2014
Sales by Company Size. A notable survey finding was that small businesses accounted for 95 percent of the companies reporting sales (see Table 2).6 Furthermore, these small businesses accounted for over 95 percent of the total sales. Large businesses, which made up 5 percent of the companies reporting sales, accounted for around 5 percent of the total sales and 2 percent of the U.S. military sales. Among the small businesses, the larger “medium-‐sized” businesses, with between 100 and 499 employees, accounted for 25 (5 percent) of the agreements with sales and 28 percent of the total sales. However, companies in this size range accounted for 57 percent of the U.S. military sales. Companies with fewer than 100 employees accounted for 67 percent of the sales in this study. In fact, 24 percent of all sales were generated by companies in the “very small” category, with fewer than 10 employees. Together, the “small” and “very small” companies (fewer than 100 employees) accounted for around 41 percent of the U.S. military sales.
Other Economic Outcomes In addition to sales, the companies in the study reported other significant economic outcomes. The total outside investment funding (including venture capital and angel funding) received by companies that was directly attributable to the technologies being commercialized under the TechLink-‐brokered agreements was reported to be slightly over $236 million. In addition, 14 companies reported that they were acquired primarily because of the technologies developed under these agreements. (Most companies stated that the terms of acquisition prevented them from disclosing the acquisition amount.) Companies reported that they had licensed 19 technologies to other companies for commercialization. Finally, companies reported that they had created a total of 18 spin-‐out companies specifically to commercialize the technologies developed under these agreements. These other economic outcomes and impacts are summarized below:
• Total outside investment funding: $236,485,000
• Number of companies that were acquired: 14
• Number of technologies licensed to other companies: 19
• Number of spin-‐out companies created: 18
6 “Small businesses” are considered to be those with fewer than 500 employees, the U.S. Small Business Administration definition.
TechLink
National Economic Impacts from TechLink-Brokered Partnershipsbetween the Department of Defense and U.S. Industry, 2000-2014
ECONOMIC-IMPACT ANALYSIS Upon receiving the company data from TechLink, the BRD at the University of Colorado employed IMPLAN to determine the economic contribution effects of the total sales figures. Results below are presented for output, value added, employment, and labor income, and tax revenues. As previously noted, all dollar figures are reported in 2014 dollars. Output Output is the total value of purchases by intermediate and final consumers and can be thought of as sales, plus or minus inventory adjustments. According to the national IMPLAN model, the $1.608 billion (2014 $) in sales of new products or services or other revenues reported by companies generated an additional $2.775 billion in sales economy-‐wide. Of this $2.775 billion, $1.365 billion was generated indirectly as the result of inter-‐industry purchases (basically firms purchasing from each other), and $1.411 billion was generated from the induced effect, or the result of households spending payroll on goods and services economy-‐wide (see Table 3). The larger induced effect was mainly due to the relatively high-‐paying jobs associated with high-‐tech and technology-‐based industries, which accounted for the majority of the companies involved. The total economy-‐wide output (the sum of direct, indirect, and induced sales) was $4.383 billion. Dividing total economy-‐wide output ($4.383 billion) by the direct output of companies selling products or services related to their technology partnership agreements with DoD ($1.608 billion) yielded an output multiplier of 2.73. That is, for every dollar in sales directly attributable to the DoD technology partnerships, an additional $1.73 in sales was generated economy-‐wide. Value Added Value added is the difference between an industry’s or company’s output and the cost of intermediate inputs. Expressed differently, it is the difference between a product’s sale price and its production cost. This measure recognizes that companies buy goods and services from other companies and remanufacture these goods and services to create products of greater value than the sum of the goods and services used to make these products. This increase in value resulting from the production process is the “value added.” As estimated by IMPLAN, value added is equal to the total sales (plus or minus inventory adjustments) minus the cost of the goods and services purchased to produce the products sold. The main difference between output and value added is that output includes the value of intermediate goods and services, while value added does not. Many economists prefer value added as an economic measure because, at the macroeconomic scale, output multiple-‐counts the value of inputs. For example, in the previously cited case of Company X, which sells an improved barcode scanner based on an Air Force laser invention: Company X purchases laser rods, electronic components, optical components, and various raw materials to make the barcode scanner. The value of Company X’s sales incorporates the value of these laser rods and other inputs. Further, each of the companies from which Company X purchases its inputs incorporates the value of their respective inputs from other companies. By combining and aggregating the values of intermediate and final products, output overstates the size of the US economy by a factor of roughly 2. For this reason, Gross Domestic Product (GDP), a measure of
TechLink
National Economic Impacts from TechLink-Brokered Partnershipsbetween the Department of Defense and U.S. Industry, 2000-2014
value added, is used to track the size of the U.S. economy because it is a non-‐duplicative aggregation of production across all industries in the United States. In the current study, value added measures the real contribution that each of the DoD technology partners made to the national economy as a result of their agreements with DoD. According to the national IMPLAN model, the $1.608 billion (2014 $) in sales reported by companies generated an additional $2.223 billion in value added economy-‐wide. Of this total, $745.3 million was generated directly, $698.4 million was generated indirectly, and $778.9 million was generated from the induced effect (see Table 3). Employment According to the national IMPLAN model, approximately 8,271 jobs were directly sustained economy-‐wide by the $1.608 billion in sales. Indirectly, 6,555 jobs were added to the economy, and an additional 8,850 jobs were generated via the induced effects of household spending (see Table 3). Altogether, 23,677 jobs nationwide are estimated to have resulted from the direct, indirect, and induced effects of the TechLink-‐facilitated agreements between DoD labs and companies during the 2000-‐2014 period. This means that, on average, the TechLink-‐brokered agreements generated approximately 1,578 jobs per year. Using the same procedure outlined above to derive the multiplier, an employment multiplier of 2.86 was calculated. That is, for every job directly attributable to the DoD technology partnerships, an additional 1.86 jobs were created economy-‐wide. Labor Income Labor income consists of employee compensation (wage and salary payments, including benefits), paid to workers as well as proprietary income (income received by self-‐employed individuals). The national IMPLAN model estimated that labor income directly associated with the $1.608 billion in sales was $614 million in 2014, or approximately $74,235 per job (see Table 3). This was substantially above the average U.S. wage in 2014 of $47,230. The indirect labor income was estimated at $422.3 million, or approximately $64,424 per job. The induced labor income was estimated to be $442.7 million, or $50,023 per job. Average wages for the indirect and induced jobs were substantially lower than the average wage for the jobs directly created or retained because many of these jobs were in lower-‐paid manufacturing and service sectors. Together, the indirect and induced labor income amounted to $865 million. The total economy-‐wide labor income resulting from the DoD technology partnership agreements brokered by TechLink was $1.479 billion (2014 $). The average wage of the 23,677 jobs created or retained as a result of the DoD technology partnerships was $62,466, approximately 32 percent higher than the average U.S. wage of $47,230 in 2014. The labor income multiplier was 2.41, indicating that for every dollar in wage and salary income attributable to DoD technology partnership agreements, an additional $1.41 was generated nationally in employee compensation and proprietary income.
TechLink
National Economic Impacts from TechLink-Brokered Partnershipsbetween the Department of Defense and U.S. Industry, 2000-2014
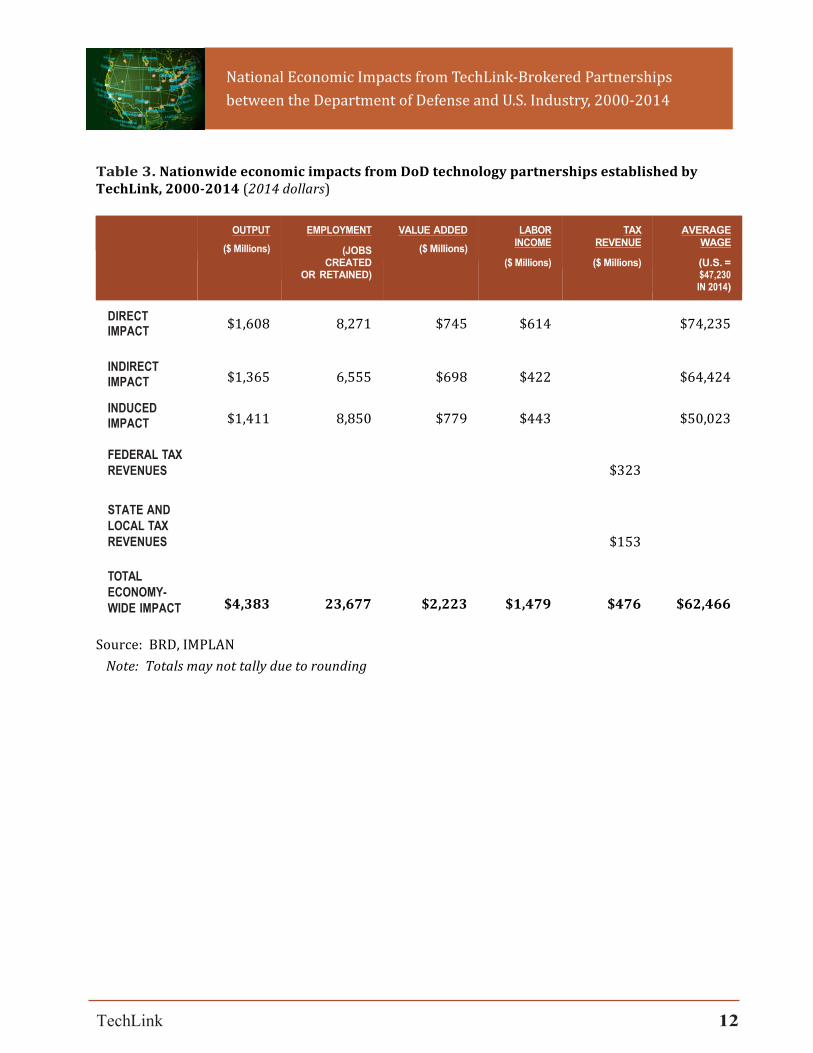
Tax Revenues Tax revenues were estimated for the $1.608 billion in sales and their economy-‐wide indirect and induced effects. These tax revenues included social insurance taxes (paid by employers, employees, and the self-‐employed), personal income taxes, motor vehicle licenses, property taxes, corporate profits taxes and dividends, and indirect business taxes (comprised mainly of excise and property taxes, fees, licenses, and sales taxes). Total taxes collected by federal, state, and local government entities were estimated at $476 million (see Table 3). This included $323 million in total federal tax revenues ($121 million in direct federal taxes), and $153 million in total state and local tax revenues ($31 million in direct state and local taxes). In sum, for every dollar of sales related to the technology partnerships brokered by TechLink, an additional $0.30 was generated in federal, state, and local tax revenue. SUMMARY In summary, the purpose of this study was to quantify TechLink’s overall contribution to the nation’s economy and defense mission from establishing technology partnerships between DoD and U.S. industry. The period covered by the study was calendar year 2000 through 2014. The study team conducted a survey to determine the total sales of new products and services and other economic results from the technology partnership agreements established by TechLink. Companies in the study collectively reported over $1.6 billion in sales (2014 dollars) directly related to the TechLink-‐established agreements. The team applied IMPLAN economic-‐impact assessment software to estimate the economic ripple effects of these sales nationwide. Specific objectives were to estimate the gross changes in economic output, value added, employment, labor income, and tax revenues related to these total sales. The total economy-‐wide contribution combines the direct, indirect, and induced impacts. Total economy-‐wide sales, as measured by output, are estimated at $4.383 billion. Value added is estimated at $2.223 billion, representing new wealth creation in the economy. Employment impacts include 23,677 jobs with an average wage of $62,466, approximately 32 percent higher than the average U.S. wage in 2014. Labor income in 2014 dollars is estimated at $1.479 billion. The $1.6 billion in sales and its economy-‐wide effects generated (in 2014 $) approximately $476 million in total tax revenues, including $323 million in federal tax revenues and $153 million in state and local tax revenues. Table 3 summarizes the total economic contribution of the technology partnership agreements established by TechLink between the DoD and U.S. industry.
TechLink
National Economic Impacts from TechLink-Brokered Partnershipsbetween the Department of Defense and U.S. Industry, 2000-2014
Table 3. Nationwide economic impacts from DoD technology partnerships established by TechLink, 2000-‐2014 (2014 dollars)
OUTPUT ($ Millions)
EMPLOYMENT
(JOBS CREATED
OR RETAINED)
VALUE ADDED ($ Millions)
LABOR INCOME
($ Millions)
TAX REVENUE
($ Millions)
AVERAGE WAGE
(U.S. = $47,230 IN 2014)
DIRECT IMPACT $1,608 8,271 $745 $614 $74,235
INDIRECT IMPACT $1,365 6,555 $698 $422 $64,424
INDUCED IMPACT $1,411 8,850 $779 $443 $50,023
FEDERAL TAX REVENUES $323
STATE AND LOCAL TAX REVENUES $153
TOTAL ECONOMY- WIDE IMPACT $4,383 23,677 $2,223 $1,479 $476 $62,466
Source: BRD, IMPLAN Note: Totals may not tally due to rounding