Embed Size (px)
Citation preview

FINAL REPORT
OPRE REPORT #: 2011-35
NOVEMBER 2011

BUILDING NON-PROFIT CAPACITY AND COMMUNITY PARTNERSHIPS: FINDINGS FROM THE COMMUNITIES EMPOWERING YOUTH (CEY) EVALUATION FINAL REPORT
OPRE Report 2011-35
November 2011 Submitted to: Nancye Campbell, Project Officer Office of Planning, Research and Evaluation Administration for Children and Families U.S. Department of Health and Human Services Submitted by: Kim Francis, Amy Minzner, Lianne Fisman, and Lindsay Fox, Abt Associates Barbara Fink, Branch Associates Contract Number: HHS P233200800067G
Project Director: Amy Minzner Abt Associates 55 Wheeler Street Cambridge, MA, 02138
This report is in the public domain. Permission to reproduce is not necessary. Suggested citation: Francis, Kim, et al. (2011). Building Non-Profit Capacity and Community Partnerships: Findings from the Communities Empowering Youth (CEY) Evaluation – Final Report, OPRE Report # 2011-35, Washington, DC: Office of Planning, Research and Evaluation, Administration for Children and Families, U.S. Department of Health and Human Services.
Disclaimer The views expressed in this publication do not necessarily reflect the views or policies of the Office of Planning, Research and Evaluation, the Administration for Children and Families, or the U.S. Department of Health and Human Services. This report and other reports sponsored by the Office of Planning, Research and Evaluation are available at http://www.acf.hhs.gov/programs/opre/index.html. A restricted use dataset, including all data used to complete this report, will be available through the Interuniversity Consortium for Political and Social Research (ICPSR) sometime in 2012.

Abt Associates Inc. pg. i
Abstract
In 2006, the Administration for Children and Families (ACF) at the Department of Health and Human Services established the Communities Empowering Youth (CEY) program within the Compassion Capital Fund. CEY’s intent was to address the capacity building needs of partnerships of nonprofit organizations (NPOs) that were tackling issues of gang violence, youth violence, or child abuse and neglect. The CEY evaluation results indicate that organizations participating in CEY achieved or improved several specific capacity indicators in many of the capacity domains. Partner organizations reported some statistically significant increases in all four capacity domains, and lead organizations reported some increases in three domains. In terms of partnership capacity, most lead organizations and their partners reported relatively high levels of partnership capacity at baseline, with little change over time. They also reported that their CEY partnerships were not likely to continue to function beyond the grant period. Despite limited partnership capacity increases, nearly all of the organizations’ staff interviewed as part of the case study stated that participating in the CEY partnership helped them build valuable networks and connections with other service providers in their communities. The ―capital‖ contained within these networks has the potential to improve services to youth in the CEY communities through an increase in joint services and referrals across this web of service providers.

Abt Associates Inc. pg. ii
Table of Contents
Executive Summary ............................................................................................................................. 1
Chapter 1: Introduction ....................................................................................................................... 1
Background .................................................................................................................................. 1
The Evaluation ............................................................................................................................. 2
Methods........................................................................................................................................ 3
Capacity Outcome Measures ....................................................................................................... 6
Chapter 2: Changes in Organizational Capacity ............................................................................... 8
Partner Organizations ................................................................................................................... 9
Lead Organizations .................................................................................................................... 16
Findings for Subgroup Analysis ................................................................................................ 20
Chapter 3: CEY Partnership Capacity ............................................................................................ 22
Survey Results ........................................................................................................................... 22
Case Study Results ..................................................................................................................... 23
Chapter 4: CEY in Context ............................................................................................................... 32
Summary of CEY Evaluation Findings ..................................................................................... 32
CCF Programs and Evaluations ................................................................................................. 32
Directions for Additional Research ............................................................................................ 35
References ........................................................................................................................................... 38
Appendix A: Tables of Results .......................................................................................................... 40

Abt Associates Inc. pg. 1
Executive Summary
Background
Nonprofit organizations (NPOs) continue to be critical providers of a range of needed services within communities across the country. NPOs working together can share knowledge and resources, avoid duplication and more efficiently and effectively serve their community members. This is especially true as community needs grow and resources to address them do not. The literature suggests that more and more organizations are exploring how to work in partnership in order to deliver services more efficiently and effectively. Developing partnerships is often driven by an interest in leveraging federal and other funds1 and a growing consensus that complex societal issues cannot be effectively addressed by a single person, organization, or sector working alone.2 Common partnership activities include collaborating on common interests and goals, making cross-referrals and jointly developing events or delivering services. However, individual partner organizations may have limited internal and external resources that can hinder partnerships’ abilities to reach desired goals. Similarly, the capacity of partnerships as a whole may be limited and, thus, restrict the potential of the partnership to attain goals beyond those possible by individual organizations. Levels of organizational capacity (e.g., infrastructure; operating procedures and practices) in various domains have been associated with similar levels of organizational performance and sustainability. Such associations have led funders to support organizational capacity building among NPOs as a means to increase organizational efficiency, effectiveness and sustainability and better meet the needs of families and communities. Organizational sustainability is a desired outcome for both NPOs and many funders as NPOs are often viewed as organizations of trust in communities and valued links to the most vulnerable populations. Further research is needed to clearly tie increased organizational capacity generally or in specific areas to better outcomes for those served, however. The Communities Empowering Youth (CEY) program, a discretionary grant program, was designed to support NPOs efforts to build and sustain organizational capacity among organizations partnering to fight gang involvement, youth violence, and child abuse and neglect in their communities. Developed by the Office of Community Services within the Administration of Children and Families (ACF) in 2006, the CEY program funded partnerships of a lead NPO and multiple partner NPOs. CEY was one of three programs within the Compassion Capital Fund3 that were designed to help NPOs build their capacity in order to better serve the needs of their community, but it is the only one that focused on building partnership capacity as well as the internal capacity of individual organizations.
1 Riggin, L., Grasso, P., & Westcott, M., 1992. 2 Lasker, R., Weiss, E., & Miller, R., 2001; Gadja, 2004. 3 The Compassion Capital Fund, initially authorized by Congress in 2002, provided funding to support
organizational capacity building among faith-based and community nonprofits.

Abt Associates Inc. pg. 2
ACF contracted with Abt Associates to conduct an evaluation that examined the experiences and outcomes among these partnerships and partnering organizations over time. The federal CEY evaluation is a descriptive, longitudinal outcome study of changes in organizational and partnership capacity reported by the CEY lead organizations and their partners over their three-year grant cycles. The evaluation was not structured to answer the question of whether the CEY grant and related activities caused changes in capacity. The analyses are based on answers to baseline and follow-up survey questionnaires by the lead and partner organizations. There was no independent validation of the information provided. The study examined changes reported by the NPOs in individual partners’ organizational capacity as well as in the capacity of the partnerships as a whole.
Organizational Capacity – Key Findings
In evaluating outcomes between 2008 and 2010, we found that the participating organizations improved on multiple measures within the four capacity domains that the study measured: 1) Leadership Development; 2) Organizational Development; 3) Program Development and 4) Community Engagement. However, because a large number of outcomes were measured, it is possible that some of the changes found to be statistically significant may have occurred by chance. Based on analyses to address the large number of outcomes measured, we have the most confidence that changes reported by partner organizations in the Program Development and Community Engagement domains did not occur by chance. These changes were:
Increase in the number of clients served over the course of the study.
Increase in the number of partner organizations that measured client satisfaction and client outcomes.
Increase in the number of partner organizations engaging in partnerships beyond their CEY partnership, particularly with private businesses, government agencies, and faith-based nonprofits.
Increase in the number of partner organizations focused on improving their approach to providing services, marketing their services, and gathering knowledge about their communities.
Capacity Changes Were Sustained Over Time
Based on two rounds of follow-up surveys, the CEY evaluation measured the sustainability of the changes reported. By asking the same questions at the second follow-up (about 30 months after the baseline survey and about 12 months after the first follow-up survey), we were able to document that NPOs reported that they maintained most of the capacity increases they reported at the first follow-up. This type of analysis was not possible within any of the other evaluations of the Compassion Capital Fund conducted by Abt Associates, which had shorter follow-up periods.

Abt Associates Inc. pg. 3
Sustaining Partnerships Was a Challenging Effort
Most of the CEY-funded partnerships had relatively high levels of partnership capacity at the start of the evaluation, and these levels, as measured by the survey, changed little over time. Thus, while the CEY program may have played a constructive role, participating partnerships did not report many improvements. Further, while relations within the partnerships were generally positive, at the second follow-up most organizations reported that their CEY partnerships were not likely to continue beyond the grant period. Information from the qualitative case study, conducted with ten partnerships, suggests that both lead and partner organizations were struggling to maintain the enthusiasm and energy they brought to the partnership in the beginning. Lead organizations noted poor attendance at meetings and trainings over time among partners, while partner organizations pointed to competing priorities and limited staff as reasons for diminished involvement and focus on the partnership. These practical problems notwithstanding, nearly all of the organizations’ staff from the ten partnerships believed that participating in the CEY partnership helped them build valuable networks and connections with other service providers in their communities. The ―capital‖ contained within these networks has the potential to improve services to youth in the CEY communities, through an increase in joint services and referrals across the service providers.
Discussion
Many organizations invest in capacity building with the expectation that higher levels of organizational capacity lead to an increased ability to achieve mission objectives and long-term sustainability. Similarly, well functioning collaborations and partnerships can potentially leverage skills and resources to more effectively address community issues and needs. The CEY program was designed to support improvements in both areas. While we have stronger confidence in some of the findings than in others, the data show that individual organizational capacity was reported to have increased during the study period, and that this increase largely was maintained through the end of the study period. At the same time, partnership capacity did not change greatly and continuation of the partnerships was in question. There are several potential reasons for this pattern in the results. First, the concept of organizational capacity building may be better understood and developed than the concept of partnership capacity building. There is a large body of work and developed resources to support individual organizational capacity assessment and improvement—with the result that lead organizations and the consultants they engaged were more likely to have experience and ready tools and resources to assist with each organization’s capacity-building but fewer tools and resources specific to partnership capacity building. Second, the CEY program design posed challenges for small nonprofit organizations that were expected to participate in and incorporate changes resulting from two types of capacity-building

Abt Associates Inc. pg. 4
activities, rather than just one. Addressing their own organizational needs required a lot of time and resources, especially in trying economic times, leaving little time or resources to focus on the needs of the partnership. Additional studies of this dynamic are needed to better understand partnership capacity building and the factors that support or diminish growth and sustainability. It is also noteworthy that there were fewer changes in organizational capacity reported by CEY NPOs than were reported by Demonstration Program NPOs in an earlier study of another Compassion Capital Fund program. The Demonstration Program funded intermediary organizations to provide training, technical assistance and financial assistance to NPOs. Both an outcome study and an impact evaluation of the Demonstration Program found positive increases in organizational capacity for more individual level measures and across all of the domains examined. The lesser number of positive changes found in the CEY study compared to the Demonstration Program study may be related to the ―dual focus‖ issue discussed above or a range of other possible factors, such as differences in the characteristics or starting levels of capacity among the organizations or the content and methods of training and other assistance provided. With regard to next steps, evaluations that are specifically designed to attribute causation to partnership capacity building activities would add substantial value to the field. Additionally, studies that address the contribution of the various components of capacity building programs - training, one-on-one technical assistance and financial assistance – may help funders better target resources. And, as noted in the discussion of the Demonstration Program evaluation, studies that compare capacity building delivery approaches would also benefit the field. Further, investments in organizational capacity building are often driven by the desire to improve outcomes for individuals and families. There has been little or no research on the extent to which this ultimate objective is achieved. More research to establish the relationship between organizational capacity and capacity-building and participant outcomes would provide valuable contributions to this field.

Abt Associates Inc. pg. 1
Chapter 1: Introduction
Background
In 2006, the Administration for Children and Families (ACF) at the Department of Health and Human Services established the Communities Empowering Youth (CEY) program.4 CEY’s intent was to address the capacity building needs of partnerships of nonprofit organizations (NPOs) that were tackling issues of gang violence, youth violence, or child abuse and neglect. In 2006, ACF, through the Office of Community Services (OCS), awarded three-year grants to 100 CEY partnerships; in 2007, ACF funded 31 additional partnerships. The three-year discretionary grants were, on average, about $250,000 per year for three years. Local CEY projects consisted of a partnership between a lead NPO (the grantee) and an average of seven partnering NPOs that provided services to youth within a specific geographical area. Lead organizations were expected to use these funds to coordinate training sessions and technical assistance, as well as to re-grant at least 25 % of the funds they received to their partner organizations for their direct use in capacity building. In many cases, staff within the lead organization provided capacity building training or technical assistance to other partners. In some cases or for some areas, the lead organization contracted for training or assistance from an external expert. Capacity building activities undertaken were to increase the capacity of their partnerships as well as that of their individual members in four areas: 1) leadership development, 2) organizational development, 3) program development, and 4) community engagement. The CEY grant announcement provided the following guidelines for the use of grant funds:
ii
t
CEY monies are to be used by the lead organization and its collaborating faith-based and/or community partners to increase the overall effectiveness of their community collaboration while increasing the organizational sustainability and capacity of the ndividual collaboration members. Capacity building activities are designed to ncrease the collaboration’s and the individual organizations’ sustainability and
effectiveness and to enhance their ability to provide social services to better serve hose most in need.
Within these guidelines and specifications about the four capacity building domains, grantees had considerable discretion in the methods and approaches they could use to reach their goals and objectives under the grant. Given the diversity in the size and characteristics of the partnerships as well as diversity in the needs and interests of individual partners, no single model was prescribed or expected. 4 CEY was one of three major programs that comprised the Compassion Capital Fund (CCF). The primary
purposes of CCF were to help nonprofit organizations (NPOs) increase their effectiveness, enhance their ability to provide social services to those most in need, expand their organizations, diversify their funding sources, and create collaborations to better serve those in need. Summaries of the Compassion Capital Fund Demonstration and the Targeted Capacity Building Program evaluations are available on the ACF website, www.acf.hhs.gov (Abt Associates & Branch Associates, 2007, 2010a, 2010b, 2010c; Fink & Sipe, 2008).

Abt Associates Inc. pg. 2
Abt Associates and its partner Branch Associates conducted an outcome evaluation of the CEY program for ACF. This evaluation included annual surveys of the lead and partner organizations receiving CEY funding over the program’s three-year time horizon. The survey measured changes in two types of capacity: 1) organizational capacity of the lead and partner organizations and 2) the capacity of the CEY partnerships. In addition to the survey, the evaluation included a longitudinal multi-case study component to examine activities and partnership interactions over the three-year grant period. The study team conducted a case study of 10 CEY partnerships from the 2007 grant year. Data gathered through semi-structured interviews with key staff and observations of partnership activities informed this component of the research. The evaluation did not include documentation of the extent to which grantees implemented their plans in accordance with their approved grant applications.5 This report provides an overview of the evaluation’s key findings. We focus on significant changes reported in organizational and partnership capacity between baseline (2008), Follow-up 1 (2009) and Follow up 2 (2010) surveys. The report is divided into four chapters. The remainder of this chapter provides an overview of the design and methodology of the CEY evaluation. The methodology discussion includes a summary of the characteristics of the sample of CEY organizations and partnerships. The chapter closes with an overview of how the evaluation defined and measured the organizational capacity and partnership capacity domains. Chapter Two presents findings regarding changes in organizational capacity reported by the CEY partner and lead organizations. Chapter Three addresses shifts in partnership capacity over the three year grant period, drawing on both the survey and case study data. The final chapter places the CEY study within the context of the other CCF Demonstration program evaluations. A more complete discussion of the survey methods and comprehensive tables of the results are presented in the companion CEY Evaluation Technical Report. The Evaluation
The federal CEY evaluation is a descriptive, longitudinal outcome study of changes in organizational and partnership capacity reported by the CEY lead organizations and their partners over their three-year grant cycles. The evaluation was not structured to answer the question of whether the CEY grant and related activities caused changes in capacity. Further, the data reflect self-reports by the lead and partner organizations. There was no independent validation of the information provided. The research questions for the evaluation are as follows:
1. To what extent and in what domains did organizational capacity increase?
2. How do outcomes vary by characteristics of the lead agency, the partners and the partnership?
3. To what extent and in what domains did the CEY partnerships’ capacity develop over the grant period?
5 Program monitoring was conducted by the Office of Community Services specialists assigned to each
grant.
Abt Associates Inc. pg. 3
To answer these questions, the evaluation examines two types of capacity: 1) organizational capacity of the lead and partner organizations, and 2) partnership capacity. Organizational capacity includes the four capacity domains specified in the CEY grant announcement:
Leadership Development Organizational Development Program Development Community Engagement
The partnership capacity domain comprises five areas:
Leadership Development Shared Mission and Objectives Communication Action Planning Sustainability Planning
Along with exploring the three aforementioned research questions, this evaluation adds to the existing knowledge base relating to the design of evaluations of organizational capacity building for NPOs. The development and use of the organizational capacity domains expands the analytic toolbox available for future capacity building-related research and evaluation. Methods
The CEY evaluation is a mixed-method study, using both quantitative and qualitative approaches. Below, we describe briefly the survey methodology followed by the case study methods.
Survey Methods
The evaluation focuses on a representative sample of 50 (of 100) lead organizations from the 2006 grant year cohort and all 31 lead organizations from the 2007 cohort.6 The entire population of partners associated with each lead organization in the study is also included. Thus, the evaluation survey sample is generalizable to all 131 CEY grants and over 500 associated partner organizations. As shown in Exhibit 1.1, the evaluation team collected survey data annually from the CEY lead grantees and their partners between 2008 and 2010. There was one wave of follow-up data collection for the 2006 cohort (in 2009) and two for the 2007 cohort (in 2009 and 2010). For the remainder of this report, the 2008 survey data are referred to as Baseline, the 2009 data are referred to as Follow-up 1 (F1), and the 2010 data are referred to as Follow-up 2 (F2).7
6 A complete discussion of the survey sample selection procedures is provided in the CEY Technical Report. 7 The 2008 survey was considered baseline for the 2007 cohort due to the delayed implementation schedule
of this group; no significant grant activity occurred prior to the 2008 survey. The 2006 cohort reported retrospective baseline data at the time of the 2008 survey; because no significant differences were detected

Abt Associates Inc. pg. 4
Exhibit 1.1: CEY Evaluation Survey Data Collection Schedule
CEY Cohort Baseline (2008) F1 (2009) F2 (2010)
2006
2007
The evaluation team compared average capacity scores on 179 organizational and partnership outcomes between points in time. These comparisons indicate whether there are significant increases or decreases between time points. Specifically, the team analyzed changes from:
1. Baseline to F1 2. F1 to F2 3. Baseline to F2
Multiple Comparisons
When a large number of individual outcomes are tested and/or multiple statistical tests are conducted on the same outcomes, as is the case in the CEY evaluation, there is a risk of finding significant effects by chance. This may lead to incorrect conclusions about the number of significant changes reported over time by the NPOs. The analysis of the CEY data addressed the issue of multiple comparisons by reducing the total number of tests conducted. Specifically, after all of the outcomes were tested for change over time individually, the outcomes comprising a domain were tested together with a ―joint‖ test. This test indicates if there is any change in a given domain. Joint tests were conducted separately for the lead and partner organizations using seemingly unrelated regression (SUR) models.8 If a given domain is significant under a joint test, then the significance tests on each outcome within that domain can be interpreted with more confidence than the tests within a non-significant domain. The evaluation team conducted joint tests on each of the four organizational capacity building domains as well as the partnership capacity domain. The results described in the following two chapters are presented in light of the multiple comparisons analysis. Specifically, where individual outcomes were significant, but the joint test for the domain was not, results are presented with the caveat that their statistical significance may be due to chance. In the cases where joint tests indicated significant capacity change in a domain, individual outcome results within those domains are presented with greater confidence.
between their retrospective responses and their 2008 responses, the 2008 data were treated as baseline for the 2006 cohort as well.
8 Greene, 2000; Weesie, 1999; Zellner, 1962. We performed the multiple comparisons analysis with the 2007 cohort data because these data are available at three time points (versus two for the 2006 cohort).

Abt Associates Inc. pg. 5
Case Study Methods
The longitudinal case study component of the CEY evaluation explored the implementation experiences of 10 partnerships from the 2007 cohort over the three-year grant period. The study team employed purposeful sampling to select the lead organizations to represent a range of geographic locations, partnership sizes, and mix of organization types. Two members of the study team visited the selected sites at or near the conclusion of each grant year, a total of three times. During these visits, study staff conducted semi-structured interviews with the leadership of each lead and partner organization, observed partnership meetings and training sessions, and collected materials such as handouts from training sessions, community assessment reports, and partnership timelines and work plans. This research yielded insights into the development of the CEY partnerships’ capacity. The most salient results from the case study component are presented in Chapter 3 of this report. Characteristics of the Survey Sample
Exhibit 1.2 summarizes some key characteristics of the CEY lead and partner organizations. Lead organizations are well-established service providers. About 84 percent are over a decade old and they primarily serve large geographic areas such as cities or entire states. The vast majority of the lead organizations address youth violence, gang violence, child abuse or neglect, or some combination of the three. Nearly all provide capacity building services to other community-based organizations and the majority also provide direct client services. Partner organizations are primarily direct service providers and over half (56 percent) have been established for over a decade. Similar to the lead organizations, the majority of these organizations operate in urban areas. They tend to be smaller than the lead organizations as measured by the number of full time paid staff. Almost all of the partner organizations have experience addressing youth violence, gang violence, child abuse or neglect, or some combination of the three (not shown).
Exhibit 1.2: Key Characteristics of Lead and Partner Organizations (Average at Baseline)
Age of
Organization
(years)
Provides Capacity
Building Services
Provides Direct
Client Services
Number of Full
Time Paid Staff
Lead 30 98% 80% 60
Partner 23 45% 87% 15
A unique aspect of the CEY grant program and this evaluation is its focus on the development of partnerships. In many cases, the lead and partner organizations were familiar with one another prior to the CEY grant: 82 percent of lead organizations reported that they had partnered with at least some of the proposed CEY partner organizations prior to applying for the CEY grant. Of these, 56 percent added new members upon creation of their CEY partnership. Eighteen percent of the lead organizations indicated that their CEY partnerships were entirely new, created in response to the CEY grant announcement. At baseline, the partnerships had between two and 30 partners (the average number was seven). The partnership sizes fluctuated throughout the program as new partners joined and existing partners exited. At F2 the partnerships had between one and 12 partners (the average number was five).

Abt Associates Inc. pg. 6
Limitations of the Study
This study provides estimates of change over time in various areas of organizational and partnership capacity among nonprofit organizations that received CEY assistance. However, the changes reported cannot be directly attributed to the services provided with CEY funds because there is no equivalent comparison group to assess what would have occurred without CEY funded activities. The changes reported may be due to a variety of factors. For example, it is possible that organizations willing to participate in a CEY partnership were already on a growth trajectory. Reported organizational changes may also be caused by external factors such as growing or shrinking funding sources between the two survey periods. Finally, the findings presented are based on NPOs’ self-reported information; there was no independent validation of changes in partnership or organizational capacity, nor was there an implementation study to confirm that the program was implemented as expected. Capacity Outcome Measures
As noted, the CEY evaluation measures outcomes in two areas: organizational capacity and partnership capacity. The following section describes the types of outcomes measured within these two areas. For a complete list of the survey items by domain, please see the CEY Evaluation Technical Report. Organizational Capacity Domains
ACF outlined four broad capacity building outcome domains in the CEY program grant announcement. The CEY evaluation team, in collaboration with ACF, developed survey questions to measure the four domains drawing from existing surveys from other Compassion Capital Fund evaluations and experts in the field of nonprofit capacity. The four outcome domains that represent organizational capacity for this evaluation are: 1) Leadership Development; 2) Organizational Development; 3) Program Development; and 4) Community Engagement. The CEY evaluation measured each of these domains as follows:9
1. Leadership Development includes professional development activities that enhance the knowledge and skills of staff in the organization including board members and executive directors’ full- and part-time staff and volunteers.
2. Organizational Development is a broad domain that includes the tools and management systems needed to improve organizational effectiveness, efficiency, and sustainability. These include mission statements and strategies, number of revenue sources, fund development capacity, staff and volunteer management, and information technology (IT) management.
9 The concepts comprising each domain are similar to those described by De Vita, Fleming & Twombly,
2001; De Vita & Fleming, 2001; Fink & Engel, 2006; Leake et al., 2007; Leviton et al., 2006; Light, 2004; McKinsey & Company, 2001; and Schuh & Leviton, 2006.

Abt Associates Inc. pg. 7
Organizational capacity also includes reviewing board functions and helping board members to understand their responsibilities.
3. Program Development capacity involves efforts to support effective and sustainable programming, such as improving program design and service delivery, as well as the monitoring and evaluation of program services.
4. The Community Engagement capacity area includes the extent to which nonprofit organizations offer programs focused on community needs, obtain credibility and support from the wider community, and establish or enhance community outreach activities and collaborative relationships.
Partnership Capacity Domain
The partnership capacity domain encompasses five areas: 1) Leadership Development; 2) Shared Mission and Objectives; 3) Communication; 4) Action Planning; and 5) Sustainability Planning. Brief descriptions of the partnership development areas are provided below.10
1. Leadership Development at the partnership level includes building and managing interagency relationships. For the CEY evaluation, we further define leadership development as the development of trust and relationship building among leaders and staff across organizations.
2. Shared Mission and Objectives includes developing a clear, inspiring, shared purpose that is common across partnering organizations.
3. Communication at the partnership level includes whether participating in the CEY partnership led to better communication and working relationships among participating organizations.
4. Action Planning is defined as the outlining of partnership tasks that need to be achieved, including timelines and formal delegation of responsibilities.
5. Sustainability Planning involves creating a plan to continue the partnership past the three-year grant cycle.
10 Similar definitions of partnership capacity are used by Austin, 2000; Gajda, 2004; Sagawa, 2001; and
Wohlstetter, Smith, & Malloy, 2005.
Abt Associates Inc. pg. 8
Chapter 2: Changes in Organizational Capacity
CEY-funded capacity building activities encompassed a range of services designed to help nonprofits serving America’s most at-risk youth become stronger, more sustainable, and better able to serve their communities. Activities typically involved a combination of one-on-one technical assistance, training, and financial assistance that was used to purchase resources such as computers, equipment and software. Practically, CEY lead organizations coordinated the capacity building assistance that they and their partners received. The exact assistance provided varied depending on such factors as an NPO’s organizational structure, its staff capabilities, and its programmatic priorities. For example, one organization might have received assistance with resource development and marketing activities, while another received guidance on building collaborations with community organizations. Since the focus of assistance varied by organization and its capacity needs, the CEY evaluation was designed to measure the widest possible range and depth of capacity development. Our fieldwork suggests that the survey instrument was sufficiently comprehensive to capture most of the capacity changes that may have occurred in participating NPOs.11 Using this survey information, the following chapter addresses two of the study’s research questions: To what extent and in what domains did organizational capacity increase? And How do outcomes vary by characteristics of the lead agency, the partners and the partnership? The results for partner organizations are presented first, followed by lead organizations. For each, the results are organized by capacity domain. Within the domains, we discuss the results of tests of statistical significance for each capacity indicator, followed by results of the joint tests at the domain level. The chapter closes with the results of the subgroup analyses. These analyses examined whether the effects of the CEY program differed across various types or groups of organizations. Overall, partners and lead organizations reported significant changes on a number of specific indicators across all four organizational capacity domains. The majority of reported capacity gains occurred between baseline and F1. The second follow-up survey indicated the maintenance of nearly all gains during the third year of implementation. Joint tests within each domain found additional support for significant increases in two capacity domains for partners—Program Development and Community Engagement—but not for any of the four capacity domains for lead organizations.12 This means that we have the most confidence that the changes found to be statistically significant in the Program Development and Community Engagement capacity areas for partner organizations are not merely by chance. Unless otherwise noted, differences discussed are statistically significant at the individual outcome level. Results for all survey measures are presented in Appendix A.
11 The comprehensive nature of the survey also means, however, that organizations were measured in areas of
capacity that were not the focus of the CEY support the organization received. NPOs were evaluated in areas in which they did not try to build capacity and, as a result, this study may underestimate the level of capacity change that occurred. In future evaluations, a deeper understanding of each NPO’s intended capacity improvements would help to refine the analysis of achieved outcomes.
12 Additional details on the justification for and explanation of the multiple comparisons approach can be found in the CEY Technical Report.

Abt Associates Inc. pg. 9
Exhibit 2.1: How to Read this Chapter and Interpret Tables of Results
The tables in this chapter present findings for which the conventional statistical tests (unadjusted for multiple comparisons) suggest a
significant difference between survey time points. A complete set of results from the significance testing can be found in Appendix A and
the separate CEY Evaluation Technical Report.
Level of Confidence in Statistically Significant Findings
The precise level of confidence in a significant finding is indicated by a “p-value.” If statistical testing revealed less than a 5% probability
that differences occurred simply by chance, there will be one plus sign (+) in the following exhibits, representing a p-value < 0.05; if the
probability was less than 1% there will be two plus signs (++), representing a p-value < .01. Partner Organizations
Partner organizations reported some significant increases in organizational capacity in all four domains. Exhibits in the following sections summarize the significant changes reported. Program Development
The Program Development domain includes six indicators related to either service delivery or program evaluation. Specifically, the survey measured the change in numbers of clients served as well as whether organizations measured client satisfaction and clients’ progress in achieving desired program outcomes. 13 (see Exhibit 2.2) Over the course of the study, the number of clients served increased significantly among the partners in the 2007 cohort, and more partners reported measuring client satisfaction and client outcomes than at baseline. Between baseline and F2, the number of program participants served by partners in the 2007 cohort increased by an average of 164 individuals per month, from 363 to 526 individuals per month.
In terms of internal evaluation activities, more partners in the 2006 and 2007 cohorts reported engaging in evaluative efforts (either feedback or formal measurement of outcomes) between baseline and F1. The 2007 cohort maintained these gains between F1 and F2.
13 Some organizations provided both direct services to individuals or families as well as capacity building
services to other organizations, thus they were asked questions about both direct services to individuals and capacity building services to organizations.

Abt Associates Inc. pg. 10
Exhibit 2.2: Changes in Program Development—Partners Outcome Increased (+) or Decreased ( - )
Baseline to F1 F1 to F2 Baseline to F2
Service Delivery
In a month of service delivery, total number of program participants organization serves
Cohort 2006
Cohort 2007 +
Program Evaluation
In the past 12 months, has your organization obtained feedback from program participants about satisfaction with direct services
provided?
Cohort 2006 +
Cohort 2007 + + + +
In the past 12 months, has your organization conducted formal measurements of direct service program participant outcomes?
Cohort 2006
Cohort 2007 + +
In the past 12 months, has your organization obtained feedback from program participants about satisfaction with capacity building
services provided?
Cohort 2006 +
Cohort 2007 + +
In the past 12 months, has your organization conducted formal measurements of capacity building program participant outcomes?
Cohort 2006
Cohort 2007 + + + +
No statistically significant change. ++ /+ Statistically significant positive change at the .01/.05 level. – –/– Statistically significant negative change at the .01/.05 level. Shaded areas (empty cells) reflect data not collected from the 2006 cohort at Follow-Up 2; therefore ―F1 to F2‖
and ―Baseline to F2‖ significance tests were not performed.
Source: CEY Outcome Study Baseline, Follow-Up 1, and Follow-Up 2 Surveys.
Note: The sample at baseline includes 459 partner organizations and represents the population of 809 partner organizations in 2008 (2006 & 2007 cohorts). The sample at first follow-up includes 513 partner organizations and represents the population of 880 partner organizations in 2009 (2006 & 2007 cohorts). The sample at second follow-up includes the population of 158 partner organizations in 2010 (2007 cohort only). ―Baseline to F1‖ denotes changes between baseline and first follow-up; ―F1 to F2‖ denotes changes between first follow-up and second follow-up; ―Baseline to F2‖ denotes changes between baseline and second follow-up. Community Engagement
Partnering with other organizations, schools, and local governments can increase an NPO’s service capacity as well as provide an efficient way to market and expand services. Therefore, the community engagement domain includes collaborating with a variety of stakeholders (e.g., government, educational institutions) and using a variety of methods to increase community outreach and connectedness. In total, 10 indicators measured partners’ level of community engagement. Exhibit 2.3 presents partners’ changes in community engagement capacity.

Abt Associates Inc. pg. 11
Exhibit 2.3: Changes in Community Engagement—Partners Outcome Increased (+) or Decreased ( - )
Baseline to F1 F1 to F2 Baseline to F2
Partnerships
Organization engaged in partnership arrangements with other organizations in its community/service area (not CEY)?
Cohort 2006
Cohort 2007 + + Partnership arrangements with organizations in: government?
Cohort 2006 +
Cohort 2007 Partnership arrangements with organizations in: business/private?
Cohort 2006
Cohort 2007 + + + +
Partnership arrangements with organizations in: faith-based nonprofit?
Cohort 2006 +
Cohort 2007 Community Outreach
In the past 12 months has your organization rethought the way in which it gains knowledge about the community it serves?
Cohort 2006 + +
Cohort 2007 + + + +
In the past 12 months has your organization implemented new or improved methods for gaining knowledge about the community it
serves?
Cohort 2006 + +
Cohort 2007 + + +
In the past 12 months has your organization rethought the way in which it markets its services or expands awareness about its mission
to individuals, families, funders, or potential partners?
Cohort 2006
Cohort 2007 + + + +
In the past 12 months has your organization implemented new or improved methods for marketing its services or expands awareness
about its mission to individuals, families, funders, or potential partners?
Cohort 2006
Cohort 2007 + + + +
No statistically significant change. ++ /+ Statistically significant positive change at the .01/.05 level. – –/– Statistically significant negative change at the .01/.05 level. Shaded areas (empty cells) reflect data not collected from the 2006 cohort at Follow-Up 2; therefore ―F1 to F2‖
and ―Baseline to F2‖ significance tests were not performed.
Source: CEY Outcome Study Baseline, Follow-Up 1, and Follow-Up 2 Surveys.
Note: The sample at baseline includes 459 partner organizations and represents the population of 809 partner organizations in 2008 (2006 & 2007 cohorts). The sample at first follow-up includes 513 partner organizations and represents the population of 880 partner organizations in 2009 (2006 & 2007 cohorts). The sample at follow-up two includes the population of 158 partner organizations in 2010 (2007 cohort only). ―Baseline to F1‖ denotes changes between baseline and first follow-up; ―F1 to F2‖ denotes changes between first follow-up and second follow-up; ―Baseline to F2‖ denotes changes between baseline and second follow-up. At F1, more partners in the 2007 cohort were engaged in partnerships beyond their CEY partnership compared to baseline. Additionally, of those who were engaged in partnerships other than CEY, more reported collaborations with organizations in the business sector at F2 than at baseline and F1.
Abt Associates Inc. pg. 12
While there was no change in the number of organizations from the 2006 cohort that were partnering beyond CEY, of those that were engaged in such partnerships more of them reported collaborations with government sector entities and with faith-based nonprofit organizations. The partner organizations also reported increased community outreach capacity. Significantly more organizations from the 2007 cohort reported rethinking and implementing the ways in which they gain knowledge about the communities they serve (baseline to F2). Similarly, these same organizations reported significant changes in the way they thought about and implemented marketing their services (baseline to F2). There was also an increase in the number of organizations that stated that they had rethought and improved methods for gathering knowledge about their community. Results of the joint tests for program development and community engagement among partners
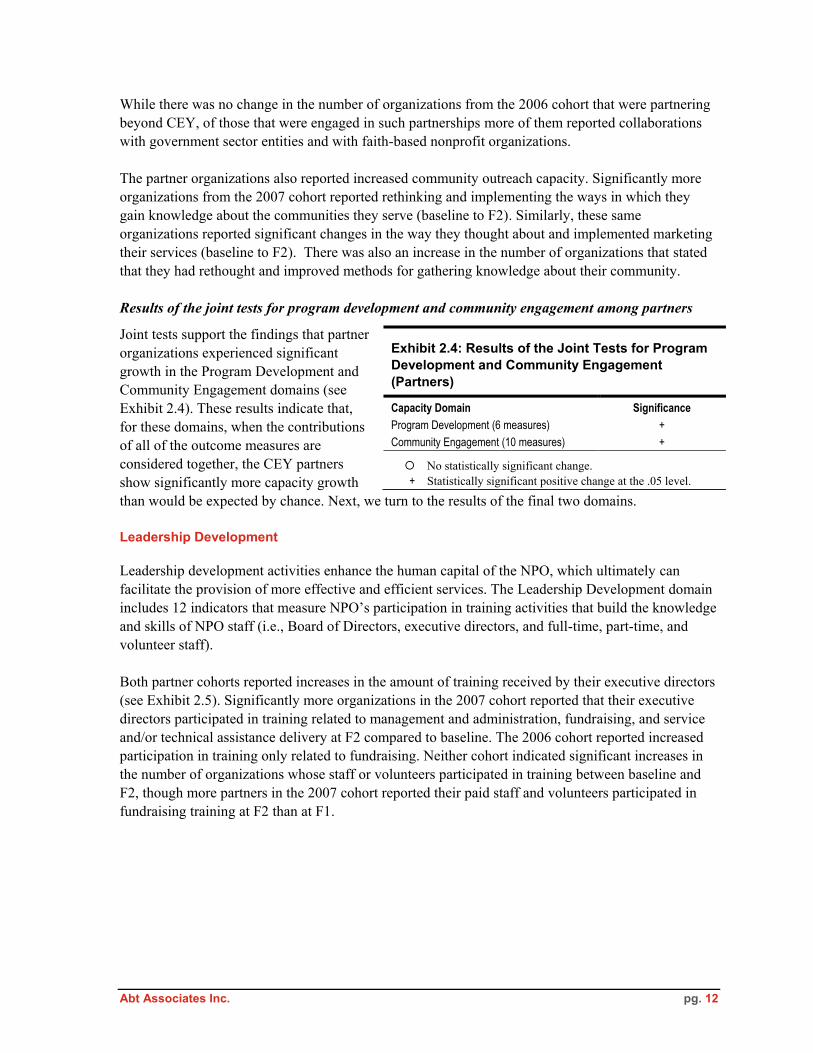
Joint tests support the findings that partner organizations experienced significant growth in the Program Development and Community Engagement domains (see Exhibit 2.4). These results indicate that, for these domains, when the contributions of all of the outcome measures are considered together, the CEY partners show significantly more capacity growth than would be expected by chance. Next, we turn to the results of the final two domains.
Exhibit 2.4: Results of the Joint Tests for Program Development and Community Engagement (Partners)
Capacity Domain Significance
Program Development (6 measures) +
Community Engagement (10 measures) +
No statistically significant change. + Statistically significant positive change at the .05 level.
Leadership Development
Leadership development activities enhance the human capital of the NPO, which ultimately can facilitate the provision of more effective and efficient services. The Leadership Development domain includes 12 indicators that measure NPO’s participation in training activities that build the knowledge and skills of NPO staff (i.e., Board of Directors, executive directors, and full-time, part-time, and volunteer staff).
Both partner cohorts reported increases in the amount of training received by their executive directors (see Exhibit 2.5). Significantly more organizations in the 2007 cohort reported that their executive directors participated in training related to management and administration, fundraising, and service and/or technical assistance delivery at F2 compared to baseline. The 2006 cohort reported increased participation in training only related to fundraising. Neither cohort indicated significant increases in the number of organizations whose staff or volunteers participated in training between baseline and F2, though more partners in the 2007 cohort reported their paid staff and volunteers participated in fundraising training at F2 than at F1.

Abt Associates Inc. pg. 13
Exhibit 2.5: Changes in Leadership Development—Partners Outcome Increased (+) or Decreased ( - )
Baseline to F1 F1 to F2 Baseline to F2
Executive Director Development
Did the executive director participate in any training related to management and administration?
Cohort 2006
Cohort 2007 + + + +
Did the executive director participate in any training related to fundraising?
Cohort 2006 +
Cohort 2007 + + + + +
Did the executive director participate in any training related to service and/or technical assistance delivery?
Cohort 2006
Cohort 2007 + + +
Full- and Part-Time Staff Development
How many paid staff participated in any training related to management and administration?
Cohort 2006
Cohort 2007 –
How many paid staff participated in any training related to fundraising?
Cohort 2006
Cohort 2007 +
Volunteer Development
How many volunteer staff participated in any training related to fundraising?
Cohort 2006
Cohort 2007 + +
No statistically significant change. ++ /+ Statistically significant positive change at the .01/.05 level. – –/– Statistically significant negative change at the .01/.05 level. Shaded areas (empty cells) reflect data not collected from the 2006 cohort at Follow-Up 2; therefore ―F1 to F2‖
and ―Baseline to F2‖ significance tests were not performed.
Source: CEY Outcome Study Baseline, Follow-Up 1, and Follow-Up 2 Surveys.
Note: The sample at baseline includes 459 partner organizations and represents the population of 809 partner organizations in 2008 (2006 & 2007 cohorts). The sample at first follow-up includes 513 partner organizations and represents the population of 880 partner organizations in 2009 (2006 & 2007 cohorts). The sample at second follow-up two includes the population of 158 partner organizations in 2010 (2007 cohort only). ―Baseline to F1‖ denotes changes between baseline and first follow-up; ―F1 to F2‖ denotes changes between first follow-up and second follow-up; ―Baseline to F2‖ denotes changes between baseline and second follow-up.
Organizational Development
Organizational Development is the most comprehensive domain measured by the evaluation (47 measures). It encompasses the use of long-term planning techniques like strategic planning and organizational assessments, methods of governance and organizational structures (e.g., whether a NPO was a 501(c)3 organization), board functions and responsibilities, and the use of technology and financial management systems. These internal practices can have a direct effect on the capacity of organizations to provide higher quality services with fewer resources to more clients. There were significant changes on a variety of the measures within the Organizational Development domain (see Exhibit 2.6). The most concentrated changes related to information technology (IT) management, mission and strategic planning, governance, and human resources management.

Abt Associates Inc. pg. 14
Exhibit 2.6: Changes in Organizational Development—Partners Outcome Increased (+) or Decreased ( - )
Baseline to F1 F1 to F2 Baseline to F2
Mission and Strategic Planning
In the past 12 months, has your organization formally assessed its organizational needs/strengths?
Cohort 2006
Cohort 2007 + Does your organization have a mission statement?
Cohort 2006 +
Cohort 2007 +
Does your organization have a strategic plan?
Cohort 2006 + +
Cohort 2007 + + + +
Governance and Organizational Structure
Board responsibilities include: Community/Stakeholder outreach
Cohort 2006
Cohort 2007 + +
Board responsibilities include: Recruitment of new board members
Cohort 2006
Cohort 2007 + + + +
Do the Board’s responsibilities include: Provision of formal orientation to new board members
Cohort 2006
Cohort 2007 + + + +
Organization has 501(c)3 status
Cohort 2006 + +
Cohort 2007 + +
Revenue Sources
In the last completed fiscal year, what was your organization’s total revenue? a
Cohort 2006
Cohort 2007 +
In the last completed fiscal year, what was your organization’s total expenditures? a
Cohort 2006
Cohort 2007 –
Excluding CEY, over the past 12 months, has your organization sought or obtained revenue from grants/contracts from federal
government agencies?
Cohort 2006
Cohort 2007 – Excluding CEY, over the past 12 months, has your organization sought or obtained revenue from grants/contracts from another
organization?
Cohort 2006 – –
Cohort 2007 Funding Readiness
Does your organization have a fundraising/fund development plan?
Cohort 2006 + +
Cohort 2007 + + +
Human Resources Management
Is there a job description for unpaid staff?
Cohort 2006
Cohort 2007 + + +
Is there a job description for volunteers?
Cohort 2006 + +
Cohort 2007 +

Abt Associates Inc. pg. 15
Exhibit 2.6: Changes in Organizational Development—Partners
Outcome Increased (+) or Decreased ( - )
Baseline to F1 F1 to F2 Baseline to F2
In the past 12 months, has your organization conducted performance reviews of unpaid staff?
Cohort 2006 + +
Cohort 2007 + + +
IT Management
Does your organization regularly use computer software to keep financial records?
Cohort 2006 +
Cohort 2007 + + + +
Do you have an adequate number of computers to meet your organization’s needs?
Cohort 2006 + +
Cohort 2007 + + + +
Is the software on these computers adequate to meet your organization’s needs?
Cohort 2006 + +
Cohort 2007 + + + +
Does your organization have access to the Internet?
Cohort 2006
Cohort 2007 +
Does your organization use the Internet to support an organizational website?
Cohort 2006 + +
Cohort 2007 + + + +
Does your organization use the Internet for community outreach purposes?
Cohort 2006 + +
Cohort 2007 + + +
No statistically significant change. ++ /+ Statistically significant positive change at the .01/.05 level. – –/– Statistically significant negative change at the .01/.05 level. Shaded areas (empty cells) reflect data not collected from the 2006 cohort at Follow-Up 2; therefore ―F1 to F2‖
and ―Baseline to F2‖ significance tests were not performed. aSignificance tests were performed on the medians using a signed rank test.
Source: CEY Outcome Study Baseline, Follow-Up 1, and Follow-Up 2 Surveys
Note: The sample at baseline includes 459 partner organizations and represents the population of 809 partner organizations in 2008 (2006 & 2007 cohorts). The sample at first follow-up includes 513 partner organizations and represents the population of 880 partner organizations in 2009 (2006 & 2007 cohorts). The sample at second follow-up includes the population of 158 partner organizations in 2010 (2007 cohort only). ―Baseline to F1‖ denotes changes between baseline and first follow-up; ―F1 to F2‖ denotes changes between first follow-up and second follow-up; ―Baseline to F2‖ denotes changes between baseline and second follow-up. There was an increase in IT capacity indicators among the 2007 cohort between baseline and F2. These indicators included using software to manage financial records, having an adequate number of computers and computers with adequate software to meet the organization’s needs, and having access to the Internet and using it for a variety of purposes. There were similar changes among the 2006 cohort except there were no significant changes in the number of organizations that had access to the Internet. Mission statements and strategic plans, including organizational needs assessments, were areas where organizations in both cohorts reported high levels of capacity at baseline. Despite this, there were significant increases in the number of organizations from the 2007 cohort that completed an
Abt Associates Inc. pg. 16
assessment, and both cohorts reported an increase in organizations with mission statements. The percentage of organizations with written strategic plans also significantly increased every year. By F2, more organizations reported having governance capacity in the areas of evolving board responsibilities and attainment of 501(c)3 status than at baseline. More organizations in the 2007 cohort had boards take on new responsibilities between baseline and F2 in three key areas: community outreach, recruitment of new members, and providing formal orientation. The primary increase in governance capacity was that more organizations had their 501c3 status. Finally, there was a significant increase in the number of organizations that reported human resource capacity. Specifically, more organizations in both cohorts reported adopting job descriptions for their unpaid staff and volunteers, as well as implementing performance reviews for unpaid staff. Results of the joint tests for leadership development and organizational capacity among partners
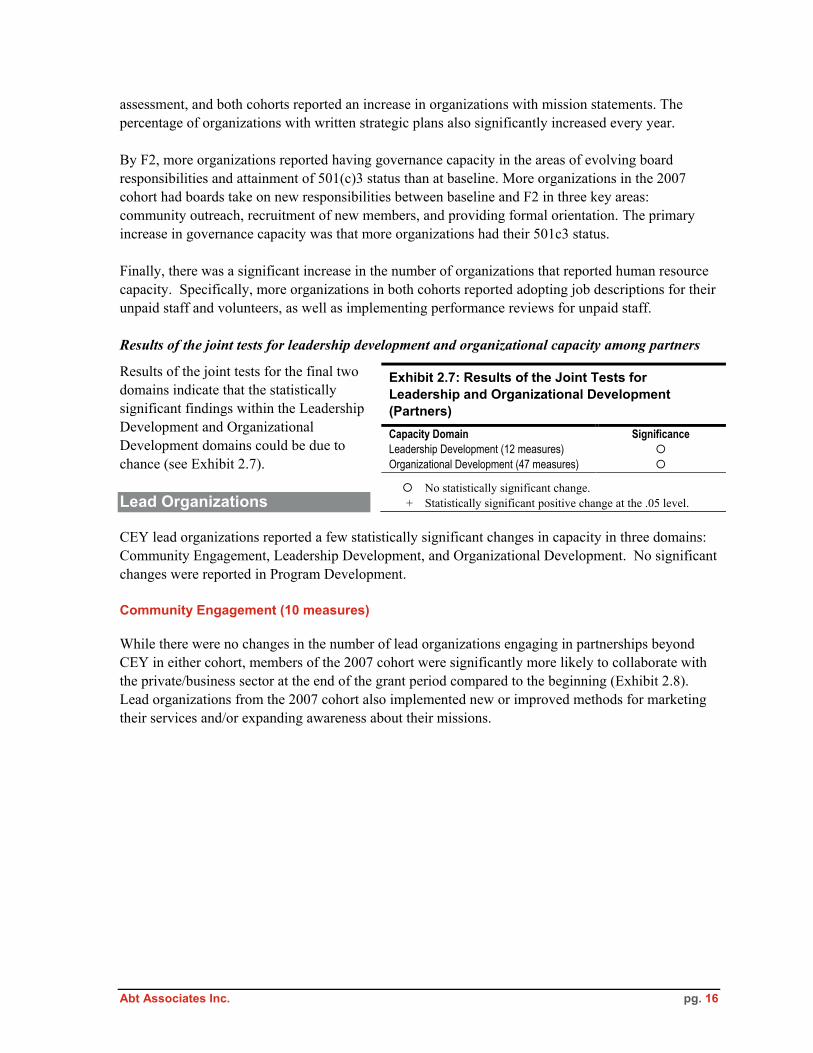
Results of the joint tests for the final two domains indicate that the statistically significant findings within the Leadership Development and Organizational Development domains could be due to chance (see Exhibit 2.7).
Exhibit 2.7: Results of the Joint Tests for Leadership and Organizational Development (Partners)
Capacity Domain Significance
Leadership Development (12 measures)
Organizational Development (47 measures)
No statistically significant change. + Statistically significant positive change at the .05 level. Lead Organizations
CEY lead organizations reported a few statistically significant changes in capacity in three domains: Community Engagement, Leadership Development, and Organizational Development. No significant changes were reported in Program Development.
Community Engagement (10 measures)
While there were no changes in the number of lead organizations engaging in partnerships beyond CEY in either cohort, members of the 2007 cohort were significantly more likely to collaborate with the private/business sector at the end of the grant period compared to the beginning (Exhibit 2.8). Lead organizations from the 2007 cohort also implemented new or improved methods for marketing their services and/or expanding awareness about their missions.

Abt Associates Inc. pg. 17
Exhibit 2.8: Changes in Community Engagement—Lead Outcome Increased (+) or Decreased ( - )
Baseline to F1 F1 to F2 Baseline to F2
Partnerships
Partnership arrangements with organizations in: business/private?
Cohort 2006
Cohort 2007 +
Community Outreach
In the past 12 months has your organization implemented new or improved methods for marketing its services or expands awareness
about its mission to individuals, families, funders, or potential partners?
Cohort 2006
Cohort 2007 + +
No statistically significant change. ++ /+ Statistically significant positive change at the .01/.05 level. – –/– Statistically significant negative change at the .01/.05 level. Shaded areas (empty cells) reflect data not collected from the 2006 cohort at Follow-Up 2; therefore ―F1 to F2‖
and ―Baseline to F2‖ significance tests were not performed.
Source: CEY Outcome Study Baseline, Follow-Up 1, and Follow-Up 2 Surveys.
Note: The sample at baseline and first follow-up includes 81 lead organizations (2006 & 2007 cohorts) and represents the population of 131 lead organizations in 2008 and 2009. The sample at second follow-up includes the population of 31 lead organizations (2007 cohort only) in 2010. ―Baseline to F1‖ denotes changes between baseline and first follow-up; ―F1 to F2‖ denotes changes between first follow-up and second follow-up; ―Baseline to F2‖ denotes changes between baseline and second follow-up. Leadership Development (12 measures)
The executive directors from lead organizations in the 2007 cohort participated in significantly more training in the final year of the CEY partnership than they did at baseline (Exhibit 2.9). Specifically, more lead organizations reported that their executive directors participated in management and administrative training. In addition, more lead organizations from this cohort reported that volunteer staff participated in service delivery training at F2 than at baseline.

Abt Associates Inc. pg. 18
Exhibit 2.9: Changes in Leadership Development—Lead Organizations Outcome Increased (+) or Decreased ( - )
Baseline to F1 F1 to F2 Baseline to F2
Executive Director Development
Did the executive director participate in any training related to management and administration?
Cohort 2006
Cohort 2007 + +
Staff Development
How many paid staff participated in any training related to service and/or technical assistance delivery?
Cohort 2006
Cohort 2007 –
Volunteer Development
How many volunteer staff participated in any training related to service and/or technical assistance delivery?
Cohort 2006
Cohort 2007 +
No statistically significant change. ++ /+ Statistically significant positive change at the .01/.05 level. – –/– Statistically significant negative change at the .01/.05 level. Shaded areas (empty cells) reflect data not collected from the 2006 cohort at Follow-Up 2; therefore ―F1 to F2‖
and ―Baseline to F2‖ significance tests were not performed.
Source: CEY Outcome Study Baseline, Follow-Up 1, and Follow-Up 2 Surveys.
Note: The sample at baseline and first follow-up includes 81 lead organizations (2006 & 2007 cohorts) and represents the population of 131 lead organizations in 2008 and 2009. The sample at second follow-up includes the population of 31 lead organizations (2007 cohort only) in 2010. ―Baseline to F1‖ denotes changes between baseline and first follow-up; ―F1 to F2‖ denotes changes between first follow-up and second follow-up; ―Baseline to F2‖ denotes changes between baseline and second follow-up. Interestingly, this same cohort of organizations also reported a large decrease in the number of paid staff that participated in training related to service and/or technical assistance delivery. There were no significant leadership development changes found for lead organizations in the 2006 cohort. Organizational Development (47 measures)
Lead organizations reported changes in capacity in a variety of the Organizational Development capacity indicators (Exhibit 2.10). In terms of changes in organizational governance, a higher percentage of lead organizations in the 2007 cohort reported that their boards reviewed program outcomes as part of their regular responsibilities and a significantly larger number in the 2006 cohort provided formal orientation to new board members.

Abt Associates Inc. pg. 19
Exhibit 2.10: Changes in Organizational Development—Lead Organizations
Outcome Increased (+) or Decreased ( - )
Baseline to F1 F1 to F2 Baseline to F2
Mission and Strategic Planning
Does your organization have a strategic plan?
Cohort 2006 +
Cohort 2007 Governance and Organizational Structure
Board responsibilities include: Performance review of program outcomes
Cohort 2006
Cohort 2007 +
Do the Board’s responsibilities include: Provision of formal orientation to new board members
Cohort 2006 +
Cohort 2007 Revenue Sources
In the last completed fiscal year, what was your organization’s total revenue? a
Cohort 2006 –
Cohort 2007 + +
In the last completed fiscal year, what was your organization’s total expenditures? a
Cohort 2006 –
Cohort 2007 + + +
Excluding CEY, over the past 12 months, has your organization sought or obtained revenue from grants/contracts from federal
government agencies?
Cohort 2006
Cohort 2007 - -
Funding Readiness
Does your organization have a fundraising/fund development plan?
Cohort 2006 + +
Cohort 2007 Does your organization have financial management procedures for ensuring expenditures are properly authorized?
Cohort 2006 +
Cohort 2007 Human Resources Management
How many paid staff are full-time employees?
Cohort 2006 –
Cohort 2007 In the past 12 months, has your organization conducted performance reviews of paid staff?
Cohort 2006
Cohort 2007 +
In the past 12 months, has your organization conducted performance reviews of volunteers?
Cohort 2006 –
Cohort 2007
IT Management
Do you have an adequate number of computers to meet your organization’s needs?
Cohort 2006
Cohort 2007 + + +

Abt Associates Inc. pg. 20
Exhibit 2.10: Changes in Organizational Development—Lead Organizations
Outcome Increased (+) or Decreased ( - )
Baseline to F1 F1 to F2 Baseline to F2
Is the software on these computers adequate to meet your organization’s needs?
Cohort 2006
Cohort 2007 +
No statistically significant change. ++ /+ Statistically significant positive change at the .01/.05 level. – –/– Statistically significant negative change at the .01/.05 level. Shaded areas (empty cells) reflect data not collected from the 2006 cohort at Follow-Up 2; therefore ―F1 to F2‖ and
―Baseline to F2‖ significance tests were not performed.
b a Significance tests were performed on the medians using a signed rank test.
Source: CEY Outcome Study Baseline, Follow-Up 1, and Follow-Up 2 Surveys.
Note: The sample at baseline and first follow-up includes 81 lead organizations (2006 & 2007 cohorts) and represents the population of 131 lead organizations in 2008 and 2009. The sample at second follow-up includes the population of 31 lead organizations (2007 cohort only) in 2010. ―Baseline to F1‖ denotes changes between baseline and first follow-up; ―F1 to F2‖ denotes changes between first follow-up and second follow-up; ―Baseline to F2‖ denotes changes between baseline and second follow-up.
Lead organizations in the 2006 cohort reported increased capacity on two of the three funding readiness capacity measures. Specifically, more 2006 cohort lead organizations had a fund development plan and financial management procedures at F1 compared to baseline. There was also an increase in the number of lead organizations with written strategic plans. The lead organizations in the 2007 cohort reported two significant IT management capacity changes: more had adequate computers, and more had adequate software to meet their organizations’ needs. Four of the significant changes reported by the lead organizations in the Organizational Development domain represent declines in capacity. The number of lead organizations seeking or obtaining revenue from the federal government decreased for the 2007 cohort, organizations’ total revenue decreased (for the 2006 cohort only, between baseline and F1), the number of organizations conducting performance reviews for volunteers decreased within the 2006 cohort, as well as the average number of paid full-time staff members for this cohort. Results of the joint tests for lead organizations
The joint tests in all four capacity domains were not supportive of the statistically significant changes reported by the lead organizations. This means that the statistical significance of particular items may have been due to chance.
Exhibit 2.11: Results of the Joint Tests for All Domains (Lead Organizations)
Capacity Domain Significance
Program Development (6 measures)
Community Engagement (10 measures)
Leadership Development (12 measures)
Organizational Development (47 measures)
No statistically significant change. + Statistically significant positive change at the .05 level.
Findings for Subgroup Analysis
In order to determine if the effects of the CEY program differed across various types or groups of organizations, we conducted three subgroup analyses. Subgroups were defined by baseline characteristics that might be expected to be associated with differences in outcomes:

Abt Associates Inc. pg. 21
Partnership Size: Whether the organization belonged to a ―small‖ (five or fewer partners) or
―large‖ (more than five partners) partnership.
New or Existing Partnership: Whether the organization belonged to a ―new‖ or ―existing‖
partnership when CEY funding was received initially, as reported by the lead organization.
Program Cohort: Whether the organization belonged to the 2006 or 2007 grant year cohort. For each subgroup analysis, organizations were grouped into two groups based on the above characteristics. The subgroup analysis assessed whether the capacity changes were larger for one of the subgroups compared to the other (e.g., small or large; new or existing). There were very few differences in capacity growth between these subgroups. The absence of significant findings does not mean that capacity change did not occur for organizations in these subgroups; it merely indicates that there was no difference in the rate of change between the groups compared. Because there were few differences for the subgroups, details regarding the procedures used to conduct the subgroup analyses and results of all analyses are omitted here; they are available in the companion CEY Evaluation Technical Report.
Abt Associates Inc. pg. 22
Chapter 3: CEY Partnership Capacity
An important goal of the CEY grant program was to build the sustainability and effectiveness of community partnerships to better meet the needs of America’s at-risk youth. Specifically, the intent was to combine capacity improvements of individual partner organizations and partnership building activities to improve the capacity of the partnership as a whole. Each partnership decided the specific activities in which to partake during the three-year grant period, but these generally consisted of partnership meetings, one-on-one technical assistance, and group training sessions. The CEY evaluation examined partnership capacity with two methods: a short series of survey questions,14 and a multi-case study of a subset of partnerships from the 2007 cohort. The survey questions assessed both individual organizational capacity change (presented in Chapter 2) and partnership capacity change. As described in Chapter 1, the case study involved on-site visits, observations of partner interactions, and reviews of documents at 10 partnerships. The findings from the survey are presented first, followed by the case study. Survey Results
The partnership capacity domain consisted of 10 measures for lead organizations, and 16 for partners. The measures are grouped into the following areas as follows:
Leadership Development (5 measures for partners) Shared Mission and Objectives (4 measures for lead organizations; 5 for partners) Communication (1 measure each for both lead organizations and partners) Action Planning (3 measures each for both lead organizations and partners) Sustainability Planning (2 measures each for both lead organizations and partners)
The CEY evaluation defined Leadership Development in the partnership context as the building of trust and relationships among leaders within each organization and across staff. The five survey items in this area were only answered by staff at partner organizations, who assessed the lead organization on trust and relationship building. Items in the remaining four areas were generally asked of both lead organizations and partners. Shared Mission and Objectives included developing and understanding a clear, inspiring, shared purpose central to the work of partnering organizations. Communication was measured by one item that asked whether participating in the CEY partnership led to better communication and working relationships among participating organizations. Action Planning was defined as the outlining of tasks that needed to be achieved, including a timeline by which the tasks would be achieved and the entity responsible for completing each task. Lastly, Sustainability Planning involved creating a plan to continue the partnership past the three-year grant cycle. Partners reported three positive increases in partnership capacity—increasingly competent lead organizations, a shared mission, and understandable partnership goals. They also reported decreases
14 The survey questions were embedded in the same instrument used to measure organizational capacity.

Abt Associates Inc. pg. 23
in capacity, indicating they perceived the lead organizations to be less even-handed and dependable over time and that the partnerships were less likely to have sustainability plans at F2 than at Baseline. For lead organizations, two items showed statistically significant changes—the adoption of partnership mission statements and the decreasing likelihood that the CEY partnerships would continue past the three-year grant cycle. These two items seem to indicate opposing trends, with the mission statements indicating partnership cohesion and the lead organizations’ increasingly negative view of sustainability indicating partnership dissolution. The general themes of initial partnership cohesion and organization around a shared mission coupled with limited prospects for partnership sustainability are also supported by the results of the longitudinal case study. However, because the joint test was not supportive of overall change in the partnership capacity survey domain, the survey results should be interpreted with caution. Case Study Results
The CEY evaluation offered a unique opportunity to study the development of community partnerships over the three-year grant period, an aspect that distinguished the CEY program from previous capacity building efforts within the Compassion Capital Fund. The evaluation design included a longitudinal case study to provide an in-depth and nuanced look at how the partnerships were structured, how they operated, and the extent to which the partners worked collaboratively toward shared goals. Annual visits to selected partnerships provided a chance to observe and document changes over time. Case Study Methodology
Ten grantees and their partner organizations from the CEY grants awarded in 2007 were selected to participate in a longitudinal case study. The grantees were purposively selected to include a range of geographic locations, partnership sizes, and organization types. Partner organizations across the 10 grantees ranged from small, newly formed all-volunteer organizations to larger, more experienced organizations such as a local YMCA and Catholic Community Services organizations. The selected partnerships are not a representative sample of the 2007 grantees. Therefore, the information presented here about these partnerships cannot be generalized to all CEY partnerships. Study staff visited the partnerships at or near the conclusion of each grant year. These visits lasted from one to three days, depending on the number of partner organizations. During the visits, study staff met with the leadership and key staff and/or volunteers involved in the CEY grant for each lead and partner organization, and attended partnership meetings and/or training events. Interviews with staff from the lead and partner organizations were guided by semi-structured interview protocols so that the same questions were asked of respondents across the partnerships, while allowing study staff to probe and follow up on issues and topics especially pertinent to a specific organization. Interview topics were generally the same for lead and partner organizations and generated data about how the lead organization and its partners worked together, how they viewed their partnership, and ways in which they cooperated and joined together for mutually beneficial activities. Specific topics included: staff roles and responsibilities for the CEY-funded activities,

Abt Associates Inc. pg. 24
partnership composition (including why and how new partners were added or left the partnership), communication mechanisms and the agendas of meetings and training events, decision making processes, descriptions of the capacity building activities for each organization, and the successes and challenges of the partnership. These data were coded and analyzed, and from this patterns and themes emerged. Attributes of CEY Collaborations
A literature review on partnership development complemented analysis of the data gathered during the annual visits. A useful concept from the literature pertained to partnership classifications. These established classifications categorize partnerships based on the extent of collaboration and stage of group development. Higher levels of collaboration and group development are not necessarily better or desirable, because organizations can benefit from collaborations at any level and different types of collaborations are appropriate to meet different objectives. The literature describes various dimensions of partnerships that can be used to place partnerships on a continuum of collaboration. These dimensions include interpersonal communication, leadership and decision making, and the strategies and tasks used by the partnership to accomplish common goals. Based on the literature, after the second round of visits study staff created the ―CEY Partnership Capacity Continuum‖ (see Exhibit 3.1 on page 30) to provide a rubric or categorization system by which to describe the 10 CEY partnerships.15 The CEY Partnership Capacity Continuum categorizes partnerships into four general types of collaborations: Network, Support Group, Alliance, and Coalition.16 These types differ in the level of collaboration—the extent of coordination, resource sharing, and mutual benefits to partners. Networks represent lower levels of integration, and partnerships in this category predominately focus on exchanging basic knowledge about each other’s organizations. In comparison, collaborations with higher levels of integration (Support Group, Alliance, and Coalition) show progressively more trust, communication and joint decision making to accomplish joint goals, projects or activities. The CEY Partnership Capacity Continuum describes each type of collaboration along five dimensions: 1) Partnership Purpose, 2) Inter-Organizational Communication, 3) Roles and Decision Making, 4) Focus of Capacity Building, and 5) Joint Services/Product. For each of these dimensions, the CEY Partnership Capacity Continuum provides a description or benchmark of what that aspect of the partnership looks like for each type of collaboration. Each partnership was assessed on all five dimensions. These assessments were used to categorize the ten partnerships as one of the four types of collaboration along the continuum. The Continuum offers a framework for thinking about types of collaboration among partners. The study team designated the collaboration type after analyzing case study data from the second and third visits. Study staff examined the descriptions of the five dimensions for each collaborative type and made a judgment about the level at which each partnership operated. Although it is not possible to 15 E.g., Gadja, 2004
16 The literature includes a fifth category—Merger. This category has been omitted from the CEY Partnership Capacity Continuum as mergers are beyond the scope of the CEY grant.

Abt Associates Inc. pg. 25
place partnerships on the continuum definitively based on these data, the exercise provides insight into the attributes of CEY partnerships at different levels of collaboration. Type of Collaboration
The majority of the CEY partnerships operated at the Network or Support Group level, with four in each group. Partnerships at the Network level experienced little integration of activities or resources, but provided an important opportunity for partners to establish general knowledge of other organizations working in their geographic and/or issue area. These partnerships made few or no high-stakes decisions, and partnership and roles and responsibilities were loosely defined. The Support Groups were characterized by higher levels of trust, knowledge, and communication. These partnerships met to provide a sounding board to share experiences, provide advice, and provide knowledge and material assistance. Two CEY partnerships were designated as Alliances. There was a considerable difference in structure, group dynamics and group capacity building efforts between the two earlier collaboration types and partnerships functioning as Alliances. At this level of integration, partner organizations had a greater level of knowledge of and trust in one another, and they worked towards a common goal. Over the CEY grant period the CEY partnerships did not transition from one type of collaboration to another. Those that operated as a Network in Year 2 continued as a Network in Year 3. Though none of the partnerships moved along the continuum, some changes in how partners and lead organizations interacted were observed. The next section of this chapter describes key features of the partnerships associated with each of the five dimensions on the Continuum and describes changes in these dimensions over time. The final sections describe cross-cutting challenges and practices that may contribute to positive partnership development. Partnership Dimensions
Partnership Purpose ―Partnership Purpose‖ assesses the function of the partnership as a unit; it addresses the
partnership’s underlying objectives. Nine of the 10 CEY case study partnerships were created in response to the CEY grant opportunity. In the first year, these newly formed partnerships took steps towards coalescing as a unit. Six of the nine developed a written mission statement for their CEY partnership (a seventh wrote a mission statement in Year 2). In Years 2 and 3, however, the key staff involved with CEY did not refer to their partnership’s mission statement during discussions with the research team nor did the mission statements appear to guide partnership activities. By Year 3, staff from the majority of the partnerships reported that they viewed the purpose of their CEY grant and their partnership mainly as a vehicle for improving the capacities of their own organizations, corresponding to the Network or Support Group collaboration types. A staff person from a lead organization expressed this view in describing the partnership’s overarching goal:

Abt Associates Inc. pg. 26
A group of like-minded people who care about youth…working to build their individual organizations so that they can better serve their clients…
Inter-Organizational Communication ―Inter-Organizational Communication‖ reflects what partners gain from partnership dialogue,
who the prime communicators are, the types of information exchanged, and the frequency with which the information is exchanged.
Important to the development of open and fluid communication was regular attendance by a consistent group of individuals at partnership meetings. Meeting frequency varied across the grantees. In the first year, six partnerships met monthly; one met twice a month; one met quarterly; one lacked a regular meeting schedule; and one did not meet as a group (other than for training events.) Over time, most kept to their initial meeting schedule but there were a few changes. The partnership that initially lacked a regular meeting schedule instituted monthly meetings in Year 2 and kept to this schedule in Year 3 as well. In the third year, there were three partnerships that did not meet as a group and, one that had met monthly, reduced its meeting frequency to quarterly meetings. In addition to the official meetings, informal communication (by phone, email, and in-person) occurred on a monthly or more frequent basis within all of the partnerships. For the most part, lead organizations continued to initiate most of the formal and informal communication. Common to all CEY partnerships (at all levels of collaboration) was that communications during official CEY meetings included information about grant logistics, such as updates on spending and schedules for capacity building activities such as future training events, and making partners aware of reporting deadlines. There were also differences, however, in the content of communication, with exchanges among partners serving three different purposes. First, for the four partnerships at the Network level, dialogue among partners helped expand knowledge of other partners’ services and who they served. Staff from two partnerships reported improved knowledge of each other’s programs as a result of a practice that began in Year 2, in which each partner hosted the partnership meeting at its own location. The host partner led a tour of their facility and/or made a short presentation on its services. Second, meetings and/or informal communication for the four partnerships at the Support Group level provided a forum for organizational directors to open up about problems and issues they were having within their own organizations. Other partners brainstormed possible suggestions and ideas. This group problem solving was typically limited to strengthening individual organizations, rather than focusing on the partnership itself. Third, the two partnerships operating at a higher level of integration extended their dialogue to include conversations about collaborating on services and joint activities. In a majority of partnerships at all levels on the Continuum, positive relationships and trust increased over the three years. However, problems surfaced in two partnerships. In one, delays and other problems in receiving the CEY monetary sub-award in the second and third years eroded partners’ trust in the lead organization. In another, conflict that had simmered between two partners early on

Abt Associates Inc. pg. 27
erupted mid-way through the third year and this had a ripple effect on the partnership’s ability to continue to work together. Roles and Decision Making17 ―Roles and Decision Making‖ reflects the extent to which roles are clearly defined and specific,
the extent to which decision making is shared, and the level of decisions addressed by the partnership.
Roles and decision making did not appear to change over the course of the three-year grant period. All case study partnerships adopted a single-lead structure in which the lead organization that applied for the grant and served as the official federal grantee handled the grant’s administrative responsibilities. The lead also controlled and coordinated decisions that affected the group. This leadership role was usually handled by the executive or program director of the lead organization. Key decisions such as the number of partners, meeting frequency, and amount and process for disbursing financial sub-awards were established by the lead organization at the start of the grant, often reflecting the approach presented in the original grant proposal. Most partnerships made minimal decisions as a collective. Of those made, decisions tended to be on low-stakes topics (e.g., selecting group training topics and scheduling decisions). As a result, the majority of CEY partnerships fell into the Network level on roles and decision making. One practice among those at the Support Group or Alliance level was the establishment of a core leadership team (comprised of the executive directors/program directors of the lead and all partners) that met regularly. The lead organization also unilaterally coordinated capacity building efforts by selecting and scheduling consultants who led group training and provided one-on-one technical assistance. In seven partnerships, staff from the lead organization or a consultant selected by the lead organization conducted an assessment of partners’ capacity levels and helped partners prioritize their own needs. Only two of these partnerships repeated the assessment on an annual basis. In five partnerships, the lead organizations’ own staff provided some individualized capacity building assistance or group training to partners. In Years 2 and 3, three lead executive directors expressed a desire to share ―lead‖ responsibilities with partners or rotate the leadership role. One tried to delegate responsibilities for coordinating and planning meetings and some joint training activities. However, these three reported that partners were reluctant to take on additional responsibilities.
17 In the literature, these two characteristics are considered separately, but because the CEY grant specifies
many of the roles and responsibilities that must be assumed by the lead agency (e.g., grant reports, dissemination of funds, partnership meetings), there were few differences among roles across all partnerships. Further, the collaboration theory literature shows links between roles and decision making;
thus for the CEY Continuum rubric, the two were combined.
Abt Associates Inc. pg. 28
Focus of Capacity Building ―Focus of Capacity Building‖ is defined as the mix and purpose of individual technical
assistance, group trainings, and/or equipment purchases between that directed primarily to benefit individual organizations and that intended to address the capacity of the partnership.
The CEY Program contains the dual goals of increasing the capacity of the individual organizations in the partnership, as well as the partnership itself. The case study partnerships largely focused capacity building on strengthening individual organizations (placing them at the Network level). Five partnerships regularly employed group training—but in these instances, meeting as a group was incidental to the primary purpose of enhancing the capacity of the individual organizations. Four partnerships at the Support Group or Alliance levels engaged in group activities designed to simultaneously enhance the capacity of individual organizations and create a shared group identity. These activities included:
Spending time as a group at an off-site conference or CEY-specific group training workshop. For instance, in one partnership the executive directors of the lead and partner organizations traveled out of town for a day-long seminar on leadership skills. While the content of the training dealt with issues associated organizational capacity, the time spent together built camaraderie and deepened relationships among the organizational leaders.
Group networking events that included the Boards of Directors of the lead and partners organizations. One partnership held an evening reception for board members of the CEY organizations, which was mostly social in nature, and intended for board members to network and get to know each other.
Jointly developing a new web site to enhance the partnership’s capacity to promote its training program. The web site provides information about the partnership, and a schedule and registration system for upcoming training events provided by the partnership.
Joint Services/Product
―Joint Services / Product‖ reflects the extent to which the group is engaged in newly established and jointly-provided services or products.
In Year 1, lead organizations at eight of the nine newly established partnerships contemplated engaging in cross-agency referrals, launching a new service that would be jointly funded or staffed, or a media campaign that would promote the partnership. By Year 3, the majority of the partnerships had achieved success in this arena. Three partnerships were placed at the Support Group level because new knowledge about the services that partners provide combined with new relationships among staff led to cross-agency referrals and/or a willingness to share resources (e.g., a van) that had not existed previously. Four others were designated as Alliances as they began providing (or improved) a new service to the community that was coordinated and/or funded jointly by all or a subset of the partners. For instance,

Abt Associates Inc. pg. 29
a new drop-in program for teenagers was started and supported by two partners; one partner provided space for the program while another one staffed the program. In another partnership, all partners and the lead worked together to create a child sexual abuse prevention program. The lead and all partners contributed both financially and with staff time to bring this joint initiative to fruition. Cross-Cutting Challenges in Partnership Development
Based on multiple interviews with program staff in the lead and partner organizations, it appears that a lack of time and limited commitment to the partnership were key factors that impeded partnership development. There was a tension between the time required for at least one person to attend regular partnership meetings, attend group trainings, and work with a technical assistance consultant and the time needed to run the organization and/or provide direct services to clients in need. This was especially difficult for many of the smaller, less established organizations that operated with few, if any, paid staff. In addition to attending meetings and group training workshops, capacity-building endeavors within an individual organization or developing new joint activities required considerable time and effort to carry out. As an executive director at one of the partner organizations, commented:
For every hour of coaching it takes about three hours to be able to institute the changes.
In the third year, several leaders and staff reported that they struggled to sustain the initial level of effort. Lead organizational staff spoke about poor attendance at meetings or training events. When asked, partners attributed spotty attendance to competing priorities and limited staff, as well as the belief that there was not enough of a ―pay off‖ for their efforts. One lead facilitator described this struggle to continue to engage staff from the partnering agencies:
By year three I was seeing some fatigue…how do I help them grow in capacity in such a way that they don’t lose energy…so that[s] going to be a lot of work….year one, they were just so excited about the money….Year two they were still pretty much [on board]…and then this last year was kind of like, “Okay. How much work would that be?
Promoting Positive Partnership Development
The information gained through the case study illuminated factors and practices used by some leaders or partnerships that may have contributed to their ability to overcome challenges. Engage partners with basic capacity already in place (i.e., not start-up organizations).
Lead organizations consistently cited low baseline capacity amongst partner organizations as a challenge in building strong partnerships. Many of the partners that were newly formed organizations needed to concentrate their resources and time on developing their own individual organizational capacity and ensuring their survival, and had little time or ability to contribute to building the larger partnerships’ capacity. There were some partners that had few, if any, paid staff. Lack of paid staff made attendance at meetings, group training, and other partnership capacity building responsibilities difficult.

Abt Associates Inc. pg. 30
Assign a skilled facilitator.
Partners attributed efficient, engaging, and productive meetings to the lead facilitator’s organizational and personality traits. Skilled facilitators from the lead organization were also described as able to mentor smaller, less experienced partner organizations. The personal skills of accomplished facilitators created a positive environment and provided a clear explanation of the purpose and benefits of capacity building for the partner organizations. Facilitators for the lead organizations could, in some cases, motivate partner staff to keep working on capacity building despite other pressing needs.
One of the big things that is a challenge for this group, and maybe it’s a challenge everywhere, is the things that are important aren’t always urgent …
Create opportunities for leadership team building.
Executives from lead and partner organizations reported that spending time together, away from their offices and regular work-day interruptions, renewed their focus on CEY partnership and increased camaraderie among them. Leaders reported that they looked forward to attending a conference or day-long (or two-day) training workshop with the other CEY leaders at a location away from their workplace, and that these experiences promoted group cohesion/identity. Spending an extended period of time together also allowed for more in-depth training. Another related practice was holding meetings over lunch, which allowed for more informal conversation and built camaraderie.
We all liked the retreat and felt like it was really successful to really dedicate time instead of steal a moment.
Key persons assume the role of the partnerships’ advocate or “champion.”
Taking on the visioning, administrative, and ―cheerleading‖ tasks required a big effort from directors or managers of lead organizations, but without it partnerships were not as likely to develop a rationale or group support for the partnership. Summary
In the beginning of the CEY grant, the 10 partnerships shared a sense of hope related to receiving CEY assistance and coming together as a group. By Year 3, the majority of these groups had not developed into cohesive partnerships that expected to continue beyond the CEY grant period. Despite limited sustainability of the partnerships as a whole, the CEY grant resulted in new relationships and new services or referral agreements that can provide a foundation for future collaborative efforts.

Abt Associates Inc. pg. 31
Exhibit 3.1: CEY Partnership Capacity Continuum Type of
Collaboration Purpose
Inter-Organizational
Communication Roles and Decision Making Focus of Capacity Building Joint Services/ Product
Network Establish general knowledge of partner organizations in order to build the foundation for future collaboration, identify a base for support and explore interests
Communication primarily to
establish knowledge of other
organizations’ activities
Loosely defined roles
Minimal decision making as a
collective on low-stakes
concerns
Capacity building funds used
primarily for individual material
capacity building and
partnership team building
activities
No joint services
Support Group Work together as a sounding board to ensure better operation of individual organizations and ensure tasks are done
Dialogue-based communication
used to share ideas, knowledge
and advise on organizational
management
Communication shows new
levels of trust and
organizational knowledge
Leadership team and individual
roles are being constantly
defined, re-defined and
established
Joint decision making is on low-
stakes topics
Capacity building funds used
primarily for individual
organizational capacity building
Funds also used to establish a
group identity through group
training sessions
Cross-partner referrals
Willingness to provide
assistance to other
organizations
Alliance Work together on a new and common goal by sharing resources and/or knowledge in a formalized relationship
Communication through
established channels and a
core central body focused on
joint activity as well as idea and
knowledge exchange
Communication begins to show
evidence of group problem
solving and higher levels of
trust
Roles clearly defined and
decision making mechanism in
place
Central group of
representatives make
meaningful joint decisions
Capacity building funds used for
individual capacity building,
group trainings and capacity
building for joint goal
Share resources to address
common goal by creating or
supporting something new
Coalition Identify and draw on individual organizational assets to strengthen common short-and long-term goal(s)
Communication is regular and
focused upon information
sharing, group decision making,
project planning and problem
solving
Communication is characterized
by mutual trust
Shared and delegated roles and
responsibility
All members have a voice in
decision making which affects
partnership activity and capacity
building
Leadership capitalizes upon
diversity and individual
organizational strengths
Capacity building funds are
used to build the capacity
needed to achieve group
goal(s)
Training sessions build the
capacity of the partners and
partnership as a unit
Combined resources to achieve
both short and long term goal(s)
Provide collaborative service(s)
a This assistance included sharing a van, attending another partner’s event, and lending office space for a particular event.

Abt Associates Inc. pg. 32
Chapter 4: CEY in Context
Through the CEY program, ACF aimed to build the capacity of partnerships of NPOs that address issues of gang violence, youth violence, or child abuse and neglect. The CEY model was innovative on a number of fronts, including its focus on partnerships of organizations, strengthening organizational and partnership capacity simultaneously, and the funding of a lead organization within each partnership as the organization responsible for the grant. These program characteristics set this initiative apart from previous Compassion Capital Fund (CCF) capacity building programs. Other programs either utilized intermediaries to provide capacity building assistance to other organizations (Demonstration Program) or provided funding for capacity building directly to individual non-profits (Targeted Capacity Building Program). In this chapter we provide a summary of the CEY outcome evaluation results and discuss how these results compare with the results of the other CCF program evaluations. The chapter concludes with a brief discussion of suggestions for future research in the area of organizational capacity and considerations for researchers and evaluators who are working in this field. Summary of CEY Evaluation Findings
The CEY evaluation results indicate that organizations participating in CEY improved across multiple domains of organizational capacity. There were increases in the number of lead and partner organizations reporting the presence or improvement of specific capacity indicators in many of the capacity domains. Partner organizations reported some statistically significant increases in all four capacity domains, and lead organizations reported some increases in three domains. However, as indicated in Chapter 2, because a large number of outcomes were tested, we have the most confidence that the changes did not occur by chance only for partners and only in the Program Development and Community Engagement domains. Many of these changes were achieved during the first two years of their involvement with the CEY program, and almost all were sustained in the third year of the program. Most lead organizations and their partners reported relatively high levels of partnership capacity at baseline, with little change over time. However, many indicated that their CEY partnerships were not likely to continue to function beyond the grant period. Despite this, nearly all of the organizations’ staff interviewed as part of the case study believed that participating in the CEY partnership helped them build valuable networks and connections with other service providers in their communities. The ―capital‖ contained within these networks has the potential to improve services to youth in the CEY communities through an increase in joint services and referrals across this web of service providers. CCF Programs and Evaluations
The Compassion Capital Fund was created in 2002 through a congressional appropriation to help nonprofit organizations enhance their ability and effectiveness in providing social services to those most in need and to partner with the federal government. ACF used the fund to support three distinct grant programs between 2002 and 2009: the Demonstration Program, the Targeted Capacity Building Program, and the CEY Program. Seven rounds of Demonstration Program grants were awarded between 2002 and

Abt Associates Inc. pg. 33
2009; Targeted Capacity Building Program grants were awarded annually between 2003 and 2007 and two rounds of CEY funding were awarded in 2006 and 2007. While each program’s goal was to increase organizational capacity, they had distinct programmatic differences. As discussed in prior chapters, the CEY program grants were awarded to lead organizations within a partnership of community organizations. The lead organization was administratively responsible for the CEY grant and typically determined how funds would be allocated between partners as well as the range of activities that would support the dual goals of increasing individual partner capacity as well as partnership capacity. The lead organizations and partners all typically worked in the same community, provided services to youth, and agreed to work together over a three year period to better meet the needs of the youth in their community. Under the Demonstration program ACF funded intermediary organizations to provide capacity building services to individual nonprofit organizations. The intermediaries provided group training sessions as well as customized one-on-one technical assistance and financial sub awards. The manner in which intermediaries identified or selected NPOs with which to work varied as did the length of time they worked together. In some instances the intermediaries were geographically located in the same city, town or region as the NPOs; however, this was not a grant requirement. Finally, the Targeted Capacity Building program provided small grants directly to NPOs. The maximum one-time grant was $50,000 and the funds were to be used to increase the grantees’ organizational capacity in tangible ways to improve their program effectiveness and sustainability, access funds from diverse sources, or emulate model programs and best practices. Grantees also could use the grant funds to purchase training or technical assistance to improve organizational capacity if they wished. Each of the CCF programs has been evaluated. In addition to the current CEY evaluation, Abt Associates and its partner Branch Associates completed a retrospective evaluation, an outcome evaluation, and an impact evaluation of the Demonstration program (Abt Associates & Branch Associates, 2007, 2010a, 2010b, 2010c). Branch Associates also completed a retrospective outcome evaluation of the Targeted Capacity Building Program (Fink & Sipe, 2008). Each of these evaluations used similar capacity domains and measures to assess changes in NPOs’ organizational capacity; only the CEY evaluation measured changes in partnership capacity. While the organizations that received assistance from the three CCF programs were different in many ways there were key similarities that make it reasonable to compare their results. These similarities include being direct service providers, the majority having 501(c)3 status or being incorporated and hosted by a 501(c)3 organizations, and being in existence for over a decade (the average organizational age for NPOs in each study was at least 14 years). While the similarities in the instruments for measuring organizational capacity as well as the reasonably comparable NPO populations provide a basis to discuss outcomes across the three grant programs, the programmatic differences and unique evaluation designs (i.e., impact versus outcome or retrospective evaluation) do limit our ability to make definitive comparisons. Because of this, the following discussion will describe the different outcomes without speculating whether one program design was better than the others.

Abt Associates Inc. pg. 34
CCF Evaluations
ACF supported three separate evaluations of the Demonstration program: a Retrospective Study (2006-2007), an Outcome Study (2004-2008) and an Impact Study (2006-2009). Like the Demonstration program retrospective study, the Targeted Capacity Building Program evaluation (2007) relied on a retrospective survey, asking NPOs to report on the capacity improvements they experienced as a result of CCF assistance several years after the grants through which services were provided or obtained had ended. Across both retrospective studies, over 90 percent of NPOs surveyed perceived that their organizational capacity had improved as a result of the CCF grant. They believed the assistance was useful and important to their overall development as organizations. Specifically, they reported increased capacities such as improved level or quality of services provided, improved community linkages and partnerships, and an ability to serve more clients. The outcome evaluations of the Demonstration program and the CEY program both used a single group pre-post design. NPOs were asked to complete an initial survey to establish their baseline organizational capacity. Then, they were asked to complete at least one follow-up survey to assess how their capacity might have changed after or while receiving CCF assistance. NPOs in the Demonstration program outcome evaluation completed one follow-up survey 15 months after assistance began; NPOs in the CEY evaluation completed two follow-up surveys, one about 18 months after assistance began and another at about 30 months. The pre-post design allowed for a more objective assessment of changes in capacity than the recall (retrospective) method used in the prior studies (although both relied on self-reported information). With the pre-post design, we learn whether significant changes in organizational capacity were reported to have occurred during the time that NPOs were receiving capacity building assistance (though the design does not determine whether the CCF program or other external factors caused the changes). Survey results showed that NPOs receiving assistance through the Demonstration and CEY programs did report significant changes in capacity across most domains after receiving capacity building assistance. Demonstration program NPOs reported a greater number of significant changes within each domain than CEY NPOs. The difference in the number of significant changes reported might be attributed to a number of factors including:
The fact that Demonstration program NPOs were focused solely on building their own organization’s capacity, while CEY organizations were simultaneously focusing on both individual capacity as well as partnership capacity building.
The fact that CEY lead organizations were focused on building their own capacity as well as that of their partner organizations, which may have made them less effective than Demonstration program intermediaries at increasing capacity across a broad array of areas.
The lack of clear definitions and approaches for partnership capacity building in the field may have led to some inefficiencies and diversion of energy that might otherwise have been invested in capacity building efforts.
Any of these factors may have may have diverted CEY NPOs’ attention from organizational capacity building and limited the depth of changes that were possible. Further research, discussed below, is needed

Abt Associates Inc. pg. 35
to more clearly assess which of these factors, or others, contributed to the observed differences in the number of positive outcomes achieved in the two programs. The CEY evaluation with its two rounds of follow-up surveys was able to measure the reported sustainability of the changes reported. By asking the same questions at the second follow-up (about 30 months after the baseline survey and about 12 months after the first follow-up survey), we were able to show that NPOs reported maintaining most of the capacity increases they reported at first follow-up. This type of analysis was not possible within any of the other CCF evaluations, which had only one follow-up survey. In contrast to the other study designs, the Demonstration Program Impact Study was designed to assess whether the Demonstration program caused changes in organizational capacity. The Impact Study used a rigorous evaluation design in which similar NPOs were randomly assigned to either receive Demonstration program capacity building assistance or to be part of a control group. By assuring that the two groups were similar at baseline, the evaluation team was able to compare both groups of NPOs’ organizational capacity reported 15 months later to assess whether the Demonstration program did in fact cause increases in NPOs’ organizational capacity beyond what similar organizations in the control group achieved. Results of the evaluation showed significant differences between the two groups of NPOs. NPOs that received assistance from a Demonstration program intermediary increased their capacity in each domain measured at a higher rate than control group NPOs. Overall, the multiple evaluations have found positive changes in organizational capacity reported by NPOs. While only the Demonstration Program Impact Study provides a sound basis for attributing the changes reported to CCF funded services, it also provides some confirmation of the generally positive findings within the retrospective and outcomes studies. The CEY Evaluation showed that an innovative variation on the Demonstration program model is promising but may need some refinement to promote sustained partnerships, greater partnership capacity and positive changes in a greater range of individual organizational capacity indicators. While much has been learned through these evaluations, many interesting and important research questions remain. Some questions that arise and potential directions for future research are discussed below. Directions for Additional Research
The mixed findings from the CEY evaluation suggest that more research is needed on the mechanisms that drive capacity change in a partnership context. Research questions related to that topic and others of interest and potential areas of investigation are discussed below. How challenging was the dual focus on organizational and partnership capacity for CEY grantees? To what extent does this influence the ability to meet either or both capacity building goals?
The CEY program seemed to be more successful at increasing the capacity of individual organizations than the capacity of the partnership as a whole. There are several potential reasons for this difference, including that 1) lead organizations may have entered into the CEY program with more experience or knowledge about providing individual organizational capacity building than building partnership capacity; 2) focusing on two types of capacity building simultaneously was overly challenging given that
Abt Associates Inc. pg. 36
lead and partner organizations had a limited amount of resources to dedicate to capacity building; and 3) because partnership capacity was less clearly defined in the grant announcement, the lead organizations may have decided to focus on individual organizational capacity outcomes and spend less time and resources working on approaches to build partnership capacity. Qualitative investigation of these questions could lend useful information to funders who may be considering a similar model of partnership capacity building. Are there specific partnership characteristics that lend themselves to successful partnership capacity building efforts? Is there a minimum level of capacity needed to engage in partnership development?
The CEY case study component illuminated an area worth more exploration and study: the extent of variation among partnerships and its relationship to partnership development. For example, respondents in some lead organizations suggested that novice partner organizations had few resources to devote to anything but keeping their own programs up and running. When partners vary by level of experience and capacity, future research could use multi-level modeling techniques to examine the effects of the partnership context on partnership capacity gains. This type of analysis could capture important information that is not revealed by analyzing data at the individual organization level, and identify the extent to which partnership characteristics explain changes in the outcome of interest. Evaluators could assess whether partnerships composed of mostly higher capacity organizations are more effective at gaining partnership capacity than those composed of mostly lower capacity organizations. It may be that there is a minimum level of capacity needed to engage in partnership development work. This research question could also be explored with qualitative techniques designed to elicit NPO staff members’ understanding of what it takes to build partnership capacity. How closely is the focus of capacity-building efforts linked to the areas in which capacity is gained?
In order to capture the broad scope of potential capacity areas on which organizations could choose to focus, both the Demonstration program and CEY evaluation surveys included a comprehensive array of capacity indicators. This means that organizations were evaluated on areas of capacity that were not necessarily the focus of the support that they received. As a result, the evaluations may have underestimated the level of capacity change that occurred because NPOs were evaluated in areas where they did not try or need to build capacity. In future evaluations, a deeper understanding of each NPO’s intended capacity improvements would help to refine the analysis of achieved outcomes. For example, in a broad-focused capacity-building initiative (i.e., one that includes NPOs with different missions, and different capacity levels), one could measure in what capacity building activities organizations actually engaged and analyze the strength of the association between these focus areas and the areas in which capacity was actually gained. Alternatively, future funders of capacity building programs could narrow the focus of the organizational capacity building to specific types of NPOs, provide a narrow set of capacity-building services, and evaluate all organizations on the same criteria. What are the long-term effects of capacity building on service delivery and client outcomes?
The general theory of change underlying the CCF funding is that service providers with stronger organizational capacity and/or involvement in a network of community providers will provide higher quality services that will ultimately improve outcomes for those in need. None of the CCF evaluations were designed to address this longer-term outcome of improved participant outcomes. To answer this research question, future studies of capacity building could use an experimental design, if feasible, to randomly assign NPOs to receive capacity-building assistance or to a control group that would not receive

Abt Associates Inc. pg. 37
such assistance. After an appropriate length of time after which it would be reasonable to expect capacity improvements to take hold in the organizations, comparisons of client outcomes between the two groups of NPOs could provide evidence of the effects of capacity building on client outcomes. Because client outcomes can vary considerably across disparate NPOs, such studies would need to be well structured to allow for reasonable comparisons (i.e., include NPOs with common missions and intended client outcomes). Future evaluations designed to investigate the outcomes further down the outcome chain would contribute to an understanding of the extent to which the ultimate goal of this kind of investment—improved client outcomes—is achieved.

Abt Associates Inc. pg. 38
References
Abt Associates Inc. and Branch Associates Inc. (2007). ACF-OPRE report: Findings from a retrospective survey of faith-based and community organizations (FBCOs): An assessment of the Compassion Capital Fund. Washington, DC: U.S. Department of Health and Human Services, Administration for Children and Families, Office of Planning, Research and Evaluation.
Abt Associates Inc. and Branch Associates Inc. (2010a). ACF-OPRE report: Outcome report: Building non-profit capacity and community partnerships: Interim findings from the Communities Empowering Youth Evaluation. Washington, DC: U.S. Department of Health and Human Services, Administration for Children and Families, Office of Planning, Research and Evaluation.
Abt Associates Inc. and Branch Associates Inc. (2010b). ACF-OPRE report: Assessing changes in nonprofit capacity: Outcome study of the Compassion Capital Fund Demonstration Program. Washington, DC: U.S. Department of Health and Human Services, Administration for Children and Families, Office of Planning, Research and Evaluation.
Abt Associates Inc. and Branch Associates Inc. (2010c). ACF-OPRE report: Improving capacity among nonprofits: Impact study of the Compassion Capital Fund Demonstration Program. Washington, DC: U.S. Department of Health and Human Services, Administration for Children and Families, Office of Planning, Research and Evaluation.
Austin J.E. (2000). Principles for partnership. Leader to Leader 18:44–50.
De Vita, C.J., Fleming, C., & Twombly, E.C. (2001). Building nonprofit capacity: A framework for addressing the problem. In C.J. De Vita, E.C. Flemming (Eds.), Building capacity in nonprofit organizations (pp. 5–32). Washington, DC: The Urban Institute.
De Vita, C.J., & Fleming, C. (Eds.) (2001). Building capacity in nonprofit organizations. Washington, DC: The Urban Institute.
Fink, B., & Engel, J. (2006). Capacity benchmarking tool: For faith- and community-based organizations. Philadelphia: Branch Associates, Inc.
Fink, B., & Sipe, C. (2008). ACF-OPRE report: An assessment of the Compassion Capital Fund Targeted Capacity Building Program: Findings from a retrospective survey of grantees. Washington, DC: U.S. Department of Health and Human Services, Administration for Children and Families, Office of Planning, Research and Evaluation. February.
Gajda, R. (2004). Utilizing collaboration theory to evaluate strategic alliances. American Journal of Evaluation 25(1):65–77.Greene, W. (2000). Econometric Analysis (4th ed.). Upper Saddle River, NJ: Prentice Hall.
Lasker, R., Weiss, E., & Miller, R. (2001). Partnership Synergy: A Practical Framework for Studying and Strengthening the Collaborative Advantage. The Milbank Quarterly 79 (2): 179-205.

Abt Associates Inc. pg. 39
Leake, R., Green, S., Marquez, C., Vanderburg, J., Guillaume, S., & Garner, V. A. (2007). Evaluating the capacity of faith based programs in Colorado. Research on Social Work Practice 17(2):216-228.
Leviton, L. C., Herrera, C., Pepper, S. K., Fishman, N., & Racine, D. P. (2006). Faith in action: capacity and sustainability of volunteer organizations. Evaluation and Program Planning 29:201–207.
Light, P.C. (2004). Sustaining nonprofit performance: The case for capacity building and the evidence to support it. Washington, DC: Brookings Institution Press.
McKinsey & Company. (2001). Effective capacity building in non-profits. Washington DC: Venture Philanthropy Partners.
Riggin, L., Grasso, P., & Westcott, M. (1992). A Framework for Evaluating Housing and Community Development Partnership Projects. Public Administration Review 52(1): 40-46.
Sagawa, S. (2001). New value partnerships: The lessons of Denny's/Save the Children partnership for building high-yielding cross-sector alliances. International Journal of Nonprofit and Voluntary Sector Marketing 6(3):199–214.
Schuh, R.G., & Leviton, L.C. (2006). A framework to assess the development and capacity of non-profit agencies. Evaluation and Program Planning 29:171–179.
Weesie, J. (1999). Seemingly unrelated estimation: An application of the cluster-adjusted sandwich estimator. STATA Technical Bulletin 52:34–47.
Wohlstetter, P., Smith, J., & Malloy, C. (2005). Strategic alliances in action: toward a theory of evolution. The Policy Studies Journal 33(3):419–442.
Zellner, A. (1962). An efficient method of estimating seemingly unrelated regression equations and test for aggregate bias. Journal of the American Statistical Association 57:348–368.

Abt Associates Inc. pg. 40
Appendix A: Tables of Results

Abt Associates Inc. pg. 41
Exhibit A1: Changes in Leadership Development—Leads
Baseline First Follow-Up Second Follow-Up Significance Tests
Number of
respondents
(N)
Average
or % Yes
Standard
deviation
(SD) Range N
Average
or % Yes (SD) Range N
Average
or % Yes (SD) Range
Baseline
vs. F1
F1
vs. F2
Baseline
vs. F2
Executive Director Development
Did the executive director participate in any training related to management and administration?
Cohort 2006 50 86.8 - - 50 90.8 - - - - - - 4.0 - -
Cohort 2007 31 83.9 - - 31 77.4 - - 31 96.8 - - -6.5 19.4* 12.9*
Did the executive director participate in any training related to fundraising?
Cohort 2006 50 71.4 - - 50 78.1 - - - - - - 6.6 - -
Cohort 2007 31 71.0 - - 31 64.5 - - 31 67.7 - - -6.5 3.2 -3.2
Did the executive director participate in any training related to service and/or technical assistance delivery?
Cohort 2006 50 83.1 - - 50 83.2 - - - - - - 0.1 - -
Cohort 2007 31 74.2 - - 31 71.0 - - 31 74.2 - - -3.2 3.2 0.0
Staff Development
How many paid staff participated in any training related to management and administration?
Cohort 2006 49 21.5 63.5 1-250 50 13.1 32.0 1-160 - - - - -8.4 - -
Cohort 2007 29 18.2 58.4 0-317 31 20.8 63.3 0-350 31 16.1 35.1 0-189 2.5 -4.6 -2.1
How many paid staff participated in any training related to fundraising?
Cohort 2006 50 6.2 11.3 0-34 48 5.6 20.2 0-88 - - - - -0.6 - -
Cohort 2007 29 3.5 5.6 0-25 31 2.2 1.9 0-6 31 8.3 33.6 0-189 -1.4 6.2 4.8
How many paid staff participated in any training related to service and/or technical assistance delivery?
Cohort 2006 50 43.6 115.5 0-431 50 22.6 69.3 0-257 - - - - -21 - -
Cohort 2007 30 30.9 67.3 0-317 31 22.9 44.2 0-175 31 16.7 42.5 0-189 -7.9 -6.3 -14.2*
Volunteer Development
How many volunteer staff participated in any training related to management and administration?
Cohort 2006 28 6.3 19 0-50 31 5.5 15.8 0-40 - - - - -0.8 - -
Cohort 2007 15 2.3 5.6 0-20 18 2.7 6.4 0-20 12 5.7 14.4 0-50 0.4 2.9 3.3
How many volunteer staff participated in any training related to fundraising? a
Cohort 2006 29 7.9 27.2 0-90 32 1.3 4.0 0-11 - - - - -6.6 - -
Cohort 2007 14 3.9 13.3 0-50 18 1.6 4.8 0-20 13 8.2 27.6 0-100 -2.3 6.6 4.3

Abt Associates Inc. pg. 42
Exhibit A1: Changes in Leadership Development—Leads
Baseline First Follow-Up Second Follow-Up Significance Tests
Number of
respondents
(N)
Average
or % Yes
Standard
deviation
(SD) Range N
Average
or % Yes (SD) Range N
Average
or % Yes (SD) Range
Baseline
vs. F1
F1
vs. F2
Baseline
vs. F2
How many volunteer staff participated in any training related to service and/or technical assistance delivery?
Cohort 2006 29 36.5 128.4 0-300 34 50.0 249.3 0-864 - - - - 13.4 - -
Cohort 2007 16 60.0 131.4 0-500 19 28.9 69.6 0-300 13 63.5 94.9 0-307 -31.1 34.6 3.5*
* p-value < 0.05 ** p-value <0.01
Source: CEY Outcome Study Baseline, Follow-Up 1, and Follow-Up 2 Surveys
Note: The sample at baseline and first follow-up includes 81 lead organizations (2006 & 2007 cohorts) and represents the population of 131 lead organizations in 2008 and 2009. The sample at second follow-up includes 31 lead organizations (2007 cohort only) and represents the population of 31 lead organizations in 2010. ―Baseline vs. F1‖ denotes changes between baseline and first follow-up; ―F1 vs. F2‖ denotes changes between first follow-up and second follow-up; ―Baseline vs. F2‖ denotes changes between baseline and second follow-up.

Abt Associates Inc. pg. 43
Exhibit A2: Changes in Organizational Development—Lead Organizations
Baseline First Follow-Up Second Follow-Up Significance Tests
Number of
respondents
(N)
Average
or % Yes
Standard
deviation
(SD) Range N
Average
or % Yes (SD) Range N
Average
or % Yes (SD) Range
Baseline
vs. F1
F1
vs. F2
Baseline
vs. F2
Mission and Strategic Planning
In the past 12 months, has your organization formally assessed its organizational needs/strengths?
Cohort 2006 50 97.4 - - 50 96 - - - - - - -1.4 - -
Cohort 2007 31 93.5 - - 31 100 - - 31 96.8 - - 6.5 -3.2 3.2
Does your organization have a mission statement?
Cohort 2006 50 94.9 - - 50 100.0 - - - - - - 5.1 - -
Cohort 2007 31 96.8 - - 31 100.0 - - 31 100.0 - - 3.2 0.0 3.2
Does your organization have a strategic plan?
Cohort 2006 50 77.5 - - 50 93.4 - - - . - - 15.9* - -
Cohort 2007 31 64.5 - - 31 80.6 - - 31 83.9 - - 16.1 3.2 19.4
Governance and Organizational Structure
Is your organization governed by a parent or umbrella organization’s Board of Directors?
Cohort 2006 50 13.3 - - 50 23.6 - - - - - - 10.3 - -
Cohort 2007 31 16.1 - - 31 19.4 - - 31 19.4 - - 3.2 0.0 3.2
Is your organization governed by an Advisory Panel?
Cohort 2006 49 3.6 - - 50 8.7 - - - - - - 5.1 - -
Cohort 2007 31 6.5 - - 31 9.7 - - 31 3.2 - - 3.2 -6.5 -3.2
Is your organization governed by its own Board of Directors?
Cohort 2006 50 86.7 - - 50 76.4 - - - - - - -10.3 - -
Cohort 2007 31 83.9 - - 31 80.6 - - 31 80.6 - - -3.2 0.0 -3.2
Board responsibilities include: Goal/Strategy development
Cohort 2006 45 98.9 - - 41 96.7 - - - - - - -2.1 - -
Cohort 2007 26 88.5 - - 25 88 - - 25 100.0 - - -0.5 12.0 11.5
Board responsibilities include: Community/Stakeholder outreach
Cohort 2006 45 84.5 - - 41 74.1 - - - - - - -10.3 - -
Cohort 2007 26 80.8 - - 25 84.0 - - 25 76.0 - - 3.2 -8.0 -4.8
Board responsibilities include: Budget development
Cohort 2006 45 79.9 - - 41 64.5 - - - - - - -15.5 - -
Cohort 2007 26 57.7 - - 25 60 - - 25 68.0 - - 2.3 8.0 10.3

Abt Associates Inc. pg. 44
Exhibit A2: Changes in Organizational Development—Lead Organizations
Baseline First Follow-Up Second Follow-Up Significance Tests
Number of
respondents
(N)
Average
or % Yes
Standard
deviation
(SD) Range N
Average
or % Yes (SD) Range N
Average
or % Yes (SD) Range
Baseline
vs. F1
F1
vs. F2
Baseline
vs. F2
Board responsibilities include: Financial review
Cohort 2006 45 100.0 - - 41 100.0 - - - - - - 0 - -
Cohort 2007 26 100.0 - - 25 100.0 - - 25 96.0 - - 0 -4.0 -4.0
Board responsibilities include: Performance review of program outcomes
Cohort 2006 45 77 - - 41 76.1 - - - - - - -0.9 - -
Cohort 2007 26 50 - - 25 68 - - 25 72.0 - - 18.0 4.0 22.0*
Board responsibilities include: Performance review of executive director
Cohort 2006 45 94.2 - - 41 93.5 - - - - - - -0.7 - -
Cohort 2007 26 88.5 - - 25 96.0 - - 25 100.0 - - 7.5 4.0 11.5
Board responsibilities include: Recruitment of new board members
Cohort 2006 45 87.4 - - 41 90.2 - - - - - - 2.9 - -
Cohort 2007 26 96.2 - - 25 88.0 - - 25 92.0 - - -8.2 4.0 -4.2
Do the Board’s responsibilities include: Provision of formal orientation to new board members
Cohort 2006 45 72.5 - - 41 89.0 - - - - - - 16.5* - -
Cohort 2007 26 69.2 - - 25 72.0 - - 25 60.0 - - 2.8 -12.0 -9.2
At present, how many individuals are on your organization’s board?
Cohort 2006 46 12.7 9.3 3-29 42 12.6 10.8 0-35 - - . - -0.1 - -
Cohort 2007 26 13.1 7.6 6-31 25 11.6 6.5 4-33 25 11.1 6.7 4-31 -1.4 -0.6 -2.0
In the past 12 months, how many individuals have served as executive director or your organization? a
Cohort 2006 - - - - 50 1.1 0.4 1-2 - - . - - - -
Cohort 2007 - - - - 31 1.1 0.2 1-2 31 1.1 0.3 1-2 - 0.0 -
Organization has 501(c)3 status
Cohort 2006 45 97.2 - - 45 91.3 - - - - - - -5.9 - -
Cohort 2007 29 100.0 - - 30 93.3 - - 29 96.6 - - -6.7 3.2 -3.4
Revenue Sources
In the last completed fiscal year, what was your organization’s total revenue? b
Cohort 2006 50 1,700,000 60,992,124 14,470-
332,770,000 50 1,000,000 41,315,749
16,752-
177,330,000 - - - - -700,000 * - -
Cohort 2007 31 735,835 3,524,542 0-
13,642,283 31 1,282,766 13,833,992
187,500-
76,996,995 31 1,384,766 6,237,726
205,000-
28,685,000 546,931 102,000 648,931 **

Abt Associates Inc. pg. 45
Exhibit A2: Changes in Organizational Development—Lead Organizations
Baseline First Follow-Up Second Follow-Up Significance Tests
Number of
respondents
(N)
Average
or % Yes
Standard
deviation
(SD) Range N
Average
or % Yes (SD) Range N
Average
or % Yes (SD) Range
Baseline
vs. F1
F1
vs. F2
Baseline
vs. F2
In the last completed fiscal year, what was your organization’s total expenditures? b
Cohort 2006 50 1,741,000 67,364,078 1,854-
332,770,000 50 939,962 39,440,867
7,683-
169,090,000 - - - - -801,038 * - -
Cohort 2007 31 670,831 3,424,098 70,000-
14,538,962 31 1,196,563 13,827,880
175,000-
76,996,995 31 1,175,442 6,098,108
200,000-
27,550,000 525,732 * -21,121 504,611 **
Excluding CEY, over the past 12 months, has your organization sought or obtained revenue from grants/contracts from federal government agencies?
Cohort 2006 50 63.9 - - 50 50.1 - - - - - - -13.8 - -
Cohort 2007 31 71.0 - - 31 54.8 - - 31 45.2 - - -16.1 -9.7 -25.8**
Excluding CEY, over the past 12 months, has your organization sought or obtained revenue from grants/contracts from state or local government agencies?
Cohort 2006 50 70.9 - - 50 66.9 - - - - - - -4.1 - -
Cohort 2007 31 74.2 - - 31 67.7 - - 31 64.5 - - -6.5 -3.2 -9.7
Excluding CEY, over the past 12 months, has your organization sought or obtained revenue from grants/contracts from institutional funding sources (e.g., corporations, foundations)?
Cohort 2006 50 71.9 - - 50 68.3 - - - - - - -3.6 - -
Cohort 2007 31 77.4 - - 31 67.7 - - 31 64.5 - - -9.7 -3.2 -12.9
Excluding CEY, over the past 12 months, has your organization sought or obtained revenue from grants/contracts from individual donors or events?
Cohort 2006 50 73.4 - - 50 70.9 - - - - - - -2.5 - -
Cohort 2007 31 67.7 - - 31 64.5 - - 31 61.3 - - -3.2 -3.2 -6.5
Excluding CEY, over the past 12 months, has your organization sought or obtained revenue from grants/contracts from Fees for Service?
Cohort 2006 50 59.1 - - 50 60.1 - - - - - - 1 - -
Cohort 2007 31 51.6 - - 31 45.2 - - 31 54.8 - - -6.5 9.7 3.2
Excluding CEY, over the past 12 months, has your organization sought or obtained revenue from grants/contracts from another organization?
Cohort 2006 50 29.1 - - 50 29.1 - - - - - - -0.1 - -
Cohort 2007 31 25.8 - - 31 22.6 - - 31 22.6 - - -3.2 0.0 -3.2
Funding Readiness
Does your organization have a fundraising/fund development plan?
Cohort 2006 50 46.9 - - 50 66.2 - - - - - - 19.4** - -
Cohort 2007 31 51.6 - - 31 41.9 - - 31 54.8 - - -9.7 12.9 3.2
Does your organization have financial management procedures for ensuring expenditures are properly authorized?
Cohort 2006 50 89.8 - - 50 100.0 - - - - - - 10.2* - -
Cohort 2007 31 90.3 - - 31 93.5 - - 31 93.5 - - 3.2 0.0 3.2
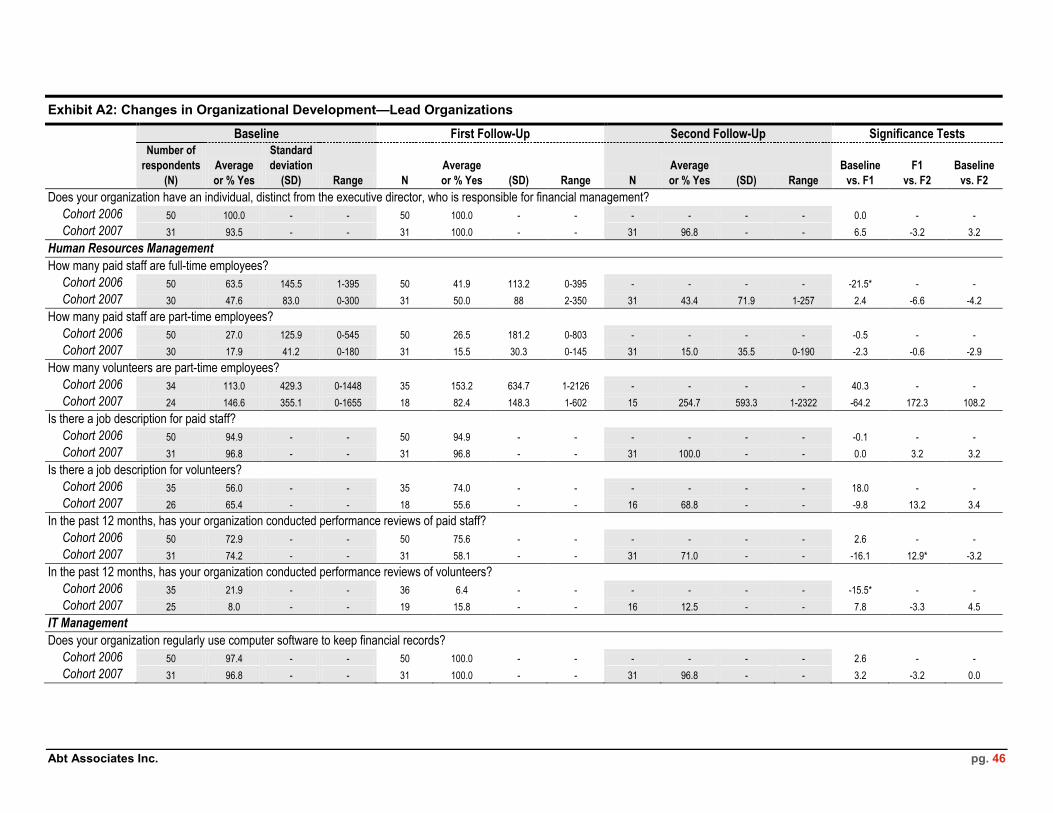
Abt Associates Inc. pg. 46
Exhibit A2: Changes in Organizational Development—Lead Organizations
Baseline First Follow-Up Second Follow-Up Significance Tests
Number of
respondents
(N)
Average
or % Yes
Standard
deviation
(SD) Range N
Average
or % Yes (SD) Range N
Average
or % Yes (SD) Range
Baseline
vs. F1
F1
vs. F2
Baseline
vs. F2
Does your organization have an individual, distinct from the executive director, who is responsible for financial management?
Cohort 2006 50 100.0 - - 50 100.0 - - - - - - 0.0 - -
Cohort 2007 31 93.5 - - 31 100.0 - - 31 96.8 - - 6.5 -3.2 3.2
Human Resources Management
How many paid staff are full-time employees?
Cohort 2006 50 63.5 145.5 1-395 50 41.9 113.2 0-395 - - - - -21.5* - -
Cohort 2007 30 47.6 83.0 0-300 31 50.0 88 2-350 31 43.4 71.9 1-257 2.4 -6.6 -4.2
How many paid staff are part-time employees?
Cohort 2006 50 27.0 125.9 0-545 50 26.5 181.2 0-803 - - - - -0.5 - -
Cohort 2007 30 17.9 41.2 0-180 31 15.5 30.3 0-145 31 15.0 35.5 0-190 -2.3 -0.6 -2.9
How many volunteers are part-time employees?
Cohort 2006 34 113.0 429.3 0-1448 35 153.2 634.7 1-2126 - - - - 40.3 - -
Cohort 2007 24 146.6 355.1 0-1655 18 82.4 148.3 1-602 15 254.7 593.3 1-2322 -64.2 172.3 108.2
Is there a job description for paid staff?
Cohort 2006 50 94.9 - - 50 94.9 - - - - - - -0.1 - -
Cohort 2007 31 96.8 - - 31 96.8 - - 31 100.0 - - 0.0 3.2 3.2
Is there a job description for volunteers?
Cohort 2006 35 56.0 - - 35 74.0 - - - - - - 18.0 - -
Cohort 2007 26 65.4 - - 18 55.6 - - 16 68.8 - - -9.8 13.2 3.4
In the past 12 months, has your organization conducted performance reviews of paid staff?
Cohort 2006 50 72.9 - - 50 75.6 - - - - - - 2.6 - -
Cohort 2007 31 74.2 - - 31 58.1 - - 31 71.0 - - -16.1 12.9* -3.2
In the past 12 months, has your organization conducted performance reviews of volunteers?
Cohort 2006 35 21.9 - - 36 6.4 - - - - - - -15.5* - -
Cohort 2007 25 8.0 - - 19 15.8 - - 16 12.5 - - 7.8 -3.3 4.5
IT Management
Does your organization regularly use computer software to keep financial records?
Cohort 2006 50 97.4 - - 50 100.0 - - - - - - 2.6 - -
Cohort 2007 31 96.8 - - 31 100.0 - - 31 96.8 - - 3.2 -3.2 0.0

Abt Associates Inc. pg. 47
Exhibit A2: Changes in Organizational Development—Lead Organizations
Baseline First Follow-Up Second Follow-Up Significance Tests
Number of
respondents
(N)
Average
or % Yes
Standard
deviation
(SD) Range N
Average
or % Yes (SD) Range N
Average
or % Yes (SD) Range
Baseline
vs. F1
F1
vs. F2
Baseline
vs. F2
Do you have an adequate number of computers to meet your organization’s needs?
Cohort 2006 50 75.4 - - 50 87.7 - - - - - - 12.3 - -
Cohort 2007 31 64.5 - - 31 83.9 - - 31 93.5 - - 19.4* 9.7 29.0**
Is the software on these computers adequate to meet your organization’s needs?
Cohort 2006 50 72.4 - - 50 82.6 - - - - - - 10.2 - -
Cohort 2007 31 64.5 - - 31 74.2 - - 31 90.3 - - 9.7 16.1 25.8*
Does your organization have access to the Internet?
Cohort 2006 50 100.0 - - 50 100.0 - - - - - - 0.0 - -
Cohort 2007 31 100.0 - - 31 100.0 - - 31 100.0 - - 0.0 0.0 0.0
Does your organization use the Internet to support an organizational website?
Cohort 2006 50 93.9 - - 50 96.4 - - - - - - 2.6 - -
Cohort 2007 31 90.3 - - 31 93.5 - - 31 96.8 - - 3.2 3.2 6.5
Does your organization use the Internet for program email?
Cohort 2006 50 100.0 - - 50 100.0 - - - - - - 0.0 - -
Cohort 2007 31 93.5 - - 31 100.0 - - 31 100.0 - - 6.5 0.0 6.5
Does your organization use the Internet for research purposes?
Cohort 2006 50 100.0 - - 50 100.0 - - - - - - 0.0 - -
Cohort 2007 31 100.0 - - 31 100.0 - - 31 100.0 - - 0.0 0.0 0.0
Does your organization use the Internet for community outreach purposes?
Cohort 2006 50 82.0 - - 50 86.1 - - - - - - 4.1 - -
Cohort 2007 31 80.6 - - 31 87.1 - - 31 90.3 - - 6.5 3.2 9.7
* p-value < 0.05 ** p-value <0.01 a The question at baseline referenced a different timeframe so results are not shown. b The number reported in the ―Average or % Yes‖ column represents the median. Significance tests were performed on the medians using a signed rank test.
Source: CEY Outcome Study Baseline, Follow-Up 1, and Follow-Up 2 Surveys
Note: The sample at baseline and first follow-up includes 81 lead organizations (2006 & 2007 cohorts) and represents the population of 131 lead organizations in 2008 and 2009. The sample at second follow-up includes 31 lead organizations (2007 cohort only) and represents the population of 31 lead organizations in 2010. ―Baseline vs. F1‖ denotes changes between baseline and first follow-up; ―F1 vs. F2‖ denotes changes between first follow-up and second follow-up; ―Baseline vs. F2‖ denotes changes between baseline and second follow-up.

Abt Associates Inc. pg. 48
Exhibit A3: Changes in Program Development—Lead Organizations
Baseline First Follow-Up Second Follow-Up Significance Tests
Number of
respondents
(N)
Average
or % Yes
Standard
deviation
(SD) Range N
Average
or % Yes (SD) Range N
Average
or % Yes (SD) Range
Baseline
vs. F1
F1
vs. F2
Baseline
vs. F2
Service Delivery
In a month of service delivery, total number of program participants organization serves
Cohort 2006 37 2,134.4 7382.6 20-26,000 35 1,400.0 3311.5 0-13,000 - - - - -734.4 - -
Cohort 2007 25 1,056.0 1211.8 3-4,200 23 1,117.0 1642.7 0-5,463 22 1,177.0 1480.5 74-5,500 61.0 60.0 121.0
In a month of service delivery, what is the total number of organizations for whom capacity building services are provided?
Cohort 2006 50 22.3 57.4 0-300 50 18.0 43.2 1-231 - - - - -4.3 - -
Cohort 2007 28 14.5 20.9 2-97 29 12.6 12.4 2-43 31 12.2 15.1 2-79 -1.9 -0.3 -2.2
Program Evaluation
In the past 12 months, has your organization obtained feedback from program participants about satisfaction with direct services provided?
Cohort 2006 37 87.4 - - 34 91.4 - - - - - - 4 - -
Cohort 2007 25 100.0 - - 22 95.5 - - 22 90.9 - - -4.5 -4.5 -9.1
In the past 12 months, has your organization conducted formal measurements of (direct service) program participant outcomes?
Cohort 2006 37 88.1 - - 34 84.9 - - - - - - -3.1 - -
Cohort 2007 25 88.0 - - 22 77.3 - - 22 72.7 - - -10.7 -4.5 -15.3
In the past 12 months, has your organization obtained feedback from program participants about satisfaction with (capacity building) services provided?
Cohort 2006 49 91.1 - - 50 95.4 - - - - - - 4.4 - -
Cohort 2007 27 92.6 - - 29 96.6 - - 31 93.5 - - 4.0 -3.0 1.0
In the past 12 months, has your organization conducted formal measurements of (capacity building) program participant outcomes?
Cohort 2006 48 71.1 - - 50 62.2 - - - - - - -8.9 - -
Cohort 2007 26 69.2 - - 29 69.0 - - 31 67.7 - - -0.3 -1.2 -1.5
* p-value < 0.05 ** p-value <0.01
Source: CEY Outcome Study Baseline, Follow-Up 1, and Follow-Up 2 Surveys
Note: The sample at baseline and first follow-up includes 81 lead organizations (2006 & 2007 cohorts) and represents the population of 131 lead organizations in 2008 and 2009. The sample at second follow-up includes 31 lead organizations (2007 cohort only) and represents the population of 31 lead organizations in 2010. ―Baseline vs. F1‖ denotes changes between baseline and first follow-up; ―F1 vs. F2‖ denotes changes between first follow-up and second follow-up; ―Baseline vs. F2‖ denotes changes between baseline and second follow-up.
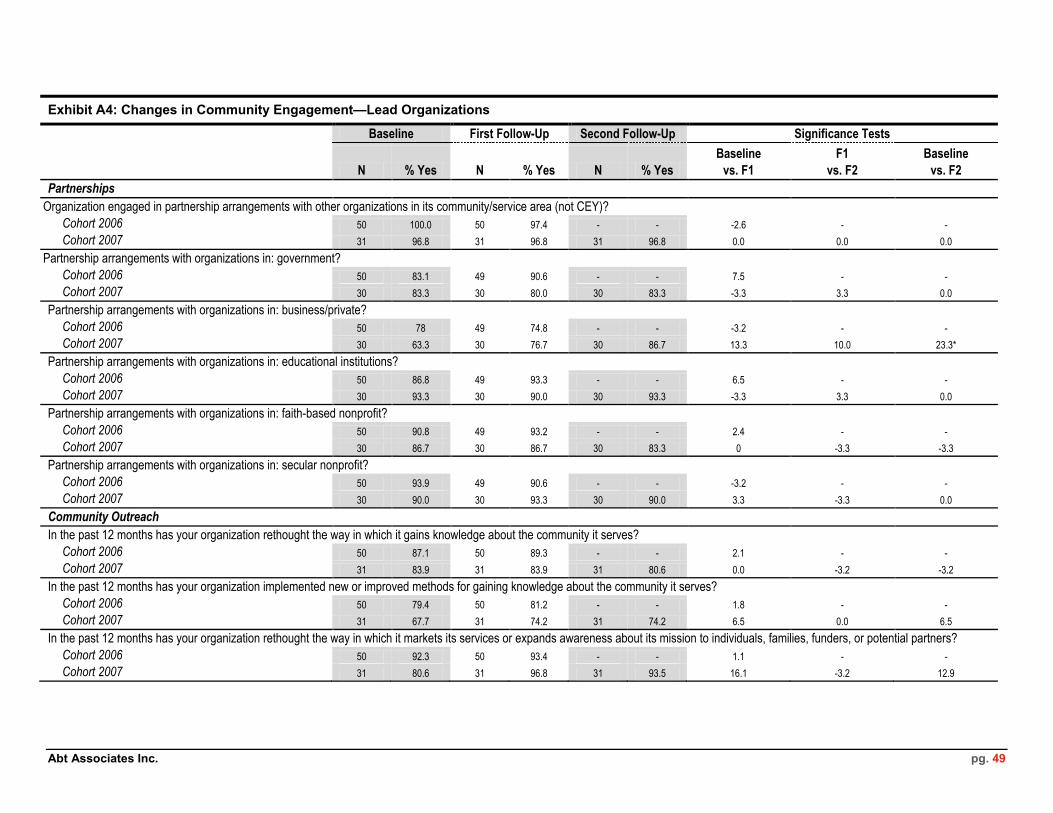
Abt Associates Inc. pg. 49
Exhibit A4: Changes in Community Engagement—Lead Organizations
Baseline First Follow-Up Second Follow-Up Significance Tests
N % Yes N % Yes N % Yes
Baseline
vs. F1
F1
vs. F2
Baseline
vs. F2
Partnerships
Organization engaged in partnership arrangements with other organizations in its community/service area (not CEY)?
Cohort 2006 50 100.0 50 97.4 - - -2.6 - -
Cohort 2007 31 96.8 31 96.8 31 96.8 0.0 0.0 0.0
Partnership arrangements with organizations in: government?
Cohort 2006 50 83.1 49 90.6 - - 7.5 - -
Cohort 2007 30 83.3 30 80.0 30 83.3 -3.3 3.3 0.0
Partnership arrangements with organizations in: business/private?
Cohort 2006 50 78 49 74.8 - - -3.2 - -
Cohort 2007 30 63.3 30 76.7 30 86.7 13.3 10.0 23.3*
Partnership arrangements with organizations in: educational institutions?
Cohort 2006 50 86.8 49 93.3 - - 6.5 - -
Cohort 2007 30 93.3 30 90.0 30 93.3 -3.3 3.3 0.0
Partnership arrangements with organizations in: faith-based nonprofit?
Cohort 2006 50 90.8 49 93.2 - - 2.4 - -
Cohort 2007 30 86.7 30 86.7 30 83.3 0 -3.3 -3.3
Partnership arrangements with organizations in: secular nonprofit?
Cohort 2006 50 93.9 49 90.6 - - -3.2 - -
Cohort 2007 30 90.0 30 93.3 30 90.0 3.3 -3.3 0.0
Community Outreach
In the past 12 months has your organization rethought the way in which it gains knowledge about the community it serves?
Cohort 2006 50 87.1 50 89.3 - - 2.1 - -
Cohort 2007 31 83.9 31 83.9 31 80.6 0.0 -3.2 -3.2
In the past 12 months has your organization implemented new or improved methods for gaining knowledge about the community it serves?
Cohort 2006 50 79.4 50 81.2 - - 1.8 - -
Cohort 2007 31 67.7 31 74.2 31 74.2 6.5 0.0 6.5
In the past 12 months has your organization rethought the way in which it markets its services or expands awareness about its mission to individuals, families, funders, or potential partners?
Cohort 2006 50 92.3 50 93.4 - - 1.1 - -
Cohort 2007 31 80.6 31 96.8 31 93.5 16.1 -3.2 12.9
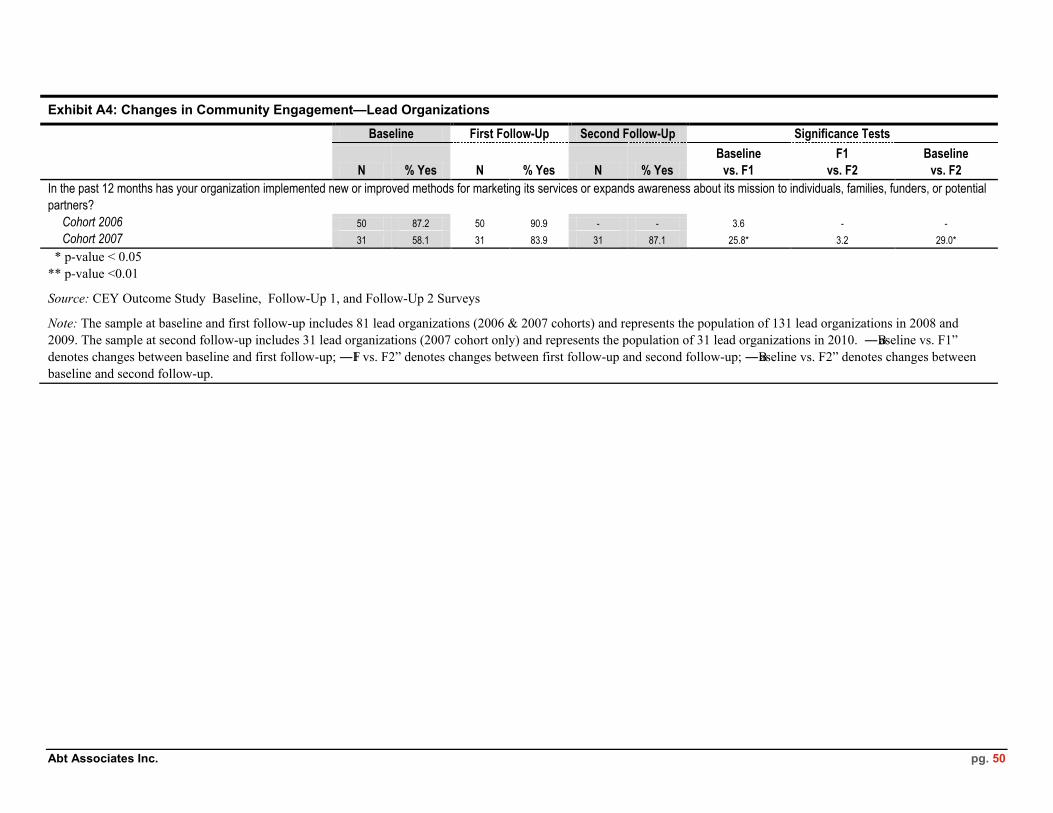
Abt Associates Inc. pg. 50
Exhibit A4: Changes in Community Engagement—Lead Organizations
Baseline First Follow-Up Second Follow-Up Significance Tests
N % Yes N % Yes N % Yes
Baseline
vs. F1
F1
vs. F2
Baseline
vs. F2
In the past 12 months has your organization implemented new or improved methods for marketing its services or expands awareness about its mission to individuals, families, funders, or potential
partners?
Cohort 2006 50 87.2 50 90.9 - - 3.6 - -
Cohort 2007 31 58.1 31 83.9 31 87.1 25.8* 3.2 29.0*
* p-value < 0.05 ** p-value <0.01
Source: CEY Outcome Study Baseline, Follow-Up 1, and Follow-Up 2 Surveys
Note: The sample at baseline and first follow-up includes 81 lead organizations (2006 & 2007 cohorts) and represents the population of 131 lead organizations in 2008 and 2009. The sample at second follow-up includes 31 lead organizations (2007 cohort only) and represents the population of 31 lead organizations in 2010. ―Baseline vs. F1‖ denotes changes between baseline and first follow-up; ―F1 vs. F2‖ denotes changes between first follow-up and second follow-up; ―Baseline vs. F2‖ denotes changes between baseline and second follow-up.

Abt Associates Inc. pg. 51
Exhibit A5: Changes in Partnership Capacity—Lead Organizations
Baseline First Follow-Up Second Follow-Up Significance Tests
N % Yes N % Yes N % Yes
Baseline
vs. F1
F1
vs. F2
Baseline
vs. F2
Shared Mission and Objectives
Does your CEY partnership have a mission statement?
Cohort 2006 50 56.1 48 74.8 - - 18.7* - -
Cohort 2007 30 36.7 30 73.3 31 83.9 36.7** 10.5* 47.2**
Your organization fully understands the goals of your CEY partnership a, b
Cohort 2006 - - 50 96.4 - - - - -
Cohort 2007 - - 31 96.8 31 96.8 - 0.0 -
Your organization was involved in setting the goals of your CEY partnership a, b, c
Cohort 2006 - - 50 95.4 - - - - -
Cohort 2007 - - 31 96.8 31 100.0 - 3.2 -
Your CEY partnership’s goals are well aligned with the goals of your organization b , c
Cohort 2006 50 99.0 50 95.4 - - -3.6 - -
Cohort 2007 - - 31 90.3 31 100.0 - 9.7 -
Communication
Participating in the CEY partnership led to better communication and working relationships among participating organizations than before b , d
Cohort 2006 - - 50 94.9 - - - - -
Cohort 2007 - - 31 96.8 31 96.8 - 0.0 -
Action Plan
Does your partnership have a plan that outlines tasks to be achieved? c
Cohort 2006 50 90.3 50 87.2 - - -3.1 - -
Cohort 2007 - - 31 74.2 31 74.2 - 0.0 -
Does your partnership have a plan that outlines timeline by which these tasks are to be achieved? c
Cohort 2006 50 77.4 50 73.9 - - -3.5 - -
Cohort 2007 - - 31 67.7 31 67.7 - 0.0 -
Does your partnership have a plan that outlines individuals or organizations responsible for completing each task? c
Cohort 2006 50 74.9 50 74.4 - - -0.6 - -
Cohort 2007 - - 31 61.3 30 56.7 - -4.6 -

Abt Associates Inc. pg. 52
Sustainability Plan
Does your partnership have a sustainability plan? c
Cohort 2006 50 24.4 49 32.4 - - 8.0 - -
Cohort 2007 - - 30 10.0 30 13.3 - 3.3 -
On a scale of 1-5 please describe your opinion as to how likely or unlikely it is that your CEY partnership will continue past the 3-year grant cycle. e
Cohort 2006 47 80.2 48 79.3 - - -0.9 - -
Cohort 2007 30 86.7 30 76.7 31 61.3 -10.0 -15.4 -25.4*
* p-value < 0.05 ** p-value <0.01 a Question was asked only of partners at baseline. b The baseline, first follow-up, and second follow-up averages indicate the percentage of respondents that answered ―Strongly Agree‖ or ―Agree‖ on a scale from 1 to 5 with 1 being ―Strongly Agree‖ and 5 being ―Strongly Disagree.‖ c Question was asked only of the 2006 cohort at baseline. d Question was asked only at first follow-up and second follow-up. e The baseline, first follow-up, and second follow-up averages indicate the percentage of respondents that answered ―Highly Likely‖ or ―Likely‖ on a scale from 1 to 5 with 1 being ―Highly Likely‖ and 5 being ―Highly Unlikely.‖ Source: CEY Outcome Study Baseline, Follow-Up 1, and Follow-Up 2 Surveys
Note: The sample at baseline and first follow-up includes 81 lead organizations (2006 & 2007 cohorts) and represents the population of 131 lead organizations in 2008 and 2009. The sample at second follow-up includes 31 lead organizations (2007 cohort only) and represents the population of 31 lead organizations in 2010. ―Baseline vs. F1‖ denotes changes between baseline and first follow-up; ―F1 vs. F2‖ denotes changes between first follow-up and second follow-up; ―Baseline vs. F2‖ denotes changes between baseline and second follow-up.
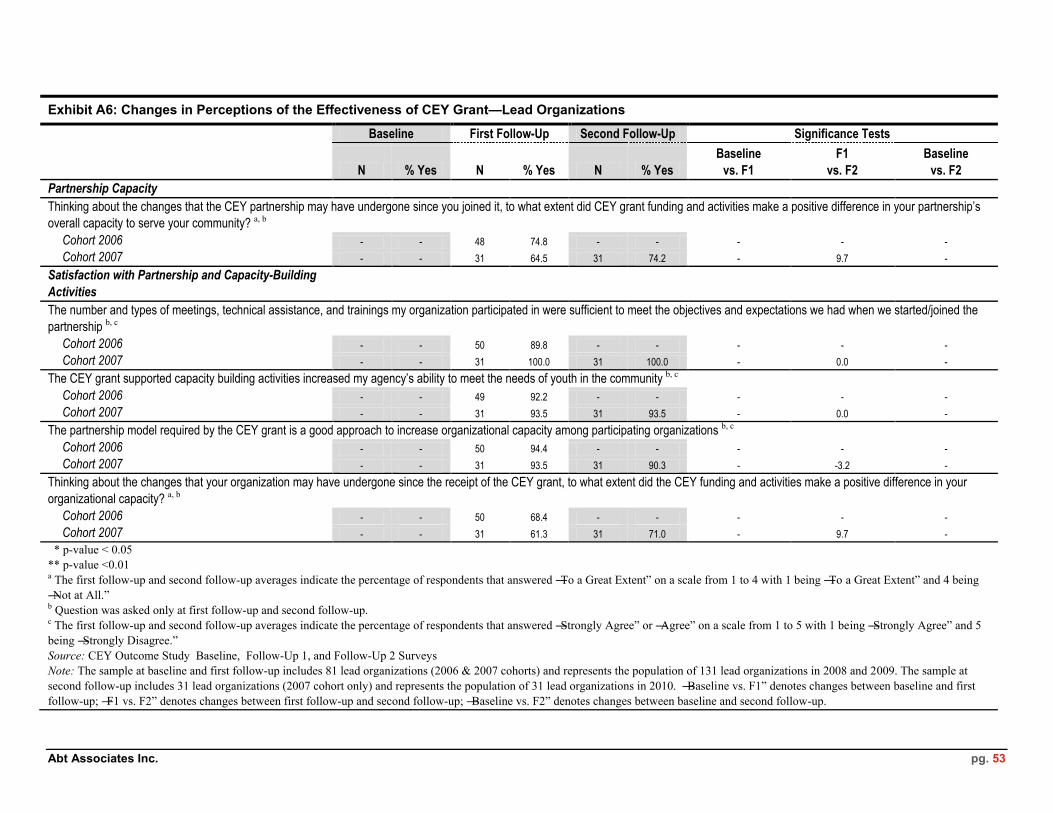
Abt Associates Inc. pg. 53
Exhibit A6: Changes in Perceptions of the Effectiveness of CEY Grant—Lead Organizations
Baseline First Follow-Up Second Follow-Up Significance Tests
N % Yes N % Yes N % Yes
Baseline
vs. F1
F1
vs. F2
Baseline
vs. F2
Partnership Capacity
Thinking about the changes that the CEY partnership may have undergone since you joined it, to what extent did CEY grant funding and activities make a positive difference in your partnership’s
overall capacity to serve your community? a, b
Cohort 2006 - - 48 74.8 - - - - -
Cohort 2007 - - 31 64.5 31 74.2 - 9.7 -
Satisfaction with Partnership and Capacity-Building
Activities
The number and types of meetings, technical assistance, and trainings my organization participated in were sufficient to meet the objectives and expectations we had when we started/joined the
partnership b, c
Cohort 2006 - - 50 89.8 - - - - -
Cohort 2007 - - 31 100.0 31 100.0 - 0.0 -
The CEY grant supported capacity building activities increased my agency’s ability to meet the needs of youth in the community b, c
Cohort 2006 - - 49 92.2 - - - - -
Cohort 2007 - - 31 93.5 31 93.5 - 0.0 -
The partnership model required by the CEY grant is a good approach to increase organizational capacity among participating organizations b, c
Cohort 2006 - - 50 94.4 - - - - -
Cohort 2007 - - 31 93.5 31 90.3 - -3.2 -
Thinking about the changes that your organization may have undergone since the receipt of the CEY grant, to what extent did the CEY funding and activities make a positive difference in your
organizational capacity? a, b
Cohort 2006 - - 50 68.4 - - - - -
Cohort 2007 - - 31 61.3 31 71.0 - 9.7 -
* p-value < 0.05 ** p-value <0.01 a The first follow-up and second follow-up averages indicate the percentage of respondents that answered ―To a Great Extent‖ on a scale from 1 to 4 with 1 being ―To a Great Extent‖ and 4 being ―Not at All.‖ b Question was asked only at first follow-up and second follow-up. c The first follow-up and second follow-up averages indicate the percentage of respondents that answered ―Strongly Agree‖ or ―Agree‖ on a scale from 1 to 5 with 1 being ―Strongly Agree‖ and 5 being ―Strongly Disagree.‖ Source: CEY Outcome Study Baseline, Follow-Up 1, and Follow-Up 2 Surveys Note: The sample at baseline and first follow-up includes 81 lead organizations (2006 & 2007 cohorts) and represents the population of 131 lead organizations in 2008 and 2009. The sample at second follow-up includes 31 lead organizations (2007 cohort only) and represents the population of 31 lead organizations in 2010. ―Baseline vs. F1‖ denotes changes between baseline and first follow-up; ―F1 vs. F2‖ denotes changes between first follow-up and second follow-up; ―Baseline vs. F2‖ denotes changes between baseline and second follow-up.
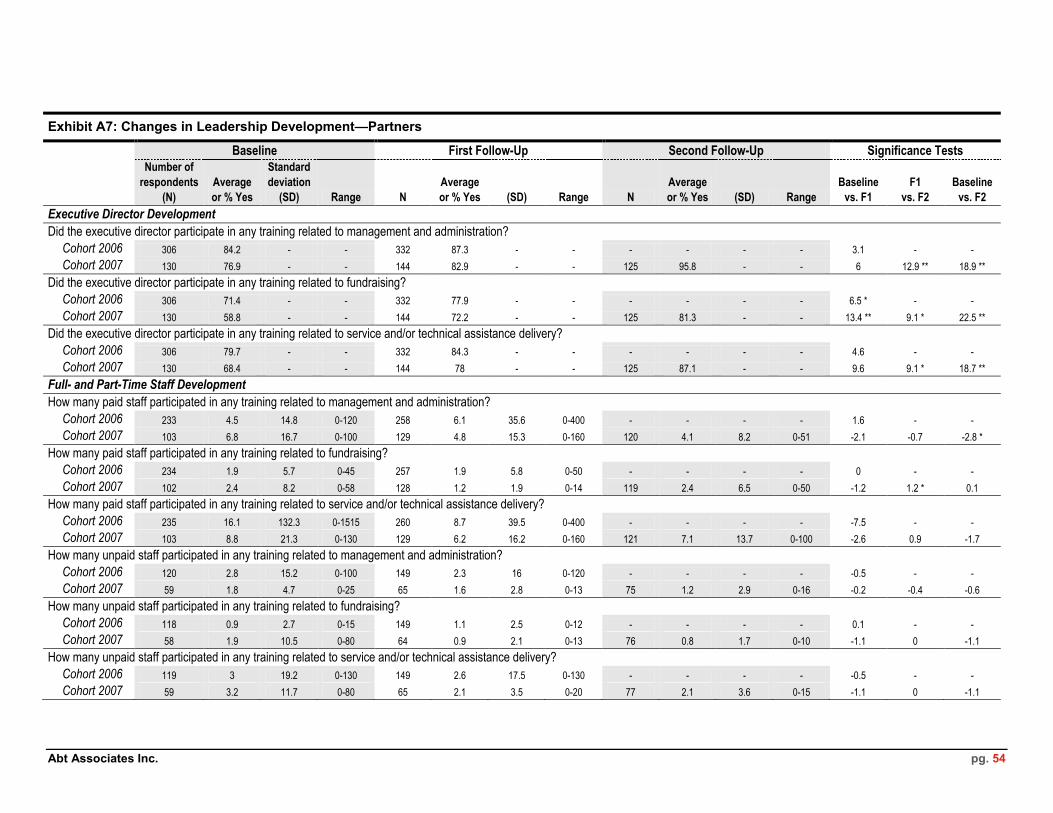
Abt Associates Inc. pg. 54
Exhibit A7: Changes in Leadership Development—Partners
Baseline First Follow-Up Second Follow-Up Significance Tests
Number of
respondents
(N)
Average
or % Yes
Standard
deviation
(SD) Range N
Average
or % Yes (SD) Range N
Average
or % Yes (SD) Range
Baseline
vs. F1
F1
vs. F2
Baseline
vs. F2
Executive Director Development
Did the executive director participate in any training related to management and administration?
Cohort 2006 306 84.2 - - 332 87.3 - - - - - - 3.1 - -
Cohort 2007 130 76.9 - - 144 82.9 - - 125 95.8 - - 6 12.9 ** 18.9 **
Did the executive director participate in any training related to fundraising?
Cohort 2006 306 71.4 - - 332 77.9 - - - - - - 6.5 * - -
Cohort 2007 130 58.8 - - 144 72.2 - - 125 81.3 - - 13.4 ** 9.1 * 22.5 **
Did the executive director participate in any training related to service and/or technical assistance delivery?
Cohort 2006 306 79.7 - - 332 84.3 - - - - - - 4.6 - -
Cohort 2007 130 68.4 - - 144 78 - - 125 87.1 - - 9.6 9.1 * 18.7 **
Full- and Part-Time Staff Development
How many paid staff participated in any training related to management and administration?
Cohort 2006 233 4.5 14.8 0-120 258 6.1 35.6 0-400 - - - - 1.6 - -
Cohort 2007 103 6.8 16.7 0-100 129 4.8 15.3 0-160 120 4.1 8.2 0-51 -2.1 -0.7 -2.8 *
How many paid staff participated in any training related to fundraising?
Cohort 2006 234 1.9 5.7 0-45 257 1.9 5.8 0-50 - - - - 0 - -
Cohort 2007 102 2.4 8.2 0-58 128 1.2 1.9 0-14 119 2.4 6.5 0-50 -1.2 1.2 * 0.1
How many paid staff participated in any training related to service and/or technical assistance delivery?
Cohort 2006 235 16.1 132.3 0-1515 260 8.7 39.5 0-400 - - - - -7.5 - -
Cohort 2007 103 8.8 21.3 0-130 129 6.2 16.2 0-160 121 7.1 13.7 0-100 -2.6 0.9 -1.7
How many unpaid staff participated in any training related to management and administration?
Cohort 2006 120 2.8 15.2 0-100 149 2.3 16 0-120 - - - - -0.5 - -
Cohort 2007 59 1.8 4.7 0-25 65 1.6 2.8 0-13 75 1.2 2.9 0-16 -0.2 -0.4 -0.6
How many unpaid staff participated in any training related to fundraising?
Cohort 2006 118 0.9 2.7 0-15 149 1.1 2.5 0-12 - - - - 0.1 - -
Cohort 2007 58 1.9 10.5 0-80 64 0.9 2.1 0-13 76 0.8 1.7 0-10 -1.1 0 -1.1
How many unpaid staff participated in any training related to service and/or technical assistance delivery?
Cohort 2006 119 3 19.2 0-130 149 2.6 17.5 0-130 - - - - -0.5 - -
Cohort 2007 59 3.2 11.7 0-80 65 2.1 3.5 0-20 77 2.1 3.6 0-15 -1.1 0 -1.1

Abt Associates Inc. pg. 55
Exhibit A7: Changes in Leadership Development—Partners
Baseline First Follow-Up Second Follow-Up Significance Tests
Number of
respondents
(N)
Average
or % Yes
Standard
deviation
(SD) Range N
Average
or % Yes (SD) Range N
Average
or % Yes (SD) Range
Baseline
vs. F1
F1
vs. F2
Baseline
vs. F2
Volunteer Development
How many volunteer staff participated in any training related to management and administration?
Cohort 2006 186 3.7 22.1 0-200 237 3.1 17.8 0-200 - - - - -0.6 - -
Cohort 2007 87 6.1 37.9 0-350 106 2.1 5.8 0-35 100 3.1 9.1 0-75 -4.0 1.0 -3.0
How many volunteer staff participated in any training related to fundraising?
Cohort 2006 180 2.1 8.1 0-40 233 2.7 13.6 0-100 - - - - 0.7 - -
Cohort 2007 85 4.3 18.1 0-140 105 0.6 1.8 0-12 103 2.1 5.5 0-40 -3.7 1.5 ** -2.2
How many volunteer staff participated in any training related to service and/or technical assistance delivery?
Cohort 2006 202 10.5 45.5 0-300 245 14.7 97.8 0-962 - - - - 4.2 - -
Cohort 2007 93 15.9 40.1 0-250 117 23.5 88.9 0-782 109 27.8 106 0-900 7.7 4.3 12
* p-value < 0.05 ** p-value <0.01
Source: CEY Outcome Study Baseline, Follow-Up 1, and Follow-Up 2 Surveys
Note: The sample at baseline includes 459 partner organizations and represents the population of 809 partner organizations in 2008 (2006 & 2007 cohorts). The sample at first follow-up includes 513 partner organizations and represents the population of 880 partner organizations in 2009 (2006 & 2007 cohorts). The sample at second follow-up includes 158 partner organizations and represents the population of 158 partner organizations in 2010 (2007 cohort only). ―Baseline vs. F1‖ denotes changes between baseline and first follow-up; ―F1 vs. F2‖ denotes changes between first follow-up and second follow-up; ―Baseline vs. F2‖ denotes changes between baseline and second follow-up.
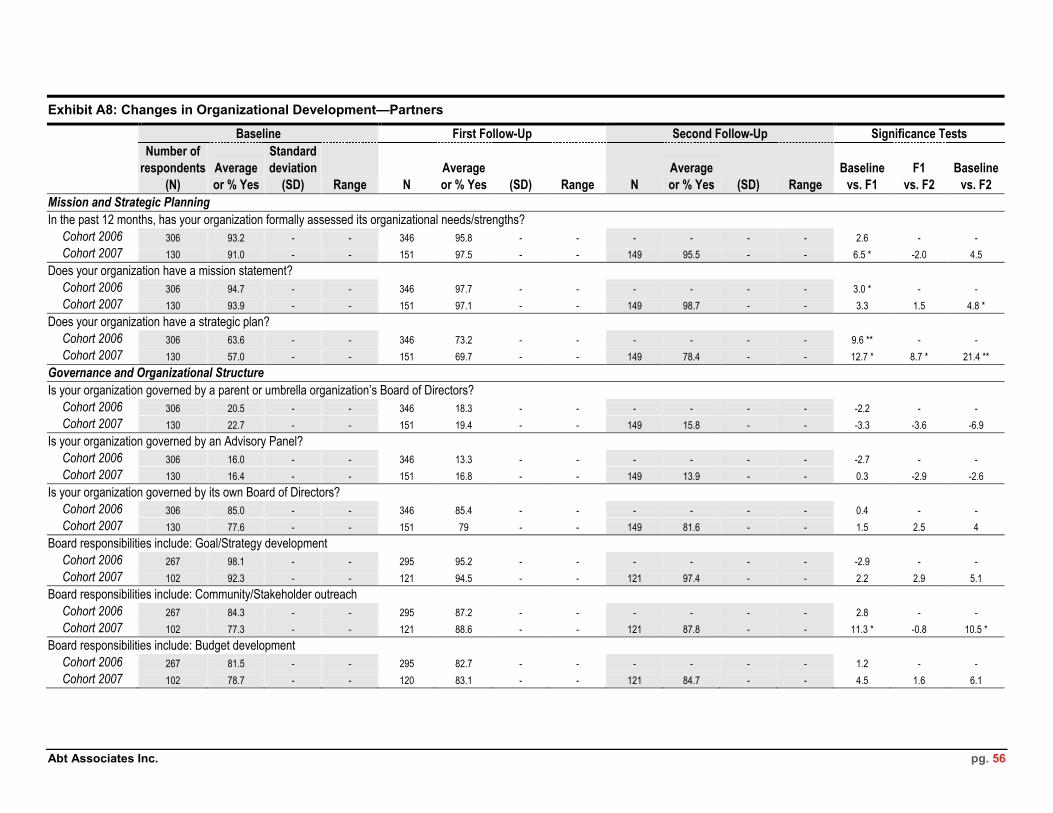
Abt Associates Inc. pg. 56
Exhibit A8: Changes in Organizational Development—Partners
Baseline First Follow-Up Second Follow-Up Significance Tests
Number of
respondents
(N)
Average
or % Yes
Standard
deviation
(SD) Range N
Average
or % Yes (SD) Range N
Average
or % Yes (SD) Range
Baseline
vs. F1
F1
vs. F2
Baseline
vs. F2
Mission and Strategic Planning
In the past 12 months, has your organization formally assessed its organizational needs/strengths?
Cohort 2006 306 93.2 - - 346 95.8 - - - - - - 2.6 - -
Cohort 2007 130 91.0 - - 151 97.5 - - 149 95.5 - - 6.5 * -2.0 4.5
Does your organization have a mission statement?
Cohort 2006 306 94.7 - - 346 97.7 - - - - - - 3.0 * - -
Cohort 2007 130 93.9 - - 151 97.1 - - 149 98.7 - - 3.3 1.5 4.8 *
Does your organization have a strategic plan?
Cohort 2006 306 63.6 - - 346 73.2 - - - - - - 9.6 ** - -
Cohort 2007 130 57.0 - - 151 69.7 - - 149 78.4 - - 12.7 * 8.7 * 21.4 **
Governance and Organizational Structure
Is your organization governed by a parent or umbrella organization’s Board of Directors?
Cohort 2006 306 20.5 - - 346 18.3 - - - - - - -2.2 - -
Cohort 2007 130 22.7 - - 151 19.4 - - 149 15.8 - - -3.3 -3.6 -6.9
Is your organization governed by an Advisory Panel?
Cohort 2006 306 16.0 - - 346 13.3 - - - - - - -2.7 - -
Cohort 2007 130 16.4 - - 151 16.8 - - 149 13.9 - - 0.3 -2.9 -2.6
Is your organization governed by its own Board of Directors?
Cohort 2006 306 85.0 - - 346 85.4 - - - - - - 0.4 - -
Cohort 2007 130 77.6 - - 151 79 - - 149 81.6 - - 1.5 2.5 4
Board responsibilities include: Goal/Strategy development
Cohort 2006 267 98.1 - - 295 95.2 - - - - - - -2.9 - -
Cohort 2007 102 92.3 - - 121 94.5 - - 121 97.4 - - 2.2 2.9 5.1
Board responsibilities include: Community/Stakeholder outreach
Cohort 2006 267 84.3 - - 295 87.2 - - - - - - 2.8 - -
Cohort 2007 102 77.3 - - 121 88.6 - - 121 87.8 - - 11.3 * -0.8 10.5 *
Board responsibilities include: Budget development
Cohort 2006 267 81.5 - - 295 82.7 - - - - - - 1.2 - -
Cohort 2007 102 78.7 - - 120 83.1 - - 121 84.7 - - 4.5 1.6 6.1

Abt Associates Inc. pg. 57
Exhibit A8: Changes in Organizational Development—Partners
Baseline First Follow-Up Second Follow-Up Significance Tests
Number of
respondents
(N)
Average
or % Yes
Standard
deviation
(SD) Range N
Average
or % Yes (SD) Range N
Average
or % Yes (SD) Range
Baseline
vs. F1
F1
vs. F2
Baseline
vs. F2
Board responsibilities include: Financial review
Cohort 2006 267 96.5 - - 295 96.9 - - - - - - 0.4 - -
Cohort 2007 102 94.9 - - 121 99 - - 121 97.7 - - 4.1 -1.3 2.8
Board responsibilities include: Performance review of program outcomes
Cohort 2006 266 84.4 - - 295 81.8 - - - - - - -2.7 - -
Cohort 2007 102 75.2 - - 120 77.5 - - 121 81.0 - - 2.2 3.5 5.8
Board responsibilities include: Performance review of executive director
Cohort 2006 266 84.3 - - 295 88.4 - - - - - - 4.1 - -
Cohort 2007 102 81.9 - - 121 88.3 - - 121 85.4 - - 6.3 -2.9 3.5
Board responsibilities include: Recruitment of new board members
Cohort 2006 266 89.7 - - 295 91.8 - - - - - - 2.1 - -
Cohort 2007 102 83.4 - - 121 95.1 - - 121 95.4 - - 11.7 ** 0.4 12.1 **
Do the Board’s responsibilities include: Provision of formal orientation to new board members
Cohort 2006 266 77.2 - - 295 78.4 - - - - - - 1.2 - -
Cohort 2007 102 65.4 - - 120 80.1 - - 121 80.3 - - 14.7 ** 0.2 14.9 **
At present, how many individuals are on your organization’s board?
Cohort 2006 267 9.6 9.6 3-60 297 9.8 9 3-60 - - - - 0.2 - -
Cohort 2007 103 10.5 6.6 0-34 121 9.9 5.7 2-35 121 10.3 6.2 2-32 -0.6 0.4 -0.2
In the past 12 months, how many individuals have served as executive director or your organization? a
Cohort 2006 - - - - 346 1.0 0.5 0-3 - - - - - - -
Cohort 2007 - - - - 150 1.0 0.3 0-2 149 1 0.4 0-2 - 0.0 -
Organization has 501(c)3 status
Cohort 2006 287 78.9 - - 328 87.4 - - - - - - 8.5 ** - -
Cohort 2007 123 74.7 - - 146 76.4 - - 140 84.4 - - 1.8 8.0 * 9.7 *
Revenue Sources
In the last completed fiscal year, what was your organization’s total revenue? b
Cohort 2006 305 123,374 95,636,293 0-924,210,000 344 121,850 48,650,098 0-
550,000,000 - - - - -1,524
- -
Cohort 2007 130 149,700 2,286,065 0-14,456,250 151 180,000 1,647,985 0-17,000,000 148 156,554 2,011,739 0-17,000,000 30,300 -23,446 6,854 *

Abt Associates Inc. pg. 58
Exhibit A8: Changes in Organizational Development—Partners
Baseline First Follow-Up Second Follow-Up Significance Tests
Number of
respondents
(N)
Average
or % Yes
Standard
deviation
(SD) Range N
Average
or % Yes (SD) Range N
Average
or % Yes (SD) Range
Baseline
vs. F1
F1
vs. F2
Baseline
vs. F2
In the last completed fiscal year, what was your organization’s total expenditures? b
Cohort 2006 305 111,962 95,306,721 0-
924,210,000 344 121,850 46,898,418
0-
530,000,000 - - - - 9,888
- -
Cohort 2007 130 170,000 2,278,061 0-14,332,234 151 175,000 1,760,317 0-16,000,000 148 146,199 1,953,727 0-16,000,000 5,000 -28,801 -23,801 *
Excluding CEY, over the past 12 months, has your organization sought or obtained revenue from grants/contracts from federal government agencies?
Cohort 2006 306 24.7 - - 346 23.9 - - - - - - -0.8 - -
Cohort 2007 130 34 - - 151 25.4 - - 149 26.7 - - -8.6 * 1.4 -7.3
Excluding CEY, over the past 12 months, has your organization sought or obtained revenue from grants/contracts from state or local government agencies?
Cohort 2006 306 39.7 - - 346 42.5 - - - - - - 2.8 - -
Cohort 2007 130 46.9 - - 151 46.3 - - 149 39.8 - - -0.6 -6.5 -7.1
Excluding CEY, over the past 12 months, has your organization sought or obtained revenue from grants/contracts from institutional funding sources (e.g., corporations, foundations)?
Cohort 2006 306 44.6 - - 346 43.7 - - - - - - -0.8 - -
Cohort 2007 130 51.8 - - 151 52.8 - - 149 50.7 - - 1 -2.1 -1
Excluding CEY, over the past 12 months, has your organization sought or obtained revenue from grants/contracts from individual donors or events?
Cohort 2006 306 60.3 - - 346 58.1 - - - - - - -2.2 - -
Cohort 2007 130 64.7 - - 151 57.8 - - 149 60.9 - - -6.9 3.1 -3.8
Excluding CEY, over the past 12 months, has your organization sought or obtained revenue from grants/contracts from Fees for Service?
Cohort 2006 305 30.8 - - 346 26.5 - - - - - - -4.3 - -
Cohort 2007 130 36.5 - - 151 41.4 - - 149 42.9 - - 4.9 1.5 6.4
Excluding CEY, over the past 12 months, has your organization sought or obtained revenue from grants/contracts from another organization?
Cohort 2006 306 40.1 - - 346 26.6 - - - - - - -13.6 ** - -
Cohort 2007 130 29.3 - - 151 26.5 - - 149 27.8 - - -2.8 1.3 -1.5
Funding Readiness
Does your organization have a fundraising/fund development plan?
Cohort 2006 306 37.3 - - 346 48 - - - - - - 10.7 ** - -
Cohort 2007 130 33.2 - - 151 41.3 - - 149 50.1 - - 8.1 8.8 * 16.9 **
Does your organization have financial management procedures for ensuring expenditures are properly authorized?
Cohort 2006 306 72.8 - - 346 77.2 - - - - - - 4.3 - -
Cohort 2007 130 76.1 - - 151 75.3 - - 149 80.9 - - -0.8 5.7 4.9

Abt Associates Inc. pg. 59
Exhibit A8: Changes in Organizational Development—Partners
Baseline First Follow-Up Second Follow-Up Significance Tests
Number of
respondents
(N)
Average
or % Yes
Standard
deviation
(SD) Range N
Average
or % Yes (SD) Range N
Average
or % Yes (SD) Range
Baseline
vs. F1
F1
vs. F2
Baseline
vs. F2
Does your organization have an individual, distinct from the executive director, who is responsible for financial management?
Cohort 2006 306 83.9 - - 332 87.2 - - - - - - 3.3 - -
Cohort 2007 130 82.6 - - 144 84.2 - - 139 88.5 - - 1.6 4.3 5.9
Human Resources Management
How many paid staff are full-time employees?
Cohort 2006 243 16.1 95.8 0-740 273 15.3 76.7 0-600 - - - - -0.8 - -
Cohort 2007 110 9 21.7 0-148 135 8.1 23.2 0-200 130 9.3 26.3 0-200 -0.9 1.2 0.3
How many unpaid staff are full-time employees?
Cohort 2006 118 0.7 2.4 0-15 152 1 2.9 0-15 - - - - 0.3 - -
Cohort 2007 67 0.9 3.9 0-30 65 1 2.2 0-15 82 0.7 1.2 0-6 0.1 -0.3 -0.2
How many paid staff are part-time employees?
Cohort 2006 243 5.1 14.6 0-69 273 6.3 18.9 0-125 - - - - 1.2 - -
Cohort 2007 110 8.7 19.7 0-142 135 7.9 20.7 0-200 129 7.1 17 0-144 -0.8 -0.8 -1.6
How many unpaid staff are part-time employees?
Cohort 2006 118 4.8 22.8 0-153 152 4.7 21.2 0-155 - - - - -0.1 - -
Cohort 2007 67 2.8 6 0-40 65 4.5 6.9 0-37 82 4.1 6.6 0-35 1.7 -0.4 1.3
How many volunteers are part-time employees?
Cohort 2006 217 31.7 116.4 0-680 268 49.7 487.1 1-4879 - - - - 18 - -
Cohort 2007 103 51.4 133.5 0-1100 119 49.1 111.1 1-782 116 59.6 202.9 1-1900 -2.3 10.5 8.2
Is there a job description for paid staff?
Cohort 2006 261 92.6 - - 275 92.8 - - - - - - 0.2 - -
Cohort 2007 116 92.3 - - 135 92.7 - - 129 89.6 - - 0.4 -3.1 -2.7
Is there a job description for unpaid staff?
Cohort 2006 145 55.6 - - 153 65 - - - - - - 9.4 - -
Cohort 2007 78 49.2 - - 67 61.5 - - 82 72.1 - - 12.3 10.7 * 23.0 **
Is there a job description for volunteers?
Cohort 2006 252 47.3 - - 271 58.5 - - - - - - 11.2 ** - -
Cohort 2007 118 48.4 - - 120 55.7 - - 118 59.8 - - 7.3 4.1 11.4 *

Abt Associates Inc. pg. 60
Exhibit A8: Changes in Organizational Development—Partners
Baseline First Follow-Up Second Follow-Up Significance Tests
Number of
respondents
(N)
Average
or % Yes
Standard
deviation
(SD) Range N
Average
or % Yes (SD) Range N
Average
or % Yes (SD) Range
Baseline
vs. F1
F1
vs. F2
Baseline
vs. F2
In the past 12 months, has your organization conducted performance reviews of paid staff?
Cohort 2006 255 60.3 - - 275 63.8 - - - - - - 3.5 - -
Cohort 2007 115 42.7 - - 135 49.8 - - 129 50.4 - - 7.1 0.6 7.7
In the past 12 months, has your organization conducted performance reviews of unpaid staff?
Cohort 2006 143 21.5 - - 154 36.6 - - - - - - 15.1 ** - -
Cohort 2007 75 23.7 - - 67 20.9 - - 82 36.8 - - -2.8 15.9 ** 13.2 *
In the past 12 months, has your organization conducted performance reviews of volunteers?
Cohort 2006 242 14.7 - - 273 20.5 - - - - - - 5.7 - -
Cohort 2007 113 16.7 - - 120 11.0 - - 118 16.0 - - -5.7 5 -0.7
IT Management
Does your organization regularly use computer software to keep financial records?
Cohort 2006 306 84.2 - - 332 89.4 - - - - - - 5.2 * - -
Cohort 2007 130 82.3 - - 144 94.2 - - 139 91.4 - - 11.9 ** -2.8 9.0 **
Do you have an adequate number of computers to meet your organization’s needs?
Cohort 2006 306 48.5 - - 332 66.5 - - - - - - 17.9 ** - -
Cohort 2007 130 32.7 - - 144 67.1 - - 139 74.2 - - 34.4 ** 7.1 41.5 **
Is the software on these computers adequate to meet your organization’s needs?
Cohort 2006 306 52.0 - - 332 75.0 - - - - - - 23.0 ** - -
Cohort 2007 130 40.6 - - 144 69.1 - - 139 77.2 - - 28.5 ** 8.1 36.5 **
Does your organization have access to the Internet?
Cohort 2006 306 95.7 - - 332 97.6 - - - - - - 1.9 - -
Cohort 2007 130 92.4 - - 144 95.8 - - 139 97.6 - - 3.5 1.7 5.2 *
Does your organization use the Internet to support an organizational website?
Cohort 2006 295 67.8 - - 324 76.7 - - - - - - 8.8 ** - -
Cohort 2007 120 75.2 - - 139 87.8 - - 136 88.4 - - 12.6 ** 0.6 13.2 **
Does your organization use the Internet for program email?
Cohort 2006 295 95.3 - - 324 95.4 - - - - - - 0.1 - -
Cohort 2007 120 94.3 - - 139 97.8 - - 136 94.3 - - 3.5 --3.5 -0.1

Abt Associates Inc. pg. 61
Exhibit A8: Changes in Organizational Development—Partners
Baseline First Follow-Up Second Follow-Up Significance Tests
Number of
respondents
(N)
Average
or % Yes
Standard
deviation
(SD) Range N
Average
or % Yes (SD) Range N
Average
or % Yes (SD) Range
Baseline
vs. F1
F1
vs. F2
Baseline
vs. F2
Does your organization use the Internet for research purposes?
Cohort 2006 295 94.8 - - 324 95.6 - - - - - - 0.8 - -
Cohort 2007 120 94.3 - - 139 97.5 - - 136 97.1 - - 3.2 -0.4 2.8
Does your organization use the Internet for community outreach purposes?
Cohort 2006 295 71.5 - - 324 81.3 - - - - - - 9.8 ** - -
Cohort 2007 120 72.6 - - 139 83.0 - - 136 86.0 - - 10.4 * 3.0 13.4 **
* p-value < 0.05 ** p-value <0.01 a The question at baseline referenced a different timeframe so results are not shown.b The number reported in the ―Average or % Yes‖ column represents the weighted median. Significance tests were performed on the unweighted medians using a signed rank test.
Source: CEY Outcome Study Baseline, Follow-Up 1, and Follow-Up 2 Surveys
Note: The sample at baseline includes 459 partner organizations and represents the population of 809 partner organizations in 2008 (2006 & 2007 cohorts). The sample at first follow-up includes 513 partner organizations and represents the population of 880 partner organizations in 2009 (2006 & 2007 cohorts). The sample at second follow-up includes 158 partner organizations and represents the population of 158 partner organizations in 2010 (2007 cohort only). ―Baseline vs. F1‖ denotes changes between baseline and first follow-up; ―F1 vs. F2‖ denotes changes between first follow-up and second follow-up; ―Baseline vs. F2‖ denotes changes between baseline and second follow-up.

Abt Associates Inc. pg. 62
Exhibit A.9: Changes in Program Development—Partners
Baseline First Follow-Up Second Follow-Up Significance Tests
Number of
respondents
(N)
Average
or % Yes
Standard
deviation
(SD) Range N
Average
or % Yes (SD) Range N
Average
or % Yes (SD) Range
Baseline
vs. F1
F1
vs. F2
Baseline
vs. F2
Service Delivery
In a month of service delivery, total number of program participants organization serves
Cohort 2006 267 423.8 2127.6 0-15,000 319 353.6 1311.2 0-9,000 - - - - -70.2 - -
Cohort 2007 119 362.9 656.1 0-4,500 147 380.1 778.5 0-5,000 145 526.4 1185.7 2-7000 17.2 146.3 163.5 *
In a month of service delivery, what is the total number of organizations for whom capacity building services are provided?
Cohort 2006 140 14.7 88.7 0-700 161 6.3 10.6 0-40 - - - - -8.3 - -
Cohort 2007 53 5.2 6.8 0-30 64 4.8 5.6 0-30 61 5.3 6.3 0-31 -0.5 0.5 0.1
Program Evaluation
In the past 12 months, has your organization obtained feedback from program participants about satisfaction with (direct) services provided?
Cohort 2006 261 82.4 - - 313 88.9 - - - - - - 6.5 * - -
Cohort 2007 114 74.9 - - 146 90.6 - - 145 91.1 - - 15.7 ** 0.5 16.2 **
In the past 12 months, has your organization conducted formal measurements of (direct service) program participant outcomes?
Cohort 2006 260 64.1 - - 313 68.7 - - - - - - 4.6 - -
Cohort 2007 114 54.1 - - 146 65.3 - - 145 67.2 - - 11.2 * 1.9 13.0 *
In the past 12 months, has your organization obtained feedback from program participants about satisfaction with (capacity building) services provided?
Cohort 2006 136 80.0 - - 156 88.5 - - - - - - 8.6 * - -
Cohort 2007 48 70.7 - - 63 95.0 - - 61 85.5 - - 24.3 ** -9.5 14.9
In the past 12 months, has your organization conducted formal measurements of (capacity building) program participant outcomes?
Cohort 2006 134 56.1 - - 156 59.9 - - - - - - 3.8 - -
Cohort 2007 46 36.9 - - 63 60.4 - - 61 68.7 - - 23.5 ** 8.2 31.8 **
* p-value < 0.05 ** p-value <0.01
Source: CEY Outcome Study Baseline, Follow-Up 1, and Follow-Up 2 Surveys
Note: The sample at baseline includes 459 partner organizations and represents the population of 809 partner organizations in 2008 (2006 & 2007 cohorts). The sample at first follow-up includes 513 partner organizations and represents the population of 880 partner organizations in 2009 (2006 & 2007 cohorts). The sample at second follow-up includes 158 partner organizations and represents the population of 158 partner organizations in 2010 (2007 cohort only). ―Baseline vs. F1‖ denotes changes between baseline and first follow-up; ―F1 vs. F2‖ denotes changes between first follow-up and second follow-up; ―Baseline vs. F2‖ denotes changes between baseline and second follow-up.

Abt Associates Inc. pg. 63
Exhibit A.10: Changes in Community Engagement—Partners
Baseline First Follow-Up Second Follow-Up Significance Tests
N % Yes N % Yes N % Yes
Baseline
vs. F1
F1
vs. F2
Baseline
vs. F2
Partnerships
Organization engaged in partnership arrangements with other organizations in its community/service area (not CEY)?
Cohort 2006 305 83.9 346 86.4 - - 2.4 - -
Cohort 2007 130 88.5 151 97.5 149 94.2 9.0 ** -3.3 5.7
Partnership arrangements with organizations in: government?
Cohort 2006 262 53.6 306 61.5 - - 7.9 * - -
Cohort 2007 116 52.9 147 52.8 141 58.4 -0.1 5.6 5.5
Partnership arrangements with organizations in: business/private?
Cohort 2006 262 60.6 306 63.3 - - 2.7 - -
Cohort 2007 116 53.1 147 57.7 141 69.4 4.6 11.7 ** 16.3 **
Partnership arrangements with organizations in: educational institutions?
Cohort 2006 262 79.7 306 80.9 - - 1.2 - -
Cohort 2007 116 77.9 147 84.7 141 81.6 6.8 -3.2 3.6
Partnership arrangements with organizations in: faith-based nonprofit?
Cohort 2006 262 71.0 306 78.2 - - 7.2 * - -
Cohort 2007 115 78.6 147 77.4 141 80.2 -1.2 2.7 1.6
Partnership arrangements with organizations in: secular nonprofit?
Cohort 2006 261 80.6 306 78.3 - - -2.3 - -
Cohort 2007 116 83.5 147 82.6 141 83.8 -0.9 1.2 0.3
Community Outreach
In the past 12 months has your organization rethought the way in which it gains knowledge about the community it serves?
Cohort 2006 306 71.4 346 85.3 - - 13.9 ** - -
Cohort 2007 130 69.5 151 87.6 149 87.3 18.1 ** -0.3 17.8 **
In the past 12 months has your organization implemented new or improved methods for gaining knowledge about the community it serves?
Cohort 2006 306 59.9 346 73.6 - - 13.8 ** - -
Cohort 2007 130 65.0 151 75.1 149 77.3 10.1 * 2.1 12.3 **
In the past 12 months has your organization rethought the way in which it markets its services or expands awareness about its mission to individuals, families, funders, or potential partners?
Cohort 2006 306 91.1 345 92.3 - - 1.2 - -
Cohort 2007 130 81.8 151 94.8 149 94.9 12.9 ** 0.1 13.0 **

Abt Associates Inc. pg. 64
Exhibit A.10: Changes in Community Engagement—Partners
Baseline First Follow-Up Second Follow-Up Significance Tests
N % Yes N % Yes N % Yes
Baseline
vs. F1
F1
vs. F2
Baseline
vs. F2
In the past 12 months has your organization implemented new or improved methods for marketing its services or expands awareness about its mission to individuals, families, funders, or potential
partners?
Cohort 2006 306 72.2 345 77.7 - - 5.5 - -
Cohort 2007 130 63.2 151 78.5 149 80.6 15.3 ** 2.1 17.3 **
* p-value < 0.05 ** p-value <0.01
Source: CEY Outcome Study Baseline, Follow-Up 1, and Follow-Up 2 Surveys
Note: The sample at baseline includes 459 partner organizations and represents the population of 809 partner organizations in 2008 (2006 & 2007 cohorts). The sample at first follow-up includes 513 partner organizations and represents the population of 880 partner organizations in 2009 (2006 & 2007 cohorts). The sample at follow-up two includes 158 partner organizations and represents the population of 158 partner organizations in 2010 (2007 cohort only).

Abt Associates Inc. pg. 65
Exhibit A.11: Changes in Partnership Capacity—Partners
Baseline First Follow-Up Second Follow-Up Significance Tests
N % Yes N % Yes N % Yes
Baseline
vs. F1
F1
vs. F2
Baseline
vs. F2
Leadership Development
Lead operates with the best interest of your organization in mind a, b
Cohort 2006 294 88.9 324 85.6 - - -3.2 - -
Cohort 2007 - - 138 82.3 139 87.0 - 4.7 -
Lead is collegial. It respects your organization a, b
Cohort 2006 294 91.8 327 88.9 - - -2.9 - -
Cohort 2007 - - 139 89.7 139 90.4 - 0.7 -
Lead is even-handed and ensures that project efforts are not skewed to a single party’s interests a, b
Cohort 2006 290 91.0 321 85.5 - - -5.4 * - -
Cohort 2007 - - 136 86.8 136 88.9 - 2.1 -
Lead is competent. It is able to provide the capacity building assistance your organization wants or expects a, b
Cohort 2006 292 86.4 329 81.8 - - -4.7 - -
Cohort 2007 - - 140 84.7 139 91.2 - 6.5 * -
Lead is dependable. It follows through on commitments in a timely and efficient manner a, b
Cohort 2006 294 87.5 328 82.4 - - -5.1 * - -
Cohort 2007 - - 140 82.8 139 87.6 - 4.9 -
Shared Mission and Objectives
Does your CEY partnership have a mission statement?
Cohort 2006 242 86.2 280 86.1 - - -0.1 - -
Cohort 2007 89 70.7 114 89.1 124 93.4 18.5 ** 4.3 22.8 **
Your organization fully understands the goals of your CEY partnership a
Cohort 2006 299 84.4 326 83.0 - - -1.4 - -
Cohort 2007 126 69.6 140 85.8 139 91.3 16.3 ** 5.5 21.8 **
Your organization was involved in setting the goals of your CEY partnership a, b
Cohort 2006 280 69.7 306 71.6 - - 1.8 - -
Cohort 2007 - - 137 73.7 137 79.9 - 6.2 -
Your CEY partnership’s goals are well aligned with the goals of your organization a, b
Cohort 2006 290 88.0 322 84.4 - - -3.6 - -
Cohort 2007 - - 136 83.7 139 85.5 - 1.8 -

Abt Associates Inc. pg. 66
Exhibit A.11: Changes in Partnership Capacity—Partners
Baseline First Follow-Up Second Follow-Up Significance Tests
N % Yes N % Yes N % Yes
Baseline
vs. F1
F1
vs. F2
Baseline
vs. F2
Lead’s mission and/or work is well aligned with your organization’s mission a,
Cohort 2006 294 87.1 323 87.3 - - 0.2 - -
Cohort 2007 128 84.7 135 88.1 137 91.5 3.3 3.5 6.8
Communication
Participating in the CEY partnership led to better communication and working relationships among participating organizations than before a, c
Cohort 2006 - - 327 86.0 - - - - -
Cohort 2007 - - 141 90.8 138 87.6 - -3.2 -
Action Plan
Does your partnership have a plan that outlines tasks to be achieved? b
Cohort 2006 270 86.2 298 87.4 - - 1.2 - -
Cohort 2007 - - 131 86.8 136 86.2 - -0.6 -
Does your partnership have a plan that outlines timeline by which these tasks are to be achieved? b
Cohort 2006 256 80.5 282 83.0 - - 2.5 - -
Cohort 2007 - - 126 83.2 130 78.9 - -4.3 -
Does your partnership have a plan that outlines individuals or organizations responsible for completing each task? b
Cohort 2006 252 77.5 275 80.2 - - 2.8 - -
Cohort 2007 - - 124 74.4 130 80.0 - 5.7 -
Sustainability Plan
Does your partnership have a sustainability plan? b
Cohort 2006 184 62.8 224 50.6 - - -12.1 ** - -
Cohort 2007 - - 88 43.4 106 39.5 - -4.0 -
On a scale of 1-5 please describe your opinion as to how likely or unlikely it is that your CEY partnership will continue past the 3-year grant cycle. d
Cohort 2006 285 81.7 304 80.3 - - -1.4 - -
Cohort 2007 122 85.2 138 80.8 128 78.8 -4.4 -2.0 -6.4

Abt Associates Inc. pg. 67
Exhibit A.11: Changes in Partnership Capacity—Partners
Baseline First Follow-Up Second Follow-Up Significance Tests
N % Yes N % Yes N % Yes
Baseline
vs. F1
F1
vs. F2
Baseline
vs. F2
* p-value < 0.05 ** p-value <0.01 a The baseline, first follow-up, and second follow-up averages indicate the percentage of respondents that answered ―Strongly Agree‖ or ―Agree‖ on a scale from 1 to 5 with 1 being ―Strongly Agree‖ and 5 being ―Strongly Disagree.‖ b Question was asked only of the 2006 cohort at baseline. c Question was asked only at first follow-up and second follow-up. d The baseline, first follow-up, and second follow-up averages indicate the percentage of respondents that answered ―Highly Likely‖ or ―Likely‖ on a scale from 1 to 5 with 1 being ―Highly Likely‖ and 5 being ―Highly Unlikely.‖
Source: CEY Outcome Study Baseline, Follow-Up 1, and Follow-Up 2 Surveys
Note: The sample at baseline includes 459 partner organizations and represents the population of 809 partner organizations in 2008 (2006 & 2007 cohorts). The sample at first follow-up includes 513 partner organizations and represents the population of 880 partner organizations in 2009 (2006 & 2007 cohorts). The sample at second follow-up includes 158 partner organizations and represents the population of 158 partner organizations in 2010 (2007 cohort only).
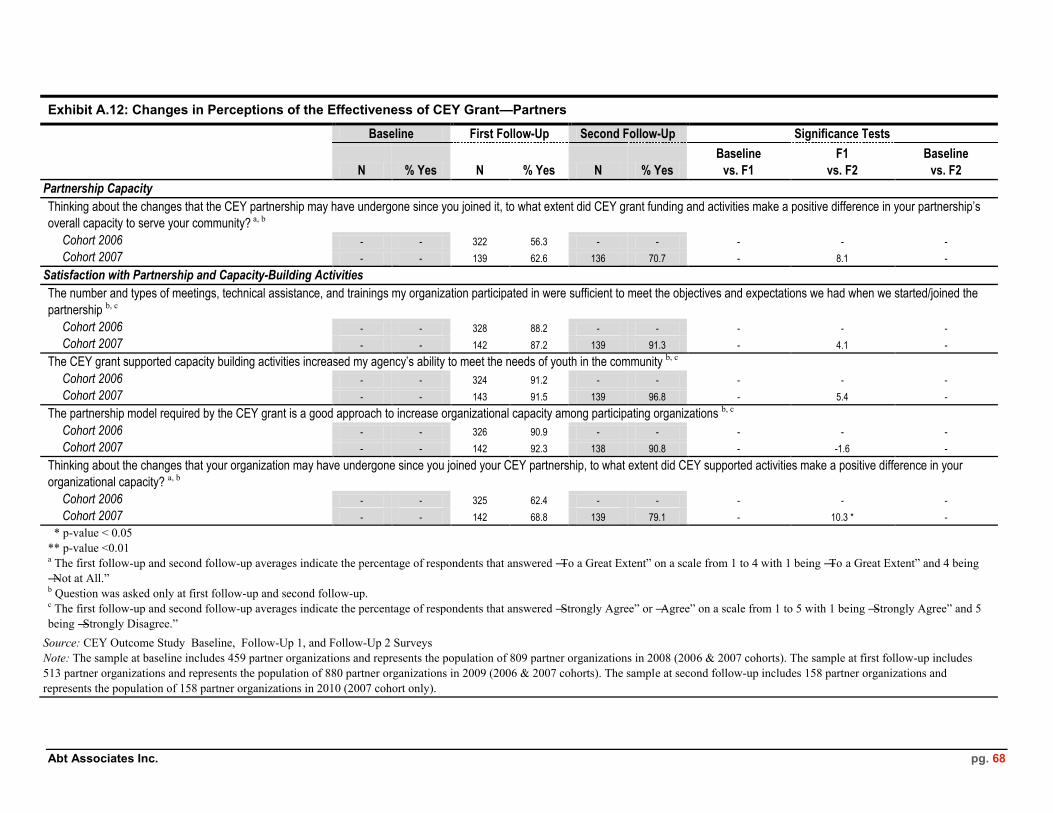
Abt Associates Inc. pg. 68
Exhibit A.12: Changes in Perceptions of the Effectiveness of CEY Grant—Partners
Baseline First Follow-Up Second Follow-Up Significance Tests
N % Yes N % Yes N % Yes
Baseline
vs. F1
F1
vs. F2
Baseline
vs. F2
Partnership Capacity
Thinking about the changes that the CEY partnership may have undergone since you joined it, to what extent did CEY grant funding and activities make a positive difference in your partnership’s
overall capacity to serve your community? a, b
Cohort 2006 - - 322 56.3 - - - - -
Cohort 2007 - - 139 62.6 136 70.7 - 8.1 -
Satisfaction with Partnership and Capacity-Building Activities
The number and types of meetings, technical assistance, and trainings my organization participated in were sufficient to meet the objectives and expectations we had when we started/joined the
partnership b, c
Cohort 2006 - - 328 88.2 - - - - -
Cohort 2007 - - 142 87.2 139 91.3 - 4.1 -
The CEY grant supported capacity building activities increased my agency’s ability to meet the needs of youth in the community b, c
Cohort 2006 - - 324 91.2 - - - - -
Cohort 2007 - - 143 91.5 139 96.8 - 5.4 -
The partnership model required by the CEY grant is a good approach to increase organizational capacity among participating organizations b, c
Cohort 2006 - - 326 90.9 - - - - -
Cohort 2007 - - 142 92.3 138 90.8 - -1.6 -
Thinking about the changes that your organization may have undergone since you joined your CEY partnership, to what extent did CEY supported activities make a positive difference in your
organizational capacity? a, b
Cohort 2006 - - 325 62.4 - - - - -
Cohort 2007 - - 142 68.8 139 79.1 - 10.3 * -
* p-value < 0.05 ** p-value <0.01 a The first follow-up and second follow-up averages indicate the percentage of respondents that answered ―To a Great Extent‖ on a scale from 1 to 4 with 1 being ―To a Great Extent‖ and 4 being ―Not at All.‖ b Question was asked only at first follow-up and second follow-up. c The first follow-up and second follow-up averages indicate the percentage of respondents that answered ―Strongly Agree‖ or ―Agree‖ on a scale from 1 to 5 with 1 being ―Strongly Agree‖ and 5 being ―Strongly Disagree.‖
Source: CEY Outcome Study Baseline, Follow-Up 1, and Follow-Up 2 Surveys Note: The sample at baseline includes 459 partner organizations and represents the population of 809 partner organizations in 2008 (2006 & 2007 cohorts). The sample at first follow-up includes 513 partner organizations and represents the population of 880 partner organizations in 2009 (2006 & 2007 cohorts). The sample at second follow-up includes 158 partner organizations and represents the population of 158 partner organizations in 2010 (2007 cohort only).