Embed Size (px)
Citation preview

1/12
Final Project Report
1. Contestant profile
Contestant name: Dr David Watson
Contestant occupation: Head of Field, Culture and Environment
University / Organisation Bath Spa University
E-mail:
Phone (incl. country code):
Number of people in your team: 7
2. Project overview
Title: Biodiversity restoration - can drones provide an accurate,
efficient and safe survey method?
Contest: UK
Quarry name: Batts Combe Quarry, UK
Prize category:
(select all appropriate)
☐ Education and Raising Awareness
☒ Habitat and Species Research
☐ Biodiversity Management
☐ Student Project
☐ Beyond Quarry Borders

2/12
Abstract
Drone technology is increasingly being used for scientific research and remote
sensing as part of environmental monitoring. It has a wide range of applications, for
example in agriculture, coastal erosion, animal tracking and land-use. It is
increasingly being used in environmental monitoring, including ecological
monitoring, alongside satellite images and aerial photography. It is a developing
area with applications being trialled and refined, taking advantage of the high
resolution images that can be captured.
This project aimed to determine the efficiency and accuracy of ecological surveys
undertaken using a drone compared to conventional survey techniques in
monitoring biodiversity restoration within quarries. In many quarries, large stretches
of benches are inaccessible or dangerous to access for ecological surveys, making it difficult to determine the success of
biodiversity restoration or the extent of natural colonisation. Batts Combe is relatively unusual in that a number of quarry
benches are accessible via an access track that cuts east-west across the quarry face.
Both quadrat-based survey and drone-based survey work (through image capture, processing and analysis using ImageJ
and Bio7) was undertaken on accessible study areas: quarry benches and adjacent donor and receptor meadow areas to
determine the utility of drones in biodiversity (restoration) monitoring. Data quality and time taken to collect and analyse
data were used to evaluate the accuracy and effectiveness of drone-based survey. Some preliminary work was also
undertaken on floral abundance, plant Species spectral signatures and modelling Habitat Quality Indicators. Safety and
cost-effectiveness were also considered.
Across all study areas fewer species were identified and recorded through the drone image methodology than ground-
based fieldwork. Cover estimates for bare soil in bench sites varied between survey/estimation methods but were not
significantly different. On quarry benches, species cover estimates from drone-derived images were consistently lower for
grasses and forbs compared to ground-based survey. In contrast at the meadow study areas, where there was negligible
bare ground or rock/scree recorded, forb cover estimates derived from image and in the field were similar but cover
estimates for grasses were recorded at approximately half those recorded in the field. Some species were more easily
recorded from drone images than others e.g. grasses such as Brachypodium sylvaticum, Briza media, and Festuca
species, plus larger forbs such as Plantago lanceolate, Lotus corniculatus, Leucanthemum vulgare and composites
including Leontodon species. National Vegetation Classification analyses produced outcomes with lower match
coefficients when using drone-survey data than ground-survey data, reflecting fewer species being recorded via drone
images. Floristic abundance estimates proved to be feasible if time-consuming when based on image analysis.
In terms of accuracy, drone-based surveys are still in the developmental stage. Nevertheless, the results from this
research were encouraging. By using drone-based survey a better and more immediate overview could be gained of
biodiversity restoration at Batts Combe Quarry. Responding to such data would increase plant and associated species
abundance in the extraction site and in the wider environment.
This novel survey technique, using cutting edge technology,
bridges the gap between remote sensing and ground-based
survey. As well as informing biodiversity restoration and
management, it may well also improve understanding of natural
colonisation from adjacent SSSIs and support landscape-scale
conservation work.
Through adopting and developing drone-based aerial
surveillance, HeidelbergCement could take a leading role in this
developing technology for ecological monitoring and so enable
better biodiversity restoration and management.

3/12
Introduction
Originally for military purposes Unmanned Aerial Vehicles (UAV’s) [AKA drones], drone technology is increasingly being
used for scientific research and remote sensing as part of environmental monitoring (Lisein et al., 2013). It is a developing
area with applications being trialled and refined. Current applications include: agricultural monitoring (Scaioni et al., 2009;
Krishna, 2016), characterizing river morphology over time (Lejot et al., 2007), monitoring the behaviour of animal species
(Struthers et al., 2015), as well as sampling animal populations (Jones et al., 2006; Van Gemert et al., 2014;
Weissensteiner et al., 2015), canopy cover and light conditions within forests (Getzin et al., 2012; Getzin et al., 2014),
habitat mapping and visualising human land use (Koh and Wich, 2012) and even assessing construction work
(Eisenbeiss, 2004). Specialised sensory equipment can be added to drones to record chemical variations in the
environment, such as methane emissions from landfills (Fjelsted et al., 2015). The utility of drones will increase with
developments in their technology e.g. camera resolutions producing sharper images and use of filters for working with
infra-red and ultraviolet light. In terms of ecological applications, drones are becoming useful in bridging the gap between
relatively low resolution remote-sensed images and detailed ecological field survey (Thomas, 2016).
Biodiversity surveying and monitoring usually requires surveyors to physically visit a site and record species frequency or
abundance, usually by performing traditional sampling techniques such as random sampling with quadrats (Buckland et
al., 2005). Such recording is implemented for plant species surveys, particularly as the surveyor’s confidence enforced by
physically seeing and identifying species on site (Laliberte et al., 2004). However manually surveying is often regarded as
a time consuming process and questions of surveyor competence and data quality, due to variation between surveyors,
has been raised (Cherrill and McClean, 1999; Scott and Hallam, 2003). Ground based surveys can also be limited in
terms of access to particular sites however aerial drones remove this limitation by flying and recording images or data in
these inaccessible areas (Koh and Wich, 2012) and within restricted timeframes such as in intertidal zones (Pickles,
2016). Quarries, such as at Batts Combe in the UK’s Mendip hills, are examples of areas where accessibility to people is
restricted, both physically by the topography and for safety purposes, yet require surveying to monitor biodiversity
restoration projects (Gilardelli et al., 2013). Conducting ecological surveys in such quarries may be achieved by deploying
drones.
In many quarries, large stretches of benches are inaccessible or dangerous to access for ecological surveys, making it
difficult to determine the success of biodiversity restoration or the extent of natural colonisation. Batts Combe is relatively
unusual in that a number of quarry benches are accessible via an access track that cuts east-west across the quarry face.
This access makes it possible to reach some bench sections that have been restored or have colonised naturally and so
enables a range of survey techniques to be tested and evaluated.
Aims and Objectives
This research project aimed to take advantage of the easy access to restored/colonised benches and other areas at Batts
Combe to directly compare the effectiveness of surveys undertaken using conventional quadrat-based survey with that of
using drone-based methods. If the drone-based method were to prove sufficiently accurate then it could provide a new
tool for surveying and monitoring biodiversity restoration on inaccessible quarry benches and other areas. Data from such
surveys could provide useful new data on biodiversity value and the appropriateness of restoration techniques. Such data
might be available more rapidly, better informing restoration and management decisions in response to need. Therefore,
findings from this project could have wider application to biodiversity monitoring in limestone quarries elsewhere in
Mendip and in hard rock quarries in general around the world.
This project aimed to determine the efficiency and accuracy of ecological surveys undertaken using a drone compared to conventional survey techniques in monitoring biodiversity restoration within quarries. The objectives were to:
1. research target species for survey and identify suitable bench sites at Batts Combe for survey trials. 2. develop a novel technique for using drones to take images of species for subsequent analysis and quantification
of species abundance.
3. trial drone-based surveys of species abundance and compare with standard methods used directly in the field of the same sites.
4/12
4. analyse and compare data derived from the two techniques and review accuracy and ease of use.
Background Information
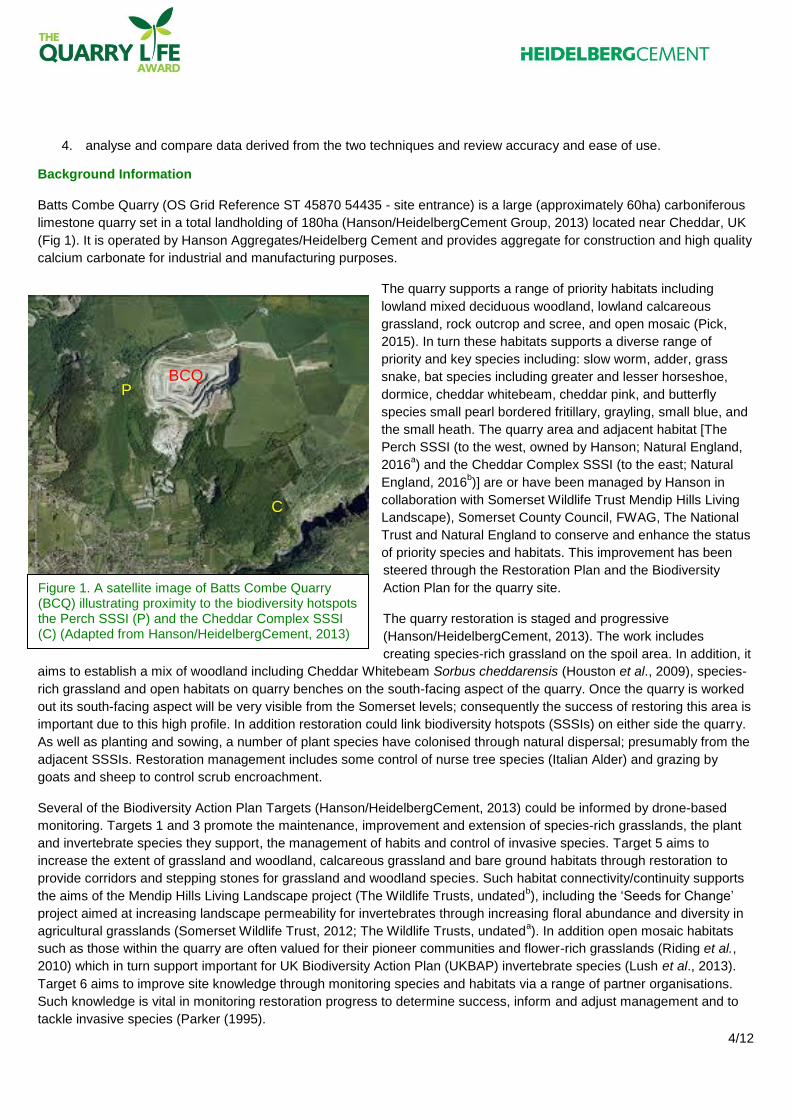
Batts Combe Quarry (OS Grid Reference ST 45870 54435 - site entrance) is a large (approximately 60ha) carboniferous
limestone quarry set in a total landholding of 180ha (Hanson/HeidelbergCement Group, 2013) located near Cheddar, UK
(Fig 1). It is operated by Hanson Aggregates/Heidelberg Cement and provides aggregate for construction and high quality
calcium carbonate for industrial and manufacturing purposes.
The quarry supports a range of priority habitats including
lowland mixed deciduous woodland, lowland calcareous
grassland, rock outcrop and scree, and open mosaic (Pick,
2015). In turn these habitats supports a diverse range of
priority and key species including: slow worm, adder, grass
snake, bat species including greater and lesser horseshoe,
dormice, cheddar whitebeam, cheddar pink, and butterfly
species small pearl bordered fritillary, grayling, small blue, and
the small heath. The quarry area and adjacent habitat [The
Perch SSSI (to the west, owned by Hanson; Natural England,
2016a) and the Cheddar Complex SSSI (to the east; Natural
England, 2016b)] are or have been managed by Hanson in
collaboration with Somerset Wildlife Trust Mendip Hills Living
Landscape), Somerset County Council, FWAG, The National
Trust and Natural England to conserve and enhance the status
of priority species and habitats. This improvement has been
steered through the Restoration Plan and the Biodiversity
Action Plan for the quarry site.
The quarry restoration is staged and progressive
(Hanson/HeidelbergCement, 2013). The work includes
creating species-rich grassland on the spoil area. In addition, it
aims to establish a mix of woodland including Cheddar Whitebeam Sorbus cheddarensis (Houston et al., 2009), species-
rich grassland and open habitats on quarry benches on the south-facing aspect of the quarry. Once the quarry is worked
out its south-facing aspect will be very visible from the Somerset levels; consequently the success of restoring this area is
important due to this high profile. In addition restoration could link biodiversity hotspots (SSSIs) on either side the quarry.
As well as planting and sowing, a number of plant species have colonised through natural dispersal; presumably from the
adjacent SSSIs. Restoration management includes some control of nurse tree species (Italian Alder) and grazing by
goats and sheep to control scrub encroachment.
Several of the Biodiversity Action Plan Targets (Hanson/HeidelbergCement, 2013) could be informed by drone-based
monitoring. Targets 1 and 3 promote the maintenance, improvement and extension of species-rich grasslands, the plant
and invertebrate species they support, the management of habits and control of invasive species. Target 5 aims to
increase the extent of grassland and woodland, calcareous grassland and bare ground habitats through restoration to
provide corridors and stepping stones for grassland and woodland species. Such habitat connectivity/continuity supports
the aims of the Mendip Hills Living Landscape project (The Wildlife Trusts, undatedb), including the ‘Seeds for Change’
project aimed at increasing landscape permeability for invertebrates through increasing floral abundance and diversity in
agricultural grasslands (Somerset Wildlife Trust, 2012; The Wildlife Trusts, undateda). In addition open mosaic habitats
such as those within the quarry are often valued for their pioneer communities and flower-rich grasslands (Riding et al.,
2010) which in turn support important for UK Biodiversity Action Plan (UKBAP) invertebrate species (Lush et al., 2013).
Target 6 aims to improve site knowledge through monitoring species and habitats via a range of partner organisations.
Such knowledge is vital in monitoring restoration progress to determine success, inform and adjust management and to
tackle invasive species (Parker (1995).
Figure 1. A satellite image of Batts Combe Quarry (BCQ) illustrating proximity to the biodiversity hotspots the Perch SSSI (P) and the Cheddar Complex SSSI (C) (Adapted from Hanson/HeidelbergCement, 2013)
P
C
BCQ

5/12
Methodology
This research was undertaken by three students from Bath Spa University (Tom Bell, Rozy Gray and Rich Spiers)
working in collaboration with four members of staff (Derek Beard, Graham Smith, Darrel Watts and David Watson).
Both quadrat-based survey and drone-based survey work (through image capture, processing and analysis) was
undertaken on accessible quarry benches and adjacent donor and receptor meadow areas to determine the utility of
drones in biodiversity (restoration) monitoring. Data quality and time taken to collect and analyse data were used to
evaluate the accuracy and effectiveness of drone-based survey. The approach was experimental and phased, developing
in order to address the core aims and objectives but also responding to initial findings and feedback following
presentation to Quarry Life judges in July 2016.
Study Areas. Within the quarry, three different areas of study that were accessible by foot were identified in consultation
with Hanson’s Landscape Architect to compare both drone and quadrat surveying (Pick, 2016). These sites included: a
bench within the quarry, the donor meadow site and receptor meadow site (Fig. 2). The bench had been restored in 1997
using a mixture of quarry waste and subsoil and was sewn with an amenity grass mix nurse crop
(Hanson/HeidelbergCement 2016). The bench site was subdivided into the back wall lower slope (slope) and the floor of
the bench (flat), as these areas clearly differed in terms of vegetation composition presumably due to differences in
physical conditions, especially drainage. The Donor Meadow site was a well-established grassland, maintained to prevent
scrub encroachment) and used to
provide green hay which in 2009 was
strewn on the quarry tip, known as the
Receptor Meadow site with a view to
create species-rich grassland (Pick,
2016).
Ground-based Survey. Stratified
random sampling of vegetation was
undertaken by the team within study
areas over three days from 16th to 24
th
June 2016. At each site, standard
National Vegetation Classification
survey was employed (after Rodwell,
1993). The estimated abundance
(cover as a percentage) of individual
species, litter, bare soil and rock and
scree were recorded in 2X2m quadrats placed within homogeneous stands of vegetation. A total of five quadrats were
recorded at each study area, with five quadrats recorded on both the slope and the flat sections of the bench study area.
Plant species were the main focus in survey work and invertebrates were noted as casual records.
Drone-based Survey. Drone flights using a DJI Phantom 3 Professional (DJI, 2016) were undertaken by or under the
supervision of trained personnel. The drone was chosen as a relatively inexpensive but relatively sophisticated piece of
equipment which has also been used in research trials by Natural England’s Field Unit (Thomas, 2016).
Drone flights were conducted on the same days as ground-based vegetation surveys, within the same homogeneous
stands of vegetation. One metre rulers were scattered within each study area to enable image scaling. The drone was
calibrated to enable its GPS features then flown within each area of study taking a combination of both still images and
video recording. The drone was flown between approximately 2 and 5m above ground level and still images (when
hovering) captured (12 Megapixels covering between 7 and 40 square metres, depending upon the situation and
elevation). More images were taken than used, with images selected to represent the homogeneous stands of vegetation.
Plant species were the main focus of surveys; it proved impossible to survey invertebrate species (e.g. butterflies) due to
the down-draught caused by the drone.
Figure 2. Study Areas: Bench (yellow), Donor Meadow (red) and Receptor (Restored) Meadow (blue).

6/12
Image Processing and Analysis. Up to five images were selected from drone flights over each study area as being
representative samples of homogeneous stands in each area.
Analogous to ground-based survey, un-edited images were viewed on standard pc monitors and used as a basis for
estimating [by eye] the abundance of grasses, herbs, bare ground and rock/scree. Estimating cover values that combined
to give 100% cover in total per sample was chosen as the preferred method of assessing two dimensional images,
though potential inaccuracies were acknowledged. In addition images were inspected and the presence of species
recorded within each image. Zoom controls and adjustments to image brightness and contrast were used to aid
identification of smaller species or to inspect plant morphology e.g. presence/absence of tendrils.
In addition, with a view to semi-automating analysis (to save staff time), drone camera-captured still images were
processed and analysed using the ImageJ component integrated within the software Bio7 (version 2.4.0) (after Austenfeld
and Beyschlag, 2012; ImageJ, 2016). True colour images were processed and enhanced into transformed RGB colour
composite 3-band intensity hue saturation (IHS) images, similarly to the image processing described by Laliberte et al.
(2006).
Image processing included sharpening and correcting by creating and subtracting backgrounds with a sliding parabolid
and disabled smoothing function within ImageJ. Images were then further enhanced by increasing the contrast to display
clearer distinct differences between visible features within images. The conversion into IHS images by this process
removed shadows within the images and allowed for easier mapping and estimation of vegetation, rock and bare ground
abundances (cover as a percentage) based on colour segmentation, whereby different features within the image were
represented by different colour frequencies (after Bernhardt and Griffing (2001). Cover estimates for vegetation cover,
bare soil and rock/scree were determined in turn through Bio7 using a pixel counter and the ImageJ threshold plug-ins to
select image features based on their intensity, hue and saturation. Standard IHS settings were developed to determine
the extent of each cover type by depicting each type as black in turn and using the software to determine the number of
black pixels and so cover (%) (Table 1).
Floral Abundance. Attempts were also made to evaluate the use of drone-derived images in determining floral
abundance as this is a measure used to evaluate habitat restoration for invertebrates; field based survey was used for the
Seeds for Change project (Somerset Wildlife Trust, 2012; The Wildlife Trusts, undateda) to improve habitat permeability
and promote invertebrate mobility. Floral abundance estimates was achieved by inspecting images and manually
counting inflorescences that could be distinguished within the images.
Plant Species Signatures. Attempts were also made to characterise the spectral signatures of species that were key to
certain habitats, for example constant species (Rodwell, 2003) or those of particular importance as nectar sources e.g.
Wild Marjoram Origanum vulgare.
Floristic and Data Analysis; Modelling Habitat Quality Indicators. Data were collated using Microsoft Excel
(Microsoft, 2016). Generalised Linear Models (GLMs) were used to evaluate potential habitat quality indicators by relating
ground and drone derived data was undertaken using R (RFSC, 2016). GLM was also used to determine the level of
confidence in data derived for bare soil and rock and scree for ground-based data and image derived data. NVC
classifications are sometimes used as a means of monitoring restoration progress or management effectiveness.
Therefore further attempts to assess drone survey comparability, species presence data from ground-based and image-
based data (assessed by eye) were analysed to determine National Vegetation Classification System communities using
MAVIS (Dart Computing, 2000). Similarly, a minimum variance cluster analysis (Ward, 1963) was conducted using R
(RFSC, 2016) to determine the level of similarity between ground-based and image-based data for each of the four study
areas.
Resource Efficiency. The cost of equipment and requirements for undertaking surveys was noted. In addition the
amount of time spent in field survey, drone flights, image analysis and subsequent data analysis was noted on the basis
of obtaining data from 5 samples from each study area.

7/12
Table 1. Workflow for analysis of drone-derived image processing to provide cover estimates of features based on pixel counts. See text for details. Only partial images are presented as examples.
a) The original unedited true colour RGB image taken by the drone.
b) IHS image (RGB transformed image) of the bench flat emphasises distinct visual differences between vegetation, bare soil, and rock and scree features.
c) Total cover (%) of vegetation (black) was determined by colour thresholding saturation and brightness between 0-255 with a hue range of 36-130. Total vegetation = 24.69%.
d) Total cover (%) of soil (black) was determined by colour thresholding saturation and brightness between 0-255 with a hue range of 0-35 and 215-255. Total soil cover = 62.71%.
e) Total cover (%) of rock and scree (black) was determined by colour thresholding saturation and brightness between 0-255 with a hue range of 131-214. Total rock and scree cover = 12.6%.
Consultation with the Conservation Sector. The use of drones for ecological survey is a developing area an little has
been published in journals. Telephone interviews were undertaken with other practitioners currently developing and
deploying drone-based survey. In particular selected speakers at the CIEEM Autumn conference (1st/2
nd November 2016)
on ‘Skills for the Future: Understanding the impacts of new tools, techniques and approaches’ were contacted, including
members of the Natural England Field Unit and Environmental Records Centres.
Results
Ground-based Survey. 46 grass and forb species were recorded in bench flat quadrats, 61 in the bench slope, 45 in the
receptor meadow and 56 in the donor meadow. Mean numbers of grass and forb species per quadrat in each area were
similar (21.4 to 30.4) (Table 2), though the species composition differed, in particular between the bench areas (early
successional, sparse grasslands where much of the cover was bare soil or rock/scree) and meadow areas (tall, dense
grassland swards, which had mean total cover values of 132.6 and 141.6%). The greatest amounts of bare soil (mean
41%), rock and scree (mean 30%) were recorded in the bench flat samples and least in the receptor and donor meadows
(both zero cover (%) for both parameters). It was noted that the bench flat area was poorly drained, with scattered
shallow pools of water.
Drone-based Survey. In general fewer species were recorded from drone derived images than through field survey: 32
grass and forb species were recorded in bench flat quadrats, 31 in the bench slope, 37 in the receptor meadow and 42 in
the donor meadow. Mean numbers of grass and forb species per quadrat in each area were similar (19.8 to 27.4) (Table
2), though generally lower than found in ground-based survey. Total cover values were capped at 100% (see method),
however it was clear that on the bench areas the drone-based estimates of bare soil cover were generally greater (means
25.4 and 54.0%) compared to the ground-based surveys (12.4 and 41% respectively). In contrast rock and scree mean
cover estimates from drone images were generally lower (8.6 and 21.0%) compared to ground-based survey (13.4 and
30.0% respectively). The (arguably) more objective cover estimates for bare soil derived from pixel counts closely agreed
with the drone image estimate than the ground survey estimate on the bench slope but was closer to the ground survey
estimate in the more open habitat of the bench flat.

8/12
Table 2. Summary statistics [Mean values (Standard Deviations)] for floristic survey data (estimation by eye
unless otherwise stated) derived from ground-based survey and drone-derived image survey in study areas,
June 2016 n = 5 for each study area unless otherwise stated. Key: - = SD not calculated. ND = No data.
Rock/scree pixel count cover estimates may indicate that field and image estimates by eye generally over estimate rock
and scree. As with bare soil, the pixel-based cover estimate was closest to the ground survey estimate in the bench flat
study area. GLM analysis showed no significant difference between ground survey estimates, drone image estimates or
pixel counts for bare ground or for rock and scree.
In the bench areas, cover estimates from drone-derived images were consistently lower for grasses and forbs compared
to ground-based survey. In contrast at the meadow study areas, where there was negligible bare ground or rock/scree
recorded, forb cover estimates derived from image and in the field were similar but cover estimates for grasses were
recorded at approximately half those recorded in the field.
Species relatively easily recorded from images included grasses such as Brachypodium sylvaticum, Briza media, and
Festuca species, plus larger forbs such as Plantago lanceolate, Lotus corniculatus, Leucanthemum vulgare and
composites including Leontodon species. Scrub species such as Buddleia were also easily identifiable. Difficulty was
experienced in distinguishing between some species and genera in drone-derived images e.g. yellow composites such as
those belonging to Leontodon genus and Trifolium campestre/dubium. Smaller species such as Linum spp were probably
under recorded. In addition some species were simply hidden from view by over-topping species e.g. in the Meadow
areas. However the resolution of images was sufficient to observe variation in floret colour and the presence/absence of
small features, such a tendrils (given the right aspect).
Floral Abundance. Manual counting of flower heads visible in drone-based images provide feasible, if time consuming (
per image). Inflorescence abundance varied substantially between study areas and between samples. The mean number
of inflorescences per image ranged from 95.5 (SD 64.1) in the Receptor Meadow to 685.8 (SD 460.9) on the bench slope.
Plant Species Signatures and Evaluation of Potential Habitat Quality Indicators. Beyond developing a series of IHS
settings to distinguish between vegetation, bare soil and rock/scree, limited progress was made in identifying settings that
would enable species signatures to be developed to quantify species abundance through image analysis. Initial outcomes
from developing Habitat Quality Indicators were more successful, especially where species abundance could be related
to the abundance of a physical feature or assemblage of species. Wild Marjoram Origanum vulgare was trialled due to its
9/12
important for invertebrates and being characteristic of open mosaic habitats (Fig 3). GLM analysis indicated that its
abundance to be very strongly associated with cover of other forbs (p≤0.001) but negatively associated with increasing
bare soil (p≤0.001) and rock (p≤0.005). These parameters may be used as a proxy for O. vulgare if it can’t be identified
through a spectral signature.
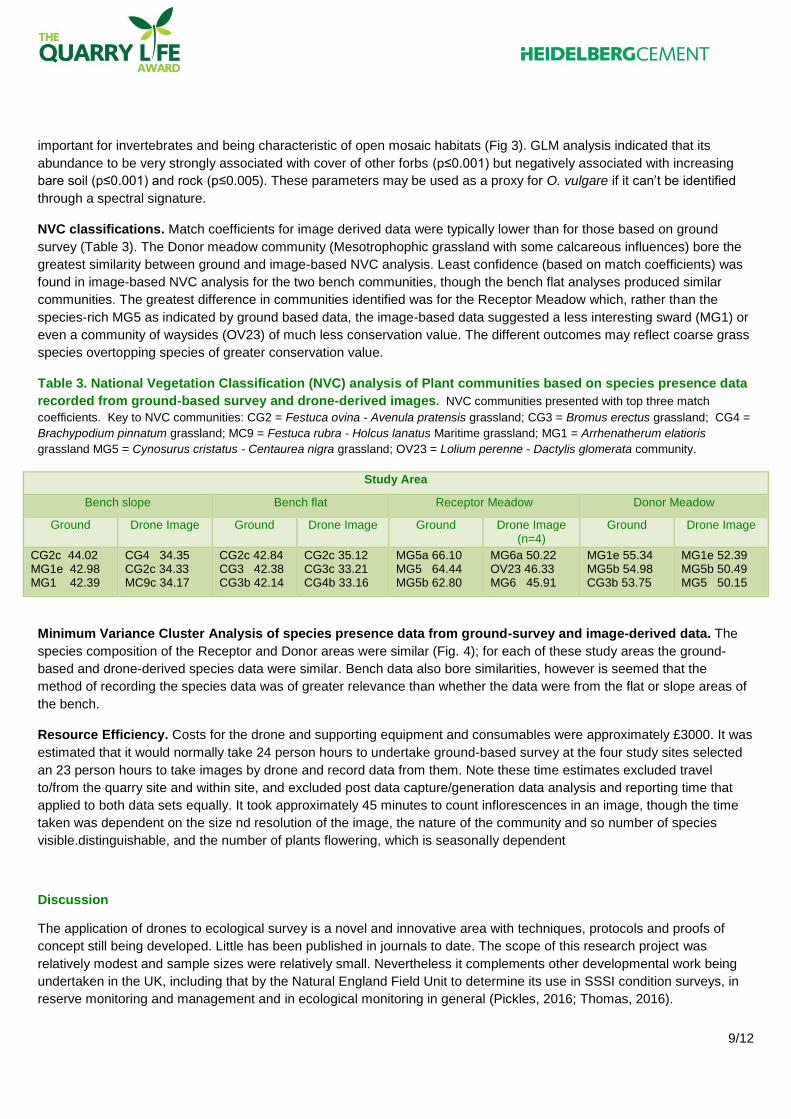
NVC classifications. Match coefficients for image derived data were typically lower than for those based on ground
survey (Table 3). The Donor meadow community (Mesotrophophic grassland with some calcareous influences) bore the
greatest similarity between ground and image-based NVC analysis. Least confidence (based on match coefficients) was
found in image-based NVC analysis for the two bench communities, though the bench flat analyses produced similar
communities. The greatest difference in communities identified was for the Receptor Meadow which, rather than the
species-rich MG5 as indicated by ground based data, the image-based data suggested a less interesting sward (MG1) or
even a community of waysides (OV23) of much less conservation value. The different outcomes may reflect coarse grass
species overtopping species of greater conservation value.
Table 3. National Vegetation Classification (NVC) analysis of Plant communities based on species presence data
recorded from ground-based survey and drone-derived images. NVC communities presented with top three match
coefficients. Key to NVC communities: CG2 = Festuca ovina - Avenula pratensis grassland; CG3 = Bromus erectus grassland; CG4 =
Brachypodium pinnatum grassland; MC9 = Festuca rubra - Holcus lanatus Maritime grassland; MG1 = Arrhenatherum elatioris
grassland MG5 = Cynosurus cristatus - Centaurea nigra grassland; OV23 = Lolium perenne - Dactylis glomerata community.
Study Area
Bench slope Bench flat Receptor Meadow Donor Meadow
Ground Drone Image Ground Drone Image Ground Drone Image (n=4)
Ground Drone Image
CG2c 44.02 MG1e 42.98 MG1 42.39
CG4 34.35 CG2c 34.33 MC9c 34.17
CG2c 42.84 CG3 42.38 CG3b 42.14
CG2c 35.12 CG3c 33.21 CG4b 33.16
MG5a 66.10 MG5 64.44 MG5b 62.80
MG6a 50.22 OV23 46.33 MG6 45.91
MG1e 55.34 MG5b 54.98 CG3b 53.75
MG1e 52.39 MG5b 50.49 MG5 50.15
Minimum Variance Cluster Analysis of species presence data from ground-survey and image-derived data. The
species composition of the Receptor and Donor areas were similar (Fig. 4); for each of these study areas the ground-
based and drone-derived species data were similar. Bench data also bore similarities, however is seemed that the
method of recording the species data was of greater relevance than whether the data were from the flat or slope areas of
the bench.
Resource Efficiency. Costs for the drone and supporting equipment and consumables were approximately £3000. It was
estimated that it would normally take 24 person hours to undertake ground-based survey at the four study sites selected
an 23 person hours to take images by drone and record data from them. Note these time estimates excluded travel
to/from the quarry site and within site, and excluded post data capture/generation data analysis and reporting time that
applied to both data sets equally. It took approximately 45 minutes to count inflorescences in an image, though the time
taken was dependent on the size nd resolution of the image, the nature of the community and so number of species
visible.distinguishable, and the number of plants flowering, which is seasonally dependent
Discussion
The application of drones to ecological survey is a novel and innovative area with techniques, protocols and proofs of
concept still being developed. Little has been published in journals to date. The scope of this research project was
relatively modest and sample sizes were relatively small. Nevertheless it complements other developmental work being
undertaken in the UK, including that by the Natural England Field Unit to determine its use in SSSI condition surveys, in
reserve monitoring and management and in ecological monitoring in general (Pickles, 2016; Thomas, 2016).

10/12
Comparison of Ground and Drone-image-based Survey. Across all study sites (i.e. open mosaics and more mature
grasslands) fewer species were identified and recorded through the drone image methodology than ground-based
fieldwork. Cover estimates for bare soil in bench sites varied between survey/estimation methods but were not
significantly different. This outcome may reflect sample size, the ability to delve into vegetation in the field to record
different strata, and possibly biases inherent and specific to field or to image-based recording. Whether estimates of
grass and forb abundance differed between survey methods seemed to relate to plant community type, with grasses and
forbs being under estimated in more open, developing communities. In mature grasslands estimation of forbs abundance
gave similar results but again grass species abundance was underestimated. This outcome suggests that the applicability
of estimation of cover from images may suit monitoring of some communities more than others.
Remote sensing by satellite imagery or aerial photography has distinct benefits (covering large areas within a survey) but
is limited in producing imagery sufficiently detailed to distinguish between specific plant species (Turner et al., 2012).
Although there were some difficulties in identifying species from drone-derived images, these high resolution images
enabled between half and two-thirds of species to be recorded that were also recorded in the field. This partial reduction
in species recorded will have reduced match coefficients and led to some differences in communities identified in NVC
analyses. These differences are probably also reflected in outcomes from the Cluster analysis. Differences in NVC
classifications may have also resulted from different samples being surveyed in ground and drone image samples but still
within the same sward. Such differences might explain why the Receptor Meadow was identified as being of lower
conservation interest (MG1 or OV23) than suggested by ground survey (MG5). Alternatively, without the ability to inspect
lower strata in the grassland via images, some species may have been missed in image inspection. In monitoring terms, a
drone survey that indicated a reduction in diversity would prompt a focused, more detailed survey on the ground to verify
or refute findings and ultimately inform the restoration management prescription. Overall NVC analyses should be treated
with some caution until the drone-survey technique has improved.
From the numbers of inflorescences recorded from images, assessing floral abundance seems to be entirely feasible,
though time consuming, using drone-derived images. However distinguishing between species’ inflorescences to
determine floral diversity may sometimes be difficult (e.g. Leontodon spp). However in terms of habitat quality for
invertebrates, it is ensuring the presence of a range of inflorescence classes or guilds that is key (Somerset Wildlife Trust,
2012; The Wildlife Trusts, undateda).
Factors affecting Drone Surveying, Imagery and Analysis. As with any ecological survey work, weather conditions will
determine whether survey can be undertaken and the quality of the data. The Phantom is a ‘fair weather’ drone (DJI,
Figure 4. Minimum Variance Cluster Analysis of species presence recorded in ground-based quadrat survey data and from inspection of drone-derived images from the study areas.

11/12
2016) and should not be flown in any precipitation. Temperatures should be between 0 and 40 oC and it should not be
flown above Beaufort Scale 2 wind conditions. The amount and quality of light can influence image quality spectral
analysis. High incident light levels will reflect from plant surfaces and reduce image quality. Plant hue will also be affected
by development stage and by environmental stresses such as drought. Of course flowering is seasonal and if recording
community distribution is dependent on a constant or key plant e.g. Thyme being in flower for its colour signature to be
recorded, then drone flights need to coincide with peak flowering time (Pickles, 2016). This issue affects ground-survey in
a similar manner, as species identification is usually easier in the flowering season. In this research, the failure to
developing plant signatures may have been due to very high resolution images being captured, resulting in the multiple
hues of flowers e.g. O. vulgare making simple spectral analysis very difficult to achieve.
Added value of the project for biodiversity, the society and the company – Survey Accuracy, Efficiency and
Safety
Remote sensing by satellite imagery or aerial photography enables large areas to be covered quickly but the imagery is
too poor to distinguish between specific plant species (Turner et al., 2012). As noted at Batts Combe the capability of
drones to fly at lower altitudes and record higher resolution imagery can make it easier to distinguish between species in
the images captured (Scaioni et al., 2009; Hunt et al., 2010). Subsequent analysis e.g. NVC can add value, though the
accuracy of assessments could be improved by using larger sample sizes and refining the survey technique. The project
has demonstrated that high quality images can be collected quickly, rapidly viewed and could the inform biodiversity
management decisions on issues such as vegetation establishment following restoration. In addition, the technique can
reveal whether open mosaic habitats, so valuable for invertebrates, are being overgrown as shrub species are easily
identifiable. The images will also provide a date-stamped data set which can be archived. Together these data will enable
the company to more easily chart the progress of biodiversity restoration and colonisation in both accessible and normally
inaccessible areas of quarries. Drone surveys can be used to rapidly identify areas of particular interest and concern in
large sites such as quarried and so better target biodiversity monitoring and management resources (Thomas, 2016).
The staff time invested in obtaining survey data from drone images is equivalent to that used for ground surveying when
working in accessible areas. However, to concur with other research (Rango et al., 2009; Martin et al., 2012), it would
obviously be much quicker, safer and cheaper (no rope work) to use drone surveys for high-level benches and other
inaccessible areas. Safety requirements put in place by the Civil Aviation Authority must also be abided by. However in a
relatively discrete site like Batts Combe, several Kilometres from an airport or flightpath the risk is minimal. In addition
training in drone use aids safe operation as well as technical ability. The size of the quarry also makes drone-based
ecological survey more attractive (especially if linked to geological drone surveys) as tailored aerial photography and
satellite imagery would be an expensive option.
In terms of accuracy, drone-based surveys are still in the developmental stage (Pickles, 2016; Thomas, 2016). Overall,
by using drone-based survey the company will have a greater and more immediate overview of the extent to which it is
meeting its Biodiversity Restoration and BAP Targets. Responding to such data would increase plant and associated
species abundance in the extraction site and in the wider environment. Restoration would be more successful, helping the
restored quarry to blend into the escarpment to the benefit of people on the Somerset Levels and in the Cheddar area.
This novel survey technique, using cutting edge technology, bridges the gap between remote sensing and ground-based
survey. As well as informing biodiversity restoration and management, it may well also inform the company’s
understanding of natural colonisation from adjacent SSSIs and support landscape-scale conservation work undertaken by
NGOs in the region e.g. the Living Landscape project on Mendip undertaken by Somerset Wildlife Trust. It would also be
in step with approaches being researched and adopted by national Governmental conservation bodies such as Natural
England.
Conclusions and Recommendations
Through adopting and developing drone-based aerial surveillance, HeidelbergCement could take a leading role in this
developing technology for ecological monitoring and so enable better biodiversity restoration and management.

12/12
To be kept and filled in at the end of your report
Project tags (select all appropriate):
This will be use to classify your project in the project archive (that is also available online)
Project focus:
☒Biodiversity management
☐Cooperation programmes
☐Education and Raising awareness
☒Endangered and protected species
☐Invasive species
☒Landscape management - rehabilitation
☐Rehabilitation
☒Scientific research
☐Soil management
☐Urban ecology
☐Water management
Flora:
☐Conifers and cycads
☐Ferns
☒Flowering plants
☐Fungi
☐Mosses and liverworts
Fauna:
☐Amphibians
☐Birds
☒Dragonflies & Butterflies
☐Fish
☐Mammals
☐Reptiles
☐Spiders
☒Other insects
☐Other species
Habitat:
☐Cave
☒Cliffs
☐Fields - crops/culture
☐Forest
☒Grassland
☐Human settlement
☒Open areas of rocky grounds
☐Recreational areas
☒Screes
☐Shrubs & groves
☐Soil
☐Wander biotopes
☐Water bodies (flowing, standing)
☐Wetland
Stakeholders:
☒Authorities
☒Local community
☒NGOs
☐Schools
☒Universities
13/12
Annex 1. Acknowledgements
We would like to thank Hanson/ Heidelberg Cement for the funding provided for the Quarry Life project which has supported the students on placement, working as interns and undertaking dissertation research on this project. We would also like to thank staff at Batts Combe Quarry for their help and support during the project, in particular Alexandra Pick for providing background data and access to sites.
Annex 2. References
Austenfeld, M. and Beyschlag, W., (2012) A Graphical User Interface for R in a Rich Client Platform for Ecological Modeling.Journal of Statistical Software. 49 (4) 1-19.
Bernhardt, S.P. & Griffing, L.R. (2001) 'An evaluation of image analysis at benthic sites based on colour segmentation'. Bulletin of Marine Science, 69 (2) 639-653.
Buckland, S.T., Magurran, A.E., Green, R.E. & Fewster, R.M. (2005) 'Monitoring change in biodiversity through composite indices'. Philosophical Transactions of the Royal Society of London.Series B, Biological Sciences, 360 (1454) 243-254.
Cherrill, A. and McClean, C. Between-Observer Variation in the Application of a Standard Method of Habitat Mapping by Environmental Consultants in the UK. The Journal of Applied Ecology, Vol. 36, No. 6. (Dec., 1999), pp. 989-1008.
DJI (2016) Phantom 3 Professional Specification. Available from: http://www.dji.com/phantom-3-pro/info [Accessed 27/06/2016]
Eisenbeiss, H. (2004) 'A mini unmanned aerial vehicle (UAV): system overview and image acquisition'. International Archives of Photogrammetry. Remote Sensing and Spatial Information Sciences. [Online] Available from: https://www.ufpe.br/latecgeo/images/PDF/artigo%20aps%20uav%20aplications.pdf [Accessed 30/06/2016].
Fjelsted, L., Thomasen, T., Valbjørn, I., Scheutz, C., Christensen, A. & Kjeldsen, P. (2015)"Development of an innovative uav-mounted screening tool for landfill gas emissions". Proceedings Sardinia 2015, Fifteenth International Waste Management and Landfill Symposium. CISA Publisher. [Online] Available from: http://orbit.dtu.dk/files/118745117/Fjelsted_et_al._2015_SarSym15.pdf [Accessed 30/06/2016].
Getzin, S., Nuske, R.S. & Wiegand, K. (2014) 'Using unmanned aerial vehicles (UAV) to quantify spatial gap patterns in forests'. Remote Sensing, 6 (8) 6988-7004.
Getzin, S., Wiegand, K. & Schöning, I. (2012) 'Assessing biodiversity in forests using very high‐resolution images and unmanned aerial vehicles'. Methods in Ecology and Evolution, 3 (2) 397-404.
Gilardelli, F., Sgorbati, S., Citterio, S. & Gentili, R. (2013) 'Restoring limestone quarries: hayseed, commercial seed mixture or spontaneous succession?'. Land Degradation & Development, 27 (2) 316-324.
Hanson/HeidelbergCement (2013) Batts Combe Quarry Site Biodiversity Action Plan. Original version 2006, updated 2013. Available from: http://www.hanson.co.uk/en/Hanson-Aggregates-Batts-Combe-Quarry [Accessed 26/03/2016]
Hanson/HeidelbergCement (2016) Batts Combe Quarry: Quarry Restoration History. Drawing No. B25m/216. Internal Document.
Houston, L., Robertson, A., Jones, K., Smith, S.C.C. and Hiscock, S.J. (2009) ‘An account of the Whitebeams (Sorbus L., Rosaceae) of Cheddar Gorge, England, with description of three new species.’ Watsonia, 27: 283–300
Hunt, E.R., Hively, W.D., Fujikawa, S.J., Linden, D.S., Daughtry, C.S. & McCarty, G.W. (2010) 'Acquisition of NIR-green-blue digital photographs from unmanned aircraft for crop monitoring'. Remote Sensing, 2 (1) 290-305.
ImageJ (2016) Biol7 Webpage. Available at: http://imagej.net/Bio7 [Accessed 25/0602016]
Jones, G.P., Pearlstine, L.G. & Percival, H.F. (2006) 'An Assessment of Small Unmanned Aerial Vehicles for Wildlife Research'. Wildlife Society Bulletin (1973-2006), 34 (3) 750-758.

14/12
Koh, L. & Wich, S. (2012) 'Dawn of drone ecology: low-cost autonomous aerial vehicles for conservation'. Tropical Conservation Science, 5 (2) 121-132.
Krishna, K.R. (2016) Push Button Agriculture Robotics, Drones, Satellite-Guided Soil and Crop Management. [Online] Available from: http://www.crcnetbase.com/doi/pdfplus/10.1201/b19940-1 [Accessed 30/06/2016].
Laliberte, A.S., Rango, A., Havstad, K.M., Paris, J.F., Beck, R.F., McNeely, R. & Gonzalez, A.L. (2004) 'Object-oriented image analysis for mapping shrub encroachment from 1937 to 2003 in southern New Mexico'. Remote Sensing of Environment, 93 (1) 198-210.
Laliberte, A.S., Rango, A., Herrick, J.E., Fredrickson, E.L. & Burkett, L. (2007) 'An object-based image analysis approach for determining fractional cover of senescent and green vegetation with digital plot photography'. Journal of Arid Environments, 69 (1) 1-14.
Lejot, J., Delacourt, C., Piégay, H., Fournier, T., Trémélo, M. & Allemand, P. (2007) 'Very high spatial resolution imagery for channel bathymetry and topography from an unmanned mapping controlled platform'. Earth Surface Processes and Landforms, 32 (11) 1705-1725.
Lisein, J., Linchant, J., Lejeune, P., Bouché, P. & Vermeulen, C. (2013) 'Aerial surveys using an unmanned aerial system (UAS): comparison of different methods for estimating the surface area of sampling strips'. Tropical Conservation Science, 6 (4) 506-520.
Lush, M.J., Kirby, P and Shepherd, P. (2013) Open Mosaic Habitat Survey Handbook.Report by exeGensIS to Defra/CCW, March 2013. Available from: https://www.buglife.org.uk/sites/default/files/omhsurveyhandbookfinal.pdf [Accessed 01/06/2016].
Martin, J., Edwards, H.H., Burgess, M.A., Percival, H.F., Fagan, D.E., Gardner, B.E., Ortega-Ortiz, J.G., Ifju, P.G., Evers, B.S. & Rambo, T.J. (2012) 'Estimating distribution of hidden objects with drones: From tennis balls to manatees'. PLoS One, 7 (6) [Online] Available from: http://journals.plos.org/plosone/article?id=10.1371/journal.pone.0038882 [Accessed 30/06/2016].
Microsoft (2016) Microsoft Excel: 2013 [Computer Software] Available from: http://office.microsoft.com/en-gb/excel/ [Accessed 22nd June 2016].
Natural England (2016a) The Perch SSSI Citation. Available at: http://www.sssi.naturalengland.org.uk/citation/citation_photo/1005794.pdf [Accessed 26/03/2016]
Natural England (2016b) Cheddar Complex SSSI Citation. Available at: http://www.sssi.naturalengland.org.uk/citation/citation_photo/1003940.pdf [Accessed 26/03/2016]
Parker, D.M. (1995) Habitat Creation – a critical guide. English Nature Science. No. 21. Report by SGS Environment to English Nature.
Pick, A (2015) MPA Biodiversity Planning Awards. Submission by Hanson Quarry Products Europe Ltd. and Aggregate Industries UK Ltd. April 2015.
Pick, A. (2016) Interview with Alexandra Pick, Senior Landscape Architect Hanson, April 2016.
Pickles, S (2016) Personal Communication. Director, North and East Yorkshire Ecological Data Centre.Telephone Interview, September 2016.
Riding, A., Critchley, N, Wilson, L. and Parker, J. (2010) Definition and mapping of open mosaic habitats on previously developed land: Phase 1. ADAS UK Ltd report to Defra
RFSC – The R Foundation for Statistical Computing (2016) The R Project for Statistical Computing [Computer Software] Available from: http://www.r-project.org/index.html [Accessed 22nd June 2016].
Rodwell, J.S. (ed.) 1993. British Plant Communities. Volume 4. Grasslands and montane communities. Cambridge, Cambridge University Press.
Somerset Wildlife Trust (2012) England’s green and pleasant land. Where have all the flowers gone? Article on grassland enhancement, creation and management within the Mendip Living Landscape area. Somerset Wildlife Trust. Available from: http://www.somersetwildlife.org/hres/Mendip%20pages.pdf [Accessed 17th July 2016]

15/12
The Wildlife Trusts (undateda) Farming for a Living Landscape. Briefing document based on the Seeds for Change project, Mendip Hills Living Landscape, Somerset. Available from: https://www.wildlifetrusts.org/sites/default/files/mendip-final.pdf [Accessed 17th July 2016]
The Wildlife Trusts (undatedb) Mendip Hills Living Landscape, Somerset. Available from:
www.wildlifetrusts.org/node/3593 [Accessed 20th September 2016]
Thomas, P (2016) Personal Communication. Natural England Field Unit.Telephone Interview, September 2016.
Ward J. 1963. Hierarchical grouping to optimize an objective function. J. Am. Stat. Assoc. 58(301): 236-244

16/12
Annex 3. Images of Study Sites
Bench slope (left) and Bench Flat (right)
Receptor Meadow
Donor Meadow

17/12
Annex 4. Ground-based Survey Data
Bench Slope a Bench Flat Ground flora Composition based on 5 2x2 m Quadrats (Cover, %). Full data sets in Excel format available on request.

18/12

19/12
Receptor and Donor Meadow Ground flora Composition based on 5 2x2 m Quadrats (Cover, %). Full data sets in Excel format available on request.

20/12

21/12
Annex 5. Drone-based Image-derived Data
Species Presence Data

22/12

23/12
Cover Estimates from images
Determination of Pixel Counts for bench images using image processing and analysis

24/12
Annex 6. Drone-derived Images and analysis
This image illustrates how drone-derived images can be distorted (the vectors should be centred within the 2x2m quadrat). However such distortion can be corrected through using ImageJ.
This pair of images illustrates how features from unedited images can be represented in a processed image. Some features are easier to identify than others.

25/12
Habitat Evaluation – Indicators from Analysis of Drone Data
Marjoram is both important for invertebrates and a characteristic species of “Open Mosaic Habitats on Previously Developed Land.” In these GLM effect plots Origanum vulgare was very strongly associated with cover of other broad-leaved flowering plants, and negatively associated with increasing grass cover, bare soil and rock. Drone images can identify areas with a high cover of forbs on inaccessible benches. Using the meta data in PLANTATT (Hill, M.O., Preston, C.D. & Roy, D.B. (2004)), we can predict plant assemblages (of plants with similar attributes) which are likely to be present.
Carex flacca (Glaucous Sedge) occurred at all four sampled sites. Abundance was negatively correlated with rock, but the presence or absence bare soil wasn’t a significant factor.

26/12
Annex 7. Specification of Drone used in this research
“DJI Phantom 3 Professional” Drone – Introduction and Technical Specifications
The remote controlled vehicle used by the Bath Spa Quarry Life Award team was a Phantom 3 produced by DJI Ltd. (Da Jiang Innovations Science and Technology Company) of China. The vehicle has 4 rotors in a square configuration, making it a quadcopter. It is powered by onboard rechargeable batteries and piloted from a hand-held radio control. A camera mounted on the underside can be used to record still images and videos. Also the camera can live stream to a tablet or smart-phone with the DJI GO app which can also be used to direct the vehicle by map/GPS coordinates and waypoints.
Useful Links
DJI Official Website – http://www.dji.com/
Phantom 3 Technical Specs page – http://www.dji.com/phantom-3-pro/info
DJI Wiki (contains in depth manuals and instructions relating to the Phantom) – http://wiki.dji.com/en/index.php/Main_Page
A simple guide to the DJI GO app by DroneLife.com – http://dronelife.com/2015/09/15/a-look-inside-the-dji-go-app/
The Civil Aviation Authority regulations page relating to drones – https://www.caa.co.uk/Consumers/Model-aircraft-and-drones/Flying-drones/
DJI’s full list of Restricted Airspace and No-Fly Zones for Drones in the UK – http://www.dji.com/flysafe/no-fly
Important Terminology
In the strictest sense, the Phantom 3 is not a true “drone” as it is primarily piloted from a distance using a handheld controller. The Phantom 3 model used can be programmed to fly a pre-determined course but has little autonomous decision making ability of its own. The CAA (Civil Aviation Authority) official terminology refers to these vehicles as RPAS’s (Remotely Piloted Aircraft Systems) or UAV’s (Unmanned Aerial Vehicles).
However, the term “drone” is a widely used colloquialism for this kind of flying vehicle and for ease, shall be used to refer to the vehicle from here on.
Technical Specifications
Link to DJI website for full/complex specifications (voltages, transmission frequencies etc.) http://www.dji.com/phantom-3-pro/info
The Drone
Name – DJI Phantom 3 Pro
Configuration – 4 rotors, unmanned quadcopter
Gross Weight – 1280g
Body Diameter – 350mm
Max Ascent and Descent Speed – 5m/s and 3m/s
Max Horizontal Speed – 16m/s (in calm, still conditions)
Max Service Ceiling – 6000m (Default limit set to 120m above take-off but fully adjustable)

27/12
Controller Transmission Distance – Up to 3.5km without interference (European standards compliant)
Operating Temperature for all Components – 0 to 40 degrees Celsius
Battery Type – Lithium Ion rechargeable and dismountable packs
In-Flight Charge Life – 20 minutes approximately when full charge (dependant on ambient temperature and the level of manoeuvring in-flight)
Maximum distance from operator – 500m
Camera
Megapixels – 12
Frames per Second – 30
Video Resolution – 4k
Lens – f/2.8
Field of View – 94 degrees
Stabilisation – Gimbal with vibration dampening mountings (keeps camera exactly upright and focussed on one spot and minimises transfer of vibration from drone to the camera)
Gimbal Axis – Pitch, Roll and Yaw
Gimbal Range – Pitch -90 to +30 degrees
Media Storage – Micro SD Card (mounted on-board the drone body). Max size – 64 Gigabytes. Speed Class 10 required
28/12
Annex 8. Flight Guide - Essential Kit for Drone Flight
Before taking the drone out for flying survey work, the pilot should ensure they have the following items packed in a suitable kit bag-
Phantom Drone Chassis - (packed in waterproof hard case with foam lining)
1x DJI Phantom radio control handset + Recharging Cable – (Necessary for drone piloting. Comes with adjustable clip for mounting tablet/smart device on the handset. Powered by internal rechargeable battery so taking the charging cable could be useful if power is available on site. Approximate battery life of the handset is 3 – 4 hours)
REMEMBER TO FULLY CHARGE HANDSET BATTERY BEFORE UNDERTAKING ANY FIELDWORK
4x Plastic Rotor Blades - (A set of rotors consists of 4 blades. Two of which are black tipped and the other two silver tipped. These must be mounted on the correct motors fore and aft to ensure the blades are spinning in the correct direction to generate lift)
2x Spare Rotor Blade sets - (Very important as snapped rotors after collisions/crashes are common. The blades are designed to break and be replaced easily so take as many spare sets as required)
1x Rotor Spanner + Selection of Small Screwdrivers – (Used for tightening the rotor blades on for flight and screwdrivers and a small general purpose toolkit is useful for minor repairs in the field)
Lithium-ion battery and Spares - (From the DJI specification and the experience of the author, the usual battery duration is approximately 20 minutes, dependant on ambient temperature and how hard and fast the pilot is manoeuvring the Phantom. Using 20 minutes as a guide, it is best practice to estimate how much flight time is required and take as many spare batteries as needed. Battery charging times are many hours so pre-charging is essential but take the charger set if power is available on site if required) REMEMBER TO FULLY CHARGE ALL BATTERIES BEFORE UNDERTAKING ANY FIELDWORK
1x Tablet or Smart Phone with DJI GO app installed – (A tablet is best used for screen size but most android or apple smart devices can install the app and may be used to view the flight controls and GPS flight map. App available from the Google Play Store or the App Store) REMEMBER TO FULLY CHARGE SMART DEVICE BEFORE UNDERTAKING ANY FIELDWORK
1x Micro USB or Apple device cord – (For connecting the table device with the DJI GO app to the radio control handset, essential for using the control and camera livestream features of the app with the drone in flight)
1x Sun Visor for the Tablet Screen – (Tablet touchscreens are generally hard to see outdoors due to sun glare, a visor mounted on the control handset will negate this and provide shelter for the tablet from the weather)
1x Waterproof Plastic Ground Sheet – (Can be placed on to the ground to provide a flat landing site for the drone. Can double as a rain cover to place over the drone when landed. Small heavy weights should be taken to prevent the sheet from blowing away)
Media Storage – Several Micro SD Card 64 Gigabytes storage recomended. Speed Class 10 required
·

29/12
Pre-flight Checklist
1. Unpack drone kit on waterproof ground sheet or appropriate flat surface
2. Switch on control handset and attached tablet with DJI GO app activated
3. Screw on rotor blades with spanner ensuring they are tight down and that the colour coded blades are attached to the appropriate colour coded, fore and aft motor shafts
4. Insert battery pack. Switch on drone by pressing switch on battery pack once, releasing, then holding the button for 2 seconds until a tone is heard
5. Ensure battery pack charge indicator lights show full charge
6. The ventral mounted camera will now rotate on its mount automatically for a few seconds, detecting what orientation it is in. The camera will now remain pointing forwards, stable on its gimbal.
7. Sync the on-board GPS system by picking up the drone by the landing skids, then holding it at chest height, slowly rotate on the spot until the GPS indicator lights on top show green. Do this above the ground sheet/landing site as this will be location which the drone remembers as its “Home” site.
8. Ensure the DJI GO app is synced with the drone, showing the correct GPS map location, flight control readouts and camera livestream
9. Carefully look around the ground of the flight area. Look for any people or animals which may be in the way and ensure they are informed of the flight or moved away. Check again for potential obstacles. If unsafe, do not fly.
10. Carefully look at the sky above the flight area. Look for any other low flying aircraft, hang gliders, parasails etc. Look for dangerous obstacles such as power/telecom wires, tall trees, buildings. Keep well clear of these or abandon the flight if the airspace is not clear and safe.
11. Make sure the rotor blades are not obstructed and clear of debris
12. Drone now ready for flight

30/12
Annex 9. Estimation of working hours taken for ground-based and drone-image-based survey methods.
Ground-based Survey Drone-based Survey
Field Survey [four study areas; 5
samples per area; two staff; breaks
excluded]
12 hours [3 hrs per study area]
24 people hours
4 hours [1 hour per study area]
8 people hours
Image inspection [unedited
images inspected to determine
species presence and cover
estimates]
N/A 15 hours [20 images @ 45 minutes
per image; breaks excluded]
15 people hours [by any number of
people].
Total time [to produce equivalent
data sets for analysis through
approach used in this research]
24 hours 23 hours
Additional work on pixcel cover
estimates [correcting and
processing images and obtaining
pixel counts]
6.5 hours