Embed Size (px)
DESCRIPTION
Final Paper for Applied Investment Management: The paper analysis Cree, Inc. in great detail. The report also provides investment guidance.
Citation preview
Cree, Inc.
James StenstromApplied Investment ManagementMay 6th, 2009

Cree, Inc. is a Mid Cap semiconductor corporation specializing in LED lighting. With 33 million dollars in Net Income in 2008, the company possesses tremendous growth potential. Income growth will be a result of increased adoption of LED lighting solutions by consumers currently using incandescent and compact florescent lighting. Two key drivers of the adoption of LED technology are the decrease of LED light costs to consumers and the potential escalation of consumer electric power costs.
Investment in Cree would further exaggerate the Reynolds Endowment Portfolio’s exposure to the Tech/Telecom sector and increase the fund’s beta. I recommend not purchasing the stock at any price greater than $22. A target price of $21.59 compares to the mean analyst target of $21.69.
1
Company Overview and Summary of Thesis/Recommendation
Cree, Inc. is a leader in the LED lighting industry. The firm’s core competencies reside in the microchip technology the company has developed, particularly silicon carbide and gallium(III) nitride. With sales of nearly 500 million dollars and a market cap of 2.4 billion dollars, Cree is the largest publicly traded LED light manufacturer in the world. The firm sells LED microchips at many levels of completion as well as some completed lighting fixtures. Cree’s other minor sources of revenue are all related to similar microchip technology and research.
2-Apr-07
28-Apr-07
24-May
-07
19-Jun-07
15-Jul-0
7
10-Aug-07
5-Sep-07
1-Oct-
07
27-Oct-
07
22-Nov-0
7
18-Dec
-07
13-Jan-08
8-Feb-08
5-Mar-
08
31-Mar-
08
26-Apr-08
22-May
-08
17-Jun-08
13-Jul-0
8
8-Aug-08
3-Sep-08
29-Sep-08
25-Oct-
08
20-Nov-0
8
16-Dec
-08
11-Jan-09
6-Feb-09
4-Mar-
09
30-Mar-
090
10
20
30
40
Figure: CREE Price (Past Three Years)
Over the next year Cree should underperform the market somewhat. While Cree will likely move with the US equity market over the short term, Cree’s beta (.97) is less than one indicating the price of equity will somewhat less than the market as a whole.
While Cree should underperform the market, I would not recommend shorting Cree as the company is often speculated as a potential acquisition target. This factor makes Cree a particularly risky short position to take to raise capital for other investment activities. However, the fundamentals of the stock do not warrant the current price. This sentiment is echoed by the street. The sentiment, combined with the significant short interest, indicate that many investors do not think that LED lighting technology will be widespread in the short term. Another macroeconomic influence on the viability of LED lighting is energy costs; should energy costs increase significantly, that change would likely have a beneficial effect on Cree equity. If holding Cree, I recommend liquidating the position, while if not invested, my recommendation is to allocate capital elsewhere.
In terms of derivative investing, purchasing call options to profit if a takeover attempt were to be announced is also a viable position, but the likelihood of Cree’s continuing or new operations making that investment position profitable is low. Selling call options is risky due to the outside acquisition
2
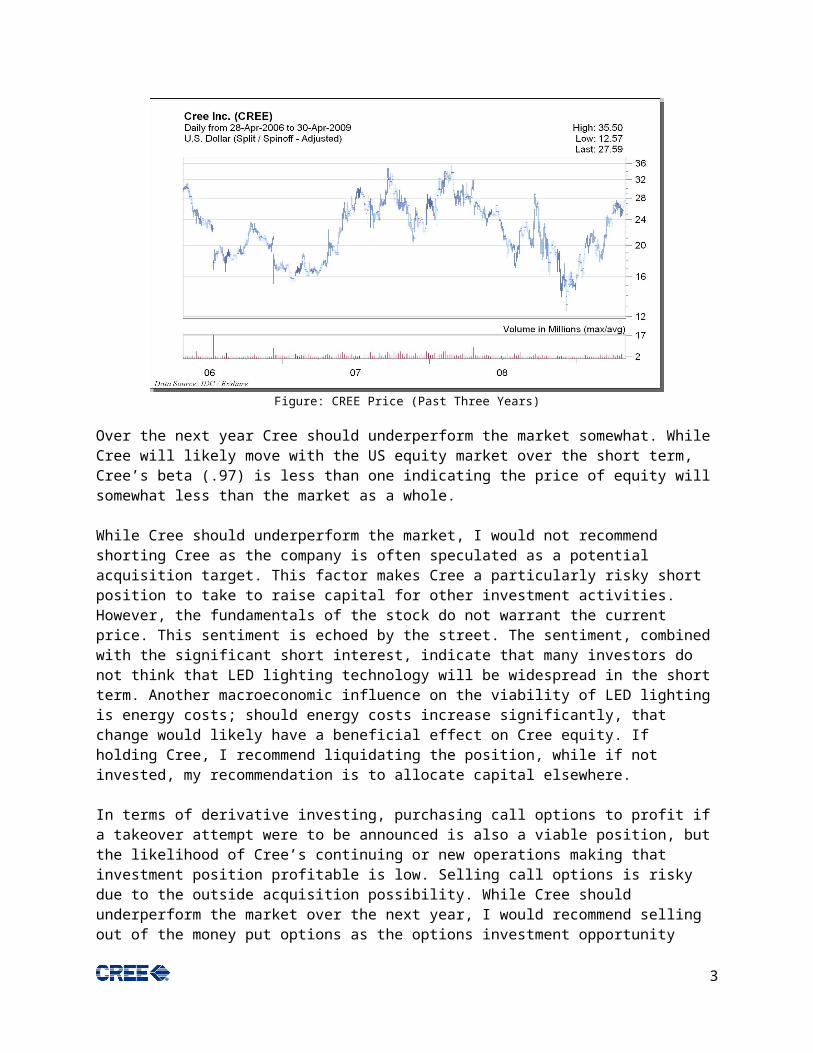
possibility. While Cree should underperform the market over the next year, I would recommend selling out of the money put options as the options investment opportunity because current operations are not why investors hold the position; it is the likelihood that LED lighting will be widespread in the future. As a result, current news is not likely to have a significant adverse effect on share price.
History/Background
Product market and industry summary
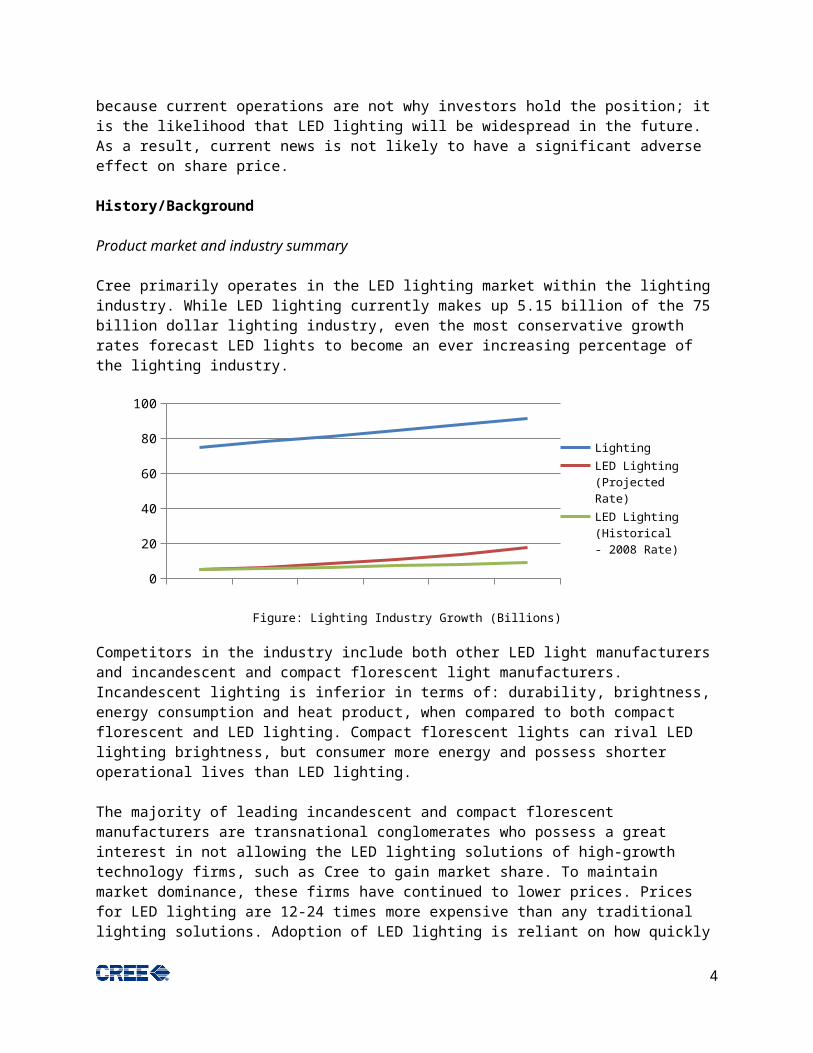
Cree primarily operates in the LED lighting market within the lighting industry. While LED lighting currently makes up 5.15 billion of the 75 billion dollar lighting industry, even the most conservative growth rates forecast LED lights to become an ever increasing percentage of the lighting industry.
2008 2009 2010 2011 2012 20130
20
40
60
80
100
Lighting
LED Lighting (Pro-jected Rate)
LED Lighting (His-torical - 2008 Rate)
Figure: Lighting Industry Growth (Billions)
Competitors in the industry include both other LED light manufacturers and incandescent and compact florescent light manufacturers. Incandescent lighting is inferior in terms of: durability, brightness, energy consumption and heat product, when compared to both compact florescent and LED lighting. Compact florescent lights can rival LED lighting brightness, but consumer more energy and possess shorter operational lives than LED lighting.
The majority of leading incandescent and compact florescent manufacturers are transnational conglomerates who possess a great interest in not allowing the LED lighting solutions of high-growth technology firms, such as Cree to gain market share. To maintain market dominance, these firms have continued to lower prices. Prices for LED lighting are 12-24 times more expensive than any traditional lighting solutions. Adoption of LED lighting is reliant on how quickly Cree, and other manufacturers, can close the price gap between LED lights and other lighting solutions.
3
2008 2009 2010 2011 2012 201302468
101214161820
LED Lighting (Pro-jected Rate)
LED Lighting (His-torical - 2008 Rate)
Figure: LED Lighting Industry Growth (Billions)
Company statistics and business summary
Basic company statistics and overview
Cree, Inc. (CREE) was founded 1987 by brothers Eric Hunter and F. Neal Hunter. The company currently employs 3,168 individuals at seven locations in the United States, China and Hong Kong. The firm’s revenue was nearly 500 million USD in 2008 which translated to 33.4 million in net income. Cree’s market cap is about 2.4 billion.
Cree is a leader in the LED lighting industry and also produces semiconductors for other uses rely on similar material research. Cree’s growth is directly dependent on consumer adoption of LED lighting, and Cree has recently initiated marketing attempts to demonstrate the financial and visual advantages of LED lighting versus conventional incandescent or compact florescent lighting.
Range of products and markets1
Cree’s products are divided into three distinct groups: LED Products, Materials Products and Power and RF Products. Each of these groups manufactures and markets component microchip products primarily to industrial manufacturers. Cree’s strategy in the LED lighting industry can be likened to Intel; both firms seek to manufacture critical, complex component parts to manufactures which, in turn, use them in finish products.
LED Products are broken into three distinct types LED Chips, LED Components and LED Lighting Solutions.
• LED Chips or die are solid-state electronic components used in a number of applications, including backlighting for mobile products, automotive interior lighting, full-color electronic displays, gaming equipment, consumer products and other electronic equipment. Some of Cree’s customers use our blue and green high-brightness LED chips for video screens, gaming displays such as pachinko, and automotive backlighting. LEDs offer several advantages over small incandescent bulbs, including longer life, lower maintenance costs, reduced energy consumption and small space requirements.
• Cree’s LED chips include blue and green devices made from GaN and related materials grown on SiC substrates. LED chips or die are solid-state electronic components used in a number of
1 Material in this section is abridged from Cree’s 2008 Annual Report
4

applications, including backlighting for mobile products, automotive interior lighting, full-color electronic displays, gaming equipment, consumer products and other electronic equipment. Cree’s customers’ while LED products are used in various applications for mobile products, including the backlight for full-color display screens, white keypads and the camera flash function.
• Cree’s LED Lighting Solutions currently include the LR6, a six-inch architectural recessed LED down light, and the LR4, a four-inch architectural recessed LED down light. These lighting products are target for new construction, retrofit and renovation projects in residential and commercial applications.
Materials Products are divided into two classifications: SiC Wafers and Bulk Materials Used for Gemstones.
• SiC wafers are produced for sale to corporate customers who use the wafers to manufacture products for optoelectronic, microwave and power switching applications. Corporate, government and university customers also buy SiC materials for research and development directed at optoelectronic, microwave and high power devices.
• SiC crystals in near colorless for use in gemstone applications are manufactured by Cree. Single crystalline SiC has characteristics that are similar to diamond, including properties relating to color, hardness and brilliance. Cree sells SiC in bulk crystal form exclusively to Charles & Colvard, Ltd.
Power and RF Products, like Materials Products, fall into two categories: Power Devices and RF Devices.• SiC-based power devices operate at significantly higher breakdown voltages than silicon-based
power devices and provide faster switching speeds than comparable silicon-based power devices at similar breakdown voltages. These attributes create a lower switching loss, which yields power savings due to higher efficiency, enabling smaller and more efficient systems. Cree’s customers currently purchase Schotty diode products for use in power factor correction circuits for power supplies in computer servers and other applications such as solar inverters.
• RF devices made from SiC or GaN operate at higher voltages that allow for higher power densities as compared to silicon or GaAs-based devices. Additionally, this characteristic allows SiC-based and GaN-based devices to be significantly smaller while carrying the same or greater power level than silicon-based or GaAs-based devices. These RF circuits can be used in a variety of wide bandwidth communications applications, high-power radar amplifiers, electronic warfare and wireless infrastructure.
Industry/competitive position, peers analysis
Cree positions itself as a top quality provider of LED lighting technology and charges a premium for its products accordingly. When compared to smaller American and Asian-Pacific component companies, Cree’s research and development spending and achievements are unrivaled. There are, however, three international players which can provide quality near or exceeding Cree: Nichia Corp., Philips Luminleds Lighting and Toyoda Gosei. As research and development is an ongoing process in this emerging market, each of these firms produce LED lighting of somewhat comparable quality, but ording these firms based on quality would be impossible. The competition between these firms remains relatively passive as all companies have determined that greater economic profits can be generated by attacking the market share of product substitutes such as incandescent and compact florescent lighting producers.
5
However, Cree’s main competitors in the finished products segment possess significant marketing advantages. Both Juno Lighting, a subsidiary of Schneider Electric, and Cooper Lighting, a subsidiary of Cooper Industries, operate various LED lighting brands and lines to appeal to different market segments. While Cree has indicated that the LED fixtures market is not a main concern or area of corporate growth, their LR6 can lighting unit has received good market reception. Should Cree want to expand in the fixtures market, a large capital expenditure would be needed either to establish the distribution channels and products necessary to maintain a competitive level of market share, or to purchase another firm with either the channels of distribution or products which the two larger firms already possess.
Cooper Lighting’s Halo brand currently markets the brightest commercially available traditional light replacement while Philips Luminleds claims to manufacture the brightest LED produced. If Cree cannot answer these achievements, the company will not be able to continue commanding such a high premium on products sold. Currently, the cost of goods sold is lower than any other publicly traded major comparables.
Summary of operating position and strategy
As discussed earlier, Cree seeks to sell its technology and component parts to industrial manufacturers. To execute on this strategy Cree spends about 12% of revenues on research and development as compared to Toyoda Gosei which spends only 3.9%. This investment should allow Cree to maintain its market leader position in the LED lighting industry. As a market leader, the premium Cree demands allows the company to spend more of revenue on R&D than its competitors while still maintaining an operating margin higher than its competition. However, there exists significant strategic risk that, despite spending, research and development may not operate at industry leading standards.
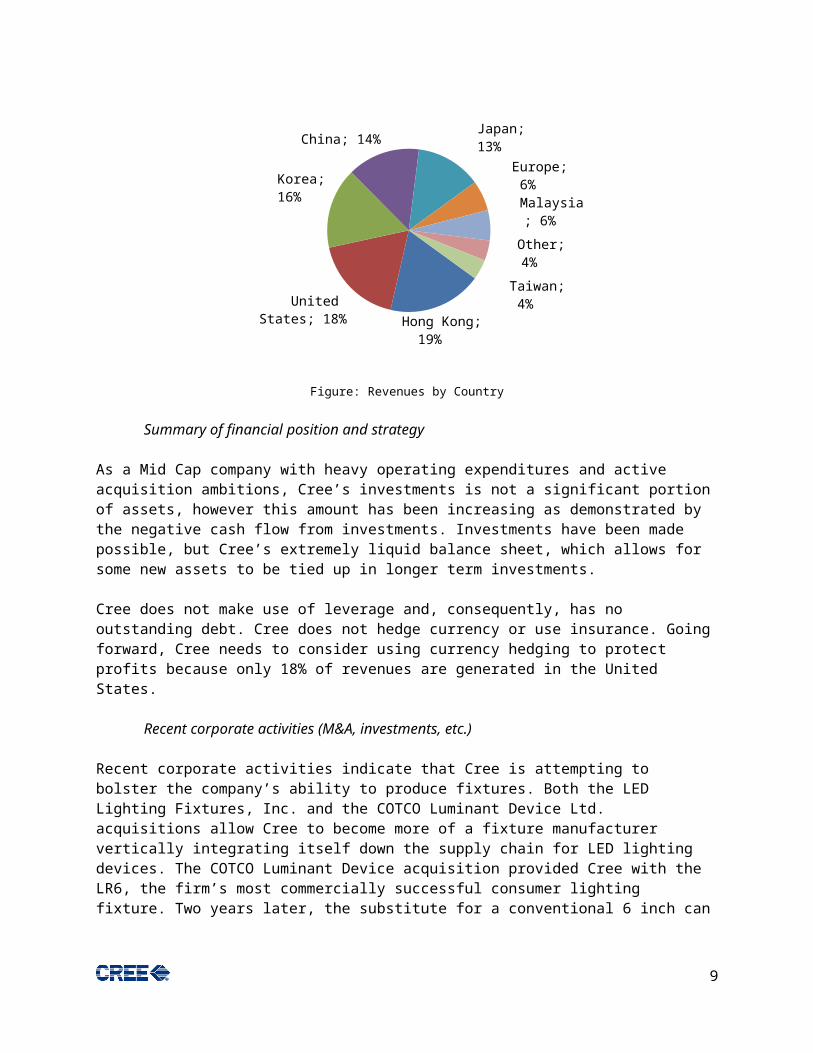
Cree both produces and markets its products on a global scale. With recent acquisition activity, the company now possesses major production capacity in China. Cree’s sales also come from around the world. However, the majority of revenues stem from Asia. This stems from Asia’s quicker adoption of LED lighting, as well as, Cree’s assumption of clients of recently acquired firms.
Hong Kong; 19%
United States; 18%
Korea; 16%
China; 14% Japan; 13%
Europe; 6%
Malaysia; 6%
Other; 4%
Taiwan; 4%
Figure: Revenues by Country
6
Summary of financial position and strategy
As a Mid Cap company with heavy operating expenditures and active acquisition ambitions, Cree’s investments is not a significant portion of assets, however this amount has been increasing as demonstrated by the negative cash flow from investments. Investments have been made possible, but Cree’s extremely liquid balance sheet, which allows for some new assets to be tied up in longer term investments.
Cree does not make use of leverage and, consequently, has no outstanding debt. Cree does not hedge currency or use insurance. Going forward, Cree needs to consider using currency hedging to protect profits because only 18% of revenues are generated in the United States.
Recent corporate activities (M&A, investments, etc.)
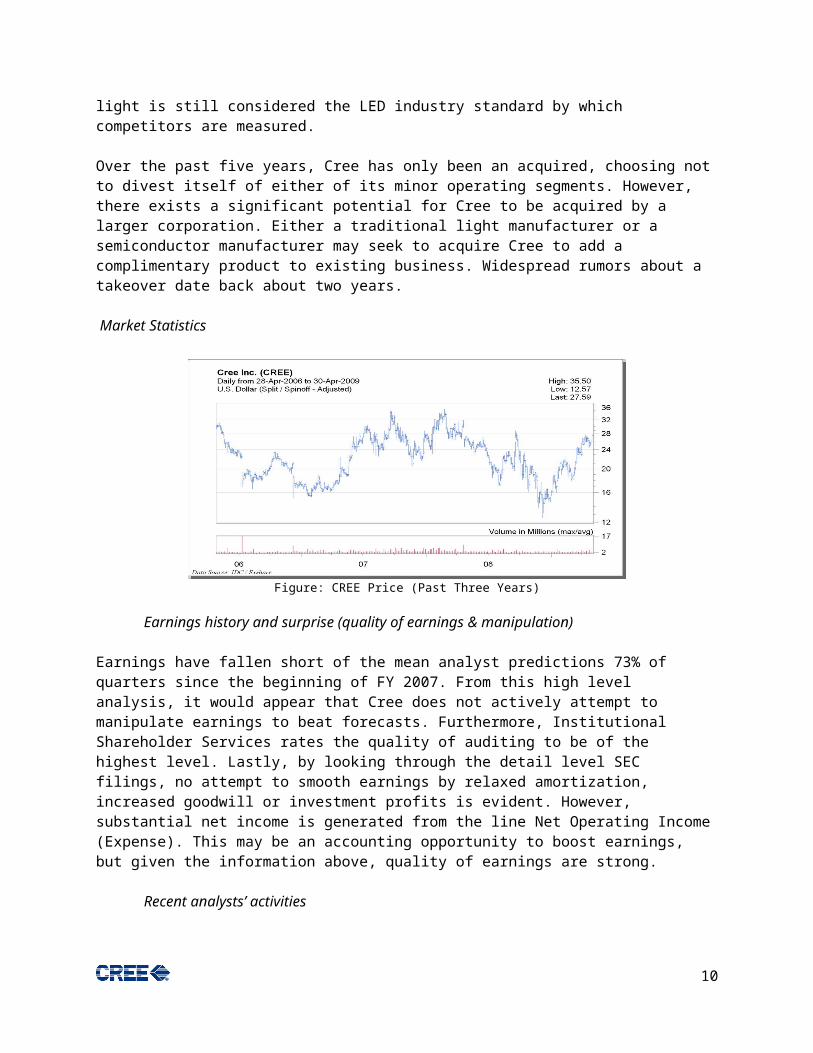
Recent corporate activities indicate that Cree is attempting to bolster the company’s ability to produce fixtures. Both the LED Lighting Fixtures, Inc. and the COTCO Luminant Device Ltd. acquisitions allow Cree to become more of a fixture manufacturer vertically integrating itself down the supply chain for LED lighting devices. The COTCO Luminant Device acquisition provided Cree with the LR6, the firm’s most commercially successful consumer lighting fixture. Two years later, the substitute for a conventional 6 inch can light is still considered the LED industry standard by which competitors are measured.
Over the past five years, Cree has only been an acquired, choosing not to divest itself of either of its minor operating segments. However, there exists a significant potential for Cree to be acquired by a larger corporation. Either a traditional light manufacturer or a semiconductor manufacturer may seek to acquire Cree to add a complimentary product to existing business. Widespread rumors about a takeover date back about two years.
Market Statistics
2-Apr-07
3-May
-07
3-Jun-07
4-Jul-0
7
4-Aug-07
4-Sep-07
5-Oct-
07
5-Nov-0
7
6-Dec
-07
6-Jan-08
6-Feb-08
8-Mar-
08
8-Apr-08
9-May
-08
9-Jun-08
10-Jul-0
8
10-Aug-08
10-Sep-08
11-Oct-
08
11-Nov-0
8
12-Dec
-08
12-Jan-09
12-Feb-09
15-Mar-
090
10
20
30
40
Figure: CREE Price (Past Three Years)
Earnings history and surprise (quality of earnings & manipulation)
Earnings have fallen short of the mean analyst predictions 73% of quarters since the beginning of FY 2007. From this high level analysis, it would appear that Cree does not actively attempt to manipulate
7
earnings to beat forecasts. Furthermore, Institutional Shareholder Services rates the quality of auditing to be of the highest level. Lastly, by looking through the detail level SEC filings, no attempt to smooth earnings by relaxed amortization, increased goodwill or investment profits is evident. However, substantial net income is generated from the line Net Operating Income (Expense). This may be an accounting opportunity to boost earnings, but given the information above, quality of earnings are strong.
Recent analysts’ activities
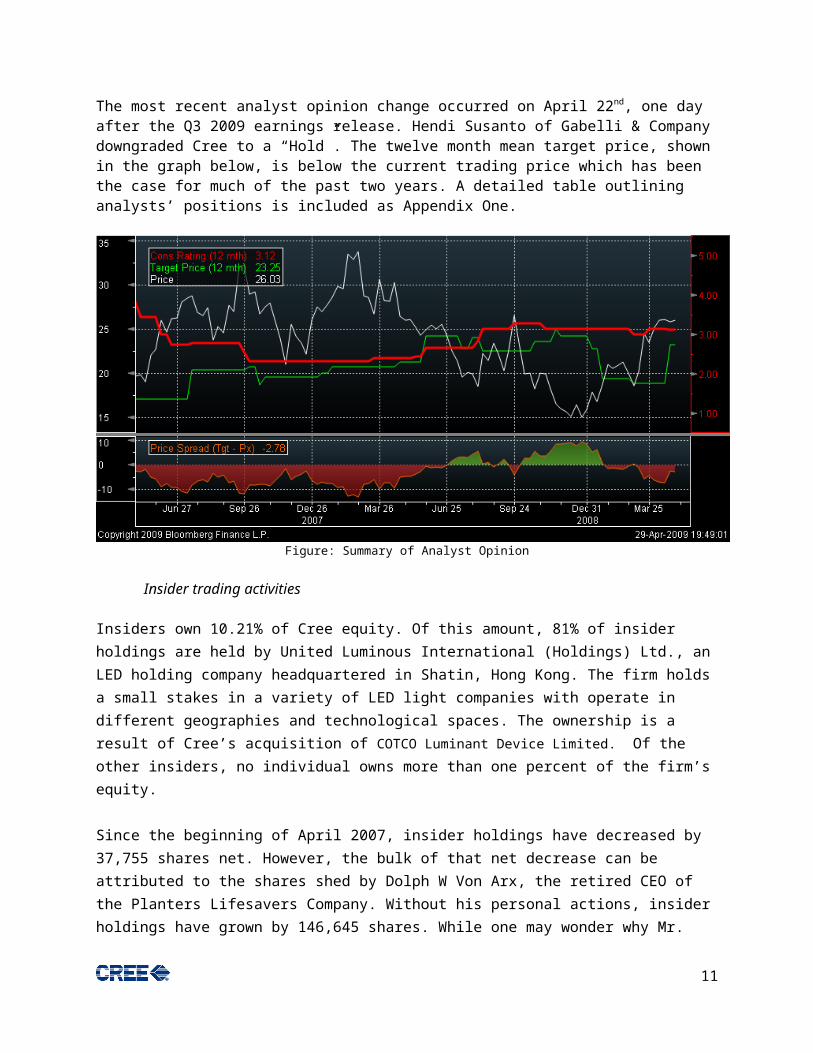
The most recent analyst opinion change occurred on April 22nd, one day after the Q3 2009 earnings release. Hendi Susanto of Gabelli & Company downgraded Cree to a “Hold”. The twelve month mean target price, shown in the graph below, is below the current trading price which has been the case for much of the past two years. A detailed table outlining analysts’ positions is included as Appendix One.
Figure: Summary of Analyst Opinion
Insider trading activities
Insiders own 10.21% of Cree equity. Of this amount, 81% of insider holdings are held by United Luminous International (Holdings) Ltd., an LED holding company headquartered in Shatin, Hong Kong. The firm holds a small stakes in a variety of LED light companies with operate in different geographies and technological spaces. The ownership is a result of Cree’s acquisition of COTCO Luminant Device
Limited. Of the other insiders, no individual owns more than one percent of the firm’s equity.
Since the beginning of April 2007, insider holdings have decreased by 37,755 shares net. However, the bulk of that net decrease can be attributed to the shares shed by Dolph W Von Arx, the retired CEO of the Planters Lifesavers Company. Without his personal actions, insider holdings have grown by 146,645 shares. While one may wonder why Mr. Von Arx divested himself of so much Cree equity, if his actions are overlooked, Cree insiders have demonstrated a willingness to increase personal invest in the firm.
8
Insider holdings should continue to be monitored, but should not preclude investment in Cree. A summary of Insider activity is included as Appendix Two.
Short position history
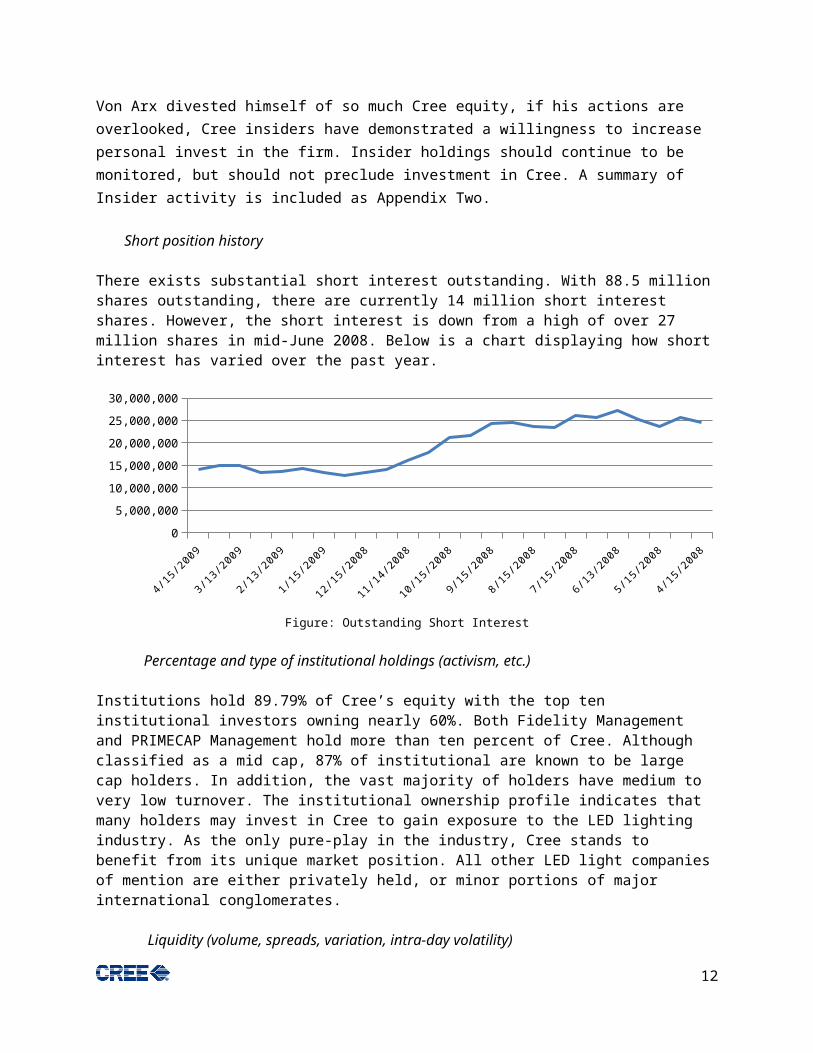
There exists substantial short interest outstanding. With 88.5 million shares outstanding, there are currently 14 million short interest shares. However, the short interest is down from a high of over 27 million shares in mid-June 2008. Below is a chart displaying how short interest has varied over the past year.
4/15/2
008
5/15/2
008
6/15/2
008
7/15/2
008
8/15/2
008
9/15/2
008
10/15/2
008
11/15/2
008
12/15/2
008
1/15/2
009
2/15/2
009
3/15/2
009
4/15/2
009
0
5,000,000
10,000,000
15,000,000
20,000,000
25,000,000
30,000,000
Figure: Outstanding Short Interest
Percentage and type of institutional holdings (activism, etc.)
Institutions hold 89.79% of Cree’s equity with the top ten institutional investors owning nearly 60%. Both Fidelity Management and PRIMECAP Management hold more than ten percent of Cree. Although classified as a mid cap, 87% of institutional are known to be large cap holders. In addition, the vast majority of holders have medium to very low turnover. The institutional ownership profile indicates that many holders may invest in Cree to gain exposure to the LED lighting industry. As the only pure-play in the industry, Cree stands to benefit from its unique market position. All other LED light companies of mention are either privately held, or minor portions of major international conglomerates.
Liquidity (volume, spreads, variation, intra-day volatility)
The average volume, over the past 15 days, is 1.48 million shares. The bid/ask spread hovers around a cents. As a member of the S&P Midcap 400 and the Russell 1000 the equity is very liquid. The volatility has been decreasing steadily over the past 18 months as Cree has increased its trading volume and beta. A Bloomberg screenshot more precisely outlining the intra-day volatility can be found in Appendix Three.
9
Valuation Analysis
Porter’s five forces analysis
Cree operates in a moderately attractive industry. However, the industry is becoming more attractive. By using Porter’s five forces, one can better understand why the industry will be more economically profitable.
Competition (Low)• LED lights are less price sensitive than both the incandescent and compact florescent light
industries.• LED light manufacturers can differentiate themselves by creating competitive advantages
among many competitive factors:• Brightness levels (lumens)• Energy consumption (watts)• Durability (hours)• Size• Price
• The LED lighting industry is relatively new and competitors possess different technological abilities. For these reasons above LED lights are not commodity products.
Barriers to Entry (High)• To compete in the LED lighting industry requires a high capital expenditure in research and
development.• The development process is lengthy and expensive. Only a few firms in the world produce
high quality LED lights. Only a handful of firms in the world, produce LED lights of similar quality in terms of brightness, energy efficiency, and durability as Cree.
• First mover advantage in an industry with so much lead time from product design to market availability is a significant advantage as Cree can demand premium prices for new products they bring to market. Meanwhile, competitors must settle to lower prices when they introduce similar products.
Substitutes (Many)• The wide availability of more competitively priced substitutes is the greatest source of
industry unattractiveness. LED lights are much more expensive than their substitutes, which include:
• Natural light (sun)• Incandescent lights• Compact florescent lights
• LED lights, based on 6” canister light prices, are about 12 times more expensive than compact florescent lights and 23 times pricier than incandescent lights. This is why LED lights make up an estimated 6 to 7 percent of the lighting market by dollar amount. The market share based on units sold is considerably smaller, presumably 12 to 23 times smaller although exact figures are unavailable.
• However, as LED lights become more price competitive the price advantage of substitutes will erode. The adoption rate of LEDs will increase as prices decrease because of the many technological advantages of LEDs. This will make the LED industry very attractive as LED lights will offer a superior value proposition when compared to incandescent and compact florescent lighting solutions.
Supplier Power (Low to Moderate)
10
• Suppliers of LED manufactures provide commodity type raw material inputs such as silicon carbide and gallium(III) nitride.
• However, these materials are very complex, and they are essential to the manufacturing of LED chips.
Buyer Power (Low)• Even though buyers can choose substitutes, LEDs do have their specific advantages.• While the LED industry is not very competitive, buyers are not highly concentrated or
coordinated, so their ability to capture value from transactions is very low.• The threat of backward integration is very low.
Cash flow analysis
Sources of cash & Uses of Cash
Cree generates cash from its three lines of business and funding from government research contracts and grants. As the diagram below displays, LED products generate a majority of Cree’s cash. A very small amount of capital is generated from the exercising of employee stock options. Depending on the quarter, a minimal amount of net cash flow is generated by the repurchase of stock or the sale of stock, mainly via employee stock options.
LED Products84%
Materials Products
6%Power and RF
Products4%
Government Contract Fund-
ing6%
Figure: Revenues by Segment/Activity
The primary uses of cash are employee compensation, raw goods for manufacturing, manufacturing costs, SG&A, and new investments.
Cost of Goods Sold
64%SG&A
Expense25%
R&D Expense11%
Figure: Uses of Cash by Percentage
11
Analysis of CFO (operations), CFI (investments) and CFF (financing)
Operations generate more cash than any other segment of Cree. Approximately 150 million dollars were generated from operations during Q3 2009. Financing is not a major source of cash, nor a major use of cash. As Cree does not use debt to generate capital, all financing activities concern the issuing or repurchasing of equity shares.
Over the past three quarters, Cree has significantly increased their acquisition of investments. This activity is allowed by Cree’s extremely healthy liquidity measures, discussed later. The great amount of liquid assets has allowed Cree to increase its investing activity over the past three quarters. However, this may concern shareholders, if they believe that these investments are indications that Cree does not have enough capital worthy projects in its pipeline. On the other hand, resisting the temptation to invest capital to develop non-profitable projects does demonstrate solid financial controls.
Figure: Net Cash Flow by Segment
Valuation
Asset Turnover
Return on Assets
Return on Equity
Net Income Margin
KLAC 0.56 8.3% 11.0% 14.2%LRCX 0.89 18.4% 29.7% 17.8%ASX 0.65 5.0% 8.8% 6.5%ATE 0.55 4.9% 5.8% 9.1%
VSEA 1.19 13.3% 18.2% 11.8%NVLS 0.62 -6.0% -8.3% -11.4%
Average 0.74 7.3% 10.9% 8.0%CREE 0.38 2.8% 3.1% 6.8%
Figure: DuPont Analysis Versus Peers
The above chart compares Cree to similar sized semiconductor companies. These companies are not direct competitors, and therefore should be analyzed accordingly.
12
DCF valuation
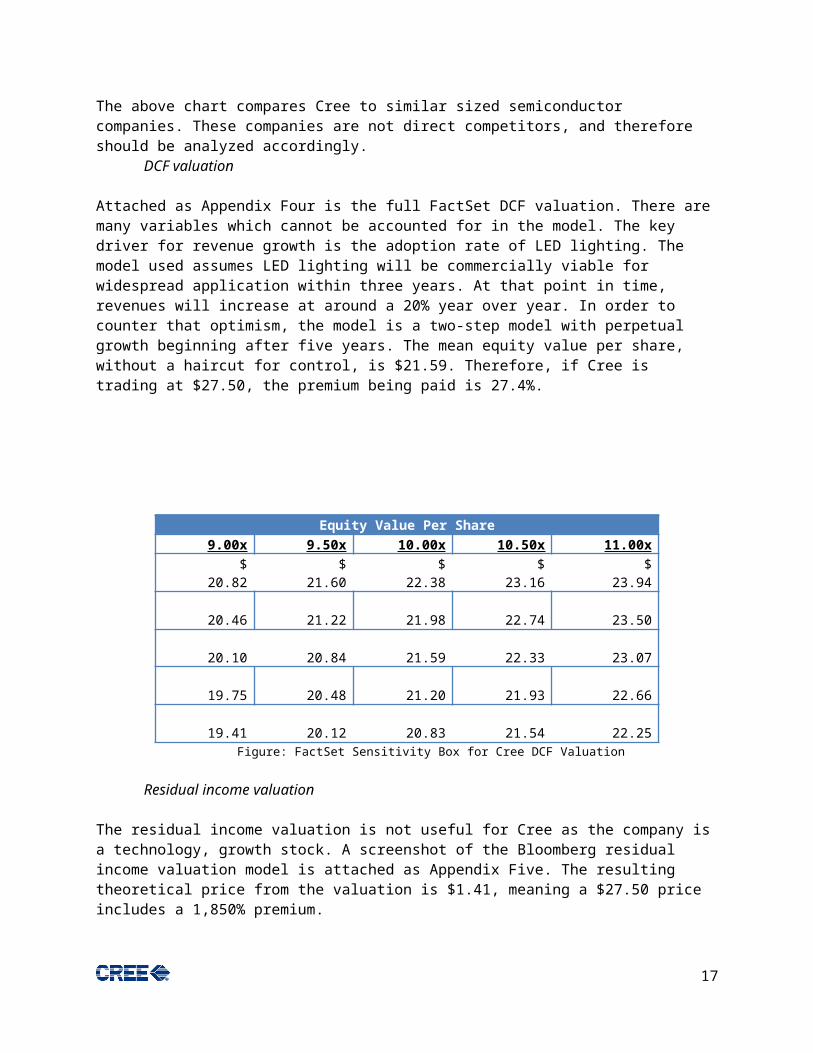
Attached as Appendix Four is the full FactSet DCF valuation. There are many variables which cannot be accounted for in the model. The key driver for revenue growth is the adoption rate of LED lighting. The model used assumes LED lighting will be commercially viable for widespread application within three years. At that point in time, revenues will increase at around a 20% year over year. In order to counter that optimism, the model is a two-step model with perpetual growth beginning after five years. The mean equity value per share, without a haircut for control, is $21.59. Therefore, if Cree is trading at $27.50, the premium being paid is 27.4%.
Equity Value Per Share9.00x 9.50x 10.00x 10.50x 11.00x
$ 20.82
$ 21.60
$ 22.38
$ 23.16
$ 23.94
20.46
21.22
21.98
22.74
23.50
20.10
20.84
21.59
22.33
23.07
19.75
20.48
21.20
21.93
22.66
19.41
20.12
20.83
21.54
22.25
Figure: FactSet Sensitivity Box for Cree DCF Valuation
Residual income valuation
The residual income valuation is not useful for Cree as the company is a technology, growth stock. A screenshot of the Bloomberg residual income valuation model is attached as Appendix Five. The resulting theoretical price from the valuation is $1.41, meaning a $27.50 price includes a 1,850% premium.
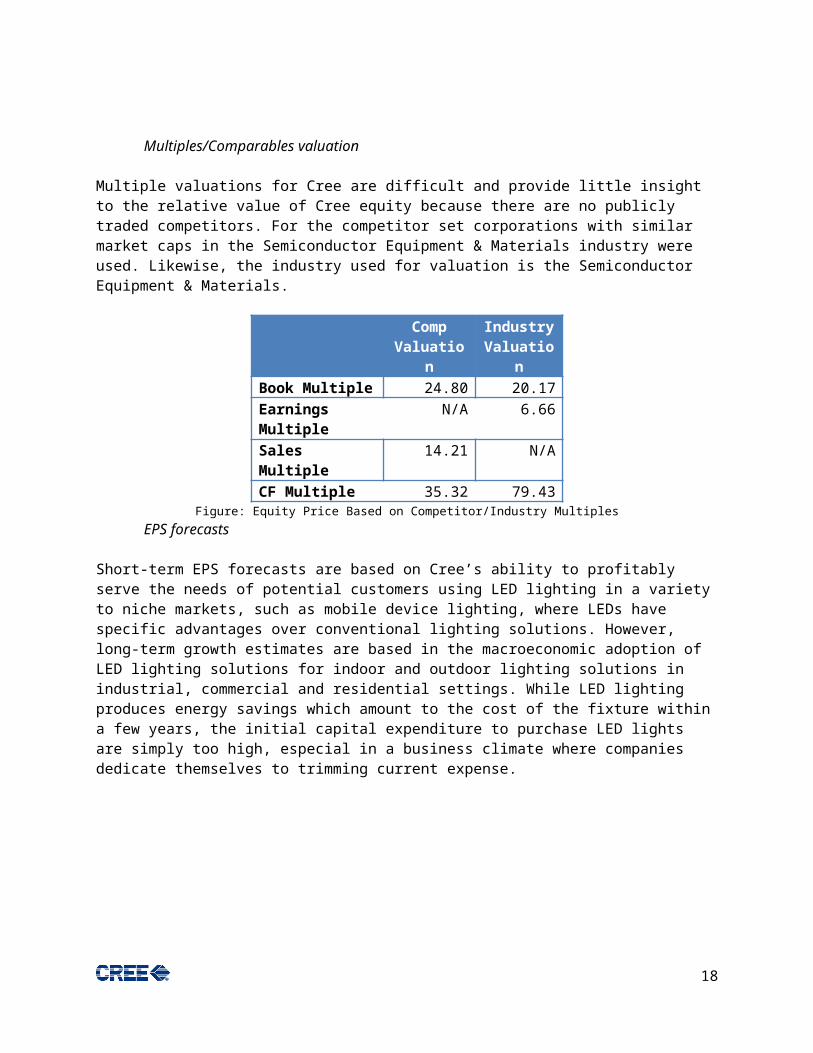
Multiples/Comparables valuation
Multiple valuations for Cree are difficult and provide little insight to the relative value of Cree equity because there are no publicly traded competitors. For the competitor set corporations with similar market caps in the Semiconductor Equipment & Materials industry were used. Likewise, the industry used for valuation is the Semiconductor Equipment & Materials.
Comp Valuation
Industry Valuation
Book Multiple 24.80 20.17
13
Earnings Multiple N/A 6.66Sales Multiple 14.21 N/ACF Multiple 35.32 79.43Figure: Equity Price Based on Competitor/Industry Multiples
EPS forecasts
Short-term EPS forecasts are based on Cree’s ability to profitably serve the needs of potential customers using LED lighting in a variety to niche markets, such as mobile device lighting, where LEDs have specific advantages over conventional lighting solutions. However, long-term growth estimates are based in the macroeconomic adoption of LED lighting solutions for indoor and outdoor lighting solutions in industrial, commercial and residential settings. While LED lighting produces energy savings which amount to the cost of the fixture within a few years, the initial capital expenditure to purchase LED lights are simply too high, especial in a business climate where companies dedicate themselves to trimming current expense.
Figure: Cree Mean Analyst Estimate EPS Figure: Cree Mean Analyst EPS Growth
Technical analysis
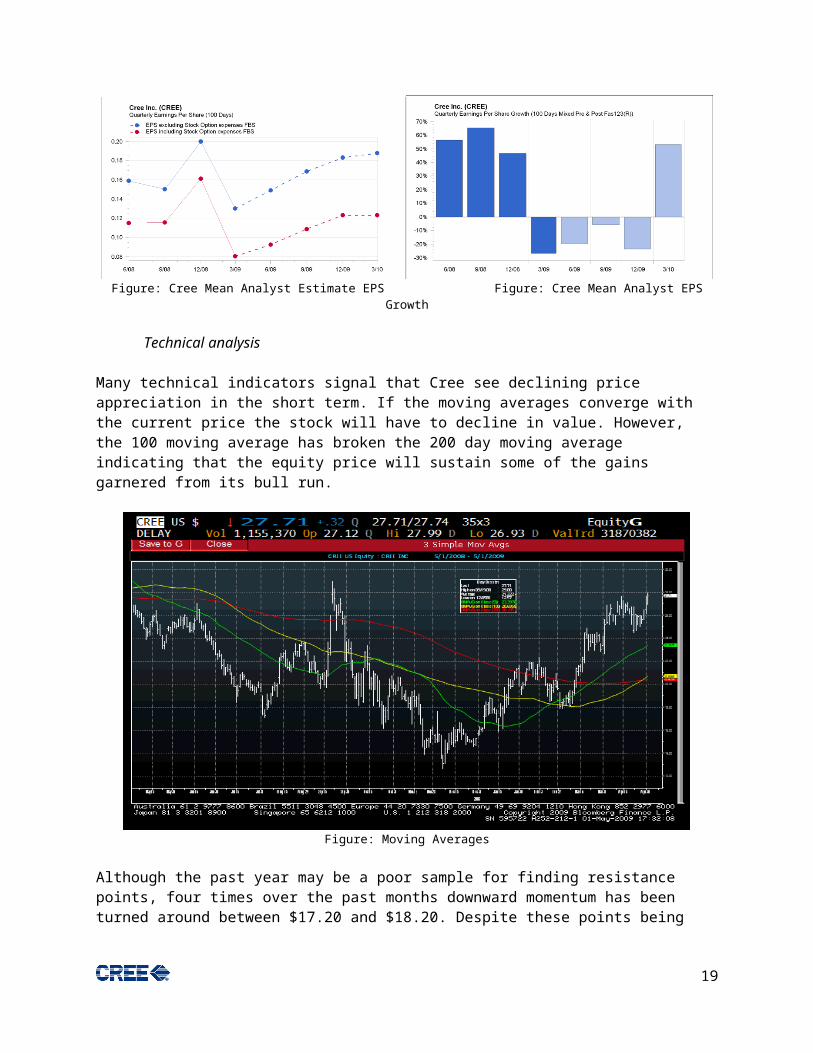
Many technical indicators signal that Cree see declining price appreciation in the short term. If the moving averages converge with the current price the stock will have to decline in value. However, the 100 moving average has broken the 200 day moving average indicating that the equity price will sustain some of the gains garnered from its bull run.
14
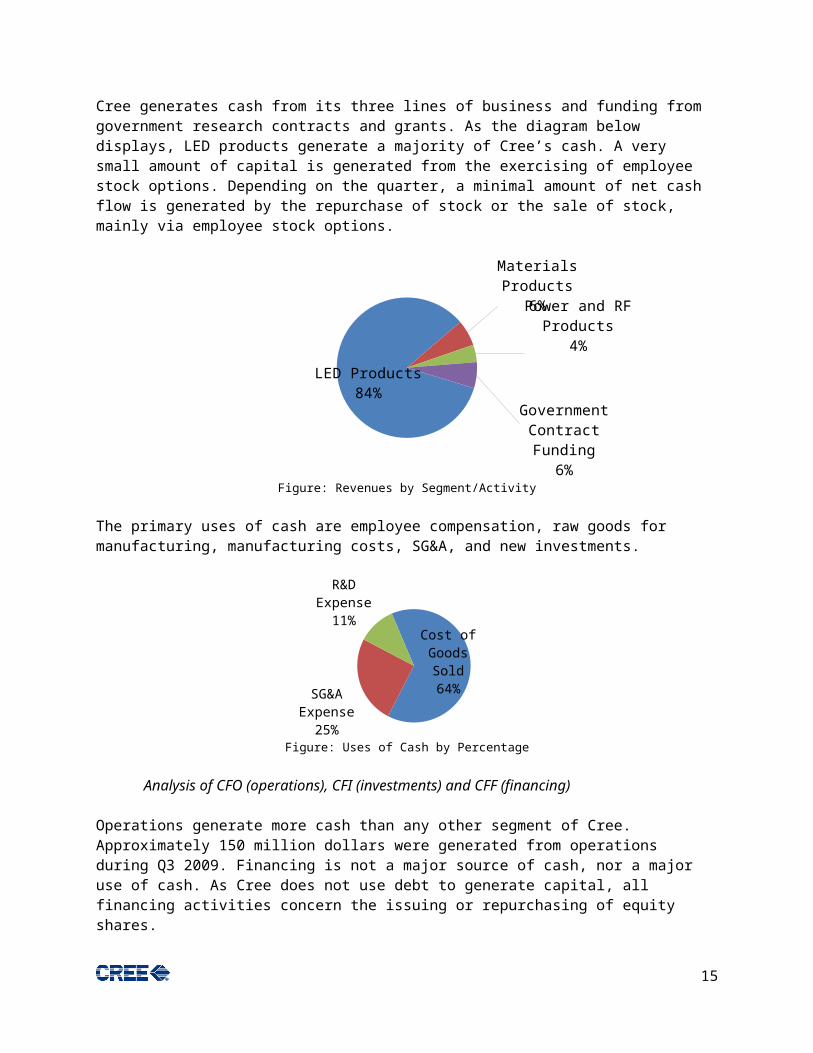
Figure: Moving Averages
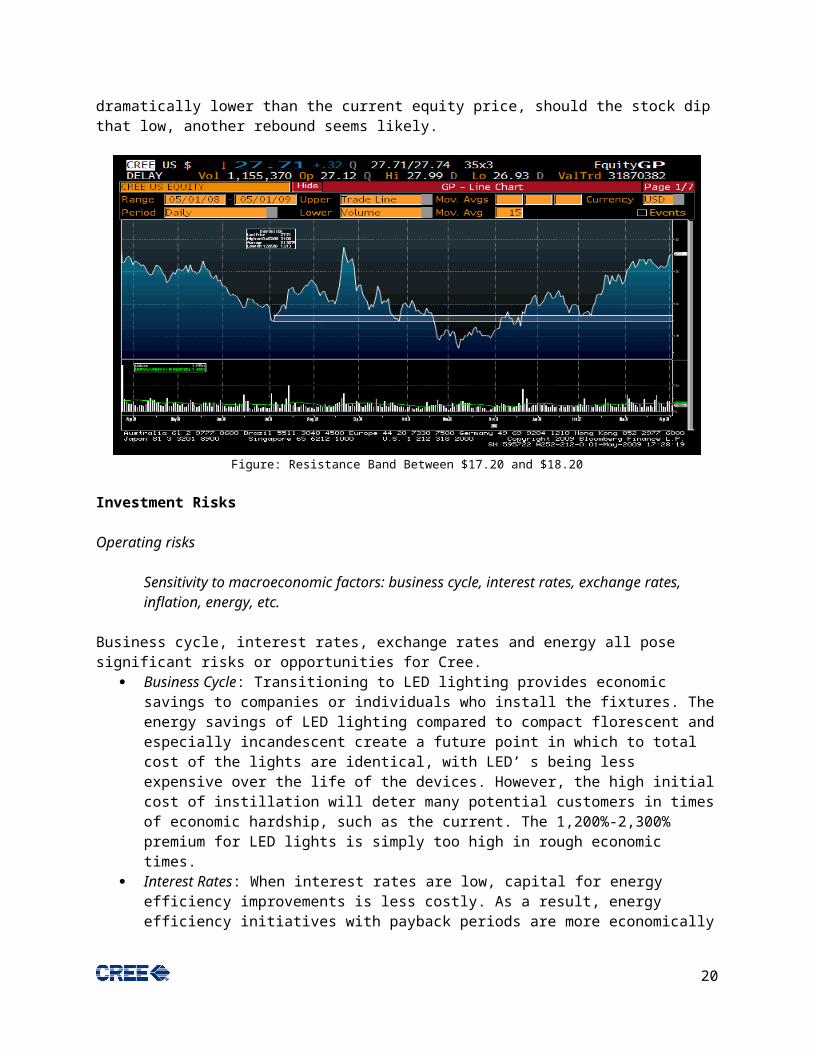
Although the past year may be a poor sample for finding resistance points, four times over the past months downward momentum has been turned around between $17.20 and $18.20. Despite these points being dramatically lower than the current equity price, should the stock dip that low, another rebound seems likely.
Figure: Resistance Band Between $17.20 and $18.20
Investment Risks
Operating risks
15
Sensitivity to macroeconomic factors: business cycle, interest rates, exchange rates, inflation, energy, etc.
Business cycle, interest rates, exchange rates and energy all pose significant risks or opportunities for Cree.
Business Cycle: Transitioning to LED lighting provides economic savings to companies or individuals who install the fixtures. The energy savings of LED lighting compared to compact florescent and especially incandescent create a future point in which to total cost of the lights are identical, with LED’ s being less expensive over the life of the devices. However, the high initial cost of instillation will deter many potential customers in times of economic hardship, such as the current. The 1,200%-2,300% premium for LED lights is simply too high in rough economic times.
Interest Rates: When interest rates are low, capital for energy efficiency improvements is less costly. As a result, energy efficiency initiatives with payback periods are more economically profitable when financed with capital needing only a low rate of return.
Exchange Risk: Although based in the United States, no less than 72% of revenues are from Asian nations. Should the dollar appreciate against those currencies Cree’s profits would suffer as the majority of SG&A expense as well as some manufacturing expenses are incurred in USD. The chart below better illustrates how specific currency changes would alter the profitability of Cree. It should be noted that Cree does not yet use hedging techniques to guard against foreign exchange risks.
Hong Kong; 19%
United States; 18%
Korea; 16%
China; 14% Japan; 13%
Europe; 6%
Malaysia; 6%
Other; 4%
Taiwan; 4%
Figure: Revenues by Country
Energy Costs: Simply, as energy costs rise, LED lighting becomes a more attractive alternative to traditional, incandescent and compact florescent, lighting. If energy costs rise, Cree will generate higher revenues. Cree’s R^2 ( a measure of correlation) for Dow Jones US Coal Index is greater than Cree’s R^2 with the NASDAQ Composite, Russell 1000 and even S&P Midcap 400.
Strategic risks (e.g., industry consolidation/transition)
16
Industry transition is an opportunity for Cree. As the commercial lighting standard transitions to LED lighting Cree is well positioned to be a market leader. If competitors consolidated, other firms would be able to increase research and development spending, applying pressure on Cree to continue innovating. Overall, the risk of industry consolidation is low because margins, industry wide, are high, and firms are not actively seeking to expand economies of scope.
Business interruption risks
Business interruption risks are relatively low since Cree’s main inputs are standardized, synthetic raw materials. As a result Cree is not reliant on a small number of suppliers or natural events.
Regulatory and compliance risk
To this point, the ability of Cree to obtain Energy Star certification from the US Government has been key to marketing and sales successes. The program sponsored by the Environmental Protection Agency and Department of Energy not only signifies to consumers that the product is energy efficient, but also, for LEDs, of high quality. In order to meet the Energy Star standards, the LED device must be at least 75% more efficient than incandescent bulbs, last for at least 22 years and generate less heat than both compact florescent and incandescent bulbs. As a result, the Energy Star certification is a mark of quality which is a pre-requisite for the premium pricing of LED lighting. Failure to achieve this recognition in the future will inhibit Cree to compete in the highest price level markets. Due to Cree’s heavy emphasis on research and development, regulatory and compliance risk is low.
Use of insurance
Cree does not use insurance.
Overall analysis of operating leverage
Operating leverage provides opportunity for Cree to increase profits. Research and development is largely a fixed cost. Should Cree increase revenue from LED Lighting, while maintaining the current operating structure sales, the net income margin will increase. However, to increase revenue Cree will likely need to expand its channels of distribution and invest more heavily in marketing and sales efforts.
Most of the above risks will not increase or decrease in magnitude should Cree grow in size. Exchange rate risk will be magnified, however, if Cree increases revenues outside the United States. To mitigate this, Cree should begin establishing a foreign exchange hedging program.
Financial risks
Funding risk (e.g., debt and leverage)
Cree does not have any funding risk concerning the ability to pay off debt, as the firm does not have any outstanding debt.
Cash management and liquidity
17
Cree’s liquidity ratios indicate that the company possesses enough cash and short-term receivables to address any short term liabilities. The high amount of liquidity likely is the driving force behind Cree’s increased investment activity. The company realized it required less cash available for current and short term liabilities.
Cash Quick Current0
2
4
6
8
10
Figure: Liquidity Ratios
Use of derivatives and financial risk management
Cree does not use derivatives to manage supply cost, product revenues or exchange rate risk.
Overall analysis financial leverage
Cree does not currently have any debt choosing not to lever at any level.
Analysis of total business risk
Analysis of combined leverage
There is a moderate amount of risk between the financial and operating aspects of Cree. The key contributors to risk are foreign exchange risk, regulatory risk and competitive advantage. While foreign exchange risk can, and should be, controlled in the future, regulatory risk can be controlled by continued investment in research and development. Dedication to continued R&D will also allow Cree to maintain its high price points and industry leadership. Overall, Cree does not operate at high risk for the high-tech, growth sector which helps explain some of the multiple premiums being paid for equity.
Other risks (key employees, unique factors, etc.)
Management and human capital are major sources of risk for Cree. The company’s competitive advantage resides in its continuous ability to develop new and superior products than Cree’s rivals. While much of that ability must be attributed to the intellectual abilities of researchers, some of that advantage resides in the internal capital control on research spending. Throughout the firm’s life, management has been able to allocate capital to the most promising projects allowing the company to remain industry leaders.
Another risk resides in the critical inputs to Cree’s products, should the materials prices for silicon carbide and gallium(III) nitride and other key inputs rise, the cost of goods sold for LED lighting will increase. However, the cost of goods sold for non-LED substitutes would not, lowering the value proposition of LED lighting.
18
Equity market risks
Volatility analysis
A detailed Bloomberg analysis of volatility is attached as an appendix.
Beta and factor analysis
Cree’s beta of .98 indicates that the firm is slightly less volatile than the market, but the company’s movements are usually similar to the SPX Index. Key factors of movement are energy prices and indexes, semiconductor indexes and midcap equities.
Effect on portfolio and sector risks
Adding Cree to the Reynolds Fund would raise the portfolio beta, but only to a very small degree as the equity beta is .98 compare to the portfolio beta of .94. Cree would also add to the fund’s exposure to Tech/Telecom which the fund is already about 7.7% overweight in. Increasing the endowment’s weighting in that industry may either be beneficial or detrimental to fund performance over the coming period. However, if managers seek to gain excess returns over benchmark, sector rotation may be a very effective strategy to employ.
Effect on Value-at-Risk and other specific risk measures
If all remaining cash in the portfolio ($7,523.23) were used to purchase Cree equity the VaR would rise from 2.34% to 2.41%. Obviously, Cree increases the risk of the portfolio when purchased with cash, but not to a significant degree.
Figure: Results of Various Stress Tests
Summary and Evaluation of Other Research and Recommendations
Specific recommendation (price amount, etc.)
19
Cree is attractive at $23. Valuing a company in such a high growth market is a difficult task, but the current price is not justified by fundamental analysis. The high price of equity might be the result of two different investor types. Some investors believe Cree to be a short-term takeover target and hold equity in hopes of a buyout. Others, primarily low turnover institutional holders (which own 41.5%of equity), may own Cree for exposure to the LED lighting industry as Cree is the only pure-play investment in the industry. Gaining exposure to the potential upside of either a spike in energy prices or acquisition of Cree is the reason for paying the premium over the target price of $21.59.
Exit strategy
Holding Cree as a long-term position will provide the portfolio exposure to the LED lighting industry. However, if invested selling at a high premium over the fundamental price per share is sound investing. A good selling price is at 50% premium over the DCF valuation.
Supplemental Materials
Recent Financial Statements
http://finance.yahoo.com/q/sec?s=CREE
20
![Final Paper - Plymouth State Universityjupiter.plymouth.edu/~megp/TAR Page/Final Paper[1].pdf · 2007. 6. 2. · Title: Final Paper Author: HP_Owner Subject: Final Paper Created Date:](https://img.dokumen.tips/doc/110x75/5ffae7a1f34bf038954031d4/final-paper-plymouth-state-megptar-pagefinal-paper1pdf-2007-6-2-title.jpg)