Embed Size (px)
Citation preview
DOCUMENT RESUME
ED 381 567 TM 022 927
TITLE College-Level Academic Skills Test, Technical Report,
1989-90.
INSTITUTION Florida State Dept. of Education, Tallahassee.
PUB DATE 90
NOTE 53p.
PUB TYPE Reports Evaluative/Feasibility (142)
EDRS PRICE MF01/PC03 Plus Postage.
DESCRIPTORS Academic Achievement; Accountability; AchievementTests; Associate Degrees; *College Students;*Communication Skills; *Degree Requirements; HigherEducation; Language Skills; *Mathematics Achievement;Public Colleges; Racial Differences; ReadingAchievement; Scores; Scoring; Sex Differences; StateLegislation; Test Construction; *Test Results
IDENTIFIERS *College Level Academic Skills Test; *Florida
ABSTRACTThe College-Level Academic Skills Test (CLAST) is
part of Florida's system of educational accountability that is
mandated by state 'aw. The CLAST is an achievement test measuring
students' attainment of college-level communication and mathematics
skills identified by faculties of community colleges and state
universities. Since August 1, 1984 students in public institutions in
Florida have been required to have CLAST scores that satisfy state
standards for the award of an associate in arts degree and for
admission to uppor division status in a state university in Florida.
In addition, students in private schools may need CLAST scores to
receive state financial aid. The CLAST consists of essay, English
language skills, reading, and mathematics tests. Test development is
traced, and the test itself is described, along with scoring and
development information. Summary data are presented for first-time
takers in 1989-90. Passing rates are presented for groups of students
classified by race/ethnicity and gender, as well as college status.
Fourteen tables present test data for the 1989-90 school year. Six
appendixes describe the test in greater detail and list College-Level
Academic Skills Project (CLASP) and state-level task force members,
1989-90. (Contains 15 references.) (SLD)
***********************************************************************Reproductions supplied by EDRS are the best that can be made
from the original document.************k********************************************************),4
*
U.S. DEPARTMENT OF SOMATA:1N
Offic of Educsionat 1,100atch On4 Improvement
EOU/ IONAt. RESOURCES INFORMATIONCENTER (ERIC)
his document MO Poen rcoodupo ISteCwcl Irom IM p. son Of cogatutatiott0figinottn0 It
O Minot changs hay* 0n mach to om010,
rotoduction Quality
IMIEC.5i1
"PERMISSION TO REPRODUCE THISMATERIAL HAS BEEN GRANTED BY
,e06(47. BED Fb
p0mts 01 vow 0, 00totOrla hid thts c$°"' TO THE EDUCATIONAL RESOURCESmen! Oo not ooCelltlardy riotIMBot 014601
OE RI position of ooPorINFORMATION CENTER (ERIC).-
CNTI
TECHNICAL REPORT
1989-90
State of FloridaDepartment of Education
CollegeLevel Academic Skills ProjectTallahassee, Florida
Betty Castor, CommissionerAffirmative action/equal opportunity employer
2
BEST COPY AVAILABLE
CLAST TECHNICAL REPORT, 1989-90
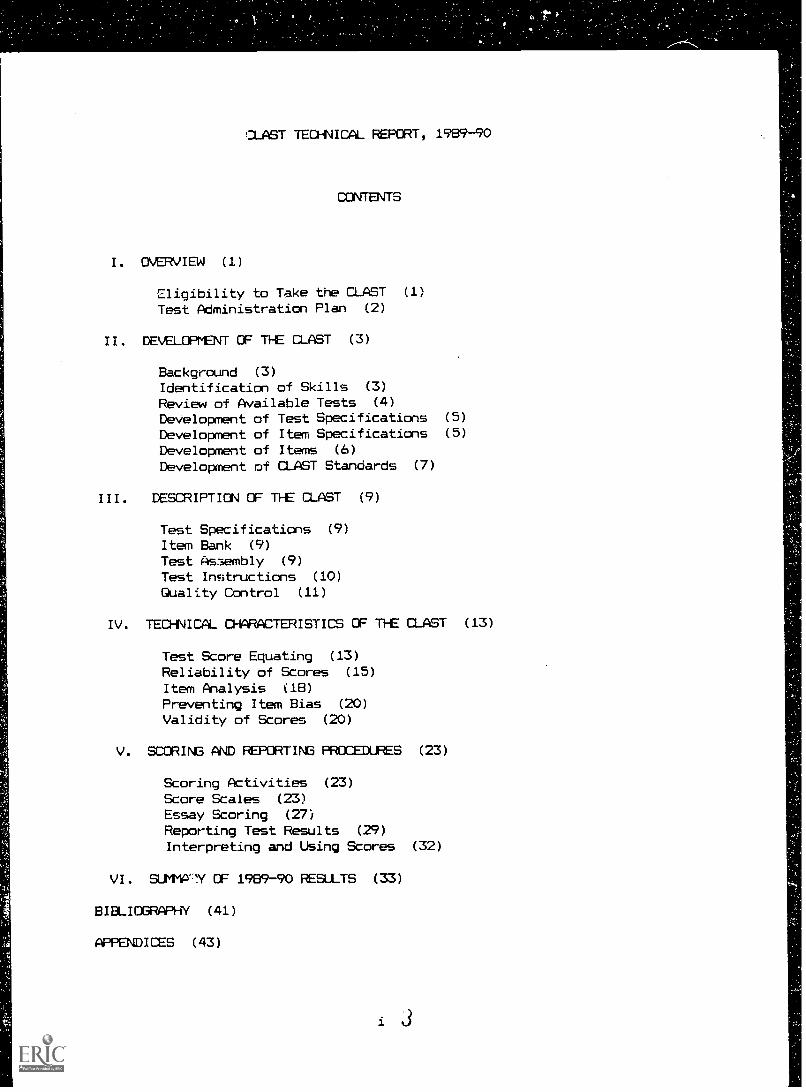
CONTENTS
I. OVERVIEW (1)
Eligibility to Take the CLAST (1)
Test Administration Plan (2)
II. DEVELOPMENT OF THE CLAST (3)
Background (3)
Identification of Skills (3)
Review of Available Tests (4)
Development of Test Specifications (5)
Development of Item Specifications (5)
Development of Items (6)
Development of CLAST Standards (7)
III. DESCRIPTION OF THE CLAST (9)
Test Specifications (9)
Item Bank (9)
Test Assembly (9)
Test Instructions (10)
Quality Control (11)
IV. TECHNICAL CHARACTERISTICS OF THE CLAST (13)
Test Score Equating (13)
Reliability of Scores (15)
Item Analysis (18)
Preventing Item Bias (20)
Validity of Scores (20)
V. SCORING AND REPORTING PROCEDURES (23)
Scoring Activities (23)
Score Scales (23)
Essay Scoring (27)
Reporting Test Results (29)
Interpreting and Using Scores (32)
VI. SUMMA"Y OF 1989-90 RESULTS (33)
BIBLIOGRAPHY (41)
APPENDICES (43)
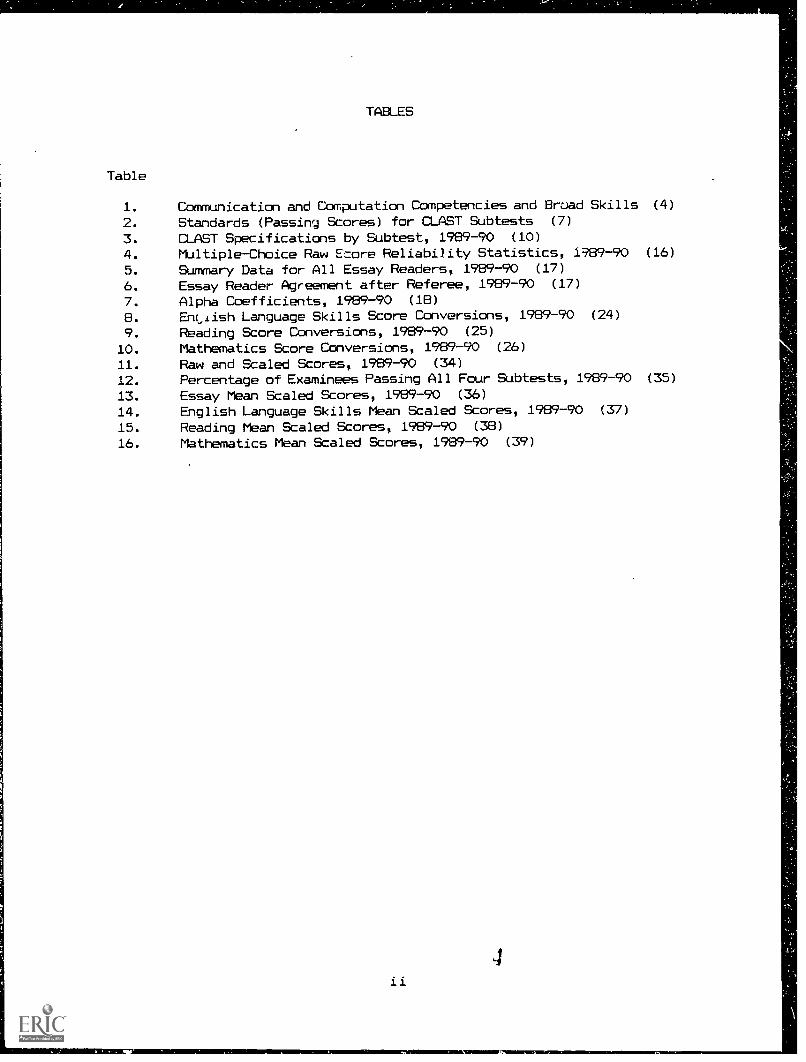
TABLES
Table
1. Communication and Computation Competencies and Broad Skills (4)
2. Standards (Passing Scores) for CLAST Subtests (7)
3. CLAST Specifications by Subtest, 1989-90 (10)
4. Multiple-Choice Raw Score Reliability Statistics, 1989 -90 (16)
5. Summary Data for All Essay Readers, 1989-90 (17)
6. Essay Reader Agreement after Referee, 1989-90 (17)
7. Alpha Coefficients, 1989-90 (1B)
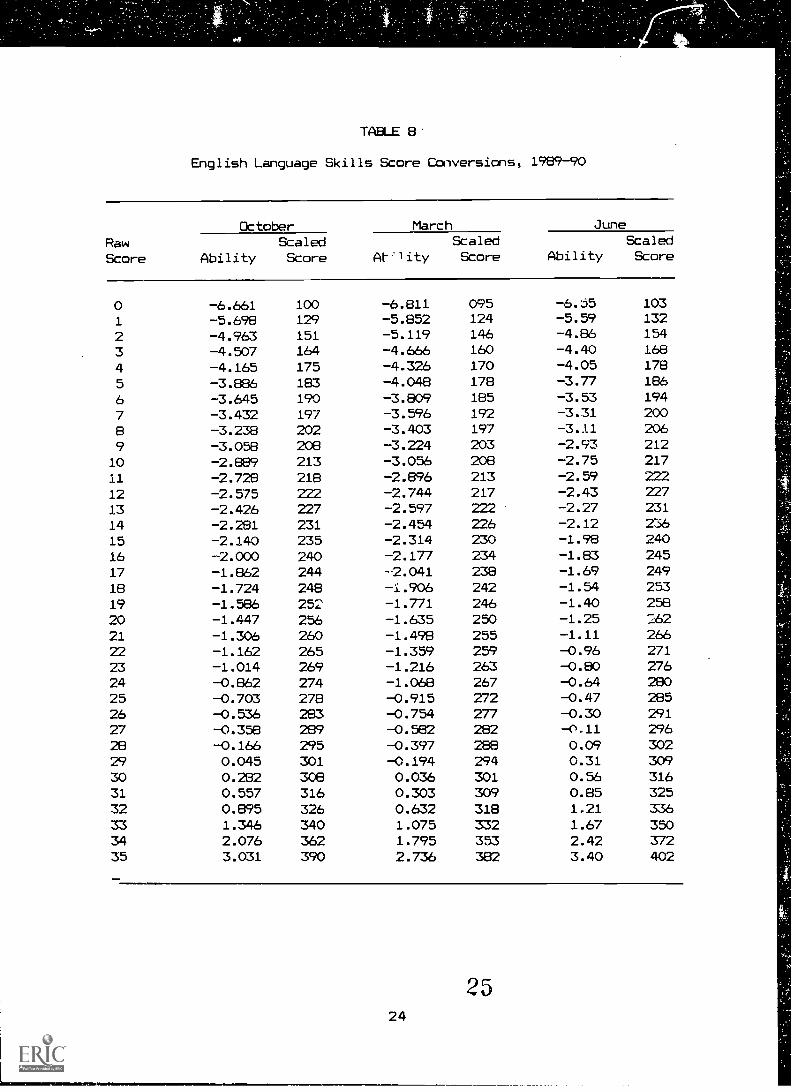
8. Ent,lish Language Skills Score Conversions, 1989-90 (24)
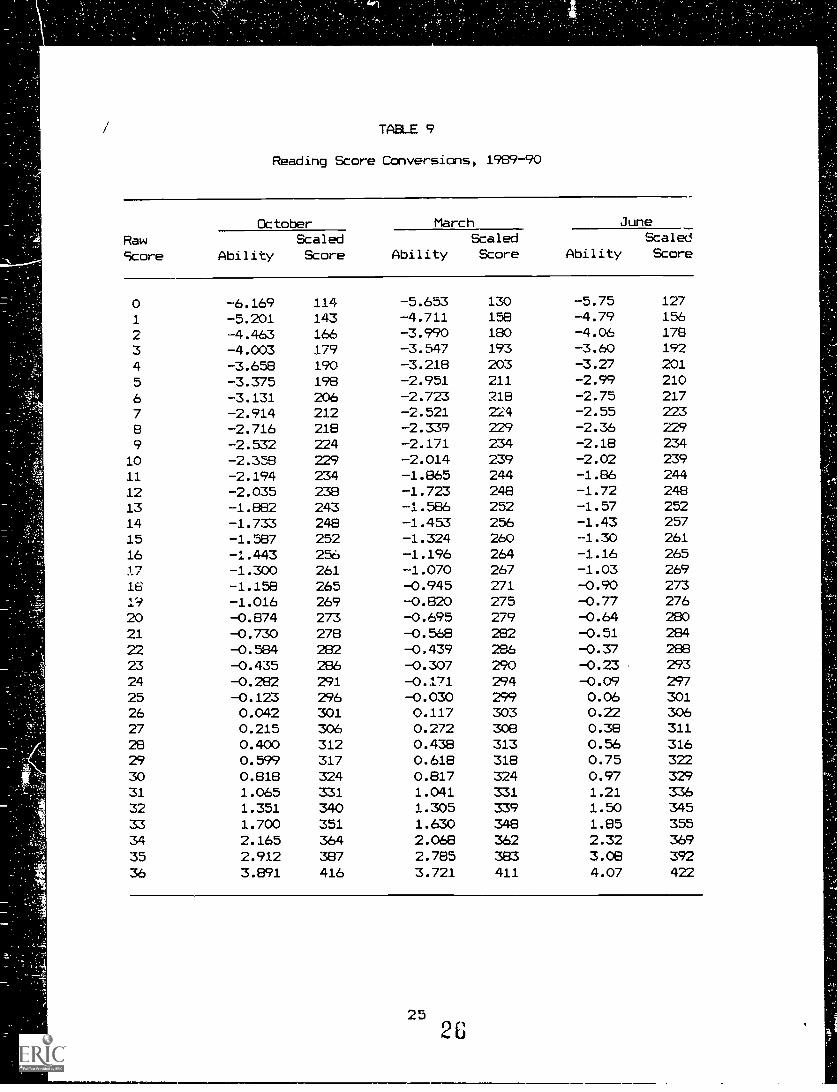
9. Reading Score Conversions, 1989-90 (25)
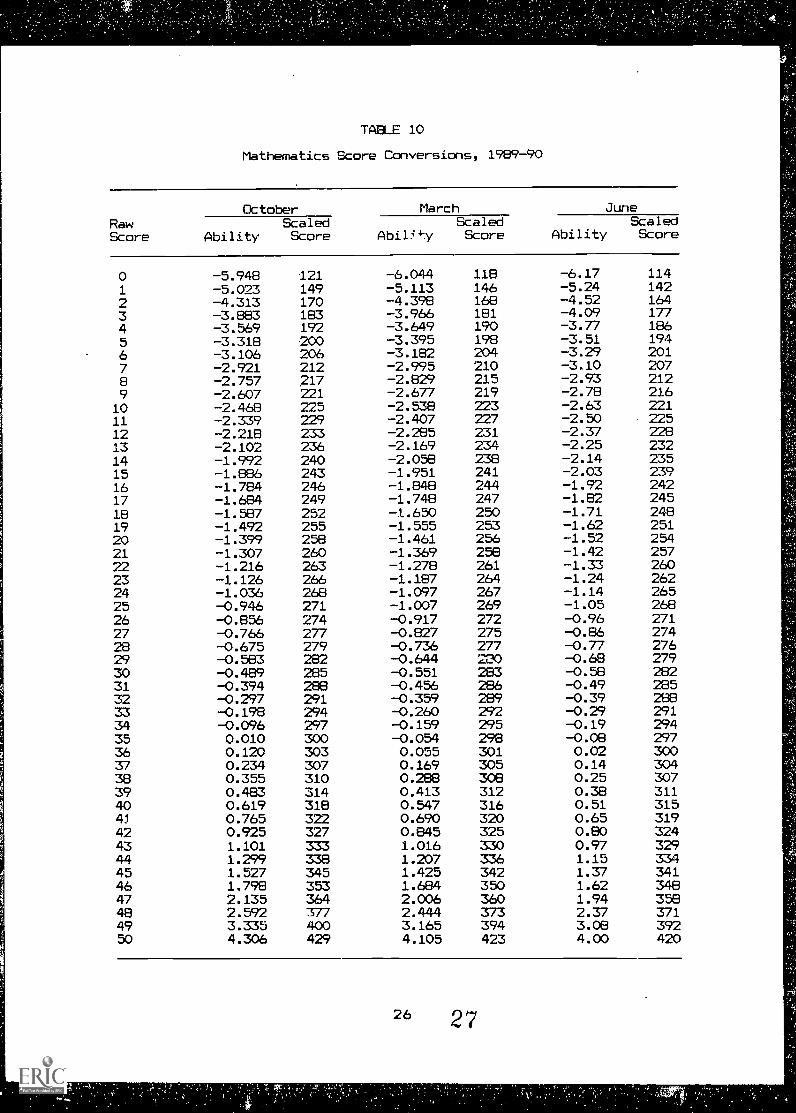
10. Mathematics Score Conversions, 1989-90 (26)
11. Raw and Scaled Scores, 1989-90 (34)
12. Percentage of Examinees Passing All Four Subtests, 1989-90 (35)
13. Essay Mean Scaled Scores, 1989-90 (36)
14. English Language Skills Mean Scaled Scores, 1989-90 (37)
15. Reading Mean Scaled Scores, 1989-90 (38)
16. Mathematics Mean Scaled Scores, 1989-90 (39)
1. OVER
The College-Level Academic Skills Test (CLAST) is part of Florida's systemof educational accountability and is mandated by Section 229.551(3)(k),FS, 1986. The CLAST is an achievement test measuring students' attainmentof :ollege-level communication and mathematics skills identified by facul-ties of community colleges and state universities through the College-Level Academic Skills Project (CLASP). The skills (Appendix A) have beenadopted by the State Board of Education (SBE) through Rule 6A-10.0310,FAC. Provisions for keeping the skills list current, maintaining activeparticipation of faculty members in the implementation of the testingprogram, and administering the test are provided in the CLAST Test Admin-istration Plan.
The CLAST consists of four subtests: essay, English language skills,reading, and mathematics. Each subtest yields a single score reported tothe student and to the institution needing the scores. Students alsoreceive broad skill information useful in identifying areas of possiblestrength or weakness. While the CLAST does not yield the skill-by-skillinformation necessary for full diagnosis of individual student needs, in-stitutions can identify areas of need for groups of students by aggregat-ing scores into broad skills over several administrations. Although CLASTscores relate positively to other measures of academic performance, theydo not predict examinees' future performance in upper division programs.
Since August 1, 1984, students in public institutions in Florida have beenrequired to have CLAST scores which satisfy the standards set forth in SBERule 6A-10.0312, FAC, for the award of an associate in arts degree and foradmission to upper division status in a state university in Florida. In
addition, students in private institutions may need CLAST scores to re-ceive state financial aid.
Statutes and rules pertaining to the CLAST requirement are contained inthe CLAST Test Administration Plan.
Eligibility to Take the CLAST
The CLAST may be taken by any student who is seeking an associate in artsor baccPlaureate degree and who applies to take the test by the deadlineestablished for registration. Students who have previously taken theCLAST and have not passed all subtests may apply at any regular adminis-tration to retake the subtest(s) not passed.
In addition, participating colleges and universities are to register otherstudents who meet both of the following criteria:
1. The students are eligible to participate in a State of Florida finan-cial aid program governed by SBE Rule 6A-20.005, FAC.
2. The students are required under provisions of SHE Rule 6A-20.005, FAC,to have CLAST scores to continue their eligibility beyond the academicterm in which they register for the CLAST.
1
BEST COPY AVAILABLE
Although CLAST scores are not needed to receive an associate in sciencedegree, students who are in that program may be registered for the CLASTif they satisfy the requirements for (1) the associate in arts degree or(2) admission to upper division status.
In all cases, registration of students for the CLAST must be made in aninstitution which can determine the eligibility of applicants to take the
test. Thus, registration normally will be done by the institution inwhich students are enrolled during the term in which they will take the
test. However, an applicant for upper division status in a state univer-sity who needs CLAST scores and meets eligibility requirements, but is notenrolled in an institution which administers the CLAST, may be registeredfor the test in the institution that needs the scores.
Students must apply to take the test on or before the registration dead-line established for that administration.
Test Administration Plan
Under provisions of Section 229.551(3)(k), Florida Statutes, the Commis-sioner of Education maintains statewide responsibility for the adminis-tration of the CLAST.
A plan for the administration of the CLAST for the 1989-90 academic yearwas issued by the Commissioner in September 1989. The plan, developed bythe Department of Education, assigns administrative responsibility for theCLAST at three levels: the Department of Education; the Technical SupportContractor; and the community colleges and state universities which ad-minister the test to eligible students. The Office of InstructionalResources of the University of Florida is the Technical SupportContractor.
The plan also describes the policies and procedures under which the test-ing program operates. The CLAST Test Administration Manual and the CLASTInstitutional Test Administrator's Manual, which are made a part of theplan, give additional specific information to assist institutional person-nel in carrying out their responsibilities.
62
II. DEVELOPMENT OF THE CLAST
The test development process for the CLAST began with identifying skills
to be assessed and continues with developing items for inclusion in the
test. This chapter describes the major developmental efforts culminating
in the first test administration, the item development procedures, and
the development of standards (passing scores).
Background
In 1979 the Florida Legislature, through Florida Statute 79-772 (now Sec-
tion 229.551), enacted legislation requiring the identification of skills
to measure the achievement of essential academic skills of college stu-
dents. The Department of Education then charged the Articulation Coordi-
nating Committee with the task of implementing that part of the
legislation dealing with the identification of skills and tests to measure
achievement of those skills. The result was the Essential Academic Skills
Project (EASP, now CLASP). The EASP included an executive committee, a
project director, a state-level task force on communication, a state-level
task force on computation, and a state-level standing committee on student
achievement. Current members are identified in Appendix B.
Identification of Skills
The state-level task forces, together with the project director and other
project personnel acting in an advisory capacity, worked to identify es-
sential academic skills which every student, regardless of major, should
have acquired by the end of the sophomore year. The task forces worked
through a series of meetings from January to November of 1980 with input
from institutional-level task forces which had been established to involve
faculty members in Florida's public universities and community colleges
in the iuentification of the skills.
The task forces identified four generic competencies (reading, listening,
writing, and speaking) in communication and four generic competencies
(algorithms, concepts, generalizations, and problem solving) in computa-
tion. Each generic competency was subsequently reviewed and broad skill
categories developed for each competency.
Skills were then developed for each broad skill category. These skills
were presented to a random sample of faculty members from broad discipline
areas in Florida's public community colleges and universities. Based on
the results of the survey, the task forces - recommendations to the
SBE. In September 1981 the SBE adopted all o, -he skills recommended by
the task forces. During 1985 and 1989, an extensive review of the CLASP
skills resulted in the addition, deletion, and/or modification of some of
the original skills. As a result of the 1985 review, revised skills were
adopted by the SBE and have been measured by the CLAST since the fall 1987
administration (table 1); the revised skills resulting from the 1989
review will be incorporated into the CLAST with the fall 1992
administration.
3
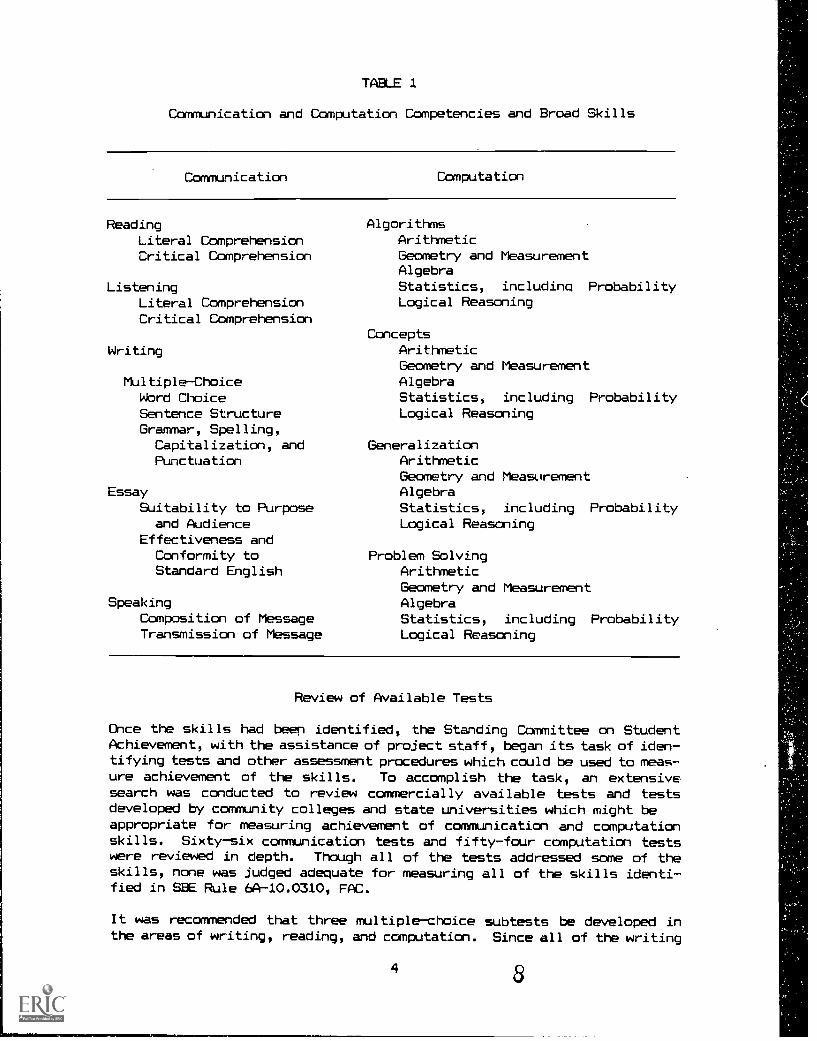
TABLE 1
Communication and Computation Competencies and Broad Skills
Corrinu.nication Computation
ReadingLiteral ComprehensionCritical Comprehension
ListeningLiteral ComprehensionCritical Comprehension
Writing
Multiple-ChoiceWord ChoiceSentence StructureGrammar, Spelling,
Capitalization, andPunctuation
EssaySuitability to Purpose
and AudienceEffectiveness and
Conformity toStandard English
SpeakingComposition of MessageTransmission of Message
AlgorithmsArithmeticGeometry and MeasurementAlgebraStatistics, including ProbabilityLogical Reasoning
ConceptsArithmeticGeometry and MeasurementAlgebraStatistics, including ProbabilityLogical Reasoning
GeneralizationArithmeticGeometry and MeasurementAlgebraStatistics, including ProbabilityLogical Reasoning
Problem SolvingArithmeticGeometry and MeasurementAlgebraStatistics, including ProbabilityLogical Reasoning
Review of Available Tests
Once the skills had been identified, the Standing Committee on StudentAchievement, with the assistance of project staff, began its task of iden-tifying tests and other assessment procedures which could be used to meas-ure achievement of the skills. To accomplish the task, an extensivesearch was conducted to review commercially available tests and testsdeveloped by community colleges and state universities which might beappropriate for measuring achievement of communication and computationskills. Sixty-six communication tests and fifty-four computation testswere reviewed in depth. Though all of the tests addressed some of theskills, none was judged adequate for measuring all of the skills identi-fied in SBE Rule 6A-10.0310, FAC.
It was recommended that three multiple-choice subtests be developed inthe areas of writing, reading, and computation. Since all of the writing
skills could not be tested using a multiple-choice format, it was further
recommended that an essay test be developed to measure the entire set of
writing skills. Although students should have obtained the listening and
speaking skills by the time they complete their sophomore year in college,
no statewide tests had been developed to measure student achievement of
those skills.
A more detailed report on the test search may be found in Test Search and
Screen for College-Level Communication and Computation Skills (Department
of Education, May 1981).
Development of Test Specifications
Specifications for a test which could be used to measure the achievement
of the skills listed in SHE Rule 6A-10.0310, FAC, were developed between
April and August of 1981 by the project director and staff, with assis-
tance from the Standing Committee on Student Achievement, the communica-
tion and computation task forces, and measurement consultants. Recommen-
dations of state-level task force members about the assessment of the
skills, as well as practical and measurement issues, were considered in
determining the nature of the subtests and the number of items to be in-
cluded in each subtest. These same procedures were followed for revising
the test specifications necessitated by the 1985 and 1989 skill revisions.
Specifications for the 1989-90 forms are described in Chapter III.
Development of Item Specifications
After test specifications were developed, formulation of item specifica-
tions began. During the fall of 1981, item specifications were written
for the reading and writing skills, as well as the computation skills
dealing with algorithms and concepts. In 1983 item specifications forcomputation skills dealing with generalizations and problem solving were
written and reviewed. Concurrently, the original specifications for the
essay, writing, and reading items were reviewed again and revised as nec-
essary. This process was repeated following the 1985 and 1989 revisions.
All specifications were written by the chairpersons of the state-level
task forces with assistance from task force members, standing committee
members, content and measurement consultants, and Department of Education
staff. Reviews of the specifications were done by faculty members from
community colleges and state universities. Appendix D lists the 1989
review team.
Item writers used the item specifications as guides for item content and
format. Copies of item specifications were distributed for use in all
thirty-seven community colleges and state universities to aid faculties
in planning for instruction and assessment of the skills. Copies of item
specifications are available in the institutions as well as from the De-
partment of Education.
5
Development of Items
Items are developed for the CLAST through contracts with post-secondaryfaculty who write, review, pilot test, and revise items based on itemspecifications and recommendations of state-level item review committees.Items developed under these contracts are submitted to the Department ofEducation for field-testing and analysis. The following procedures areused to develop and approve test items for the CLAST.
1. A contractor is selected based on its qualifications, including itspast performance as an item developer and the qualifications of itsitem writers and reviewers.
2. The contractor holds a training session for item writers and reviewersto discuss test security issues, purpose of the CLAST, use of itemspecifications, characteristics of good test items, item bias issues,and specific assignments to the contractor.
3. Initial drafts of items are written and reviewed by members of thecontractor's item writing team.
4. Items are pilot tested with college students, and the results of thepilot test and suggestions from other item writers are used in revisingthe items. The pilot test involves administering each item to aboutthirty students and interviewing at least five of them to obtain spe-cific information about the items.
5. Based on pilot test data, items are reviewed and revised by membersof the contractor's review team who have not been involved in the itemwriting. Attention is given to content, measurement, and bias issues(Appendix C).
6. Revised items are submitted to the Department of Education, and astate-level committee is convened to review the items and recommendrevisions and/or deletions in the contractor's set.
7. Based an state-level review, items are revised by the contractor's teamand submitted.to the Department of Education in final form.
8. Items are then included in the CLAST as developmental items and arenot counted as scored items for students. This produces classical andRasch item statistics for evaluating item quality. Items are screenedbased on the following criteria: p-value greater than or equal to .40,point-biserial greater than or equal to .30, Rasch fit between lessthan or equal to 3.0, and Rasch total fit less than or equal to 1.0 +3 standard errors. These criteria represent an ideal level of func-tioning for an item. If the item point-biserial statistic is less than0.30, the item may still be considered for use on a future examinationif it measures an important dimension of a required objective. Itemsare not used if the point biserial correlation coefficients are closeto or less than zero.
9. Essay topics are field-tested by a qualified contractor. Data gener-ated for topic evaluations include distribution of scores, number ofessays written, number written off topic, mean score, median score,
6
.10
percentage of complete agreement between raters, percentage of agree-
ment within one score point, alpha coefficients with and without ref-
eree, and reader comments. Topics are evaluated in terms of clarity,
relevance and appeal to the target population, suitability for develop-
ment of an essay, and potential biasing elements. The contractor rec-
ommends the topics suitable for inclusion in the CLAST and identifies
any potential problems.
In 1989-90 the Department of Education awarded a grant to Miami-Dade Com-
munity College to fieldtest previously developed essay topics for future
forms of the CLAST and to the Office of Instructional Resources at the
University of Florida to score the resultant essays.
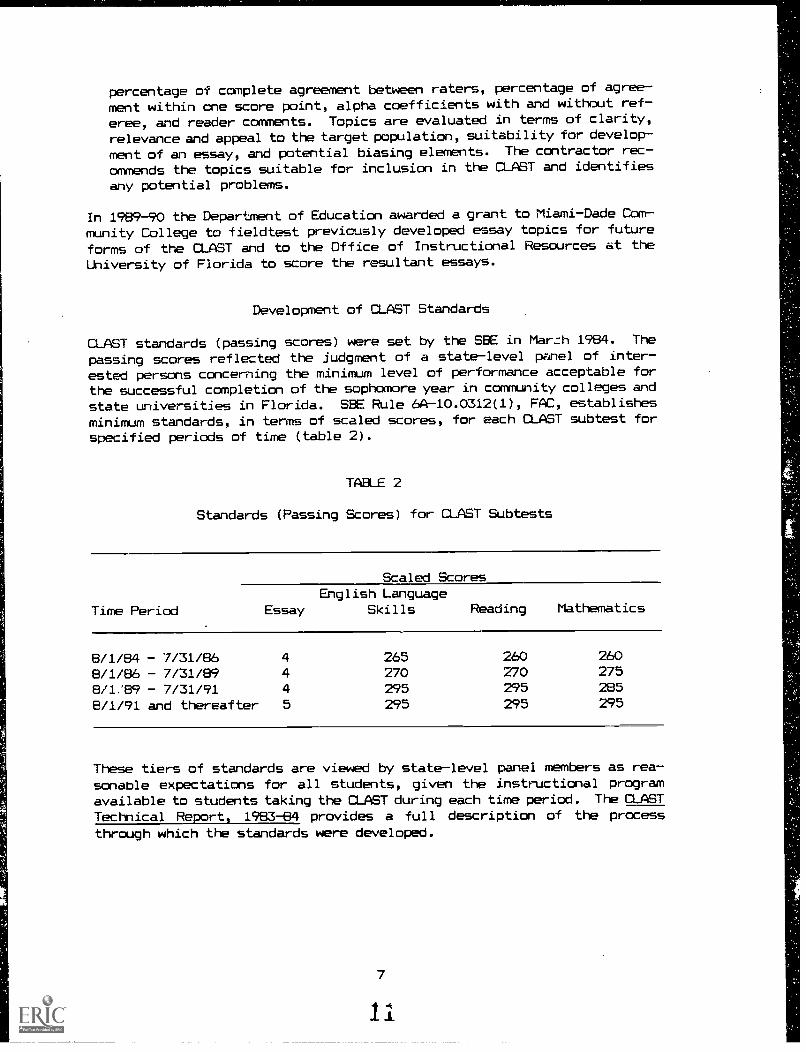
Development of CLAST Standards
CLAST standards (passing scores) were set by the SBE in Mar,:h 1984. The
passing scores reflected the judgment of a state-level panel of inter-
ested persons concerning the minimum level of performance acceptable for
the successful completion of the sophomore year in community colleges and
state universities in Florida. SSE Rule 6A-10.0312(1), FAC, establishesminimum standards, in terms of scaled scores, for each CLAST subtest forspecified periods of time (table 2).
TABLE 2
Standards (Passing Scores) for CLAST Subtests
Time Period
Scaled ScoresEnglish Language
Essay Skills Reading Mathematics
B/1/84 - 7/31/86 4 265 260 260
8/1/86 7/31/89 4 270 270 275
8/1/89 7/31/91 4 295 295 285
8/1/91 and thereafter 5 295 295 295
These tiers of standards are viewed by state-level panel members as rea-sonable expectations for all students, given the instructional programavailable to students taking the CLAST during each time period. The CLAST
Technical Report, 1983-84 provides a full description of the processthrough which the standards were developed.
7
11
III. DESCRIPTION OF THE CLAST
Each form of the CLAST is developed according to specific guidelines which
ensure that test forms from one administration to another are parallel in
content and that administration procedures are standardized. This chapterdescribes the guidelines.
Test Specifications
For each of the three annual administrations (fall, winter, and spring),a different test is created; however, each test measures the same number
of items in each broad skill area (table 3). To increase test security,
two forms of each test are printed for each administration. Both formscontain the same scored items, but the order of item placement is differ-
ent in each form. Developmental items are embedded in each test form inorder to collect data needed to add items to the item bank.
The CLAST is comprised of four subtests. The Essay subtest is presented
in a four-page folder; the English Language Skills and Reading subtestsa" -e in the same test book, and the Mathematics subtest is in separate test
book.
Item Bank
As items are developed, they are numbered with a nine-digit code identi-fying the subtest, skill, sequence number, and graphic. These items are
stored in a card file and a word processing file that are updated as itemsare revised. New items are added to the bank following the review of thedevelopmental items from each administration.
A history and attribute computer file is kept for the item bank and usedin the selection of items for test forms and in the test analysis proc-ess. The file includes attributes such as the item code, broad skillcode, item flag, date used, and test form. Statistical data include thepercentage correct, item point-biserial coefficient, Rasch difficulty, fitstatistics, and index of discrimination for each item. Data on items arekept in the active file for six administrations. After that time, a hard
copy and a tape record are stored. The computer bank then is rotated toremove the data from the earliest administrations.
Test Assembly
For each administration items are drawn from the item bank to meet thetest specifications. Items are selected to minimize the difference indifficulty between forms. Current item difficulty values are used in theselection process. Test form item difficulties are centered near zerologits. Small variations in mean difficulty occur, particularly in thereading test where items are tied to specific passages. Alternate formsare adjusted to the =moon scale by the equating procedures described inChapter IV.
9
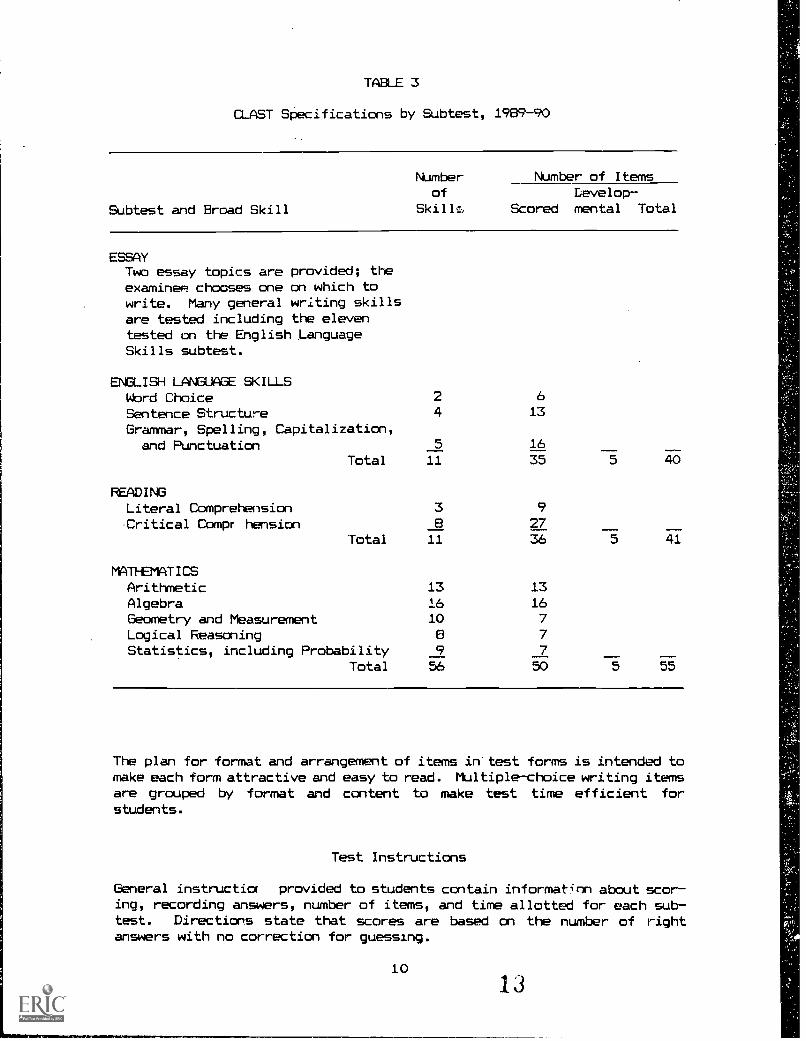
TABLE 3
CLAST Specifications by Subtest, 1989-90
Subtest and Broad Skill
Number Number of Itemsof Develop-
Skills Scored mental Total
ESSAYTwo essay topics are provided; theexaminee chooses one on which towrite. Many general writing skillsare tested including the eleventested on the English LanguageSkills subtest.
ENGLISH LANGUAGE SKILLSWord Choice 2 6
Sentence Structure 4 13
Grammar, Spelling, Capitalization,and Punctuation 5 16
Total 11 35 46
READINGLiteral Comprehension 3 9Critical Compr hension a 27
Total 11 36 5 41
MATHEMATICSArithmetic 13 13Algebra 16 16Geometry and Measurement 10 7Logical Reasoning 8 7Statistics, including Probability 9 7 __
Total 56 50 5 55
The plan for format and arrangement of items in'test forms is intended tomake each form attractive and easy to read. Multiple-choice writing itemsare grouped by format and content to make test time efficient forstudents.
Test Instructions
General instructia provided to students contain informat'nn about scor-ing, recording answers, number of items, and time allotted for each sub-test. Directions state that scores are based on the number of rightanswers with no correction for guessing.
10
13
The CLAST was administered in one session, which required nearly fivehours. Although actual test time was four hours, additional time wasrequired to check in examinees, code identifying information, distributeand collect materials, read directions for each subtest, and provide aten-minute restroom break. The essay test was administered first, andstudents were allowed 60 minutes to complete it; the English languageskills and reading tests were given next and 80 minutes were allowed fortheir completion; the computation test was administered last, and studentswere given 90 minutes to work on it.
Modifications in test format, such as braille, audio cassette and largeprint, were available for handicapped students. In addition, the testschedule and administration procedures were modified for handicapped ex-aminees. Details of these modifications are provided in the CLAST Insti-tutional Test Administrator's Manual.
Quality Control
Test form quality is maintained through an extensive review process.Drafts of new test forms are reviewed by staff of the Technical SupportContractor and the Department of Education. After changes in items andcorrections are made, there is a thorough review of camera-ready copy,which is followed by a careful review of bluelines. Additional informa-tion about the performance of the test is taken from the institutionaltest administrators' and room supervisors' reports and on-site visits totest centers by Department of Education personnel. These reports provideinformation about the quality of test booklets, the standardization oftest administrations, and the adequacy of allotted test times.
11
14
IV. TECHNICAL CHARACTERISTICS OF THE CLAST
To preserve comparability of CLAST scores from one administration to thenext, test scores are equated using a base scale. To ensure reliabilityand validity of the test and test items, many traditional test analysisprocedures are used. This section describes the equating process andprocedures used to review the reliability and validity of the test.
Test Score Equating
The Rasch Model
The CLAST scale development is based on the logistic response model ofGeorg Rasch, presented in Probabilistic Models l'or Some Intelligence,andAttainment Tests, 1960. Rasch describes a probabilistic model in whichthe probability that a person will answer an item correctly is assumed tobe based on the ability of a person and the difficulty of the item. Theseestimates are derived independently and are not related to the particularsample of people or of items. When the assumptions of the model are met,tests of unequal difficulty can be equated.
Rasch mode, estimates of person ability and item difficulty are obtainedusing the unconditional maximum likelihood estimation procedure describedin Wright, Mead, and Bell, BICAL: Calibrating Items With the Rasch Model,1980. Tne probability of a score X is expressed as
exp [X(B,- 8,)]P(X I B 8,) =
1 + exp [Be- 8,]
where Xv, = a score, Bv = person ability, and 8, = item difficulty.
Person ability in logits represents the natural log odds for succeedingon items which define the scale origin. The item difficulty in logitsrepresents the natural log odds for failure on an item by persons withabilities at the scale origin.
One key assumption of the Rasch model is that a test under considerationis unidimensional. That is, it measures only one underlying student cog-nitive ability. Unfortunately, ability is considered to be "latent' andcannot be seen or measured in a very precise manner. Therefore, it isimportant to monitor the performance of the test and to conduct studieswhich will indica'.e whether the test is likely to be unidimensional. Thishas been done with the CLAST examination in two studies. The first studywas performed in 1984 with the computation test. The second was done ir1986 with the reading, computation, and writing tests. Both studiesshowed that the use of Rasch techniques is justified.
Calibration of Items
Item difficulties are obtained by calibrating the scored items for eachadministration. Three systematic random samples of 700 records are drawn.The items are calibrated, and the item difficulty logits are averaged from
13
the three calibration samples. Using the averaged difficulties, the itemlogits are adjusted to the October 1982 base scale.
Item history records are kept in a computer file and updated after eachadministration. The stability of Rasch difficulty, discrimination val-ues, and fit statistics are checked, and items that change values by morethan .3 logit are flagged for further inspection. In addition, following
each administration, items are re-examined against established itemscreening criteria.
Newly developed or revised items are embedded within each form of the testand then calibrated and adjusted to the base scale. These items are notcounted toward examinees' scores and are not included in the initial cal-ibrations used to develop the score scale. After the score scale is cre-ated, each test form is recalibrated with both the new and the scoreditems to estimate item difficulties of the new items. The scored itemsserve as a link between the new items in each test form. Item difficul-ties for the new items are adjusted to the base scale using the linkingconstant derived from the comparison of the calibration of the scoreditems to their base item difficulties. For a complete discussion of themethod, see Ryan, J., Equating New Test Forms to an Existing Test, 1981.
Generation of Ability Estimates
The traditional estimate of achievement level is the raw score obtainedfrom the number of correct answers provided. The Rasch model is used togenerate ability estimates corresponding to the traditional test score.
Adjusted item difficulty logits obtained in item calibration become thebasis for estimating person abilities. Generation of ability estimatesresults in a logit ability scale corresponding to the logit difficultyscale of items. Rasch ability logits are derived using the unconditionalmaximum likelihood estimation procedures of the program ABIL-EST (Ryan,1981).
The ability estimate corresponding to each raw score between one pointand the number of items minus one is calculated. (Perfect or zero scoresare not included in Rasch calculations.) The ability logit scale is thencentered at the mean for the October 1982 administration and converted tothe standard score scale using a linear transformation.
Linking E:aled Scores
Through use of Rasch methodology, it is possible to place scores fromtests of unequal difficulty on the same scale. While the CLAST diffi-culty is controlled by selecting items having approximately the sameaverage and range of difficulty for each administration, some fluctuationin difficulty may occur in order to use items representing a broad rangeof content and difficulty. Differences in test form difficulty arecontrolled by equating.
Tests forms given on two different occasions are equated by using informa-tion obtained from a subset of items commcn to both forms. These commonitems are known as "anchor items." The performance of the two groups ofexaminees on the anchor items is used to adjust the measurement scales for
14
16
the two forms; the measurement scale for the second form is "adjusted" to
that of the first form. From a measurement perspective, the examinees in
both instances took the same form of the test. For the CLAST, all test
forms are equated back to the first administration of October 1982. With
this approach, all students face identical hurdles in that no student has
the advantage of an "easier" form.
For each administration, CLAST item difficulties have been adjusted to
the base scale of October 1982. Item logits obtained from calibrating
the scored items are adjusted by adding the linking constant to each item
logit. The difference in average difficultyrepresents the shift in over-
all difficulty between test forms. This constant is added to the current
item logits to adjust them to the base scale. The stability of the link
is evaluated by comparing the difficulty values over time to the values
in the base scale.
Reliability of Scores
Reliability is an indicator of the consistency in measurement of student
achievement. It provides an estimate of the variation in results that
can be attributed to random error in measurement. The index of reliabil-
ity is interpreted as the ratio of true-score variance to observed-score
variance. Reliability is estimated somewhat differently for multiple-
choice scores and essay ratings. Procedures used with each type of score
are described in the following sections.
Reliability of Multiple-Choice Scores
The reliability of multiple-choice subtest scores is estimated using the
Kuder-Richardson Formula 20 (KR-20) coefficient and the standard error of
measurement (SEM). The KR-20 coefficient is an internal consistency esti-
mate of reliability, proposed by Kuder and Richardson in 1937, based on
the concept that achievement on items drawn from the same content domain
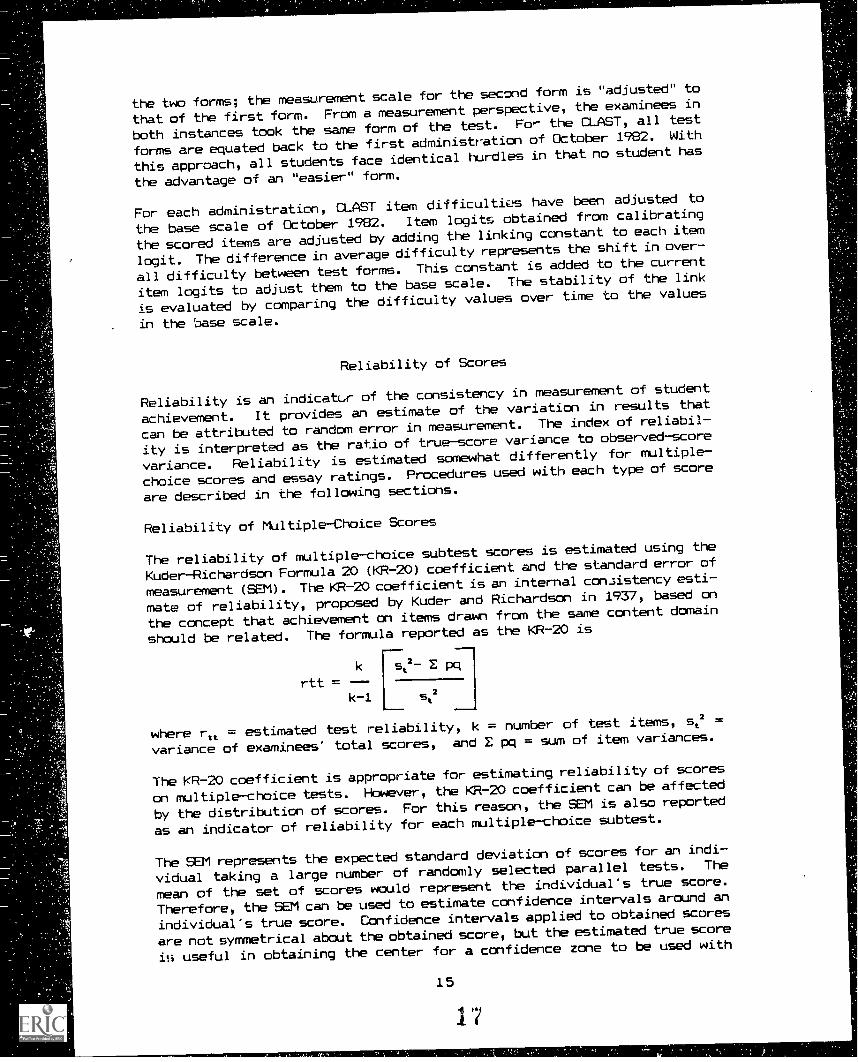
should be related. The formula reported as the KR-20 is
k st2- E Pqrtt =
k-12t
where rtt = estimated test reliability, k = number of test items, s2 =
variance of examinees' total scores, and E pq = sum of item variances.
The KR-20 coefficient is appropriate for estimating reliability of scores
on multiple-choice tests. However, the KR-20 coefficient can be affected
by the distribution of scores. For this reason, the SEM is also reported
as an indicator of reliability for each multiple-choice subtest.
The SEM represents the expected standard deviation of scores for an indi-
vidual taking a large number of randomly selected parallel tests. The
mean of the set of scores would represent the individual's true score.
Therefore, the SEM can be used to estimate confidence intervals around an
individual's true score. Confidence intervals applied to obtained scores
are not symmetrical about the obtained score, but the estimated true score
useful in obtaining the center for a confidence zone to be used with
15
the obtained score. The smaller the SEM, the less dispersed are the par-allel test scores and the more likely the estimate is close to the indi-vidual's true score.
The formula for computing the SEM is SEM = st41-r where st = standard
deviation of the test scores and r = test reliability coefficient.
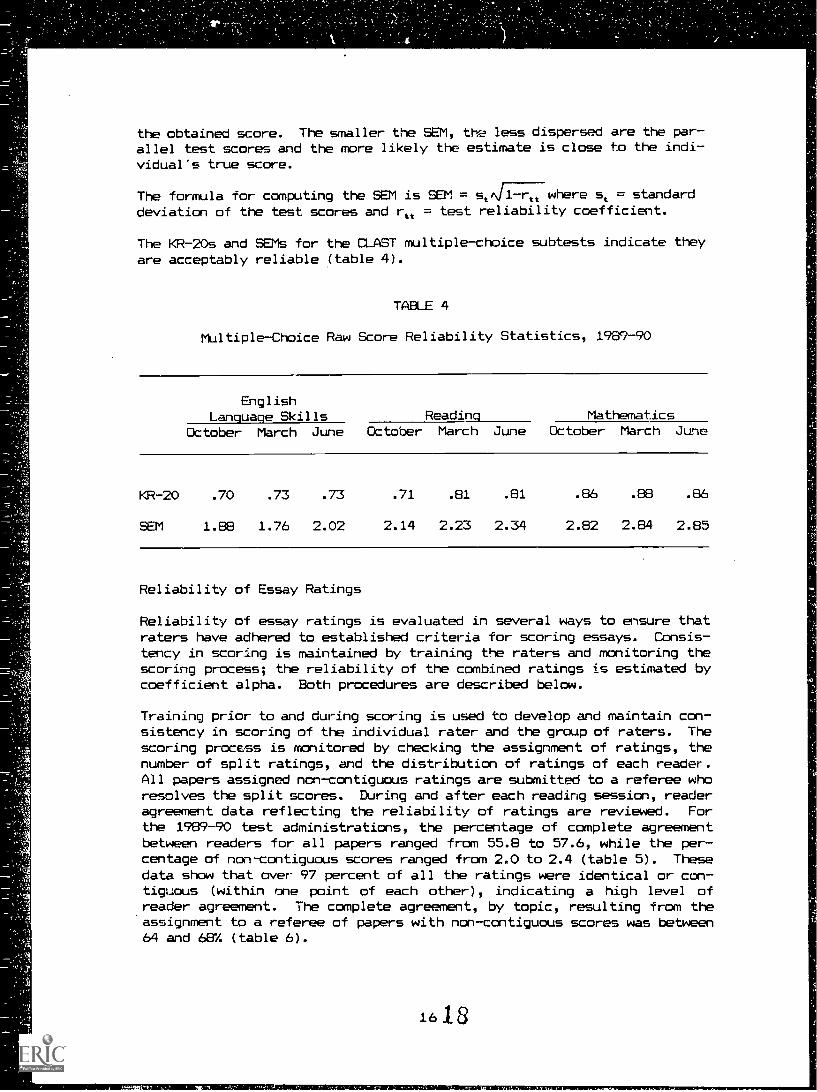
The KR-20s and SEM for the CLAST multiple-choice subtests indicate theyare acceptably reliable (table 4).
TABLE 4
Multiple-Choice Raw Score Reliability Statistics, 1989-90
EnglishLanguage Skills Reading Mathematics
October March June October March June October March June
KR-20 .70 .73 .73 .71 .81 .81 .86 .88 .86
SEM 1.88 1.76 2.02 2.14 2.23 2.34 2.82 2.84 2.85
Reliability of Essay Ratings
Reliability of essay ratings is evaluated in several ways to ensure thatraters have adhered to established criteria for scoring essays. Consis-tency in scoring is maintained by training the raters and monitoring thescoring process; the reliability of the combined ratings is estimated bycoefficient alpha. Both procedures are described below.
Training prior to and during scoring is used to develop and maintain con-sistency in scoring of the individual rater and the group of raters. Thescoring process is monitored by checking the assignment of ratings, thenumber of split ratings, and the distribution of ratings of each reader.All papers assigned non-contiguous ratings are submitted to a referee whoresolves the split scores. During and after each reading session, readeragreement data reflecting the reliability of ratings are reviewed. Forthe 1989-90 test administrations, the percentage of complete agreementbetween readers for all papers ranged from 55.8 to 57.6, while the per-centage of non-contiguous scores ranged from 2.0 to 2.4 (table 5). Thesedata show that over- 97 percent of all the ratings were identical or con-tiguous (within one point of each other), indicating a high level ofreader agreement. The complete agreement, by topic, resulting from theassignment to a referee of papers with non-contiguous scores was between64 and 68/. (table 6).
1613
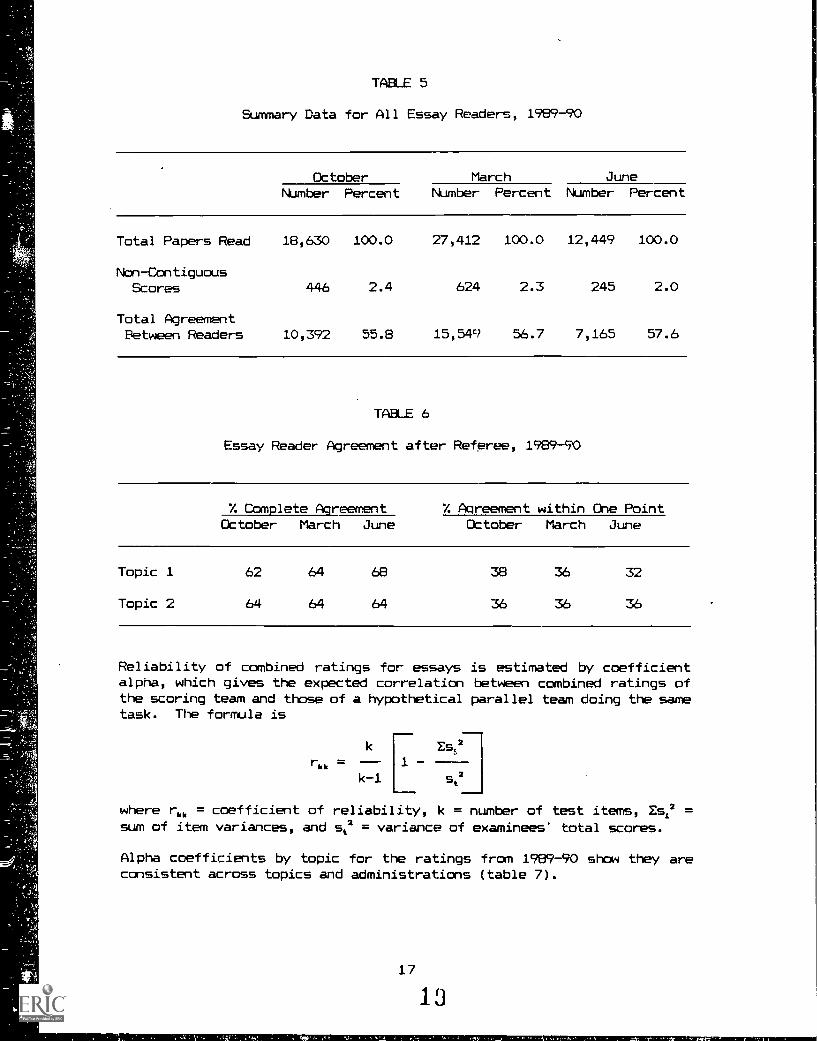
TABLE 5
Summary Data for All Essay Readers, 1989-90
October March JuneNumber Percent Number Percent Number Percent
Total Papers Read 18,630 100.0 27,412 100.0 12,449 100.0
Non ContiguousScores 446 2.4 624 2.3 245 2.0
Total AgreementBetween Readers 10,392 55.8 15,549 56.7 7,165 57.6
TABLE 6
Essay Reader Agreement after Referee, 1989-90
% Complete Agreement % Agreement within Die PointOctober March June October March June
Topic 1 62 64 68 38 36 32
Topic 2 64 64 64 36 36 36
Reliability of combined ratings for essays is estimated by coefficientalpha, which gives the expected correlation between combined ratings ofthe scoring team and those of a hypothetical parallel team doing the sametask. The formula is
k
rkk=k -1
1
Ess2
st2
where rkk = coefficient of reliability, k = number of test items, Esi2 =sum of item variances, and st2 = variance of examinees' total scores.
Alpha coefficients by topic for the ratings from 1989-90 show they areconsistent across topics and administrations (table 7).
17
13
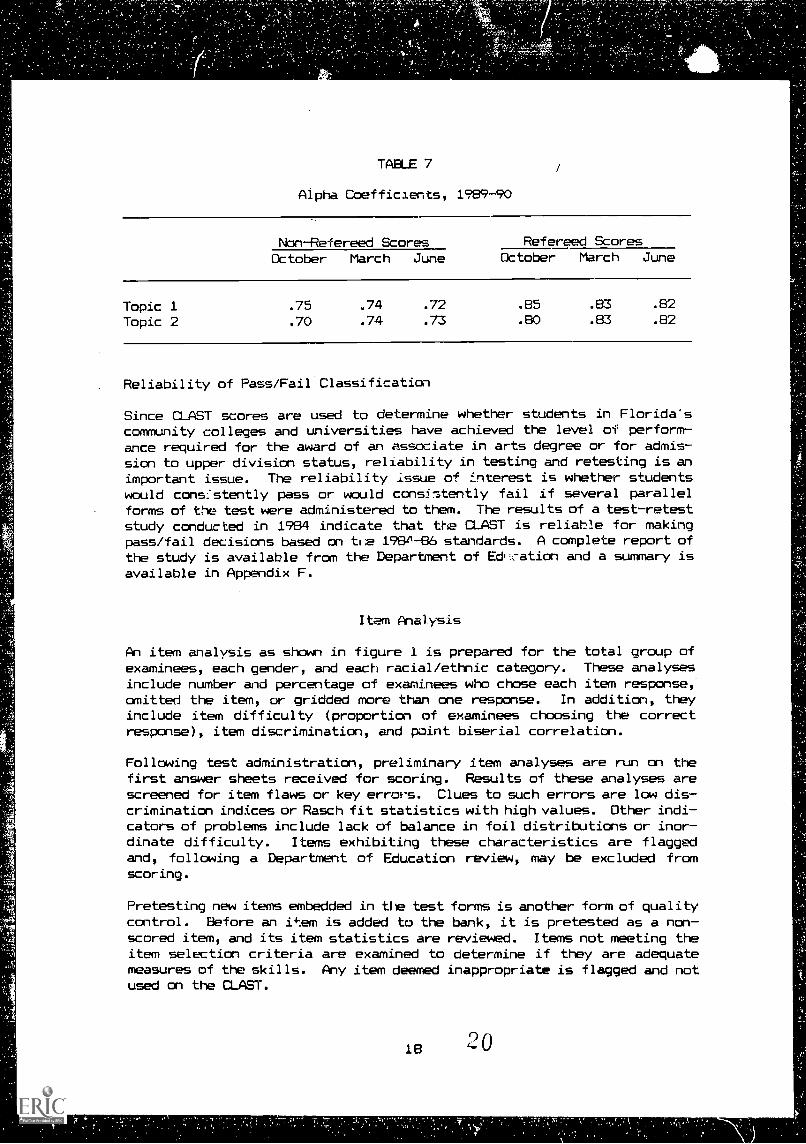
Alpha Coefficients, 1989-90
Non - Refereed Scores Refereed Scores
October March June October March June
Topic 1 .75 .74 .72 .85 .83 .82
Topic 2 .70 .74 .73 .80 .83 .82
Reliability of Pass/Fail Classification
Since CLAST scores are used to determine whether students in Florida'scommunity colleges and universities have achieved the level of perform-ance required for the award of an associate in arts degree or for admis-sion to upper division status, reliability in testing and retesting is animportant issue. The reliability issue of interest is whether studentswould consistently pass or would consistently fail if several parallelforms of the test were administered to them. The results of a test-reteststudy conducted in 1984 indicate that the CLAST is reliable for makingpass/fail decisions based on tre 198A-86 standards. A complete report ofthe study is available from the Department of Ed,:c-ation and a summary isavailable in Appendix F.
Item Analysis
An item analysis as shown in figure 1 is prepared for the total group ofexaminees, each gender, and each racial/ethnic category. These analysesinclude number and percentage of examinees who chose each item response,omitted the item, or gridded more than one response. In addition, theyinclude item difficulty (proportion of examinees choosing the correctresponse), item discrimination, and 'mint biserial correlation.
Following test administration, preliminary item analyses are run on thefirst answer sheets received for scoring. Results of these analyses arescreened for item flaws or key errors. Clues to such errors are low dis-crimination indices or Rasch fit statistics with high values. Other indi-cators of problems include lack of balance in foil distributions or inor-dinate difficulty. Items exhibiting these characteristics are flaggedand, following a Department of Education review, may be excluded fromscoring.
Pretesting new items embedded in the test forms is another form of qualitycontrol. Before an item is added to the bank, it is pretested as a non-scored item, and its item statistics are reviewed. Items not meeting theitem selection criteria are examined to determine if they are adequatemeasures of the skills. Any item deemed inappropriate is flagged and notused on the CLAST.
18
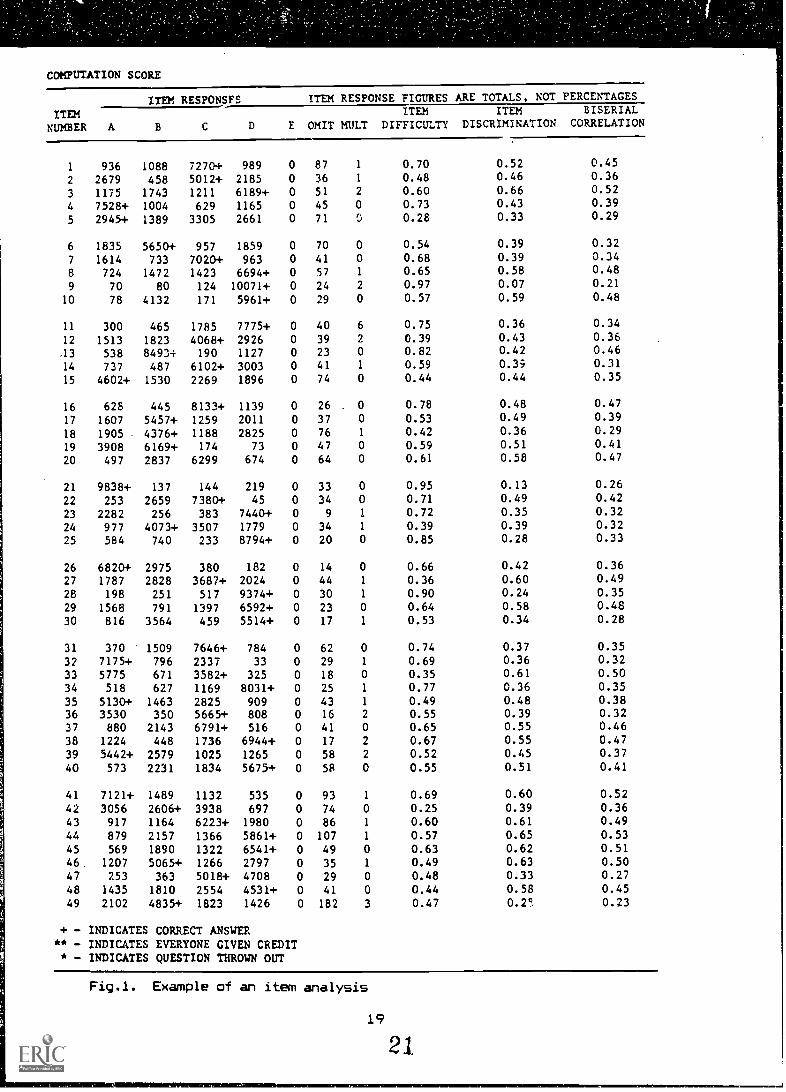
COMPUTATION SCORE
ITEM RESPONSFS ITEM RESPONSE FIGURES ARE TOTALS, NOT PERCENTAGES
ITEM ITEM ITEM BISERIAL
NUMBER A B C D E OMIT MULT DIFFICULTY DISCRIMINATION CORRELATION
1 936 1088 7270+ 989 0 87 1 0.70 0.52 0.45
2 2679 458 5012+ 2185 0 36 1 0.48 0.46 0.36
3 1175 1743 1211 6189+ 0 51 2 0.60 0.66 0.52
4 7528+ 1004 629 1165 0 45 0 0.73 0.43 0.39
5 2945+ 1389 3305 2661 0 71 0 0.28 0.33 0.29
6 1835 5650+ 957 1859 0 70 0 0.54 0.39 0.32
7 1614 733 7020+ 963 0 41 0 0.68 0.39 0.34
8 724 1472 1423 6694+ 0 57 1 0.65 0.58 0.48
9 70 80 124 10071+ 0 24 2 0.97 0.07 0.21
10 78 4132 171 5961+ 0 29 0 0.57 0.59 0.48
11 300 465 1785 7775+ 0 40 6 0.75 0.36 0.34
12 1513 1823 4068+ 2926 0 39 2 0.39 0.43 0.36
.13 538 8493+ 190 1127 0 23 0 0.82 0.42 0.46
14 737 487 6102+ 3003 0 41 1 0.59 0.39 0.31
15 4602+ 1530 2269 1896 0 74 0 0.44 0.44 0.35
16 628 445 8133+ 1139 0 26 . 0 0.78 0.48 0.47
17 1607 5457+ 1259 2011 0 37 0 0.53 0.49 0.39
18 1905 4376+ 1188 2825 0 76 1 0.42 0.36 0.29
19 3908 6169+ 174 73 0 47 0 0.59 0.51 0.41
20 497 2837 6299 674 0 64 0 0.61 0.58 0.47
21 9838+ 137 144 219 0 33 0 0.95 0.13 0.26
22 253 2659 7380+ 45 0 34 0 0.71 0.49 0.42
23 2282 256 383 7440+ 0 9 1 0.72 0.35 0.32
24 977 4073+ 3507 1779 0 34 1 0.39 0.39 0.32
25 584 740 233 8794+ 0 20 0 0.85 0.28 0.33
26 6820+ 2975 380 182 0 14 0 0.66 0.42 0.36
27 1787 2828 3687+ 2024 0 44 1 0.36 0.60 0.49
28 198 251 517 9374+ 0 30 1 0.90 0.24 0.35
29 1568 791 1397 6592+ 0 23 0 0.64 0.58 0.48
30 816 3564 459 5514+ 0 17 1 0.53 0.34 0.28
31 370 1509 7646+ 784 0 62 0 0.74 0.37 0.35
32 7175+ 796 2337 33 0 29 1 0.69 0.36 0.32
33 5775 671 3582+ 325 0 18 0 0.35 0.61 0.50
34 518 627 1169 8031+ 0 25 1 0.77 0.36 0.35
35 5130+ 1463 2825 909 0 43 1 0.49 0.48 0.38
36 3530 350 5665+ 808 0 16 2 0.55 0.39 0.32
37 880 2143 6791+ 516 0 41 0 0.65 0.55 0.46
38 1224 448 1736 6944+ 0 17 2 0.67 0.55 0.47
39 5442+ 2579 1025 1265 0 58 2 0.52 0.45 0.37
40 573 2231 1834 5675+ 0 58 0 0.55 0.51 0.41
41 7121+ 1489 1132 535 0 93 1 0.69 0.60 0.5242 3056 2606+ 3938 697 0 74 0 0.25 0.39 0.36
43 917 1164 6223+ 1980 0 86 1 0.60 0.61 0.4944 879 2157 1366 5861+ 0 107 1 0.57 0.65 0.5345 569 1890 1322 6541+ 0 49 0 0.63 0.62 0.5146 1207 5065+ 1266 2797 0 35 1 0.49 0.63 0.5047 253 363 5018+ 4708 0 29 0 0.48 0.33 0.27
48 1435 1810 2554 4531+ 0 41 0 0.44 0.58 0.4549 2102 4835+ 1823 1426 0 182 3 0.47 0.2c 0.23
+ - INDICATES CORRECT ANSWER** - INDICATES EVERYONE GIVEN CREDIT* - INDICATES QUESTION THROWN OUT
Fig.l. Example of an item analysis
19
21.
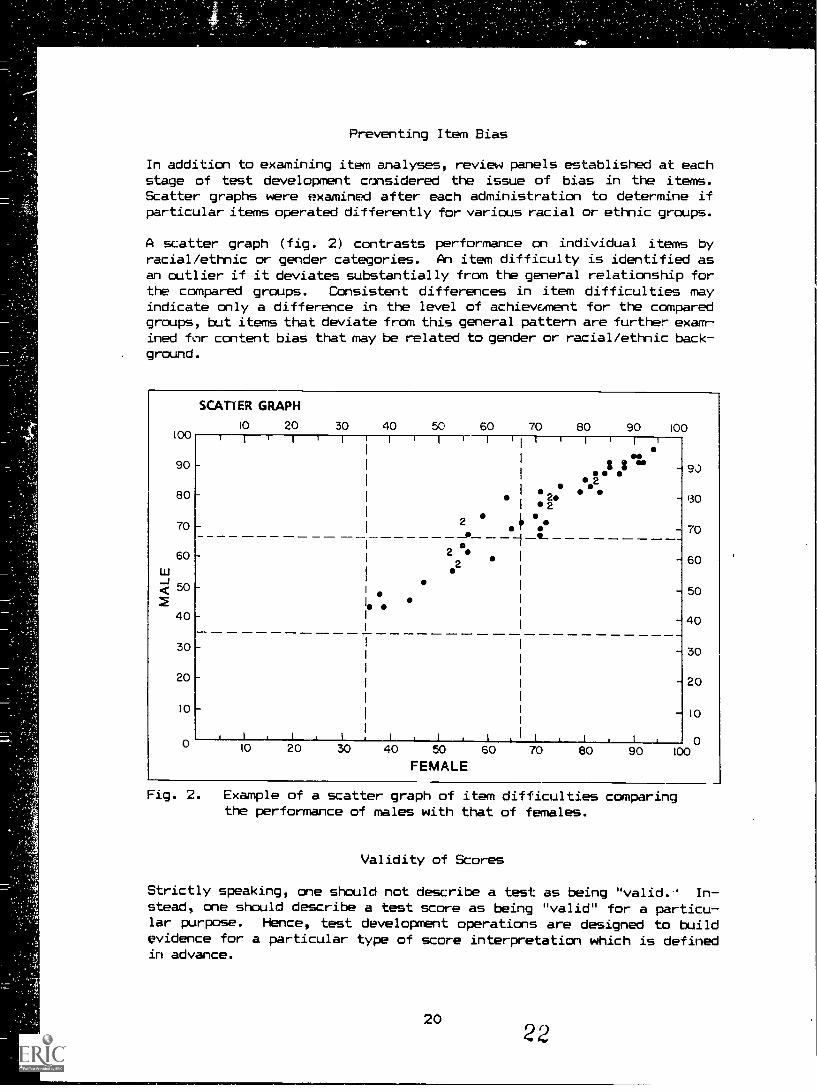
Preventing Item Bias
In addition to examining item analyses, review panels established at eachstage of test development considered the issue of bias in the items.Scatter graphs were examined after each administration to determine ifparticular items operated differently for various racial or ethnic groups.
A scatter graph (fig. 2) contrasts performance on individual items byracial/ethnic or gender categories. An item difficulty is identified asan outlier if it deviates substantially from the general relationship forthe compared groups. Consistent differences in item difficulties mayindicate only a difference in the level of achievement for the comparedgroups, but items that deviate from this general pattern are further exam-ined for content bias that may be related to gender or racial/ethnic back-ground.
LI<
100
90
80
70
60
50
40
30
20
10
SCAT1ER GRAPH
10 20 30 40 50 60 70 80 90 100
9,)
130
70
60
50
40
30
20
10
0I 1
I 1
2
2
e2
1ii
1
1
I 2I 2
Y
I I 1
et 11:es
I
-
-
10 20 30 40 50
FEMALE60 70 80 90 100
Fig. 2. Example of a scatter graph of item difficulties comparingthe performance of males with that of females.
Validity of Scores
Strictly speaking, one should not describe a test as being "valid." In-stead, one should describe a test score as being "valid" for a particu-lar purpose. Hence, test development operations are designed to buildevidence for a particular type of score interpretation which is definedin advance.
2022
Standards for Educational and Ps holu.ical Testin (1985) describes three
types of validity: content, construct, and criterion. Content validity
is the only important type for the CLAST because test scores are only
interpreted in terms of what they indicate about student achievement of
designated performance objectives. The CLAST does not measure a desig-
nated psychological characteristic (e.g., spatial visualization), so con-
struct validity is not relevant. Further, as has been stated, the CLAST
was not designed to predict a student's future performance in school.
Hence, the criterion-related (i.e., predictive) validity is not relevant.
Content validity is substantiated by determining the extent to which the
test items adequately measure the specific skills they are designed to
measure; that is, the extent to which the content of the test matches the
set of skills. The validity of the test is established by following the
plan and procedures for developing and selecting items for each form of
the CLAST.
The general plan used in developing the test is outlined below.
1. General test specifications, consistent with the purpose of the CLAST,
are developed by faculty who have expertise in both testing and the
content areas (English language skills, reading, and mathematics) with
assistance of Department of Education staff.
2. Item specifications detailing both content and format of items which
can be developed tn measure each of the skills, are developed by fac-
ulty with expertise in both the content areas and testing, with assis-
tance of Department of Education staff.
3. Test items are written by faculty according to the guidelines provided
by the item specifications and are reviewed by faculty and Department
of Education staff with careful attention given to content, measure-
ment, and bias issues.
4. Test items are field-tested in community colleges and state universi-
ties.
5. Items are analyzed statistically and selected for use in the test only
if they meet cr teria established by Department of Education staff and
testing consultants.
6. A test plan for selection of items is followed in developing alternate
forms of the test.
7. Scaled scores equated to the reference scale are generated using the
Rasch model.
To summarize, validity of the test as a measure of achievement of the
skills is established by following the plan for developing and selecting
items. Content and testing specialists judge the adequacy of the items
for measuring the skills, and the plan for selecting items ensures that
each form of the CLAST is representative of the domain of skills being
tested. Scores on each of the subtests, then, can be interpreted to be
valid indicators of students' achievement of the communication and math-
ematics skills measured by the CLAST.
21
23
V. SCORING AND REPORTING PROCEDURES
Procedures for scoring'the CLAST are designed to provide quality controland score scale stability for a testing program that has complex scoringand reporting requirements. The process for scoring and reporting re-flects concern for reliability and comparability of the scores and forappropriate use of the scores. This chapter addresses those concerns.
Scoring Activities
Editing Answer Sheets
Following each administration, as answer sheets are received from eachinstitution, they are edited for errors. Answer sheets are read by anNCS Sentry 7018 scanner programmed to identify mismarked or miscodedsheets. Each identified answer sheet is hand-checked and corrected ac-cording to the scoring conventions.
Rating sheets, from holistic scoring of essays are also machine-scored.Editing procedures for holistic scoring include a verification of thelegitimacy of reader numbers and score codes. Papers with invalid scoresor with ratings that differ by more than one point are returned to thereferee to be corrected and/or reviewed.
Scoring Conventions
Within the parameters of number-right scoring, certain conventions areobserved: for a response to be considered valid, it must be recorded inthe answer folder; for a score to be generated on a subtest, at least oneresponse must be marked in the appropriate section of the answer sheet;and omits and double grids are counted as incorrect. To receive creditfor the essay test, students must write on one of the two topics provided,and they must write the essay in their answer folders.
Students' subtest scores below the chance level are compared to theirother subtest scores. If a score is inconsistent with the student's per-formance on the other subtests, it is hand-checked to determine if thestudent entered the correct form code on the answer sheet.
Score Scales
A three-digit standard scaled score is generated for each administrationfor each of the multiple-choice subtests. The standard score scale is alinear transformation of the Rasch ability logits adjusted for the meanof the October 1982 administration. The formula used is
Si = 30(X, L; 1 300
where: S, = scaled score, X, = ability logit, C = October 1982 scaleadjustment factor (1.87 for English language skills, 1.2 for reading and1.0 for mathematics). Raw score to scaled score transformation data aregenerated for each subtest for each administration (tables 8, 9 and 10).
23
5P8inL0
03L_yU3N0'
_J,40
_c
2L0a
>,
LOro
4JL
3 0
/U
S"
NI CV ct 0) CO
ct
1
r--0
NJ O0 N 4)
4)
43 N
43 to
s0 hi u/ -0
S. uo0'
tOcr cr cr
0 0 40 4)
1",
CV
CV CV
N N CV N C4 CV CV CV 1\1 CV CV N
hi hi
ti
n5;
r71
7.1
r;*
V: 5; 1.2.
re)
r,'.1
9;
gl
OP 53
=; PR :1 2; t71 di 53 51 r.'15
f;'1
1' Li;
MI
il
pppGc;
NM
i;:
12.4
gl
PR A PR f\II
?53
;f5
F:
9i
fl
Sq
NN
NN
NN
NN
NN
NN
NN
tO
csj.0
1015(1- 43 hi ch
40
is,
.4-
.4- r,
V) OD
4D
CD
u)
r crtO
ul-0
51 53 :1 18 F.1 3 53 5;
Fl 53 8O P: 5; '4?
T,11:z g 5P r: "3
p 51 8
"No- g:
P; 9!-; 2 PR tR
CN
V'
C) r, r,
.
,o u.)
1-
tON
NN
NN
NN
-4-1-1-4-1i-1????000+N
11111111111111111111111111
53
1-1-:
EP
tl 9iq
JR
N N '
43
N1O
INN
:1
SP
-1
NN
NN
N N
NN
NN
EP
31%1 PR OR
Pi LI:
g:4
eOR
!ri;
,46# 4) ON
Cr CA C)
ir) Cr
w4
r--4 C
)hi
u, LI.,
00
43 ID
ct ct hi hi hi hi hi N C4
C4 rq
0 5) 5) ? (i) C) () 0 C)
cq
1111111111111111111111111
C) '4 C4 14)
ct.11) '° r' Cl"h 2 :1 (-1
2i
CI N 51
g1 59 r(,) Pi
PR
PI 11
V3
oro
CE
UL
2 ).
,1
a
L
O
a
L3
1Y
ji F9 N N ' N N P° I"' '8 43 ° Fl FlNNNNNNNNNNN MMMM M
N g: 8 2 (ri NEM990 clB rA g3 :21 8 tiMNOONMu7NPN mM 3
TTTYYYYYVVii"???????"°""'""
262$.74MAP3IVAA2%%17:PKUMMUMMNNNNNNNNNNNN
r,4 r0 rE g P
T 1 rM
I T1 7 71 1 71 1 1 t ? 5 5' ? Q c' 0 c") " -4 -1 " N "
P: 8P .. A PR Q J4 U9 748 2 r2 P2 1 ..)
NN NNNNNNNNNNN MMM M ME
1.1 5R g) cr 4) N pl (1, ul p N. 1.1 a) No r tl cq ul co in ul cq +-4
R 43 n el 9.r=1 8 8 r. gi
.0 ul cr. cr rl rq cq -1 ,1 ,1 +.1 ,1 +.1 OP ? ? 5) 05) 05) C) 0 0 0 0 ,1 +.1 N MI1111111111111111111i
Or'"") " " r' " " 1 c..1 tl L'=: R Fl Cl F9 P3 g3
t -,1:1 t -t) 1 17"?. bi N 11 6.! t;) 'c4 O Oco NJ Cr cri 4z. (4 INJ ha 0
4,c4mmi-1-1-1-00000000444444444,14,11PANAIMIMMWAMSAMITHIn HAPAWMA
613§MARMIMAINNMVEMAPATHUNUMAW2
4,(Apowl0000000bb411-11.11.411.4411.11.441(W-CPU;_,.;-00biNbb;-4.61p:0-.6C1-4bi3WWZAVZAIN .D ha 0(11IT.COVN 031 0,041 (1101 WO
CPU 0,..10"040'4W ,0044-t1000'1- IN4,41,4C0.0,-.0010) 1-.03.0(A4 .4 uN0.00MCA
NtAMOWAMMIRIMPIMMMIUMSTAPM4:1(04(A
O
2.
r.
."(
4h CA KJ F+ 0 0 0 0 0 C) 0 (10 C!) (!) 11. 11. 11. t:',) G4 (!.4 Gr..1 L4 4 4 31 h.
8 12 E ti; 7. 88 ti; (.1j tin EOZiE CP NN 8 gi a 4 1 Cd c-5 ZJ $ ft-
WMPHMTUranWEJMNEVEIVANHUVEMOM'
O
n
The score scale ranges from approximately 100 points to 400 points. Itis centered at 300 points designating the state average score on the Octo-ber 1982 administration. All subsequent examinations are equated to thisadministration. Differences in scaled score ranges across test formsoccur as a result of differences in the range of item difficulty in testforms. The difficulty of each form is controlled, however, so that theseshifts in the average score range are small. If one test form has itemsthat are more difficult, it is possible to obtain a higher scaled scorebecause the harder items measure a higher level of achievement.
The essay score is assigned on a scale of two to eight points. Two read-ers rate each essay on a rating scale from one to four points. The essayscore is the sum of the two ratings. The holistic scoring procedure andrating scale are discussed in the next section.
Essay Scoring
Holistic scoring or evaluation, a process for judging the quality of writ-ing samples, has been used for many years by testing agencies in credit-by-examination, state assessment, and teacher certification programs.
Holistic Scores
Essays are scored holistically that is, for the total, overall impres-sion they make on the reader rather than analytically, which requirescareful analysis of specific features of a piece of writing. Holisticscoring assumes that the skills which make up the ability to write areclosely interrelated and that one skill cannot be separated from theothers. Thus, the writing is viewed as a total work in which the wholeis something more than the sum of the parts. A reader reads a writingsample once, forms an impression of its overall quality, and assigns ita numerical rating based on his/her judgment of how well the paper meetsa particular set of established criteria. A four-point scale reflectingthe following performance levels is used to score CLAST essays.
Score of 4: Writer purposefully and effectively develops a thesis.Writer uses relevant details, including concrete examples,that clearly support generalizations. Paragraphs careful lyfollow an organizational plan and are fully developed andtightly controlled. A wide variety of sentences occurs,indicating that the writer has facility in the use of lan-guage, and diction is distinctive. Appropriate transi-tional words and phrases or other techniques make the essaycoherent. Few errors in syntax, mechanics, and usage oc-cur.
Score of 3: Writer develops a thesis but may occasionally lose sightof purpose. Writer uses some relevant and specific detailsthat adequately support generalizations. Paragraphs gener-ally follow an organizational plan and are usually unifiedand developed. Sentences are often varied, and diction isusually appropriate. Some transitions are used, and partsare usually related to each other in an orderly manner.
27
28
Syntactical, mechlnical, and usage errors may occur butusually do not affect clarity.
Writer may state a thesis, but the essay shows little, ifany, sense of purpose. Writer uses a limited number ofdetails, but they often do not support generalizations.Paragraphs may relate to the thesis but often will bevague, underdeveloped, or both. Sentences lack varietyand are often illogical, poorly constructed, or both.Diction is pedestrian. Transitions are used infrequently,mechanically, and erratically. Numerous errors may occurin syntax, mechanics, and usage and frequently distractfrom clarity.
Writer's thesis and organization are seldom apparent, but,if present, they are unclear, weak, or both. Writer usesgeneralizations for support, and details, when included,
are usually ineffective. Undeveloped, ineffective para-graphs do not support the thesis. Sentences are usuallyillogical, poorly constructed, or both. They usually con-sist of a series of subjects and verbs with an occasionalcomplement. Diction is simplistic and frequently not idio-
matic. Transitions and coherence devices, when discern-ible, are usually inappropriate. Syntactical, mechanical,and usage errors abound and impede communication.
Holistic Scoring
The holistic scoring session must be conducted in a highly organized man-ner with competent staff members who have clearly specified responsibili-ties. For ten thousand essays, the holistic scoring staff consists of achief reader, three assistant chief readers, twenty table leaders, and one
hundred readers. A support staff of a manager and five clerks is alsorequired.
The scoring procedure follows this pattern. Prior to the scoring ses-sion, the chief reader and assistants sample the total group of essays tochoose from each of the two topics examples which clearly represent theestablished standards for each of the four ratings on the rating scale.These essays are known as range finders. In addition, other essays arechosen as training materials during the scoring sessions.
After range finders and samples are selected, table leaders meet with thechief and assistant chief readers to score the samples and determine ifthe samples clearly represent the four levels of the scale. The purposeof this session is to refine the sample selection and to ensure consensusamong table leaders. Range finders from previous administrations are alsoreviewed and used in the training to ensure consistency in scoring fromone administration to another.
Immediately prior to and intermittently throughout the scoring session,the chief reader trains the readers using the range finders and othersamples. Immediately after the initial training session, scoring begins.Each essay is read by two readers who assign it a rating of one, two,
28
three, or four. The sum of the ratings is the total score assigned to the
essay. A total of four or above is passing.
When the total score is three, the essay is read by a third reader called
a referee. The referee's rating will match one of the other ratings and
replace the nonmatching one. The new total score is either four, which
is passing, or two, which is not passing; a total score of three is not
reported. When the ratings of two readers of the same essay are not con-
tiguous, the essay is also refereed.
A more complete description of the process is in Procedures for Conduct-
ing Holistic Scoring for the Essay Portion of the College-Level Academic
Skills Test available in the Department of Education office.
.Recruitment of Readers
Each institution that registers students for the CLAST may participate in
the holistic scoring process. The chief reader solicits nominations for
readers from the chairs of English departments in community colleges and
universities. Nominations for readers are made on the basis of the candi-
date's interest in the process, willingness to set aside personal stan-
dards for judging the quality of writing and to undergo training, and
availability to work over weekends. Candidates must have a minimum of two
years' experience teaching composition, hold at least a master's degree
or equivalent, have a major in English in at least one baccalaureate
degree, and teach composition as part of their assigned responsibilities.
Nominations may include secondary school teachers who teach composition
at the junior or senior year level in high schools and faculty who teach
composition in private postsecondary institutions.
Upon receiving nominations from department chairs, the chief reader and
the Technical Support Contractor ask each nominee interested in becoming
a reader to complete and submit an application form. The forms are used
to determine whether applicants meet the criteria for readers.
Reporting Test Results
The reports outlined below are generated for each administration. In
addition to these reports, institutions may request from the Technical
Support Contractor a computer tape or diskettes containing their students'
data, including item responses. Thus, institutions can generate their own
reports and update files of students' records. A test blueprint giving
item-skill correspondence and a data tape format are also provided to
institutions.
Student Reports
The individual student report (fig. 3) and a score interpretation guide
are mailed to students approximately six weeks after the examination date.
A scaled score is reported for each subtest taken. In the boxes to the
right of the scale score is reported the percentage of items correct in
each broad skill area. Although the pervitages are reported to the stu-
dent, they do not become part of the student's transcript. The percent-
29
3 0
individual Score ReportCOLLEGE-LEVEL ACADEMIC SKILLS TEST
DATE OF EXAM.
S.S. rr
INSTITUTION
Following are your results for the Co liege-Level Academic Skills Test The enclosed interpretation guide nc:p youunderstand your scores The score in the first box below is your essay grade. The three-digit numbers listed first in the threeremaining boxes are your scale scores for each subtest. After each scale score you will find the percent of items you answeredcorrectly for each of the broad skill areas within the subtest. This report is provided for your information. The official record ofyour scores will be kept by your institution on your transcript.
ESSAY
EssayRating
ENGLISH LANGUAGE SKILLS READING
SCALESCORE
WordChoice
SentenceStructure
Grammar,Spelling.Punctuation,Capitalization
MATHEMATICS
SCALE ComprehensionSCORE Literal Critical
SCALESCORE
Arithmetic Algebra Geometry -Measurement
LogicalReasoning
Statistics
Passing scores on CLAST have been esta dished by the State Board of Education as follows:English Language
Essay Skills Reading Mathematics260275285
8/1/84 - 7/31/86 4 265 2608/1/86 - 7/31/89 4 270 2708/1/89-7/31/90 4 295 295
Students are required to meet the standards in effect at the time they first took the lest.
If you have questions about your scores, you should contact:
Fig. 3. Copy of a blank student report form.
3031 BEST COPY AVAILABLE
ages help students determine their relative strengths and weaknesses in
the broad skill areas represented on the test.
Preliminary Reports prepared at the state and institutional levels
1. Summary statistics (means, medians, and standard deviations) and fre-
quency distributions of scores by
a. Student classificationCommunity college A.A. programCommunity college A.S. programUniversity native studentUniversity transfer student
b. Racial/ethnic classification:White/non-HispanicBlack/non-HispanicHispanicAmerican Indian/Alaskan nativeAsian/Pacific IslanderNon- Resident Alien
c. Gender by racial/ethnic classification
2. Alphabetic roster of examinees' scores
Final Reports prepared at the state and institutional levels
1. Means and percents of first-time examinees meeting current standards
for
a. students with 60 or more hours
b. students with fewer than 60 hours
c. state university native students
d state university transfer students
e. students by gender and racial ethnic category for each insti-
tution, all public institutions, all private institutions, all
community colleges, and all state universities
2. Means and percents of first-time examinees meeting future standards by
gender and racial ethnic category for each institution, all public
institutions, and all private institutions
3. Means and percents of retake examinees meeting required standards by
gender and racial ethnic category for each institution, all public
institutions, and all private institutions
Statistical Reportsprepared at the state level only
1. Rasch item calibrations and fit statistics
2. Scaled score derivations3. Classical item analysis by racial/ethnic classification
4. Item difficulty plots by gender and racial/ethnic classification
5. KR-20 coefficients and SEM's for multiple-choice subtests
6. Interrater reliability for essay scores
31
3 ''
7. Coefficie t alpha by gender and racial/ethnic classification for essayscores
Interpreting and Using Scores
CLAST scores are reported to indicate students' achievement of thoseskills upon which the test is based. The CLAST scaled scores, not theraw scores, for each subtest are used for this purpose since the scaled
scores have been adjusted for differences in difficulty in test forms.A scaled score of 300, for instance, represents the same achievement levelacross forms but may require a higher raw score on an easier form than on
a harder one. The same scaled score, then, represents the same level ofachievement of the skills regardless of the test form taken.
The use of CLAST scores is prescribed by Florida Statutes and Rules ofthe SSE. Use of scores prior to August 1, 1984, was limited to student
advising and curriculum improvement. Since August 1, 1984, students inpublic institutions in Florida are required to have CLAST scores whichsatisfy the standards set forth in Rule 6A-10.0312, FAC, for the award ofan associate in arts degree and for the admission to upper division statusin a state university in Florida. However, students who have satisfiedCLAST standards on three of the four subtests and who are otherwise eli-gible may be enrolled in state universities for up to an additionalthirty-six semester credits of upper division course work before they arerequired to pass the fourth subtest.
Standards (passing scores) for the CLAST have been adopted by the SHE inRule 6A-10.0312(1), FAC. The standards for each designated period of timeare indicated in Chapter II.
The CLAST was not developed to predict success in upper division programs,but to assess the level of achievement of the skills listed in AppendixA. Any use of the scores for selection of students for specific upperdivision programs must be empirically validated.
32
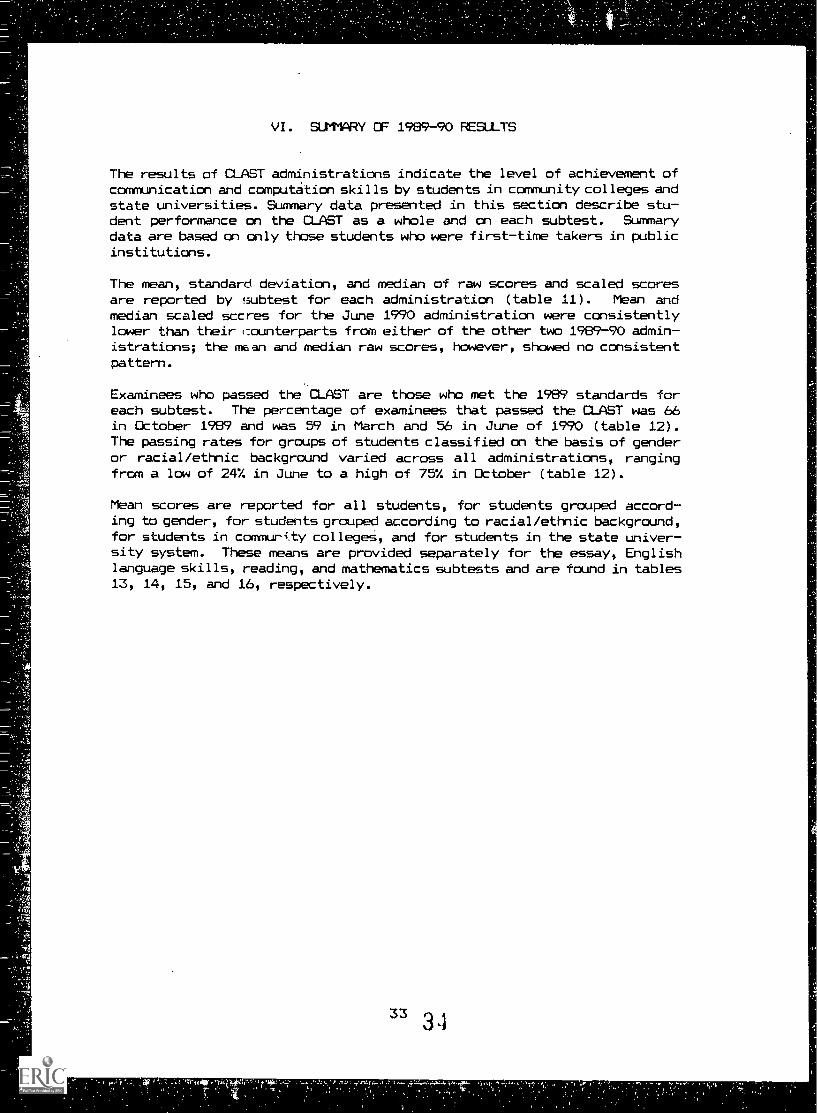
VI. SUMMARY OF 1989-90 RESULTS
The results of CLAST administrations indicate the level of achievement ofcommunication and computation skills by students in community colleges andstate universities. Summary data presented in this section describe stu-dent performance on the CLAST as a whole and on each subtest. Summarydata are based on only those students who were first-time takers in publicinstitutions.
The mean, standard deviation, and median of raw scores and scaled scoresare reported by f.iubtest for each administration (table 11). Mean andmedian scaled scores for the June 1990 administration were consistentlylower than their counterparts from either of the other two 1989-90 admin-istrations; the mean and median raw scores, however, showed no consistentpattern.
Examinees who passed the CLAST are those who met the 1989 standards foreach subtest. The percentage of examinees that passed the CLAST was 66in October 1989 and was 59 in March and 56 in June of 1990 (table 12).The passing rates for groups of students classified on the basis of genderor racial/ethnic background varied across all administrations, rangingfrom a low of 24% in June to a high of 75% in October (table 12).
Mean scores are reported for all students, for students grouped accord-ing to gender, for students grouped according to racial/ethnic background,for students in commuri.ty collegeS, and for students in the state univer-sity system. These means are provided separately for the essay, Englishlanguage skills, reading, and mathematics subtests and are found in tables13, 14, 15, and 16, respectively.
33 3 4
,kri446.
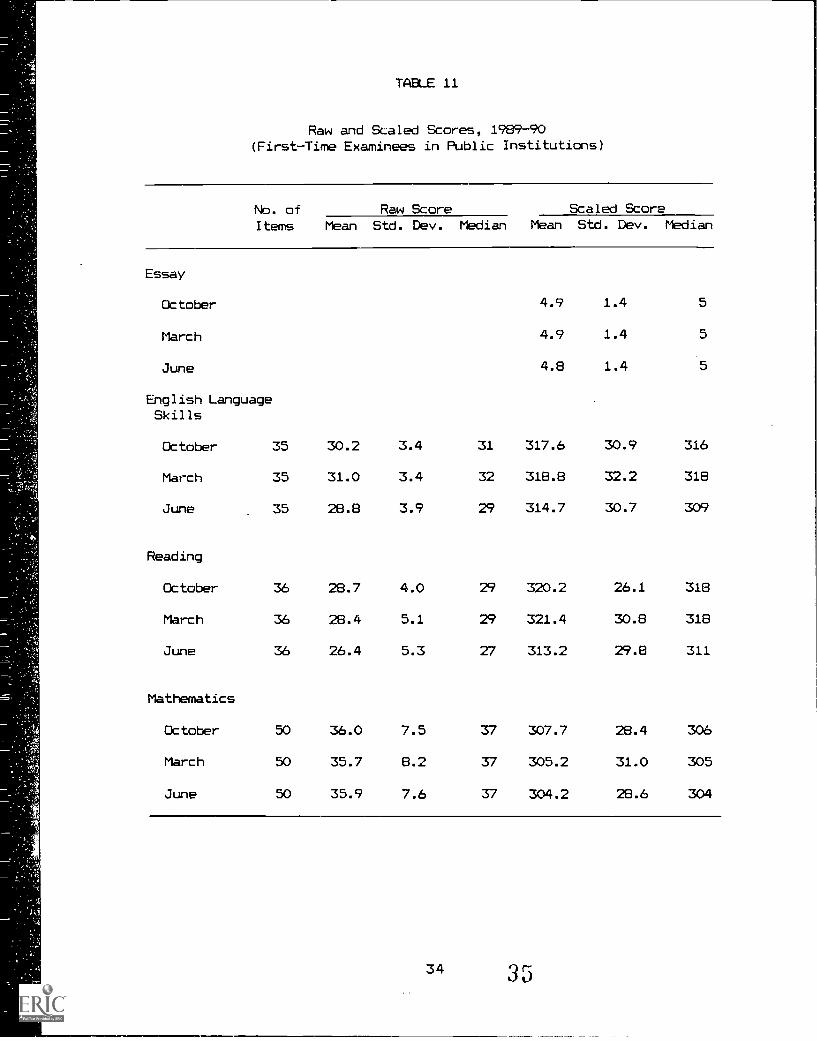
TABLE 11
Raw and Scaled Scores, 1989-90(First-Time Examinees in Public Institutions)
No. ofItems
Raw Score Scaled ScoreMean Std. Dev. Median Mean Std. Dev. Median
Essay
October 4.9 1.4 5
March 4.9 1.4 5
June 4.8 1.4
English LanguageSkills
October 35 30.2 3.4 31 317.6 30.9 316
March 35 31.0 3.4 32 318.8 32.2 318
June 35 28.8 3.9 29 314.7 30.7 309
Reading
October 36 28.7 4.0 29 320.2 26.1 318
March 36 28.4 5.1 29 321.4 30.8 318
June 36 26.4 5.3 27 313.2 29.8 311
Mathematics
October 50 36.0 7.5 37 307.7 28.4 306
March 50 35.7 8.2 37 305.2 31.0 305
June 50 35.9 7.6 37 304.2 28.6 304
34 35
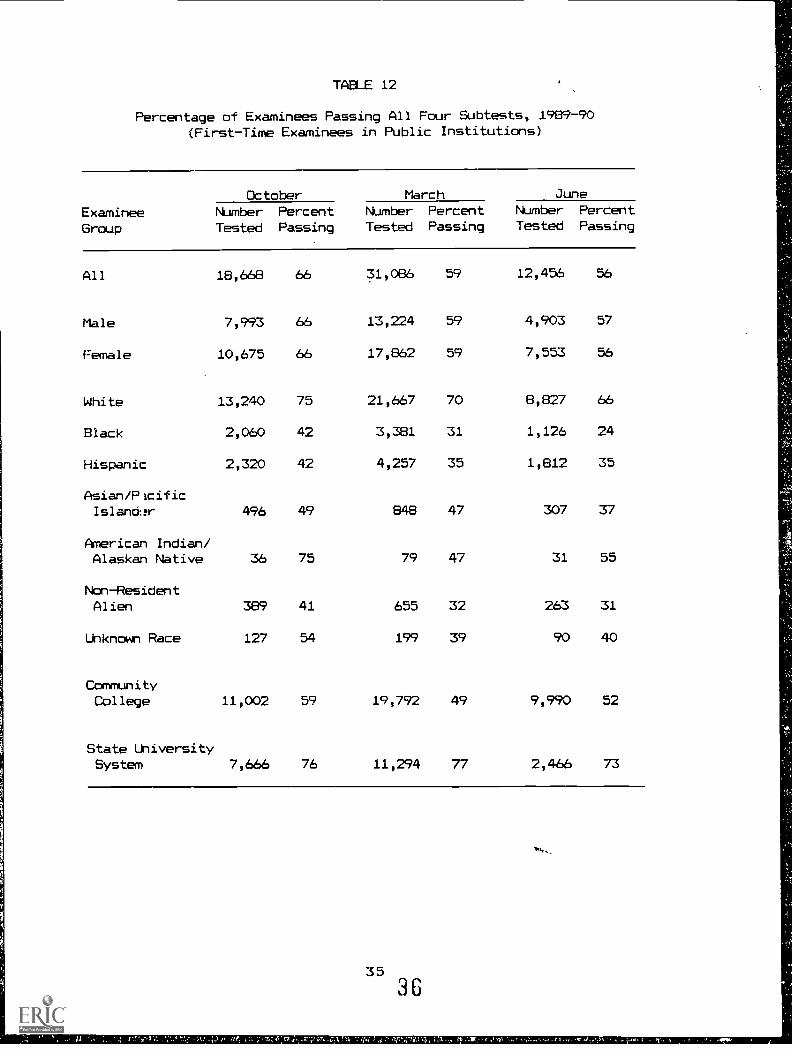
TABLE 12
Percentage of Examinees Passing All Four Subtests, 1989-90(First-Time Examinees in Public Institutions)
ExamineeGroup
October March June
NumberTested
PercentPassing
NUmberTested
PercentPassing
NumberTested
PercentPassing
All 18,668 66 31,086 59 12,456 56
Male 7,993 66 13,224 59 4,903 57
Female 10,675 66 17,862 59 7,553 56
White 13,240 75 21,667 70 8,827 66
Black 2,060 42 3,381 31 1,126 24
Hispanic 2,320 42 4,257 35 1,812 35
Asian/PicificIsland:N.- 496 49 848 47 307 37
American Indian/Alaskan Native 36 75 79 47 31 55
Non- Resident
Alien 389 41 655 32 263 31
Unknown Race 127 54 199 39 90 40
CommunityCollege 11,002 59 19,792 49 9,990 52
State UniversitySystem 7,666 76 11,294 77 2,466 73
35
7,f, 0', .; ."
TABLE 13
Essay Mean Scaled Scores, 1989-90(First-Time Examinees in Public Institutions)
ExamineeGroup
October March June
Number Mean Number Mean Number Mean
All 18,723 4.9 31,180 4.9 12,495 4.8
Male 8,025 4.7 13,262 4.8 4,922 4.6
Female 10,698 5.0 17,918 5.1 7,573 4.9
White 13,276 5.2 21,724 5.2 8,848 5.1
Black 2,064 4.3 3,399 4.3 1,130 4.1
Hispanic 2,327 4.3 4,273 4.2 1,824 4.2
Asian/PacificIslander 499 4.1 849 4.3 309 4.1
American Indian/Alaskan Native 37 5.1 79 4.9 31 4.8
Non--Resident Alien 393 3.9 657 4.0 263 4.0
Unknown Race 127 4.6 199 4.4 90 4.3
Community College 11,032 4.7 19,854 4.7 10,021 4.7
State UniversitySystem 7,691 5.2 11,326 5.4 2,474 5.2
36 37
TABLE 14
English Language Skills Mean Scaled Scores, 1989-90
(First-Time Examinees in Public Institutions)
ExamineeGroup
October March June
Number Mean Number Mean Number Mean
All 18,752 318 31,207 319 12,520 315
Male 8,039 314 13,282 315 4,931 310
Female 10,713 321 17,925 321 7,589 317
White 13,293 323 21,/3/ 325 8,851 321
Black 2,068 303 3,405 304 1,137 296
Hispanic 2,336 303 4,281 303 1,834 299
Asian/Pacific Islander 499 308 348 310 310 308
American Indian/Alaskan Native 36 319 79 311 31 310
Non-Resident Alien 393 299 657 302 265 302
Unknown Race 127 310 200 303 92 302
Community College 11,047 313 19,878 313 10,043 312
State UniversitySystem 7,705 325 11,329 329 2,477 324
37 38
TABLE 15
Reading Mean Scaled Scores, 1989-90(First-Time Examinees in Public Institutions)
ExamineeGroup
October March June
!Amber Mean Number Mean Number Mean
All 18,754 320 31,209 321 12,518 313
Male 8,040 321 13,281 322 4,931 315
Female 10,714 319 17,928 .321 7,587 312
White 13,293 325 21,/6/ 329 8,849 320
Black 2,069 304 3,406 302 1,139 292
Hispanic 2,336 308 4;281 305 1,833 299
Asian/Pacific Islander 500 309 848 311 309 298
American Indian/Alaskan Native 36 328 79 320 31 311
Non-Resident Alien 393 302 657 301 265 299
Unknown Race 127 315 201 307 92 301
Community College 11,050 316 19,879 315 10,040 311
State UniversitySystem 7,704 326 11,330 332 2,478 323
38 39
Mathematics Mean Scaled Scores, 1989-90
(First-Time Examinees in Public Institrtions)
ExamineeGroup
October March June
Number Mean Number ;lean Number Mean
All 18,750 308 31,163 305 12,520 304
Male 8,031 312 13,265 311 4,929 311
Female 10,719 304 17,898 301 7,591 300
White 13,288 312 21,707 312 8,854 309
Slack 2,071 293 3,391 285 1,143 283
Hispanic 2,63/ 295 4,279 288 1,826 294
Asian/Pacific Islander 499 313 848 311 509 311
American Indian/Alaskan Native 36 314 79 299 31 299
Non-Resident Alien 391 304 658 300 265 304
Unknown Race 128 302 201 291 92 296
Community College 11,047 303 19,842 298 10,038 302
State UniversitySystem 7,703 315 11,321 317 2,482 314
39
40
BIBLIOGRAPHY
American Psychological Association. Standards for Educational and Psycho-
logical Testing. American Psychological Association: Washington, DC,
1985.
Brennan, R. L. and Kane, M. T. An index of dependability for mastery
tests. Journal of Educational Measurement. 1977, 14, 277-298.
Florida Department of Education. CLAST Test Administration Manual for
Institutional Test Administrators, 1986-87.
Florida Department
Florida Department
Florida Department
of Education.
of Education.
of Education.
CLAST Test Administration Plan, 1986-87.
CLAST Technical Reports 1982-83.
CLAST Technical Report, 1983-84.
Florida Department of Education. Procedures for Conducting Holistic Scor-
ing for the Essay Portion of the College-Level Academic Skills Test.
1980.
Florida Department of Education. Test Search and Screen for College-
Level Communication and Computation Skills. 1981.
Florida Department of Education. Test Retest Study of the Reliability of
the College-Level Academic Skills Test. 1984.
Hambleton, R. K., and Novick, M. R. Toward an integration of theory and
method for criterion-referenced tests. Journal of Educational Measure-
ment, 1973, 10, 159-70.
Rasch, G. Probabilistic Models for Some Intelli ence and Attainment
Tests. 1960. Reprint. University of Chicago Press, 1980.
Ryan, J. ABIL-EST. (Personal communication with J. Ryan of the Univer-
sity of South Carolina, 1981).
Ryan, J. Equating New Test Forms to an Existing Test. Paper at the An-
nual Meeting of the National Council of Measurement in Education, Los
Angeles, 1981.
Stanley, J. C. Reliability. In R. L. Thorndike (Ed.), Educational Mea-
surement (2nd. ed.) Washington, DC: American Council on Education,
1971, 356-482.
Wright, B. D., Mead, R. J., and Bell, S. R. BICAL: Calibrating Items With
the Rasch Model. Research Memorandum No. 23C, Statistical Laborato,
ry, pepartmearbf Education, University of Chicago, 1980.
41
41BEST COPY AVAILABLE
APPENDIX ACLASP Skills Tested, 1989-90
Essay
Select a topic which lends itself to development.Determine the purpose and the audience for writing.Limit the subject to a topic which can be developed within the require-
ments of time, purpose, and audience.Formulate a thesis or main idea statement which reflects the purpose and
the focus.Develop the thesis by:
Providing adequate support which reflects the ability to distinguishbetween generalized and concrete evidence,
Arranging the ideas and supporting details in an organizational pat-tern appropriate to the purpose and focus,
Writing unified prose in which all supporting material is relevant tothe thesis or main idea statement, and
Writing coherent prose, providing effective transitional devices whichclearly reflect the organizational pattern and the relationshipsof the parts.
Avoid inappropriate use of slang, jargon, cliches, and pretentious ex-pressions.
Use a variety of sentence patterns.Avoid unnecessary use of passive construction.Maintain a consistent point of view.Revise, edit, and proofread units of discourse to assure clarity, con-
sistency, and conformity to the conventions of standard AmericanEnglish.
English Language Skills
Word Choice
Use words which convey the denotative and connotative meanings requiredby context.
Avoid wordiness.
Sentence Structure
Place modifiers correctly.Coordinate and subordinate sentence elements according to their relative
importance.Use parallel expressions for parallel ideas.Avoid fragments, comma splices, and fused sentences.
Grammar, Spelling, Capitalization, and Punctuation
Use standard verb forms.Maintain agreement between subject and verb, pronounUse proper case forms.Use adjectives and adverbts correctly.Use standard practice for spelling, punctuation, and
43
42
and antecedent.
capitalization.
Reading
Literal Comprehension
Recognize main ideas.Identify supporting details.Determine the meanings of words on the basis of context.
Critical Comprehension
Recognize the author's purpose.Identify author's overall organizational pattern.Distinguish between statement of fact and statement of opinion.
Detect bias.Recognize author's tone.Recognize explicit and implicit relationships within sentences.Recognize explicit and implicit relationships between sentences.Recognize valid arguments.Draw logical inferences and conclusions.
Mathematics
Arithmetic
Add and subtract rational numbers.Multiply and divide rational numbers.Add and subtract rational numbers in decimal form.Multiply and divide rational numbers in decimal form.Calculate percent increase and percent decrease.Recognize the meaning of exponents.Recognize the role of the base number in determining place value in the
base-ten numeration system and in systems that are patterned after it.Identify equivalent forms of positive rational numbers involving decimals,
percents, and fractions.Determine the order-relation between magnitudes.Identify a reasonable estimate of sum, average, or product of numbers.Infer relations between numbers in general by examining particular number
pairs.Select applicable properties for performing arithmetic calculations.Solve real-world problems which do not require the use of variables and
which do not involve percent.Solve real-world problems which do not require the use of variables and
which do require the use of percent.Solve problems that involve the structure and logic of arithmetic.
Algebra
Add and subtract real numbers.Multiply and divide real numbers.Apply the order-of-operations agreement to computations involving numbers
and variables.Use scientific notation in calculations involving very large or very small
measurements.
4344
Solve linear equations and inequalities.
Use given formulas to compute results when geometric measurements are not
invol'.ed.
Find particular values of a function.
Factor a quadratic expression.
Find the roots of a quadratic equation.
Recognize and use properties of operations.
Determine whether a particular number is among the solutions of a given
equation or inequality.
Recognize statements and conditions ofproportionality and variation.
Recognize regions of the coordinate plane which correspond to specific
conditions.Infer simple relations among variables.
Select applicable properties for solving equations and inequalities.
Solve real-world problemsinvolving the use of variables, aside from com-
monly used geometric formulas.
Solve problems that involve the structure and logic of algebra.
Geometry and Measurement
Round measurements to the nearest given unit of the measuring device.
Calculate distances, areas, and volumes.
Identify relationships between angle measures.
Classify simple plane figures by recognizing their properties.
Recognize similar triangles and their properties.
Identify appropriate types of measurement of geometric objects.
Infer formulas for measuring geometric figures.
Select applicable formulas for computing measures of geometric figures.
Solve real-world problems involving perimeters, areas, and volumes of
geometric figures.Solve real -world problems involving the Pythagorean property.
Logical Reasoning
Deduce facts of set-inclusion or set non-inclusion from a diagram.
Identify simple and compound statements and their negations.
Determine equivalence or nonequivalence of statements.
Draw logical conclusions from data.
Recognize that an argument may not be valid even though its conclusion is
true.Distinguish fallacious arguments from nonfallacious ones.
Infer valid reasoning patterns and express them with variables.
Select applicable rules for transforming statements without affecting
their meaning.Draw logical conclusions when facts warrant them.
Statistics, Including Probability
Identify information contained in bar, line, and circle graphs.
Determine the mean, median, and mode of a set of numbers.
Count subsets of a given set.
Recognize the normal curve and its properties.
Recognize properties andinterrelationships among the mean, median, and
mode in a variety of distributions.
45
4 ,1 BEST COPY AVAILABLE
Choose the most appropriate procedures for selecting an unbiased samplefrom a target population.
Identify the probability of a specific outcome in an experiment.Infer relations and make accurate predictions from studying particular
cases.Solve real-world problems involving the normal curve.Solve real-world problems involving probabilities.
46
4'
APPENDIX BCollege-Level Academic Skills Project (CLASP)and State-Level Task Force Members, 1989-90
Project DirectorLinda Lou Cleveland, Chipola Junior College
Project StaffJune Siemon, Department of EducationChristy Meeks, Department of Education
Technical Support Contractor (TSC)Jeaninne N. Webb, Director
Office of Instructional Resources, University of Florida
Standing Committee on Student AchievementRobert Stakenas, Chairperson, Florida State UniversityDavid Alfonso, Palm Beach Community CollegeLinda Adair, Gulf Coast Community CollegeR. Scott Baldwin, University of MiamiRichard Barnette, Florida Southern CollegeJane Chaney, Brevard County SchoolsElizabeth Cobb, Florida Community College at JacksonvilleRuth Handley, Superintendent of Highlands County SchoolsE. Garth Jenkins, Stetson UniversityLola Kerlin, Florida Atlantic UniversityRobin Largue, Pine Forest High SchoolJohn Losak, Miami-Dade Community CollegeLevester Tubbs, University of Central Florida
COMMUNICATION TASK FORCE MEMBERS
Elizabeth Metzger, Chairperson, University of South FloridaWilhelmina Boysen, J. M. Tate High SchoolJoanna Cocchiarella, Satellite High SchoolRobert Fitzgerald, South Florida Community CollegeAnn Higgins, Gulf Coast Community CollegeJerre Kennedy, Brevard Community CollegeGladys Lang, Florida A & M UniversityRichard Levine, Broward Community CollegeJose Marques, Florida International UniversityBeth Novinger, Tallahassee Community CollegeAlina Rodriguez, Miami Edison High SchoolRoy Singleton, University of North FloridaPhillip Taylor, University of Central FloridaDonald Tighe, Valencia Community College
47
46
MATHEMATICS TASK FORCE MEMBERS
Charles Goodall, Chairperson, Florida CollegeLinda Lou Cleveland, Chipola Junior CollegeMichael Flanagan, Columbia High SchoolCorinne Garrett, Riverview High SchoolGeorge Green, Flagler CollegeCharlene Kincaid, Gulf Breeze High SchoolLeonard Lipkin, University of North FloridaAlan Mabe, Florida State UniversityCharles Nelson, University of FloridaTheodore Nicholson, Bethune-Cookman CollegeRay Phillips, University of South FloridaRobert Sharpton, Miami-Dade Community CollegeKaren Walsh, Broward Community College
48 47
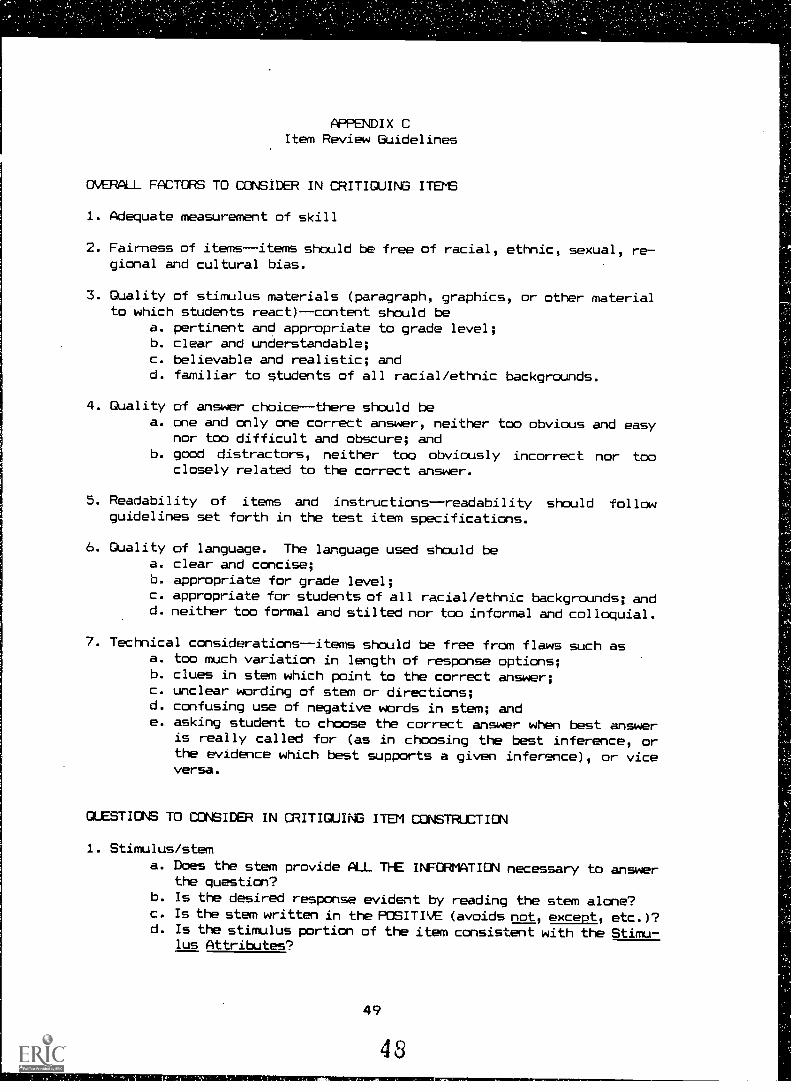
APPENDIX CItem Review Guidelines
OVERALL FACTORS TO CONSIDER IN CRITIQUING ITEMS
1. Adequate measurement of skill
2. Fairness of items items should be free of racial, ethnic, sexual, re-gional and cultural bias.
3. Quality of stimulus materials (paragraph, graphics, or other materialto which students react) content should be
a. pertinent and appropriate to grade level;b. clear and understandable;c. believable and realistic; andd. familiar to students of all racial/ethnic backgrounds.
4. Quality of answer choice--there should bea. one and only one correct answer, neither too obvious and easy
nor too difficult and obscure; andb. good distractors, neither too obviously incorrect nor too
closely related to the correct answer.
5. Readability of items and instructions readability should followguidelines set forth in the test item specifications.
6. Quality of language. The language used should bea. clear and concise;b. appropriate for grade level;c. appropriate for students of all racial/ethnic backgrounds; andd. neither too formal and stilted nor too informal and colloquial.
7. Technical considerations items should be free from flaws such asa. too much variation in length of response options;b. clues in stem which point to the correct answer;c. unclear wording of stem or directions;d. confusing use of negative words in stem; ande. asking student to choose the correct answer when best answer
is really called for (as in choosing the best inference, orthe evidence which best supports a given inference), or viceversa.
QUESTIONS TO CONSIDER IN CRITIQUING ITEM CONSTRUCTION
1. Stimulus/stem
a. Does the stem provide ALL THE INFORMATION necessary to answerthe question?
b. Is the desired response evident by reading the stem alone?c. Is the stem written in the POSITIVE (avoids not, except, etc.)?d. Is the stimulus portion of the item consistent with the Stimu-
lus Attributes?
49
48
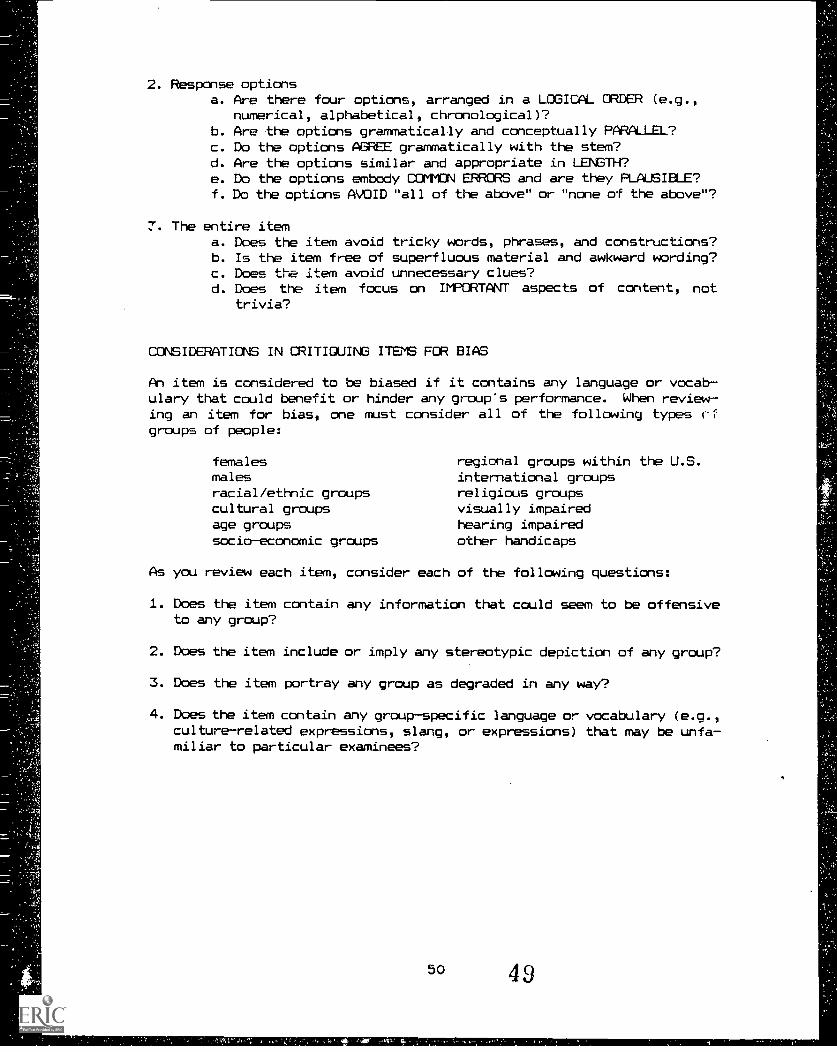
2. Response optionsa. Are there four options, arranged in a LOGICAL ORDER (e.g.,
numerical, alphabetical, chronological)?b. Are the options grammatically and conceptually PARALLEL?c. Do the options AGREE grammatically with the stem?d. Are the options similar and appropriate in LENGTH?e. Do the options embody COMMON ERRORS and are they PLAUSIBLE?f. Do the options AVOID "all of the above" or "none of the above"?
T. The entire itema. Does the item avoid tricky words, phrases, and constructions?b. Is the item free of superfluous material and awkward wording?c. Does the item avoid unnecessary clues?d. Does the item focus on IMPORTANT aspects of content, not
trivia?
CONSIDERATIONS IN CRITIQUING ITEMS FOR BIAS
An item is considered to be biased if it contains any language or vocab-ulary that could benefit or hinder any group's performance. When review-ing an item for bias, one must consider all of the following types cgroups of people:
femalesmalesracial/ethnic groupscultural groupsage groupssocio-economic groups
regional groups within the U.S.international groupsreligious groupsvisually impairedhearing impairedother handicaps
As you review each item, consider each of the following questions:
1. Does the item contain any information that could seem to be offensiveto any group?
2. Does the item include or imply any stereotypic depiction of any group?
3. Does the item portray any group as degraded in any way?
4. Does the item contain any group-specific language or vocabulary (e.g.,culture-related expressions, slang, or expressions) that may be unfa-miliar to particular examinees?
50 4E
APPENDIX DCLAST Item Specifications Review Team
Project DirectorDianne Buhr
Project rtaffSue M. LeggJeaninne Webb
ReadingJerre Kennedy, Chairperson, Brevard Community College
Helen Dayan, Hillsborough Community College
Nancy Smith, Florida Community College
English Language SkillsBeth Novinger, Chairperson, Tallahassee Community College
Charles Croghan, Indian River Community College
Elizabeth Metzger, University of South Florida
Betty Owen, Broward Community CollegeVincent Puma, Flagler College
MathematicsCharles Nelson, Chairperson, University of Florida
Nicholas Belloit, Florida Community CollegeRoy Bolduc, University of FloridaGeorge Coutros, University of FloridaDennis Clayton, Bethune-Cookman CollegeRose Dana, Lake City Community CollegeMichael Flanagan, Lake City Community CollegeLeonard J. Lipkin, University of North FloridaTed Nicholson, Bethune-Cookman College
APPENDIX ECLAST Item Specifications External Review Committee
Project DirectorLinda Lou Cleveland, Chipola Junior College
Project Staff Department of EducationThomas H. Fisher, AdministratorSue EarlyChristy MeeksJune SiemcnDianne Wilkes
Committee MembersCarol Allen, Pasco Hernando Community CollegeFaiz Al-Rubaee, University of North FloridaOsiefield Anderson, Florida A and M UniversityNancy Brannen, Lake City Community CollegeHenri Sue Bynum, Indian River Community CollegeLynn Cade, Pensacola Junior CollegeMaureen Cavallaro, Palm Beach Community CollegeDale Craft, South Florida Community CollegeCathy Denney, St. Johns River Cdomunity CollegeWayne Dickson, Stetson UniversityEunice Everitt, Seminole Community CollegeDiana Fernandez, Hillsborough Community CollegeCarl Gabriel, Florida Keys Community CollegeBarbara Gribble, Gulf Coast Community CollegeDorothy Harris, Okaloosa Walton Community CollegeBertilda Henderson, Broward Community CollegeWilliam Kearney, Flagler CollegeNoel Mawer, Edward Waters CollegeJames Middlebrooks, Edison Community CollegeShirley Myers, Florida Community College at JacksonvilleGeorgia Newman, Polk Community CollegeRon Newman, University of MiamiCary Ser, Miami-Dade Community CollegeBarbara Sloan, Santa Fe Community CollegeKaren Swick, Palm Beach Atlantic CollegeJune White, St. Petersburg Community CollegeNora Woodard, Valencia Community CollegeRaymond F. Woods, Manatee Community College
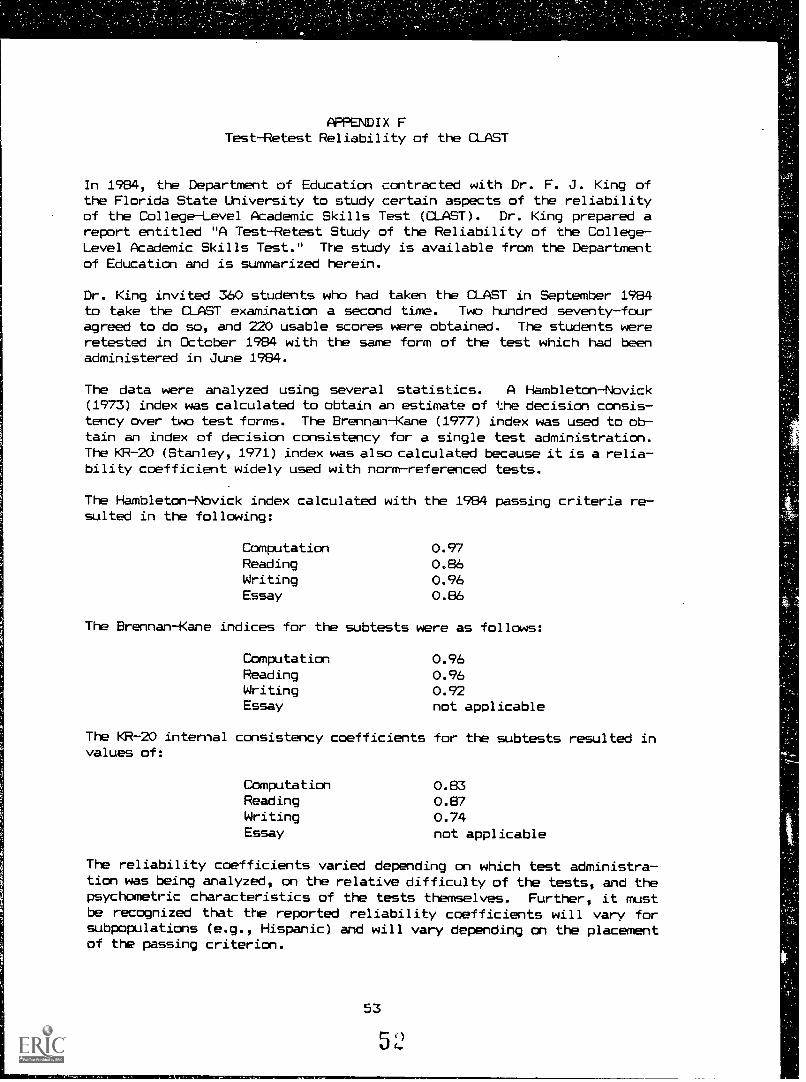
APPENDIX FTest-Retest Reliability of the CLAST
In 1984, the Department of Education contracted with Dr. F. J. King ofthe Florida State University to study certain aspects of the reliabilityof the College-Level Academic Skills Test (CLAST). Dr. King prepared areport entitled "A Test-Retest Study of the Reliability of the College-Level Academic Skills Test." The study is available from the Departmentof Education and is summarized herein.
Dr. King invited 360 students who had taken the CLAST in September 1984to take the CLAST examination a second time. Two hundred seventy-fouragreed to do so, and 220 usable, scores were obtained. The students wereretested in October 1984 with the same form of the test which had beenadministered in June 1984.
The data were analyzed using several statistics. A Hambleton-Novick(1973) index was calculated to obtain an estimate of the decision consis-tency over two test forms. The Brennan-Kane (1977) index was used to ob-tain an index of decision consistency for a single test administration.The KR-20 (Stanley, 1971) index was also calculated because it is a relia-bility coefficient widely used with norm-referenced tests.
The Hambleton-Novick index calculated with the 1984 passing criteria re-sulted in the following:
Computation 0.97Reading 0.86Writing 0.96Essay 0.86
The Brennan-Kane indices for the subtests were as follows:
Computation 0.96Reading 0.96Writing 0.92Essay not applicable
The KR-20 internal consistency coefficients for the subtests resulted invalues of:
Computation 0.83Reading 0.87Writing 0.74Essay not applicable
The reliability coefficients varied depending on which test administra-tion was being analyzed, on the relative difficulty of the tests, and thepsychometric characteristics of the tests themselves. Further, it mustbe recognized that the reported reliability coefficients will vary forsubpopulations (e.g., Hispanic) and will vary depending an the placementof the passing criterion.
53
5 ''
Store d FloralDowager* of lorg
Talaloome. Parkalady Caw, CowerarkerrafAllfrawatMe agtionlimusl avponurilly empioper
124-022291-500-CM-1
53BEST COPY AVAILABLE