Embed Size (px)
Citation preview

AD-A268 667fIlElJ IIIJIE llil 1111 ll11111
IMPROVED METHODOLOGY FOR SIZING OF NAVAL ELECTRICALPOWER PLANTS
by
JAMES JEFFREY McGLOTIHN
Submitted to the Department of Ocean Engineeiingon April 15, 1993, in partial fulfillment of the requirementsfor the Degrees of Naval Engineer and Master of Science
in Electrical Engineering and Computer Science.
Abstract
Electrical power plants onboard ships of the United States Navy have traditionallybeen sized according to empirical methods. These methods have resulted in satisfactoryplants but have not been updated to reflect recent improvements in equipment and analysismethods. Developing technologies under consideration for future ships, particularlyintegrated electric propulsion with propulsion derived ships service electrical power, willbring significantly diflerent demands f6r electrical power. There is very httle recent designexpeine to fall back on when designing.a ship employing such technologies. In ,
dition, current fiscal restraints demandtt excess equipment and capacity be severelyrestricted in order to minimize procurement costs, .mang, and maintenance costs. Amethodology is proposed to eyaluate cndi'date elec..c plant configurations (i.e. numberand sizes.,, ogeneratm units) interms of-the probability that the required loads can besuppied. The alternatives can ten be compared in terms of cost, weight, number of units,and total installed capacity to determine which is most cost effective. The methodologyhas been coded into a program which can be used to easily do the system comparisons.Several shipboard systems are analyzed to demonstrate the usefulness of the program.
DTICE.LECTE
AUG 30. 199311
Theis Advisor: Dr. James L. Kirtley, Jr.Thle: Professor of Electrical Engineering and Computer Science
2 93-1868293 8 27 O00 IhIl~lill0

IMPROVED METHODOLOGY FOR SIZING OF NAVALELECTRICAL POWER PLANTS
byJAMES JEFFREY McGLOTHIN
B.S. Electrical Engineering, University of Tenmessee(1982)
Submitted to the Department ofOCEAN ENGINEERING
and the Department ofELECTRICAL ENGINEERING AND COMPUTER SCIENCE
in Partial Fulfillment of theRequirements for the Degrees of
NAVAL ENGINEER
andMASTER OF SCIENCE IN ELECTRICAL ENGINEERING
AND COMPUTER SCIENCEat the
MASSACHUSETTS INSTITUTE OF TECHNOLOGYMAY 1993
C James Jeffrey McGlothin 1993"Mhe author hereby grants to the U.S. Government and the Massachusetts Institute of Technology permission to reproduce and todistribute publicly copies of this thesis document in whole or in part.
Signature of AuthorDepartment of Ocean Engineering
Certified by ____.__.9
Professor James L. Kirtley, Jr.Department of Electrical Engineering and Computer Science
Thesis SupervisorCertified by - )e•- • , _ 4,•
Pro* - or A. Douglas CarmichaelD1 6.D -aime& of Ocean Engineering
-' __Thesis Reader
Certified byISProfessor Campbell L. earle
S( -. Departmental Graduate Committee
Department of'Electrical Engineering and Computer Science
Accepted by V4, ( C t (12-ý. (
-, --- , or A. Douglas CarmichaelDepartmental Graduate CommitteeDepartment of Ocean Engineering
S . . . . .. . . . . .. .. . .. .. .. . . . . . . . . .. . .. .. .. .. .. .. ... .. .. .. .. .. .. . .. .. .. .. .. . . .

IMPROVED METHODOLOGY FOR SIZING OF NAVAL ELECTRICALPOWER PLANTS
by
JAMES JEFFREY McGLOTHIN
Submitted to the Department of Ocean Engineeringon April 15, 1993, in partial fulfillment of the requirementsfor the Degrees of Naval Engineer and Master of Science
in Ele6trical Engineering and Computer Science.
Abstract
Electrical power plants onboard ships of the United States Navy have traditionallybeen sized according to etnpirical methods. These methods have resulted in satisfactoryplants but have not been u pdted to reflect recent i, provements m euipment and analyismethods. Developing technologies under consideration for future ships, particularlyintegrated electric pro pulsion with propulsion derived ships service electrical power, willbring significantly difaerent demands for electrical power. There is very little recent designe ence to fall back on when designing a ship employin such tehnolopes. Inaddition,.current, fiscal restraints deand-that excess equipment and capacity be severelyrestricted in order to minimize procurement costs, maig, and maintenance costs. Amethodology is proposed to evaluate candidate electric plat configurations (i.e. numberand sizes of generatinm units) in terms of the probability that the required loads can besupplied WThe alternatives can then be compared in terms of cost, weigt, number of units,andato;ta installed capacity to determine which is most cost effective. The methodologyhas been coded into a program which can be used to easily do the system comparisons.Several shipboard systems are analyzed to demonstrate the usefulness of the program.
Thesis Advisor: Dr. James L. Kirtey, Jr.itde: Profesor of Electrical Engineering and Computer Science
2

Acknowledgments
It would be impossible for me to thank everyone I would like to thank on thispage. However, I will thank those I can without becoming too wordy, sentimental, orboring:
To the United States Navy, for giving me the opportunity to continue myeducation in a manner in which I certainly could not afford otherwise.
To Professors Kirtley and Carmichael, for allowing me to pursue a topic in whichI was interested, for the help and guidance when it was necessary and the free rein whenit wasn't.
To Captains Brooks and Brown and Commander Celotto, for reminding me onoccasion that I am first and foremost a Naval Officer and should conduct all my affairs,including academic, as such.
To my mother and sister, who have shown me by example the true meaning ofcourage and persistence, and how to keep ones sense of humor in the worst of times.You are the bravest people I know.
To Ivy, Millie, and Curt, for their dedication to education, their unswervingloyalty and love, and their outstanding examples of how to live.
To Pop & Katie, for sticking together all these years. Happy 66th, and I hope theweather never breaks!
To my in-laws, Allen, Carole and Steve, who haven't been in-laws at all.To Brenton, for your unconditional love and the periodic bursts ofjoy that always
accompany your visits. Here's hoping you're as lucky in life as your Uncle JF, who lovesyou very much.
To those who have gone, Dad, Glen and Gracie, who counsel without speaking,listen without hearing, and guide without touching. I miss you.
To my wife Suzanne, for pestering, pushing and phoning; typing, touching andtugging; caring, cleaning and crying; shopping, sharing and shoveling; loving, living, andleaving me alone when I had to be; and being bored and lonely too much of the time. Icouldn't have done it without you!
Most of all, to God, for through Him, &il things are possible.
"Apply your heart to instruction and your ears to words of knowledge (Proverbs23:12)."
AQ08881on Fror 'NTIS O4uRAI
DTIC TAB 0UnWamotuoed 0Justin Inn
DIC QQUALIW IIp() 'I
3uAv abilolity #*a-
Dist Speoiala3..

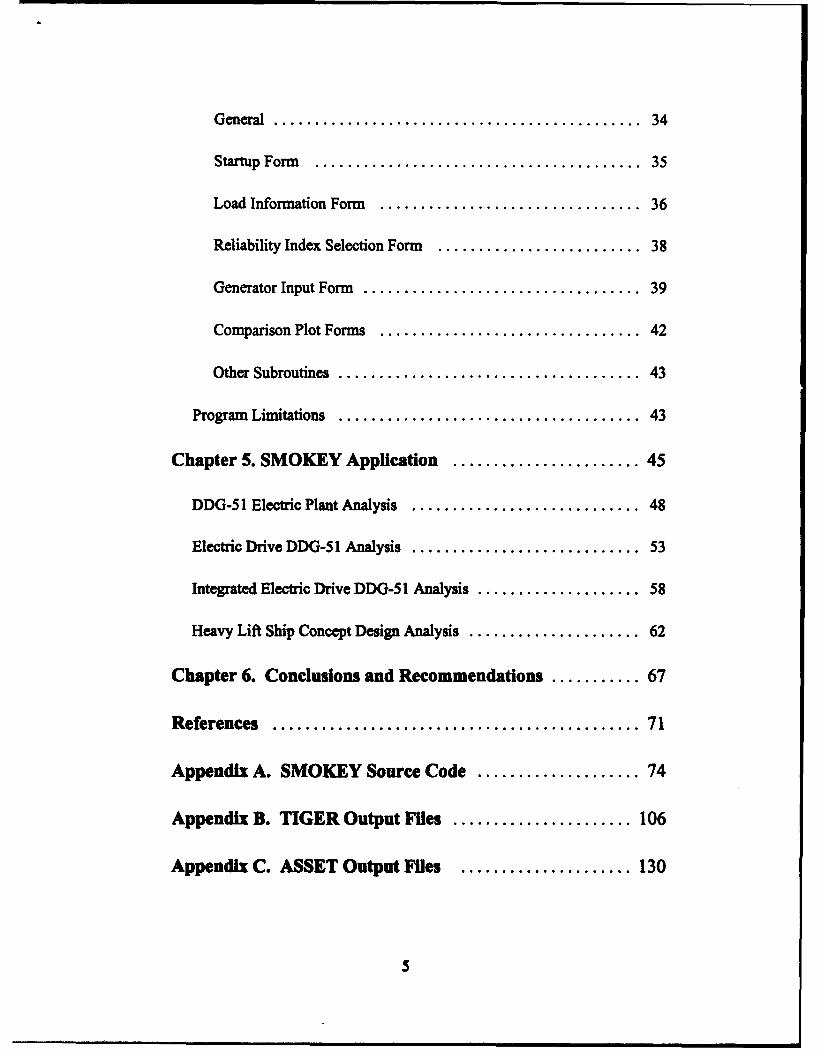
Table of Contents
Chapter 1. Introduction ................................. 7
Objective .............................................. 8
Background ............................................. 8
Existing Analysis Tools ................................... 10
Program Development .................................... 14
Chapter 2. Electric System Sizing Concepts .............. 16
Reliability Concepts ...................................... 16
Utility Company Sizing Methods ............................ 18
Naval Ship Electric Load Estimation ......................... 19
Chapter 3. SMOKEY Development ..................... 23
Philosophy ............................................. 23
M ethodology ........................................... 27
Validation ............................................. 30
.-Chapter 4. SMOKEY Program Operation ............... 32
! . Installation ............................................. 32
S• -UiingSMOKEY .............................. 33
Subroutine Description ................................... 34
4I'e
G eneral ............................................. 34
Startup Form ........................................ 35
Load Information Form ................................ 36
Reliability Index Selection Form ......................... 38
Generator Input Form .................................. 39
Comparison Plot Forms ................................ 42
Other Subroutines ..................................... 43
Program Limitations ..................................... 43
Chapter 5. SMOKEY Application ....................... 45
DDG-51 Electric Plant Analysis ............................ 48
Electric Drive DDG-51 Analysis ............................ 53
Integrated Electric Drive DDG-51 Analysis .................... 58
Heavy Lift Ship Concept Design Analysis ..................... 62
Chapter 6. Conclusions and Recommendations ........... 67
References ............................................. 71
Appendix A. SMOKEY Source Code .................... 74
Appendix B. TIGER Output Files ...................... 106
Appendix C. ASSET Output Files ..................... 130
5
Appendix D. HL(X) Ships Service Electric
Load Estim ation ................................... 138
6

Chapter 1. Introduction
Some of the earliest decisions which must be made during the design of a Navy
ship concern the propulsion plant. How many and what type of engines and
transmissions are to be used and how much electrical generation capacity is needed must
be decided early. These decisions have major consequences, for the propulsion plant is
one of the heaviest and most voluminous components of a ship. Secondary effects, such
as the amount of fuel which must be carried and the intake and exhaust volume required,
are substantial. Tools are needed to help a designer evaluate candidate configurations
early in the design process so that unnecessarily large plants are not selected. An
oversize plant causes the entire ship to be larger, and thus more costly, than necessary.
To date, Naval electrical plants have been designed which have operated satisfactorily.
However, the existing design methodology is clearly defined only for ships that do not
have integrated electric propulsion (propulsion power and ships electric power derived
from separate systems). The Navy is currently working toward ships which make use of
integrated electric drive technology (both propulsion power and ships electric power
derived from the same source). However, there is currently no clearly defined
methodology for determining the electrical generating capacity for such a ship. If the
current methodology is used with the propulsion loads simply added in, the result could
be an oversize, unnecessarily expensive plant.
7

Objective
The objective of this thesis is to develop a new method for sizing naval ship
electric plants based on statistical reliability methods. Such a method would replace the
empirical methods currently used, and allow designers to decide on the number and size
of generators based on what would be considered an acceptable reliability level (or,
alternately, an acceptable risk that power demands could not be met). The method would
take into account whether the ship is electric drive and, if so, whether ships service
power is propulsion derived or separately generated.
Background
Major changes are occurring in the nature of electrical systems onboard U.S.
naval ships, both in the nature of the loads present and the generating equipment used.
These changes include (but are not limited to):
"* Power electronics and other solid state devices replacing machinery such as motor
generator sets.
"* Integrated electric drive propulsion (i.e. electrical power for propulsion and
electrical power for other ship functions are derived from the same prime movers).
"* Pulsed power weapons systems.
"* Automated propulsion and ship service electric power system controls.
8

The above will have significant effects on the current ship design process.
Among them:
"* Propulsion shafting runs will be much shorter since the propeller will be driven by
an electric motor rather than a turbine. This will allow much more flexibility in
the locations of the major components of the engineering plant.
"* Increased automation of systems will reduce the necessary manning. This will
reduce the living space required and thereby make more room available for other
functions (or reduce the ship size for the same capability).
"* The demands on the electric power generating and distribution system will be
much more complex.
The last change requires some explanation. Current ship designs have
functionally separate systems for providing propulsion power and electrical power.
While it is true that some electrical power is required for the propulsion plant (e.g. for
electric powered seawater cooling pumps), the above statement is true from a conceptual
standpoint. Electrical power is distributed throughout the ship and used for a variety of
purposes, including combat systems, na-igational systems, and "hotel" loads (cooking,
heating and cooling, lighting, etc.). The demands on the electrical generating and
distribution system are relatively simple. Most major variations in electric power
demands are produced by the state of the combat system (whether or not weapons are
being fired, which sensors are in operation, etc.) and not by the maneuvers (i.e. changes
in speed and direction) of the ship. With the changes noted above come the added
9

demands of providing large amounts of power in short bursts for pulsed power weapons,
as well as significrt variations in electrical power demands with ship maneuvering.
Since many missions require significant maneuvering (search and rescue, submarine
hunting, etc.), the demands on the electrical system become much more complex and
unpredictable.
In addition to the above, current fiscal conditions are forcing changes in ship
design philosophy. No longer is capability the driving force. Cost has become the major
player, and affordability the chief consideration when design decisions are made. This
new design philosophy is forcing designers to reevaluate how much excess capacity
should be installed on ships, since every extra component (or larger or more capable
component) requires more space and weight, as well as more personnel to run, maintain
and repair it. These effects add to the initial cost of the component itself. Therefore, a
concerted effort must be made to minimize excess design margins and excess installed
capacities.
Existing Analysis Tools
Naval electrical power plants differ greatly from the utility power grid [Refs 1, 2,
and 3]. First, once a ship is built, the electric plant is virtually impossible to expand due
to space and weight constraints. This is in contrast to the utilities, who can simply add
geeration facilities if current resources prove insufficient. Second, cable runs are short,
limited basically to the length of the ship. This means that transmission line dynamics
10

are insignificant and the cable runs can be ignored in analyzing the behavior of the
system. Third, since the components of the system are all located on the ship, they are in
relatively close proximity. Information can be passed between them very rapidly.
Fourth, because of cost, space, and weight constraints, the installed capacity and
rotational inertia of the system generators are much smaller in magnitude when
compared to the size of the loads than the commercial counterpart. This has two
important consequences:
"* The time constants of the prime movers are on the same order of magnitude as
those of the major electrical loads. This makes time scale separation assumptions
often made in commercial system analyses invalid. This is discussed in detail in
Chapter 2 of Reference [1] and Chapter 2 of Reference [2].
"* Since the electrical loads on a ship are relatively large and dynamically applied, the
voltage and frequency excursions that can be produced are large compared to
commercial systems. For example, Reference [4] allows the electrical frequency to
vary plus or minus 3% from the nominal value, and the voltage to vary plus or
minus 5% during normal conditions. Much larger variations (even system
shutdown) are allowed for short periods during emergency conditions. Therefore,
the "infinite bus" assumption often made in commercial system analyses is invalid.
The above factors make analysis of Naval shipboard electrical power systems
quite difficult. The tools in general use by the commercial electric power industry are
unsuitable for shipboard power system analysis due to the differences mentioned above
II
[Ref I]. This, coupled with new developments in electric drive propulsion, etc., have led
the Navy to begin developing its own analysis tools. Reference [1] details the first step
in the development of an analysis tool called WAVESIM, suitable for the dynamic
analysis of shipboard electric power systems. Reference [2] developed a stability
analysis method compatible with WAVESIM. Reference [3] developed an analysis tool
for assessment of the steady state generating and distribution capabilities of shipboard
electric power systems with battle damage. These tools, when fully developed and
proven for general Navy use, will allow the designer to simulate different conditions and
choose between candidate electric plants (locations and types of generators, as well as
control systems and distribution equipment) based on the simulated responses.
The Navy also uses analysis tools which are not specifically for electrical
systems. The principle ship design tool used currently is called ASSET (Advanced
Surface Ship Evaluation Tool). ASSET is a computer synthesis tool which allows a
designer to construct a computer model of a ship and analyze the feasibility of the
design, comparing it to current design practices and constraints and past designs.
Reference [5] is the manual for TIGER, the Navy's reliability and availability analysis
tool. TIGER calculates reliability and availability information using Monte Carlo
methods.
The tools discussed above allow a relative assessment of the merits of alternative
overall power plant designs. However, the initial decisions on how much generating
capacity and the number of generators required onboard a ship are still based on
12

empirical methods which have not been updated to reflect current technological
advances.
The current methodology does not provide the designer with a means for
assessing the relative merits of candidate generator configurations during the early phases
of design. That is, how many generators should be installed? How much benefit is
actually obtained by installing an additional generator? Is a system consisting of several
small generators really much more reliable than one consisting of fewer but larger
generators? ASSET can be used for load estimation, but the question of generating
system adequacy is not addressed from a reliability standpoint. TIGER could be used for
some of these evaluations, but it has several important limitations:
"* First, it is difficult to use. TIGER is a FORTRAN program which requires input
in the form of text files. These files have complicated formats which require
information on each component and operating rules for the system be placed in
specific lines and columns in the file.
"* Second, it evaluates systems based on operating rules (e.g. two of three snbsystems
must be operational for the system to be considered operational) and therefore is
difficult to use to analyze systems made up of generators of different sizes.
"* Third, the output consists of a text file for each run. Comparisons between
configurations must then be made by extracting the pertinent information from
each output file and comparing the data manually.
13

Once the number and sizes of generators are determined, the tools already
developed could be employed. For example, the damage model [Ref 3] could be used to
determine optimum locations for the generators and other electrical equipment from a
survivability standpoint. WAVESIM [Ref 1] and the stability methods of Reference [2]
could then be used to simulate the system to determine transient responses and overall
system electrical stability for control purposes.
Program Development
The new methodology is coded as a personal computer (PC) based program
called SMOKEY (since BEAVER was already taken, the author named the program after
the mascot at the University of Tennessee where his undergraduate work was done.
Smokey is the name of the blue tick hound dog that is the school mascot). The program
is Windows based for ease of use. An installation program was also written to reduce
startup time and ensure proper operation for inexperienced users.
The niche occupied by SMOKEY is as a preliminary design tool. SMOKEY
allows the designer to evaluate several generator configurations in terms of availability.
The selected configuration can then be evaluated in detail later in the ship design process
when equipment locations, control system strategies, and distribution paths have been
established using the tools previously mentioned.
14

The ability to compare configurations in terms of cost and weight early in the
design process is the primary innovation of SMOKEY. The program allows a designer
to easily evaluate the benefits of adding additional generators, enlarging generators, etc.
based only on the anticipated loads. Since the loads can be estimated based on the
mission of the ship and the weapons systems to be included, the electric generating plant
can be decided on with a great degree of certainty very early in the design process. This
is especially important in electric drive ships since the electric plant _4 the propulsion
plant. Unnecessarily large plants mean larger and more expensive ships, which can no
longer be tolerated.
15
Chapter 2. Electric System Sizing Concepts
Before beginning a description of the proposed improved methodology for sizing
Naval electric power plants, it is appropriate to review some of the basic concepts of
reliability analysis. In addition, this chapter will describe the basics of utility company
reliability evaluation and sizing, and the current sizing methodology used during Na"'al
ship design.
Reliability Concepts
The Standard Handbooo Elctrical Engine [Ref 6] defines the reliability of
a power system as a measure of its "ability to serve all power demands made by all
customers without failure over long periods of time." Availability is defined as the
"percent of time that a unit is available to produce power whether needed by the system
or not. It is a measure of overall unit reliability." Availability is easy to quantify.
However, reliability is a harder concept to get a handle on. As stated in Reference [7]:
It should be noted that the term reliability has a very wide
range of meaning and cannot be associated with a single
specific definition such as that often used in the
mission-oriented sense. It is therefore necessary to
recognize its extreme generality and to use it to indicate, in
16

a general rather than specific sense, the overall ability of
the system to perform its function.
Reference [7] goes on to state that reliability is made up of two basic aspects:
adequacy and security. Adequacy is basically having enough resources to supply the
load demand at any given time. Security relates to the systems ability to respond to
disturbances. Since this project focuses on sizing methods and not control systems, it is
the question of system adequacy that is dealt with in this thesis.
The basic parameter used in static capacity evaluation is the unit availability (the
probability of the unit being operational at a given time) or, alternately, unavailability
(the probability of the unit not being operational). These quantities are defined [Ref 8]
as follows:
A VA4BLJ7Y= A= MA
JMrF+Mrm
and
UNAVAILABJITY=U= M =1-AMW"B+MMIT
where MTBF=Mean Time Between Failures
and MITR=Mean Time To Repair.
MTBF and MTTR are determined from actual failure and repair data for each
component. In a simple series system (i.e. a system in which each component must be
available for the system to be available), the availability of the system is the product of
the availabilities of the individual components. In a simple parallel system (i.e. a system
17

in which one component must be available for the system to be available), the
availability of the system is I minus the product of the individual component
unavailabilities. The profs of these statements are straightforward, and so are not
repeated here.
Utility Company Sizing Methods
Commercial power systems are most frequently analyzed by assigning generator
units and loads to nodes interconnected by transmission lines (and transformers, circuit
breakers, etc.). The transmission lines are modeled as single lines, and the sources and
loads as providers and users of power (as opposed to voltages, currents, impedances,
etc.). This is commonly called the power distribution "grid." Historical data is used to
produce probabilistic models of the generators and loads. Availabilities for each
generating unit are determined, then the probabilities that various generating capacities
will be unavailable are combined to form the capacity outage probability table. The
capacity outage probability table is simply an array of possible capacity levels (for
example, in a system with two I kW generators, the possible capacities are 0, 1, and 2
kW) and the associated probabilities of existence. In the simple case where all units are
the same capacity, the probabilities can be calculated using the binomial distribution [Ref
8]. When the system is comprised of generators with different capacities, a recursive
technique, such as the one shown in Reference [9], is generally used to calculate the
probabilities.
18

The capacity outage probability table is then combined [Ref 7] with the load
model using probabilistic techniques to produce a system risk index. The most common
load model is called the daily peak load variation curve. It is simply the system daily
peak loads arranged in descending order. One of the most common risk indexes is the
Loss of Load Expectation (LOLE), which is simply the expected number of days in the
specified period in which the daily peak load will exceed the available generating
capacity. The system is said to have adequate reliability if the LOLE is below a certain
specified value. If the LOLE is unacceptably high, additional generating capacity is
added to the system (This is a simple case for an isolated utility. In the real world, other
alternatives are available, such as buying power from other utilities during peak load
periods. Incidentally, this process is called "wheeling," and is discussed in detail in
Reference [10]. Obviously, wheeling is not an option onboard a ship.). Of course, the
procedure is complicated if the grid is such that not all power generated can be
distributed to all loads.
Naval Ship Electric Load Estimation
Shipboard power systems are different in several ways that complicate analysis.
Commercial power loads usually vary daily and seasonally. More power is demanded
during the day, and when the temperature is at the extremes. The demand also varies
relatively slowly, due simply to the high number of loads on the system "averaging out"
over time. Shipboard loads vary rapidly, with a relatively low number of loads on the
system. The number of generators is small (usually only three or four), and large
19

increases in demand have to be tolerated with little or no advance warning (as during
battle). Often additional generators are required to be brought on line rapidly and at
unplanned times. Therefore, the load cannot be modeled using the daily peak load
method discussed above and Loss of Load Expectation is not a valid risk index.
The installed generating capacity of naval electric plants is currently determined
using the following or a similar procedure [Refs 11 and 12]:
1. The maximum connected load is determined by simply adding all possible
electric loads present on the ship. In the case of a new design, this is an estimated
total load based on existing ship designs.
2. The maximum expected load is estimated for several ship conditions (e.g. at
anchor, peacetime cruising, battle) by multiplying each individual load by a load
factor [Ref 13]. The load factors represent roughly the percentage of time during
each condition the load is physically on, and are used to account for the fact that
not all loads are present at all times (the basis for these factors are past practice,
and the origins of most have been lost in the mist of time).
3. The largest resulting load is termed the maximum functional load.
4. The maximum functional load is multiplied by a factor of 1.2, then again by
another factor of 1.2 to obtain the maximum functional load "with margin." The
20%/ margins are for "acquisition" (growth in the electrical loads during design
and construction of the ship) and "service life" (growth in the electrical loads
during the life of the ship after initial construction).
20

5 The size of the installed generators is obtained by dividing the maximum
functional load with margin by the factor [0.9 (n-i)], where n is the number of
generators and 0.9 is a margin for generator control. The factor (n-1) is used to
allow one generator to be out of service and still supply all electrical loads.
It should be obvious that if the above methodology is used on a ship with
integrated electric drive and/or pulsed power weapons systems, the result could be an
extremely large electric plant. This could make the ship larger and more expensive than
necessary, potentially with very little benefit in overall system reliability. Several
questions arise:
"* What load factors should be used for the pulsed power and electric propulsion
systems?
"* Is it necessary to be able to supply enough power to go full speed and fire all
weapons simultaneously?
"* Is it necessary to be able to go full speed and fire all weapons simultaneously with
one generator off line?
In addition, the above method does not address the adequacy or reliability of the
system in any quantitative fashion. For example, a plant consisting of two generators,
each large enough to carry the entire load, would meet the above criteria. This plant is
very likely less reliable than one consisting of three or more smaller generators. The
proposed improved methodology will address the issue of system adequacy. The issue of
21

security is not addressed since the control systems aspects of Naval shipboard electrical
plants are beyond the scope of this project.
22

Chapter 3. SMOKEY Development
The proposed improved methodology for sizing Naval ship electric plants has
been incorporated into a computer program called SMOKEY. SMOKEY will ad make
a decision for the designer, but it will provide the information necessary to allow the
designer to make a sound engineering decision based on reliability considerations. This
chapter discusses the philosophy behind the program, as well as the numerical techniques
embedded in the code.
Philosophy
In order to determine the "optimum" configuration for an electric plant, the
designer must understand clearly what "optimum" means. The optimum plant for one
ship will not necessarily be so for another. Obviously, the designer wishes to provide the
most reliable plant possible. However, the constraints will vary from project to project.
The total weight of the generators will be much more critical in a frigate design than a
cruiser design, since the cruiser is so much larger. Cost is always an issue, but may not
be as important on some projects as other factors.
Therefore, SMOKEY has been coded to compute and display reliability
information as a function of total installed generating capacity, the total number of
generators, total cost, and total weight. This allows the designer to optimize the plant
23

configuration as required by the design constraints important to the particular design.
Fuel weight was not considered because the amount of fuel required to be carried on
board a ship is a complex function of the ships mission, specified endurance range and
speed, the shape of the tanks, engine specific fuel consumption, expected electrical load,
and numerous other factors. Since this would greatly complicate the development of the
program, as well as increase the amount of information needed to run the program and
potentially make it harder to learn to use, the fuel consumption was not included as a
parameter in the first version of SMOKEY.
SMOKEY was initially conceived as a design tool for use during the earliest
phases of ship design. During these early phases, the design changes rapidly. A Navy
ship design is a study in compromise; no ship is optimum in all respects. Therefore,
many tradeoff studies are conducted to help the ship designers, managers, policy makers,
ship builders, politicians, and other government officials involved in the process decide
on the charactmistics of the ship. In this environment, the designer of the electric plant is
required to evaluate numerous potential configurations of generators and loads. The
most important consideration for the program, then, was that it be easy to learn and use.
If the program is not easy to use, it would not be used no matter how good it was
(witness the proliferation of so-called "shelfware" in most offices). In addition, the
program should be able to run on a personal computer, since a mainframe would not
always be available.
24

Interest in the issue of sizing electric plants was brought about by the work
currently being done on electric drive. However, it would be narrow minded to think
that mly electric drive ships will be built in the future. It was considered important,
then, to make SMOKEY usable for non-electric drive ships as well. This is
accomplished easily, and is a matter of simply inputting the proper loads. This point will
become clear as the program is described in detail later in this c-.apter.
Based on the above discussion, it was decided the program should allow the user
to input load information, then several potential generator configurations (capacity,
availability, weight, and cost of each generator). The program would compute a
reliability index for each configuration, and display the information graphically so that
the user could see which configuration was best in terms of the parameter (cost, weight,
etc.) of most significance. This would also allow cost-benefit analyses to be performed
easily, as the user could see graphically the point at which the addition of more capacity
(another generator, or larger generators, for example) produces a marginal increase in
reliability.
The problem then became one of developing a suitable reliability index.
Generator information for each configuration could be manipulated into a capacity
outage probability table. As discussed previously, the utilities would then combine the
load model with the table to determine the reliability index. The Navy equivalent of the
daily peak load variation curve would be a load curve based on a ship operating profile.
That is, an operating profile would be postulated (transits at certain speeds, battle
25

engagements, etc.), then the electrical loads for each operating condition calculated to
produce an "electric load operating profile." This load profile would be combined with
the capacity outage probability table to produce an index similar to the LOLE. However,
there are several problems inherent in this type analysis:
1. What operating profile should be used? Shipboard electric loads vary greatly
with temperature, and so would vary greatly with time of year and operating area.
Since the United States Navy operates all over the world year round, the
operating profile would have to be very specific and complex. Furthermore, the
missions of ships tend to change over their twenty to thirty year lives (for
example, the recent breakup of the Soviet Union has changed the entire focus of
Navy ships from open-ocean superpower conflict to shallow-water coastal
warfare and humanitarian missions). Therefore, the development of an accurate
operating profile would be a complicated matter indeed!
2. Development of an accurate load profile would require detailed analysis of the
loads which would be time consuming at best; not possible at worst.
3. What would the index mean? An index similar to the LOLE would provide an
expected number of days (or hours, etc.) that the ship could not supply the
expected electrical load. That is, you would be telling the Captain that he has a
ship that cannot perform its specified mission for some portion of the time. The
last thing the Captain wants to hear is that his ship is uijcd to not be able to
perform, particularly in the heat of battle!
26
Therefore, it was decided that an appropriate index would be a simple one: the
probability that the plant could supply given percentages of the loads at any random time
(for example, the probability that the plant could provide 75% of propulsion power, 50%
of weapons power, and all vital loads). This could easily be computed from the capacity
outage probability table given the total load in question. The problem then became one
of how to input the loads, and what the percentages should be.
Based on the experience of the author, review of several ship electric load
analyses and reports [Refs 14, 15, and 16], and discussions with Navy ship design
engineers, it was decided to group loads into four categories: vital loads (loads that must
be supplied at all times), weapons systems loads, propulsion loads, and damage control
loads. Also, since the percentages of interest would be different for different ships, it
was decided to let the user select the percentages. This provides the additional benefit of
allowing the user to evaluate several possible operating conditions for each potential
generator configuration.
Methodology
Because of the desire to run SMOKEY on a personal computer and make it easy
to use, it seemed natural to write the program as a Windows application. The graphical
user interface (GUI) would greatly enhance usability, and the popularity of the Windows
operating system would ensure the program could be used by virtually anyone in need of
it. These factors, combined with the authors familiarity with the BASIC language (not to
27

mention toIt unfaml with the "C" family, the other popular Windows
programming language system), conspired to force the selection of VISUAL BASIC for
WINDOWS [Ref 17] as the language to be used in developing SMOKEY. In addition,
the recent release of VISUAL BASIC for DOS would allow SMOKEY to be compiled
nearly unchanged for use as a DOS application, complete with a GUI, should that be
necessary.
The methodology of SMOKEY is simple and straightforward. The user is
prompted for all input, which is entered using the keyboard and/or mouse (or other
pointing device). Electric loads are input in four groups as described above. The
percentages of weapons, propulsion, and damage control loads to be considered are then
selected. The total load to be used to enter the capacity outage probability table is
calculated as the sum of the given percentages of those loads plus 100% of the vital
loads. The generator information is then entered, and the capacity outage probability
table computed. The total load is compared to the table, and the reliability index
computed and displayed. The user can then input additional generator configurations,
compute the indices, and display plots as described earlier. Printed output of the plots
can be obtained by selecting "Print" from the menu of the desired graph.
Perhaps the most interesting aspect of SMOKEY is the method used to compute
the capacity outage probability table. Reference [9] provides a recursive method for this
comp utaton. However, this method proved difficult to code. Instead, a method based
on Z-transforms was used. This requires some explanation.
28

A probability mass function (PMF) is a function for a random variable x, say
p1(x,), defined [Ref 18] as follows:
p,(x,)= probability that the experimental value of random variable x is equal to xe.
Since each generator is modeled as either available or not available (no derated states are
allowed on Navy ships), the PMF for each generator is simply an impulse at the rating
point of magnitude A (where A is the availability of the generator), and an impulse at
zero of magnitude (1-A).
The Z-transform is defined [Ref 18] as:
pPf.Tp.(xo)
The Z-transform for each generator PMF then becomes:
p•Tf(1-A) + AzkW
where kW is the rating point of the generator.
When two or more generators are added, the combined PMF (which is, basically,
the capacity outage probability table) is the convolution of the separate generator PMFs
(assuming statistical independence, which is a valid assumption here since the
availability of each generator is independent of all the others), which is a complicated
29

series of infinite integrals. However, the Z-transform of the combined PMF is the
product of the Z-transforms of the separate generator PMFs, which is a much simpler
operation. SMOKEY computes the capacity outage probability table by computing the
product of the Z-transforms of the separate generator PMFs.
Validation
The computations made by SMOKEY were validated in three ways:
1. Comparison to examples presented in Reference [9].
2. Comparison to hand computations using the binomial distribution of Reference
[8]. This is valid when the generators are identical.
3. Comparison to results produced by TIGER. The TIGER runs are provided as
Appendix (B), and are for the following cases: 1 of 2 identical generators
necessary to supply the load, 2 of 3 identical generators necessary, and 2 of 4
generators necessary. The appropriate numbers for comparison from the TIGER
runs are the average availabilities and estimated long-term availabilities for the
system. TIGER outputs much more information which is not necessarily useful
in this case. Also, it should be noted that TIGER outputs a parameter called
"reliability." This parameter is defined by Reference [5] specifically for the
TIGER simulations, and is not appropriate for use here.
30

The computations made by SMOKEY were exact for 1 and 2 above, and within 3% for
3. The differences in the SMOKEY and TIGER runs are attributed to the different
methods of calculation employed. SMOKEY uses deterministic methods, while TIGER
used Monte Carlo methods, as discussed previously. Based on the above, the operation
of SMOKEY is considered validated.
31

Chapter 4. SMOKEY Program Operation
SMOKEY is an interactive program which takes all input from the keyboard and
outputs to the screen. Plots can be printed if desired. The source code for SMOKEY is
included as Appendix (A). This chapter describes the code in detail and explains the
operation of the program.
Installation
In order to ensure proper setup of the program and make installation as easy as
possible, an installation program was developed for SMOKEY. The installation program
is also a Windows application. Therefore, Windows must be running during the
installation process. Installation of SMOKEY is performed as follows:
1. The SMOKEY disk should be inserted in the appropriate disk drive. From the
Program Manager, select the File menu, then the Run command. In the Run
dialog box, type "a:setup" (or "b:setup" if the disk is in the b-drive, etc.) in the
Command Line box. This starts the Setup program.
2. The Setup program first checks to ensure the hard disk has enough space to
accommodate all the SMOKEY files. If so, it prompts the user for the directory
in which to install SMOKEY (the default is cAsmokey). If the selected directory
does not exist, the Setup program creates it.
32

3. The Setup program then copies the executable file SMOKEY.EXE into the
specified directory. In addition, several other files are copied into the
windows~system subdirectory:
a. VBRUN200.DLL: This is the Visual Basic 2.0 run-time library, and is
required for any program written in Visual Basic 2.0 to run.
b. GRAPH.VBX, GSWDLL.DLL, and GSW.EXE: These files are from
the Visual Basic Toolbox, and are necessary for the graphing subroutines
to run.
The Setup program checks to see if these files are already installed, and only
replaces them if the version on the SMOKEY disk is more recent.
4. The Setup program then installs a Program Manager group called SMOKEY, and
an icon for SMOKEY in that group. The icon can be moved into any group and
the SMOKEY group deleted if desired.
5. SMOKEY can now be started the same way as any other Windows program (by
double clicking on the icon, etc.).
Using SMOKEY
Once the installation process is complete, SMOKEY is started in the same way as
any other Windows program. The details of how to use the program will be discussed in
the next section, which describes the subroutines in detail. Basic familiarity with the
33

Windows operating system is assumed. Readers unfamiliar with Windows should refer
to the Microsoft Windows User's Guide, or any of a number of other Windows
references currently available.
Subroutine Description
Each screen in Visual Basic is called a form. Subroutines are then attached to the
form (e.g., each button or menu on the form will have an associated subroutine which is
executed when the user selects that item). Therefore, the explanation of the program will
proceed from form to form for ease of understanding. Since the forms are in color, they
cannot be reproduced exactly here. It should be noted that SMOKEY was written for
Windows version 3.1. It will run with earlier versions, but the appearance of the forms,
especially the text fonts, may differ from those pictured.
General
Forms are manipulated as with any Windows program. Menu items are accessed
using the mouse or the keyboard (i.e. ALT+ the underlined menu item letter). Forms
may be moved around the screen by "drag and drop" with the mouse.
Each form, with the exception of the startup, error and message forms, has the
menu items "File" and "Help" at the top of the form. The "File" menu contains a
ubmemu item "Exit" which will terminate the program when selected. The "Help" menu
34
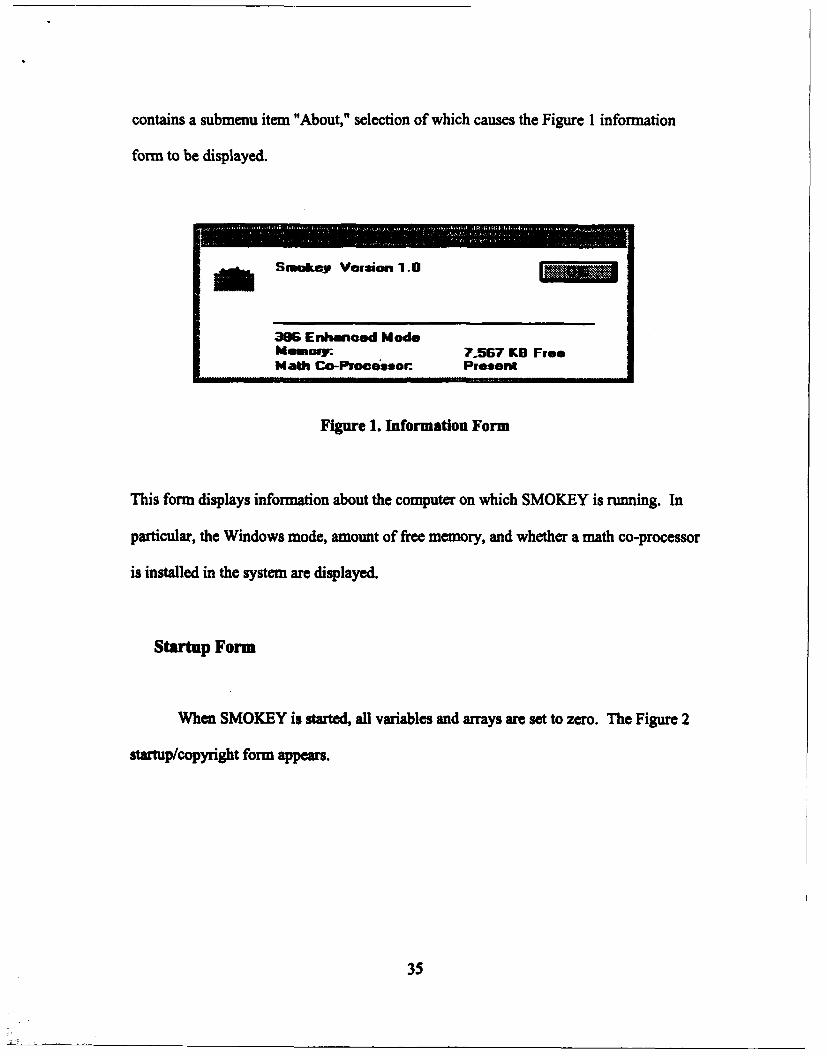
contains a submenu item "About," selection of which causes the Figure 1 information
form to be displayed.
do Smoalry Version 1.0
386 Enhanced ModeMmorfy 7.567 KB FreeMath Co-Proctiesor: Present
Figure 1. Information Form
This form displays information about the computer on which SMOKEY is running. In
particular, the Windows mode, amount of free memory, and whether a math co-processor
is installed in the system are displayed.
Startup Form
When SMOKEY is started, all variables and arrays are set to zero. The Figure 2
startup/copyright form appears.
35

Figure 2. Startup Form
This form is displayed for approximately two seconds. Then, the timer function
associated with this form opens the Load Information Input form and closes the startup
form.
Load Information Form
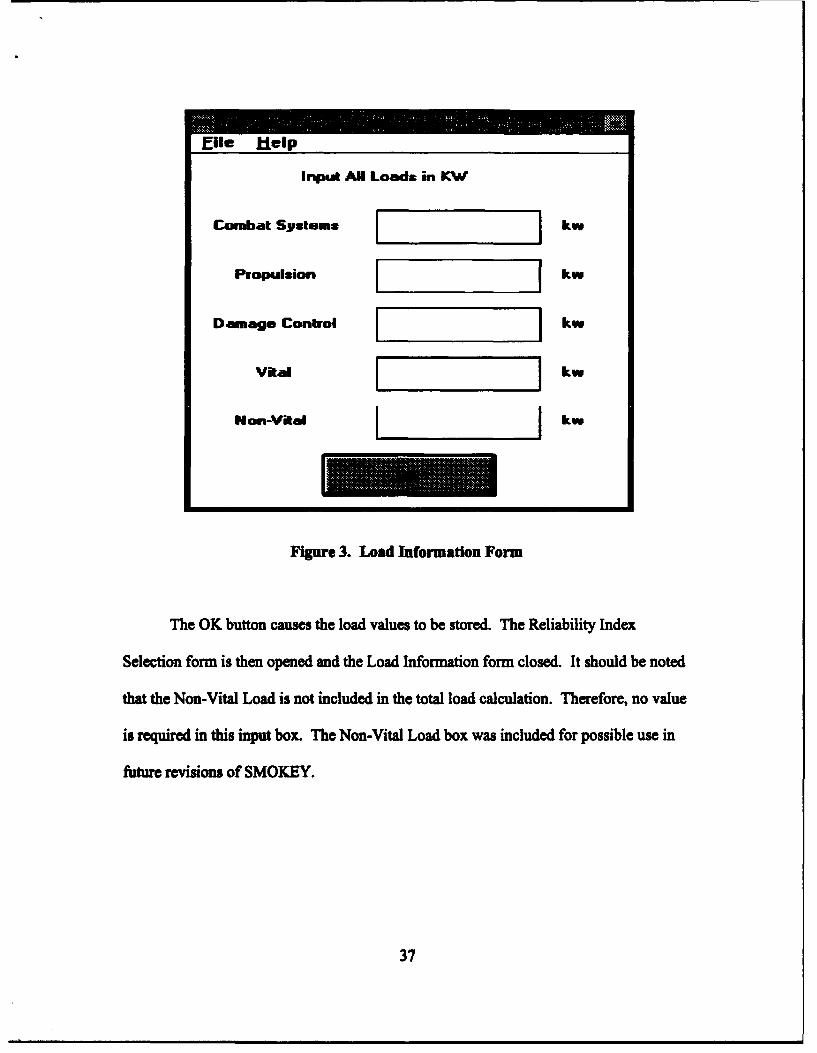
The Figure 3 Load Information Form receives the load information. Loads in
each category are input by placing the cursor in the appropriate box (with the mouse or
tab key) and entering the load values from the keyboard. If no value is entered into a
box, the program assigns a value of zero to that load category.
36
Elie Help
Input AN Loads in KW
Combat Sypst.s. kw
Propulsion kw
Damage Control kw
Vital I kw
Non-Vital I 1kw
Figure 3. Load Information Form
The OK button causes the load values to be stored. The Reliability Index
Selection form is then opened and the Load Information form closed. It should be noted
that the Non-Vital Load is not included in the total load calculation. Therefore, no value
is required in this input box. The Non-Vital Load box was included for possible use in
futur revisions of SMOKEY.
37

Reliability Index Selection Form
The Figure 4 Index Selection Form allows selection of the percentages of each
load category for use in the total load calculation.
Eile Help
This pIooram will compute the Pirobabltp thatthe conriguration kpu will hbe able to suppbl theselected pmcentag• s of the total load:
Combat Systems
PropAsion
Damage Control
Note: VOW Load*we 44mld -- -1hetolI~
Figure 4. Reliability Index Selctlion Form
The percentages are selected by manipulation of the scroll bars with the mouse, or by
typing the numbers directly into the input boxes. The numbers should be entered as
percentages rather than decimals (i.e. 45 for 45%, not 0.45). The OK button causes the
total load to be calculated and stored (the total load is the vital load plus the sum of the
selected percentages of the other load categories), the Generator Input form to be
displayed, and the Index Seletion form to be closed.
38

Generator Input Form
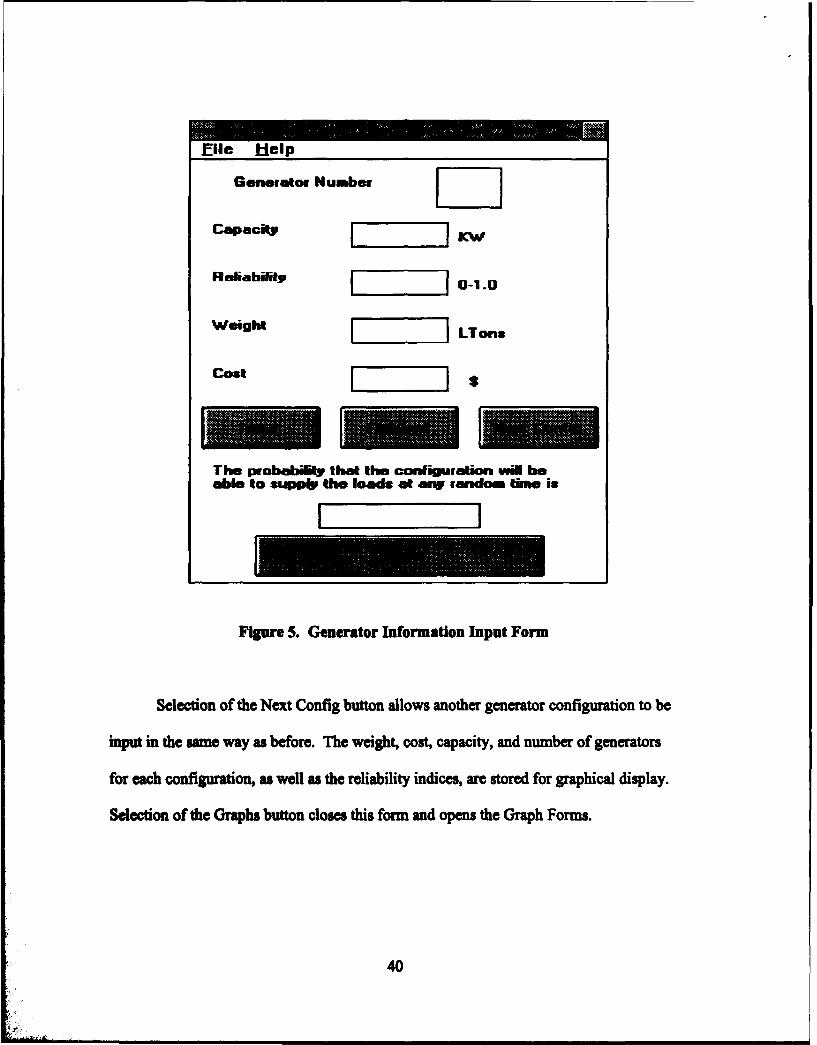
The Generator Input Form does most of the work of SMOKEY, and is shown in
Figure 5. The information for each generator is input as with the other forms. It should
be noted that the parameter "Reliability" is actually the availability of the generator. The
Generator Number box displays the number of the next gnerator to be input into the
configuration (this is displayed by the program and does not have to be input by the
user). Each generator is added by selecting the Input button. This causes the weight,
cost, and capacity information for the generator to be added to the total for the
configuration, and the generator to be added to the capacity output probability table
(using the Z-transform method described earlier). When the last generator has been
input, the Finished button should be selected. This causes the total weight, cost,
capacity, and number of generators for the configuration to be stored in an array. The
total load is then compared to the capacity outage probability table, and the reliability
index computed. The result is displayed in the box near the bottom of the form and
stored in an array. If there is insufficient capacity to supply the load, the error message
form shown in Figure 6 is displayed.
39
Elle Help
Generator Number I I
Reliabifly 1I] 0-1.0
Weight [~ ]LTrns"------------- -- -- --- ,-
The probablity that the configuration wil beable to auppip the loads at arw random time is
Figure 5. Generator Information Input Form
Selection of the Next Config button allows another generator configuration to be
input in the same way as before. The weight, cost, capacity, and number of generators
for each configuration, as well u the reliability indices, are stored for graphical display.
Selection of the Graphs button closes this form and opens the Graph Forms.
40

Figure 6. Insufficient Capacity Error Form
As will be discussed later in this chapter, the maximum number of generators
which can be input into any configuration is twelve. Therefore, if a twelfth generator is
added, the Figure 7 Message form is displayed to inform the user they cannot add more
generators to that configuration.
Figure 7. Maximum Number of Generators Message Form
41

Comparison Plot Forms
The Graphs Forms display total cost, total system capacity, total weight, and total
number of generators for each configuration against the selected reliability index. A
typical graph is shown in Figure 8. The graphs allow the user to see the point at which
addition of capacity does not produce an appreciable increase in system availability.
Elie Help
1.0.-
0. .
0.8- xIndex
0.7.
0.6.
0.50 1
Total Number of Generators
Figure S. Reilability Index Graph Form
The plots can be printed by selecting the Print option under the File menu. The
print routine uses the Windows printing fimctions, so no separate printer drivers are
necessary. The program will print to the default printer, as long as it will support
graphics printing. The program terminates if all the Graph Forms are closed, or if the
Exit option is selected under the File menu of any of the Graph Forms.
42

Other Subroutines
SMOKEY incorporates some error checking to prevent inappropriate data from
being entered. If any inappropriate data are detected (reliability greater than 1.0, etc.),
the Figure 9 Error Form is displayed.
Figure 9. Improper Input Error Form
Unfortunately, due to time constraints, a separate form was not generated for
every possible error. Therefore, the user must figure out which input value gn thm
==rret form is improper, and change it before being allowed to continue.
Program Limitations
There are several limitations inherent in the operation of SMOKEY which should
be mentioned. The limitations, and reason for each, are as follows:
43

1. The maximum number of generators that can be input into a single configuration
is 12. This is due to the fact that the program was originally written in Version
1.0 of Visual Basic, which had an inherent array size limitation. Visual Basic
Version 2.0 has no such limit. However, the SMOKEY code has not yet been
revised to remove the 12 generator limit.
2. The maximum number of generator configurations which can be compared and
plotted is 10. This limit was written into the code to prevent the plots from
getting too "busy" to be useful.
3. The individual points on the comparison plots are not labeled. This means the
user has to track the results computed by the Generator Input Form well enough
to be able to distinguish which point belongs to which configuration. This is due
to the fact that the graphing routines built into Visual Basic 2.0 (Professional
Edition) were used to save time, rather that writing custom routines. These
routines do not allow individual points to be labeled.
44

Chapter 5. SMOKEY Application
The purpose of this chapter is to demonstrate the application of SMOKEY.
Several cases are examined to illustrate the different ways in which SMOKEY can be
used. First, the DDG-51 electric plant is examined, and the results compared to the
Reference [19] reliability analysis. A hypothetical conversion of the DDG-51 to electric
drive is then examined. Two cases are considered: Conversion to electric drive with
propulsion derived ships service electric power (integrated electric drive), and conversion
to electric drive without propulsion derived ships service power. Finally, to show how
the program would be used during design of a new ship (rather than evaluation of an
existing design), the propulsion plant of a proposed Heavy Lift Ship is evaluated. This
ship is being designed as a graduate student design project in the Ocean Engineering
Department at MIT.
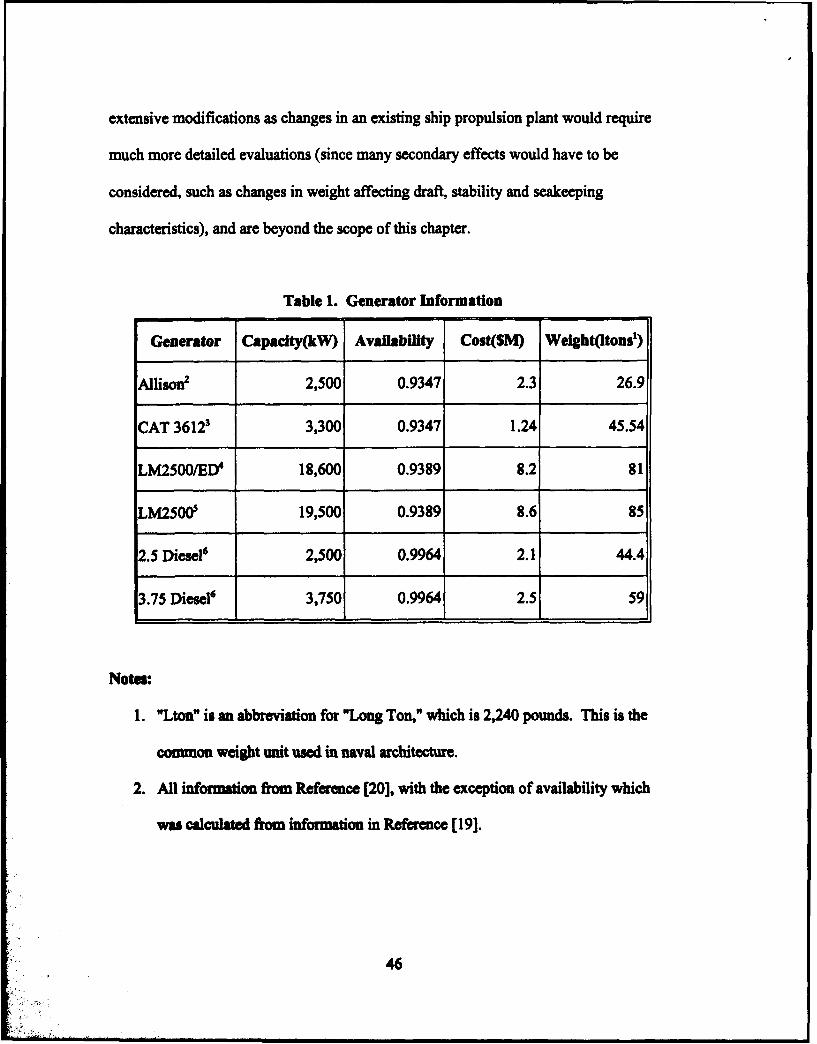
Information on several prime mover-generator combinations is summarized in
Table 1. These units are used throughout the examples of this chapter. Table 1 is not
intended to include all units available for possible use in Naval ships. However, it does
represent a reasonable cross-section of available units, and provides enough choices to
adequately demonstrate SMOKEY. The examples of this chapter are intended to
illuws the use of SMOKEY and its methodology in making decisions relative to
installed electrical generating capacity in Naval ships. They do no represent
reco=Mendations on the part of the author for potential ship conversions. Any such
45
extensive modifications as changes in an existing ship propulsion plant would require
much more detailed evaluations (since many secondary effects would have to be
considered, such as changes in weight affecting draft stability and seakeeping
characteristics), and are beyond the scope of this chapter.
Table 1. Generator Information
Generator Capadty(kW) Availability Cost($S) Weight(tons1)
Allisoný 2,500 0.9347 2.3 26.9
CAT 3612' 3,300 0.9347 1.24 45.54
LM2500/ED4 18,600 0.9389 8.2 81
LM25005 19,500 0.9389 8.6 85
2.5 Diesel' 2,500 0.9964 2.1 44.4
3.75 Diesel' 3,750 0.9964 2.5 59
Notes:
1. "Lton" is an abbreviation for "Long Ton," which is 2,240 pounds. This is the
common weight unit used in naval architecture.
2. All information from Reference [20], with the exception of availability which
was calculated from information in Reference [19].
46

3. All information from Reference [20], with the exception of availability, which
was assumed to be the same as the Allison because of a lack of reliability data on
this unit.
4. All information from a preliminary report from the Advanced Surface Machinery
Project Office, with the exception of availability which was calculated from
Reference [19] (assuming the standard LM2500 with a typical electrical
generator). The "ED" designation is for "Electric Drive," to distinguish this unit
from the next one in the table.
5. This unit is a standard LM2500 with a larger generator than the previous unit,
intended to use more of the available power of the gas turbine. The weight and
cost were scaled up from the previous unit, and availability calculated from
Reference [19].
6. Cost and weight information taken from a preliminary report from the Advanced
Surface Machinery Project Office. Availability assumed to be that of a typical
diesel generator provided in Reference [21].
The first four units in Table 1 are gas turbine driven. The third, fifth and sixth
units have been defined by the Advanced Surface Machinery Office as "standard
modules" for use in Naval propulsion plants as part of the Navy "affordability through
commonality" initiative. It should also be noted that Reference [19] identifies some
components of the gas turbines as not repairable by ships force. To calculate an
availability for the unit, a MTTR of twenty days was assumed for those components.
47
This assumption is consistent with the logistics delay of twenty days assumed in the
Reference [19] analysis for all parts not available on board.
DDG-51 Electric Plant Analysis
The simplest application of SMOKEY is to analyze an existing electric plant.
Since a detailed load analysis has been performed and the installed plant proven
satisfactory, it is prudent to compare possible configurations in terms of the load used to
design the plant originally. The intent here is to evaluate the DDG-51 plant and compare
the results obtained using SMOKEY with the Reference [19] analysis (which used the
Monte Carlo methods of TIGER [Ref 5]). It should be noted that Reference [19] is very
extensive, and the electric plant only one of many systems analyzed. However, the
pertinent electric plant information can be extracted for comparison. The current
DDG-51 electric plant consists of three 2500 kW Allison gas turbine generators.
Reference [14] calculates a maximum functional load (using the method
discussed in Chapter 2) of 3990 kW. This load was used as the design load for the
DDG-51 electric plant. Many operating conditions analyzed in Reference [14] require
total loads less than 2500 kW and would therefore require only one generator. However,
standard practice is to run two of the three generators at all times to prevent the loss of
one generator from making the ship "cold and dark." Therefore, the Reference [19]
analysis assumed two generators were MW& at all times.
48

Reference [19] simulated the electric plant as three Allison gas turbine generators,
two of which were required to be running at all times. The availability for the sixty day
mission was calculated as 0.98. However, Reference [19] recommended the addition of
a fourth generator based on the fact that the gas generator of the gas turbine, which is not
repairable by ship's force, accounted for 16% of the unavailability of the ship.
The benefits of adding a fourth generator can easily be analyzed using SMOKEY.
By using the design load (3990 kW) as the "vital" load and zeros for the other load
categories as inputs, the results produced by SMOKEY become simply the probability
the system can supply the design load. This could alternately be considered the overall
availability of the system. This probability for the current configuration (3 installed
generators) is 0.9878, which compares well with the Reference [19] analysis. The
probability with four generators is 0.9989. Therefore, the addition of a fourth generator
increases the probability that the system can supply the design load by less than 2%.
This is shown graphically in Figure 1 (Note: All graphs in this chapter were produced by
SMOKEY).
49
LXO
0.9"
0.8'
Index0.7"
0.6.
0. 0
Total Nuumber of'Generators
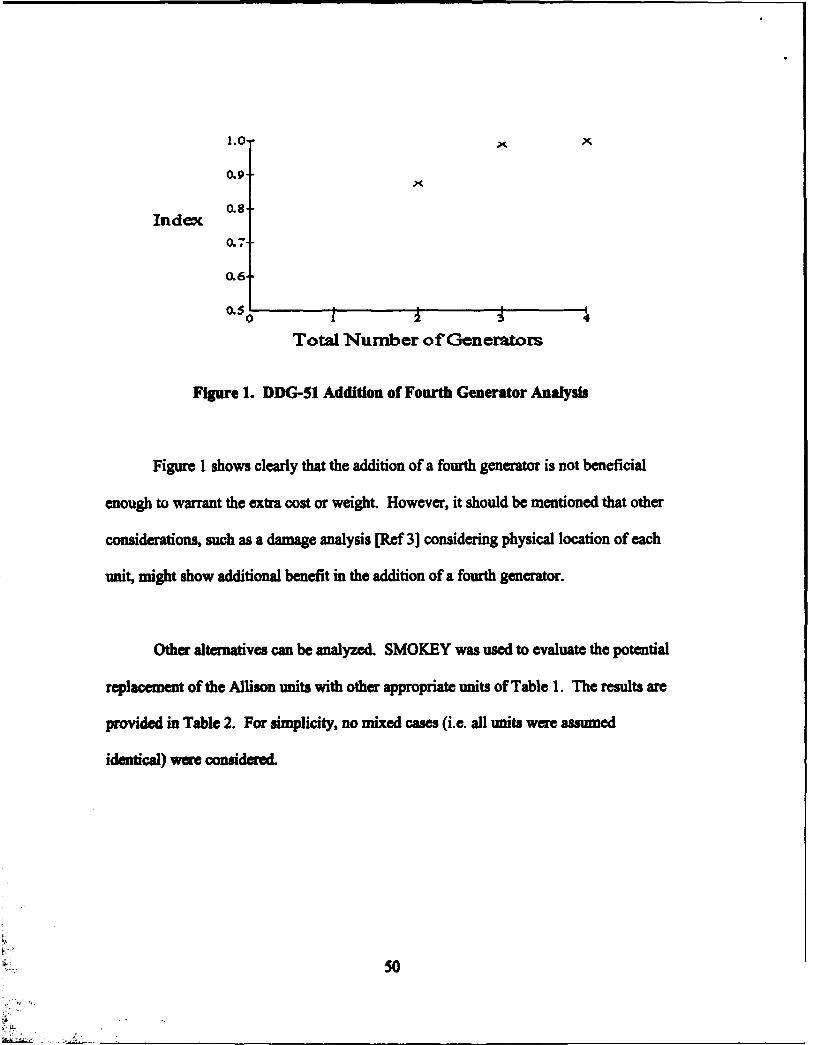
Figure 1. DDG-51 Addition of Fourth Generator Analysis
Figure I shows clearly that the addition of a fourth generator is not beneficial
enough to warrant the extra cost or weight. However, it should be mentioned that other
considerations, such as a damage analysis [Ref 3] considering physical location of each
unit, might show additional benefit in the addition of a fourth generator.
Other alternatives can be analyzed. SMOKEY was used to evaluate the potential
replacement of the Allison units with other appropriate units of Table 1. The results are
provided in Table 2. For simplicity, no mixed cases (i.e. all units were assumed
identical) were considered.
50
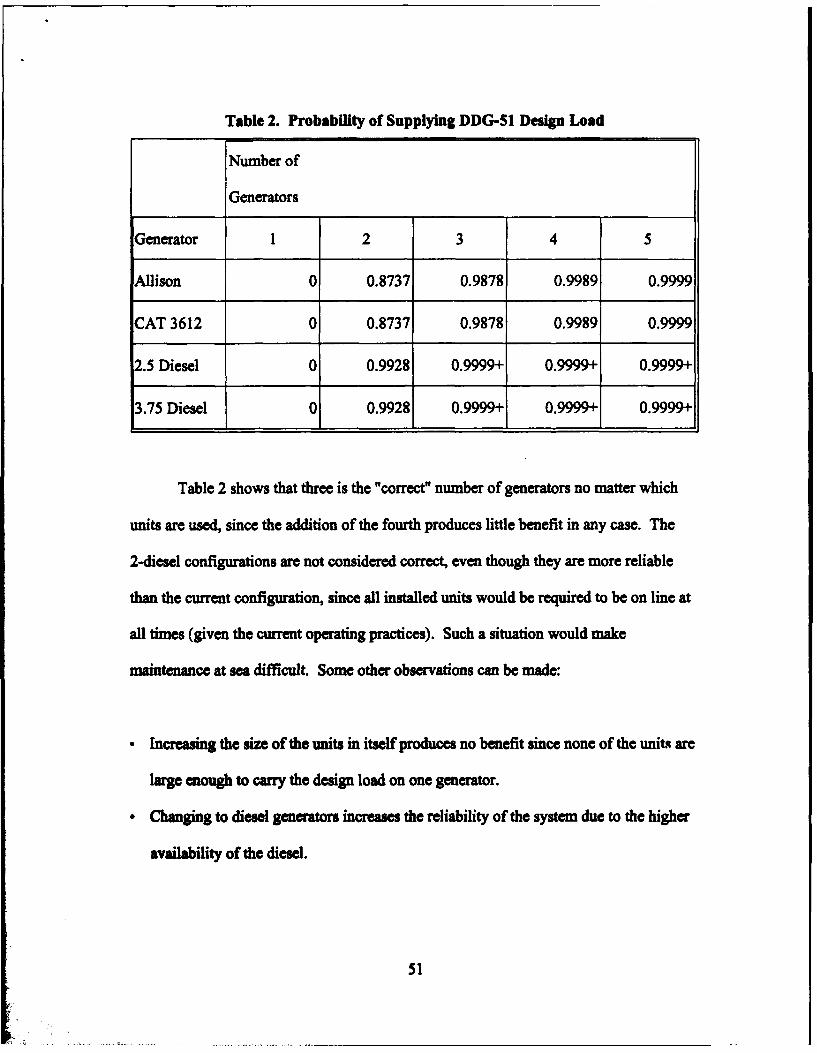
Table 2. Probability of Supplying DDG-S1 Design Load
Number of
Generators
Generator 1 2 3 4 5
Allison 0 0.8737 0.9878 0.9989 0.9999
CAT 3612 0 0.8737 0.9878 0.9989 0.9999
2.5 Diesel 0 0.9928 0.9999+ 0.9999+ 0.9999+
3.75 Diesel 0 0.9928 0.9999+ 0.9999+ 0.9999+
Table 2 shows that three is the "correct" number of generators no matter which
units are used, since the addition of the fourth produces little benefit in any case. The
2-diesel configurations are not considered correct, even though they are more reliable
than the current configuration, since all installed units would be required to be on line at
all times (given the current operating practices). Such a situation would make
maintenance at sea difficult. Some other observations can be made:
"• Increasing the size of the units in itself produces no benefit since none of the units are
large enough to carry the design load on one generator.
"* Changing to diesel generators increases the reliability of the system due to the higher
availability of the diesel.
51
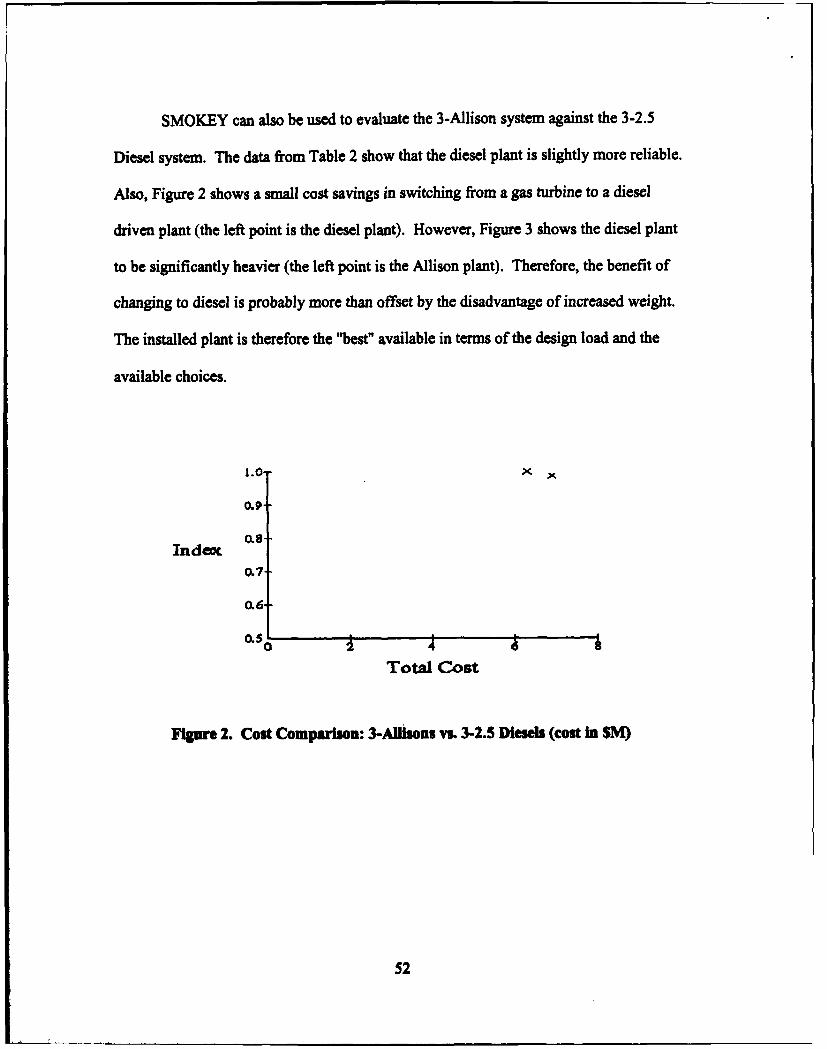
SMOKEY can also be used to evaluate the 3-Allison system against the 3-2.5
Diesel system. The data from Table 2 show that the diesel plant is slightly more reliable.
Also, Figure 2 shows a small cost savings in switching from a gas turbine to a diesel
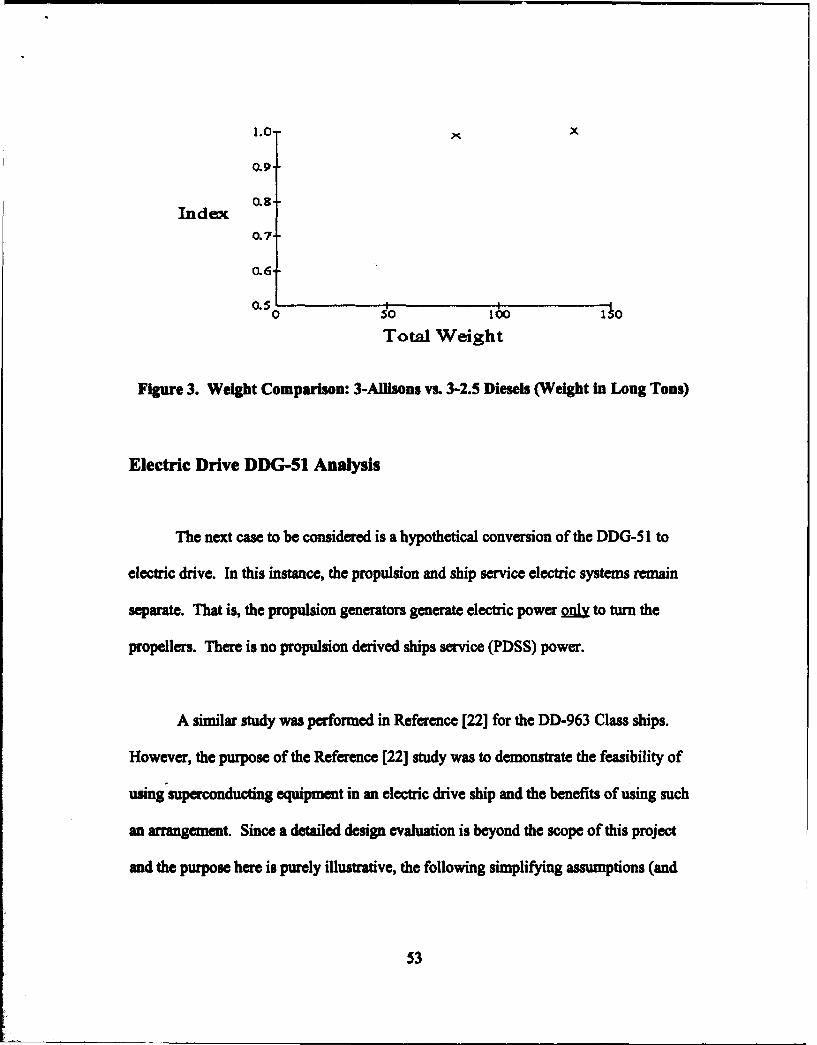
driven plant (the left point is the diesel plant). However, Figure 3 shows the diesel plant
to be significantly heavier (the left point is the Allison plant). Therefore, the benefit of
changing to diesel is probably more than offset by the disadvantage of increased weight.
The installed plant is therefore the "best" available in terms of the design load and the
available choices.
1.0-)<•
0.9-
0.8.Index
0.7'
0.6
Total Cost
Figure 2. Cost Comparison: 3-Allisons vs. 3-2.5 Diesels (cost in $M)
52
0.8
Index0.7-
0.6
O 0 5 N0 10% 110
Total Weight
Figure 3. Weight Comparison: 3-Allisons vs. 3-2.5 Diesels (Weight In Long Tons)
Electric Drive DDG-51 Analysis
The next case to be considered is a hypothetical conversion of the DDG-51 to
electric drive. In this instance, the propulsion and ship service electric systems remain
separate. That is, the propulsion generators generate electric power Qnly to turn the
propellers. There is no propulsion derived ships service (PDSS) power.
A similar study was performed in Reference [22] for the DD-963 Class ships.
However, the purpose of the Reference [22] study was to demonstrate the feasibility of
using superconducting equipment in an electric drive ship and the benefits of using such
an arrangement. Since a detailed design evaluation is beyond the scope of this project
and the purpose here is purely illustrative, the following simplifying assumptions (and
53

the resulting differences between the Reference [22] study and the following example)
have been made:
1. The ship hull form and draft, and therefore the amount of power necessary to
propel the ship through the water, are assumed constant. The Reference [22]
study allowed the ship to change size in response to the size and weight changes
in the propulsion plant in order to more accurately access the impact of the
electric drive propulsion plant.
2. The propellers are assumed to be the same. Gas turbine driven ships with
conventional mechanical drive have propellers which change pitch to vary the
amount and direction of thrust (called "controllable reversible pitch," or CRP
propellers). This is necessary since gas turbines operate at constant speed and in
only one direction. In reality (as assumed in Reference [22]), an electric drive
ship could use fixed pitch propellers (since the control system could change the
speed and direction of rotation of the propulsion motors independent of the gas
turbine speed) which are more efficient and more reliable.
3. Only changes in prime movers and generators are considered. In reality (as
considered in Reference (22]), changing from reduction gears, couplings and long
shaft runs to generators, motors and relatively short shaft runs would have
potentially large effects on the ship.
4. The reliability characteristics of the reduction gears, shafting, propulsion motors,
propellers, etc. is ignored. This is an oversimplification, but is appropriate here
since the example is for illustrative purposes only.
54

Table 3 summarizes the calculations made for this example. The numbers in the
table represent the probability that the configuration can propel the ship at the indicated
speed at any time. The "As-Is" configuration is the present DDG-51 plant: two shafts,
each powered by two LM2500 gas turbines coupled through a reduction gear. The
following procedure was used in developing Table 3.
1. The "As-Is" numbers were calculated using the availability for the LM2500 only
(0.9391, calculated from Reference [19] data), which is slightly higher than the
LM2500 of Table 1, since the generator is not present. Both shafts were assumed
to be required; one turbine per shaft at a speeds less than 27 knots, two turbines
per shaft at speeds above 27 knots. This is technically not true. One shaft could
propel the ship at a significant fraction of top speed. However, this situation is
not preferred, and is more difficult to analyze. The probabilities were then
calculated using the binomial distribution [Ref 8]. The lower speed numbers
appear low at first glance. The reason is that the probability is not that at least
two of the four gas turbines be available, but that at least one of two for one shaft
and at least one of two for the second shaft be available. Of course, the
probability for the higher speeds is the probability that four of four gas turbines
are available.
2. For the electric drive numbers, the higher power LM2500 unit of Table 1 was
used. The required powers were calculated from the Appendix (C) powering
information as follows: The effective horsepower provided by ASSET is the
power required to push the ship through the water at the indicated speed. The
55

propulsive coefficient is defined as the effective horsepower divided by the total
shaft horsepower (since the propellers are not 100% efficient). The effective
horsepower was divided by the propulsive coefficient to determine the required
shaft horsepower. This was then divided by 0.9 to approximate the losses in the
electrical system between the generators and the propellers. The required power
was then used as the vital load input into SMOKEY.
3. Because of the assumptions made and the procedure used for calculating required
power, the three LM2500 electric drive ship is unable to go 30 knots. More
detailed calculations would be required to access whether this was really true,
since this ship would potentially be at least 80 long tons lighter that the others.
It should be noted that the Appendix (C) information is obtained from ASSET,
and is no actual DDG-51 data. Rather, it is a computer model that has been matched
closely to the existing ship.
Table 3 shows the 4 LM2500 electric drive configuration to be the more reliable
propulsion system. The slightly higher numbers for the As-Is configuration at the
highest speeds is due to the slightly higher availability of the LM2500 without the
generator. Even so, the difference is very small and is more than outweighed by the
superiority of the electric drive configuration at the lower speeds. This is due to the fact
that power from any of the generators can be distributed to either shaft unlike the
mechanical drive arrangement. As stated previously, the lower top speed of the electric
56
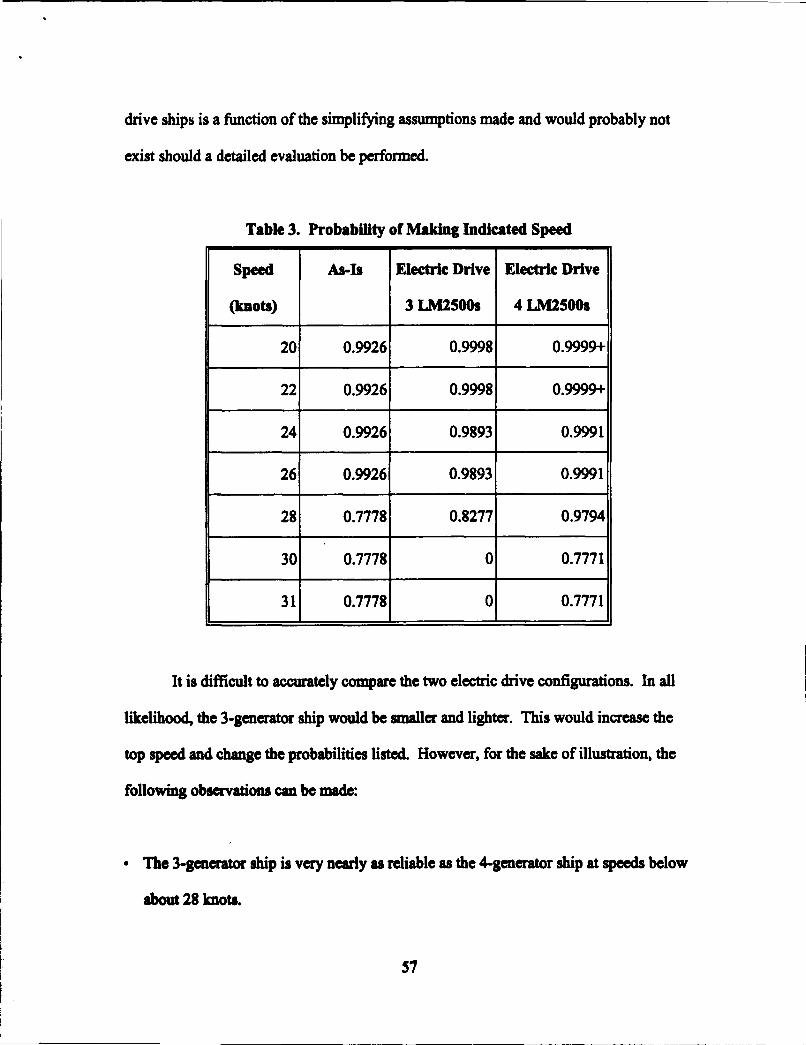
drive ships is a function of the simplifying assumptions made and would probably not
exist should a detailed evaluation be performed.
Table 3. Probability of Making Indicated Speed
Speed As-h Electric Drive Electric Drive
(knots) 3 LM2500s 4 LM2500s
20 0.9926 0.9998 0.9999+
22 0.9926 0.9998 0.9999+
24 0.9926 0.9893 0.9991
26 0.9926 0.9893 0.9991
28 0.7778 0.8277 0.9794
30 0.7778 0 0.7771
31 0.7778 0 0.7771
It is difficult to accurately compare the two electric drive configurations. In all
likelihood, the 3-generator ship would be smaller and lighter. This would increase the
top speed and change the probabilities listed. However, for the sake of illustration, the
following observations can be made:
The 3-generator ship is very nearly as reliable as the 4-generator ship at speeds below
about 28 knots.
57

"* The top speed of the 3-generator ship is somewhat greater than 29 knots, while the top
speed of the 4-generator ship is somewhat greater that 31 knots.
"• The 3-generator plant would be at least 85 long tons lighter than the 4-generator plant,
allowing for 85 long tons more payload.
"• The 3-generator plant would be at least $8.6M cheaper than the 4-generator plant.
The ship designer, then, must decide which is more important: higher top speed or more
payload and lower cost.
Obviously, the current practice of providing enough generating capacity such that
the load can be carried with one generator off line is difficult to apply in the case of
electric drive propulsion. Should the load considered be the maximum speed load, or
something less? In the above example, a fifth LM2500 would be required if the
maximum speed propulsion load were required to be carried with one generator
unavailable, making the propulsion plant more reliable (not to mention expensive) than
the existing ship. SMOKEY gives the designer a tool for accessing potential
configurations in a much more reasonable way.
Integrated Electric Drive DDG-51 Analysis
The next case to be considered is the conversion of the DDG-51 to kagagct
electric drive. That is, electric power from any generator can be distributed to the ship
service system md& the propulsion system. In this example, mixed configurations will
58

be evaluated (i.e. not all generating units identical). While this type of evaluation is
straightforward with SMOKEY, it is very difficult using TIGER or similar analysis tools,
since the plant does not operate according to simple operating rules (i.e. two of three
generators must be operating, etc.).
The analysis was performed as follows:
1. The design ship service electric load was input as the vital load. That is, the
system was required to be able to supply 3990 kW to the ships service system at
all times.
2. The 31 knot propulsion load calculated for the previous example (77,537 kW)
was input as the propulsion load.
3. Several SMOKEY runs were made with various percentages of the propulsion
load selected as the index. The output is then the probability that the electric
plant can supply the design ship service load and the selected percentage of the
propulsion load.
Several configurations were considered, all using the higher power LM2500s.
First, three LM2500s alone, then with one, two, or three Allisons, 2.5 Diesels, or 3.75
Diesels (i.e. 10 combinations). The same combinations were then run again with a fourth
LM2500 added. Only the addition of three 3.75 Diesels significantly changed the
reliability of the plant. The results are summarized in Table 4. Note the three LM2500
59
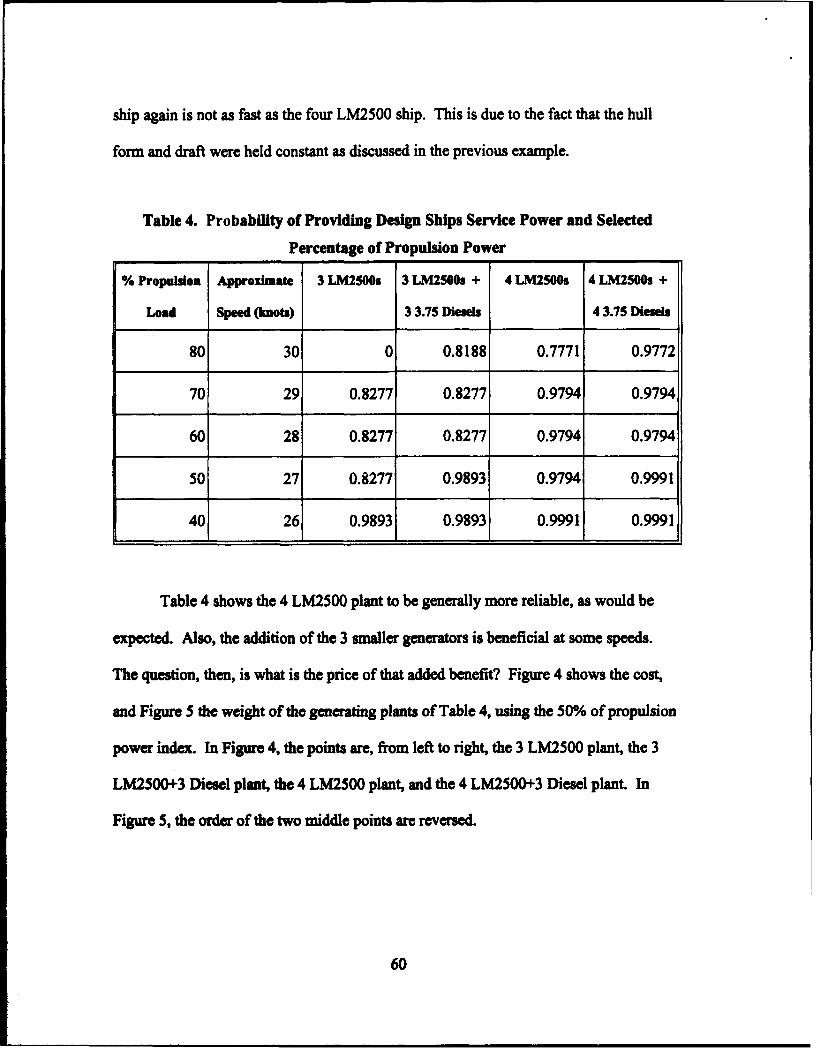
ship again is not as fast as the four LM2500 ship. This is due to the fact that the hull
form and draft were held constant as discussed in the previous example.
Table 4. Probability of Providing Design Ships Service Power and Selected
Percentage of Propulsion Power
% Propulsion Approximate 3 LM2500s 3 LM2500s + 4 LM2500s 4 LM2W50s +
Load Speed (knots) 3 3.75 Diesels 4 3.75 Diesels
80 30 0 0.8188 0.7771 0.9772
70 29 0.8277 0.8277 0.9794 0.9794
60 28 0.8277 0.8277 0.9794 0.9794
50 27 0.8277 0.9893 0.9794 0.9991
40 26 0.9893 0.9893 0.9991 0.9991
Table 4 shows the 4 LM2500 plant to be generally more reliable, as would be
expected. Also, the addition of the 3 smaller generators is beneficial at some speeds.
The question, then, is what is the price of that added benefit? Figure 4 shows the cost,
and Figure 5 the weight of the generating plants of Table 4, using the 50% of propulsion
power index. In Figure 4, the points are, from left to right, the 3 LM2500 plant, the 3
LM2500+3 Diesel plant, the 4 LM2500 plant, and the 4 LM2500+3 Diesel plant. In
Figure 5, the order of the two middle points are reversed.
60

1.0. , x
0.9-
x0.8.
Index0.7-
0.6
0.50,I0 10 PO 40 '0 50
Total Cost
Figure 4. Cost Comparison: DDG-51 with Integrated Electric Drive (Cost In $M)
1.0. x X JK
0.8,Index
0.7.
0.6
"0 1~ t !& 3 t7 4S0 5i% AO
Total Weight
Figure 5. Weight Comparison: DDG-51 with Integrated Electric Drive (Weight in
Long Tons)
The following observations can be made from Figures 4 and 5:
The 4 LM2500 + 3 Diesel plant is the most reliable, but is also the most expensive
ud heaviest.
61

"• The cost of the 4 LM2500 plant is nearly the same as the 3 LM2500 + 3 Diesel plant,
and the latter is slightly more reliable. However, the latter is heavier.
"* The 3 LM2500 plant is the cheapest and lightest, but is the least reliable.
Based on the above, the best plant (under the assumptions previously discussed)
would be either the 4 LM2500 plant or the 3 LM2500 + 3 Diesel plant, depending on the
relative importance of weight and cost. In either case, the total number of generators is
reduced (as compared to the current DDG-51) by converting to integrated electric drive.
Again, the "all but one" rule is difficult to apply, especially since the generators
are of different sizes. SMOKEY makes this evaluation easily, and gives the designer the
information necessary to make a logical decision.
Heavy Lift Ship Concept Design Analysis
The preceding examples have gone from very simple to more involved
applications of SMOKEY, in order to introduce the reader to the capabilities of the
program. The following example is intended to show how SMOKEY can be used during
the early stages of a ship design.
The Heavy Lift Ship, designated HL(X), concept design is a graduate student
design project currently in progress in the Ocean Engineering Department at M.I.T.
Refereace [23] reported on the progress of the design at approximately the halfway point
62

in the project. The ship is intended to transport and support four mine countermeasures
ships to and from a hostile area for mine clearing operations. The ship has a large well
deck for this purpose, and enough ballast tankage to allow submergence of the well deck
to approximately twenty feet.
Because of the required layout of the ship and various safety factors (discussed in
detail in Reference [23]), it was decided early on to use an integrated electric drive
propulsion plant. This type plant is quite beneficial for this ship since the major
electrical loads occur during different evolutions. The major loads on the plant consist of
propulsion, ships service, repair shops, ballasting pumps, and providing power to the
ships in dock or alongside. However, these loads do not all occur simultaneously. For
example, at sea the load consists of propulsion, ships service loads, and providing power
to the ships in dock. During a docking evolution, the load consists of ballast pumps and
ships service. Because of the integrated electric drive arrangement, the plant can be
designed for the worst case evolution (underway, since the propulsion load is by far the
largest), and not for the total combination of all worst case loads.
Since the ship is big and expensive, it was also decided to use the common
modules defined as part of the affordability through commonality program mentioned
previously to reduce cost. That means the generating units available for use were the
third, fifth and sixth units of Table 1.
63

The evaluation of alternate generator combinations for the selection of the HL(X)
propulsion plant was performed as follows:
1. The propulsion load was estimated based on the Appendix (C) ASSET output in
the same manner as for the DDG-51 propulsion load discussed earlier. Since the
primary mission of the ship is to transport the mine countermeasures ships at a
speed of 16 knots, it was considered appropriate to use this load in the reliability
calculation. The 16 knot load was calculated to be 18,179 kW, which includes a
fixed load of 250 kW for motors, fans, etc. required by the propulsion plant.
2. The total connected ship service loads were calculated in Appendix (D), also
based on the Appendix (C) ASSET output.
3. The ships service loads were placed into two groups, depending on the relative
importance of supplying them under worst case conditions. Group 1 consists of
firemain loads (firemain is the water system used for damage control, etc.),
lighting, and ventilation (total connected load=4912 kW). Group 2 consists of
heating/cooling loads, fresh water production and heating, and handling and
services loads (total connected load--9465 kW).
4. A suitable reliability index was determined to be the probability that the plant
could supply the electrical load of the four ships in dock (400 kW), 100% of the
16 knot propulsion load, 65 % of the Group I ship service load, and 35% of the
Group 2 ship service load.
5. SMOKEY was used to calculate the reliability index by inputting the Group I
load as the Damage Control load, Group 2 as the Combat System load (the ship
64
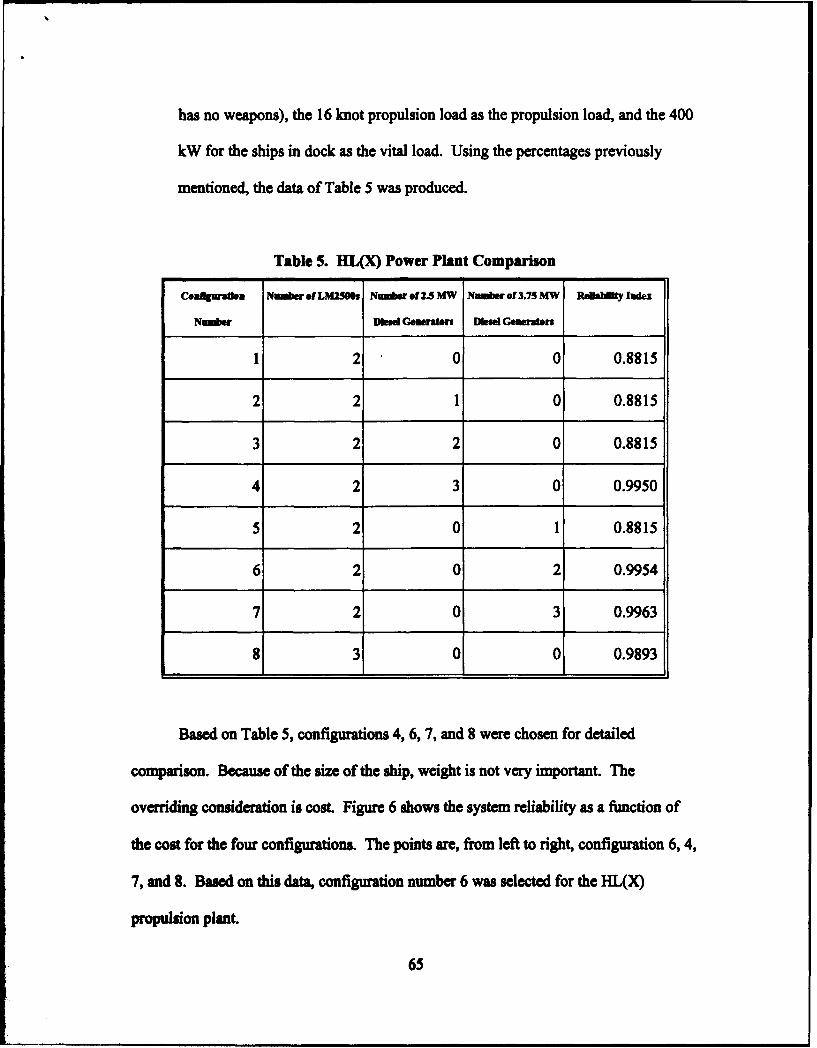
has no weapons), the 16 knot propulsion load as the propulsion load, and the 400
kW for the ships in dock as the vital load. Using the percentages previously
mentioned, the data of Table 5 was produced.
Table 5. HL(X) Power Plant Comparison
Coeafgurade. NuimberoftLM29S N=Iwur12.5SMW Numberof3.75MW ldahilty Index
Nnumer Ukod Generaten Diesel Generators
1 2 0 0 0.8815
2 2 1 0 0.8815
3 2 2 0 0.8815
4 2 3 0 0.9950
5 2 0 1 0.8815
6 2 0 2 0.9954
7 2 0 3 0.9963
8 3 0 0 0.9893
Based on Table 5, configurations 4, 6, 7, and 8 were chosen for detailed
comparison. Because of the size of the ship, weight is not very important. The
overriding consideration is cost. Figure 6 shows the system reliability as a function of
the cost for the four configurations. The points are, from left to right, configuration 6, 4,
7, and 8. Based on this data, configuration number 6 was selected for the HL(X)
propulsion plant.
65
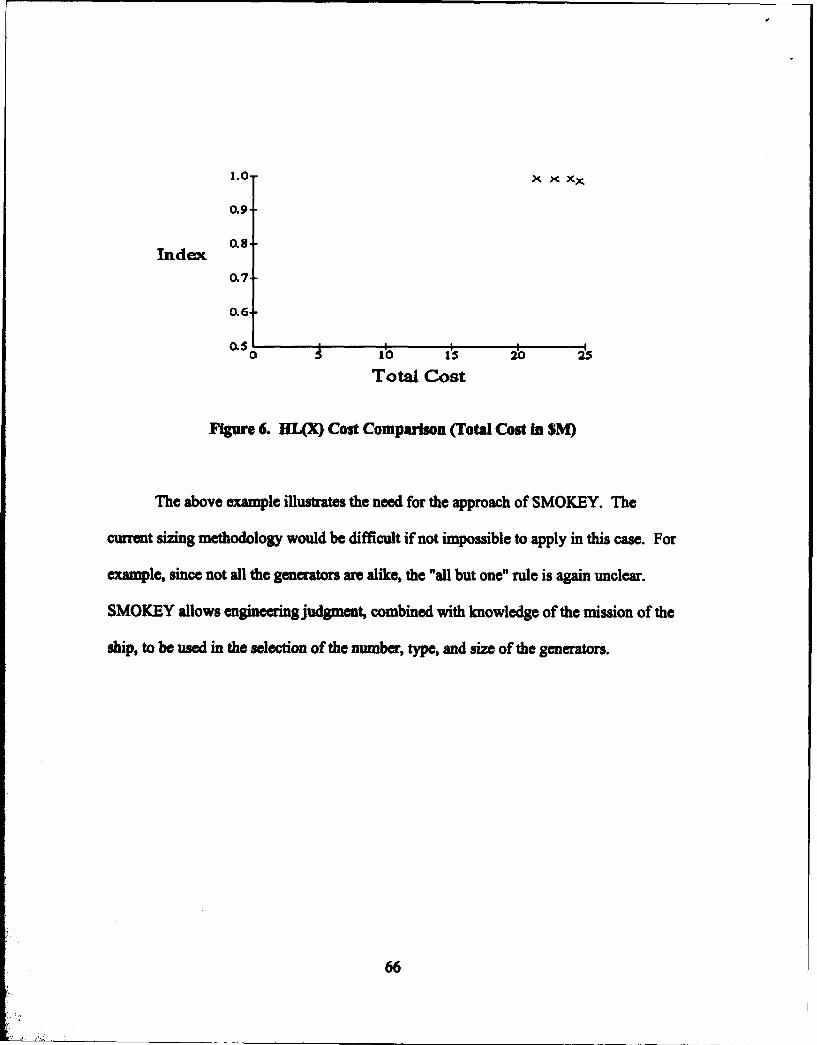
1.0 )( x x
0.9
Index0.7
0.6-
0 0 15 2'025
Total Cost
Figure 6. HL(X) Cost Comparison (Total Cost In $M)
The above example illustrates the need for the approach of SMOKEY. The
current sizing methodology would be difficult if not impossible to apply in this case. For
example, since not all the generators are alike, the "all but one" rule is again unclear.
SMOKEY allows engineeringjudgment, combined with knowledge of the mission of the
ship, to be used in the selection of the number, type, and size of the generators.
66

Chapter 6. Conclusions and Recommendations
The current methodology for sizing Naval ship electric plants has produced
satisfactorily operating plants. However, there are shortcomings which are eliminated by
the methodology proposed here, using SMOKEY:
1. The use of integrated electric drive. There is no "load factor" defined for the
propulsion loads. What load should be used? SMOKEY allows the designer to
select a proportion of the propulsion load appropriate to the mission of the ship
being considered. SMOKEY also allows the reliability at different speeds to be
computed for consideration by the designer.
2. The overall reliability of the generating system. The only requirement for
reliability of the electrical generating system inherent in the current sizing
methodology is the requirement that the plant be able to supply the estimated
worst case load with one generator not available. This "all but one" rule is
difficult to apply in cases where there is more than one type or size of generator
present (such as the heavy lift ship presented in Chapter 5). Also, different types
of generators (i.e. gas turbine driven versus diesel driven) have different
reliability characteristics, which are not considered in the current methodology.
Generators with higher availabilities would make the system more reliable, but
might be undesirable for other reasons (heavier or more expensive). SMOKEY
allows the designer to evaluate and compare configurations in terms of overall
67

system availability, cost, weight, and total number of generators (which is a
measure of system complexity). SMOKEY also allows the comparisons to be
made on systems consisting of different types and sizes of generators.
In conclusion, the methods demonstrated here using SMOKEY are an
improvement to the current methodology. However, there are outstanding issues which
must be addressed before the method can be implemented wholesale by the Navy:
1. Acceptable percentages of the total loads in the three categories used by
SMOKEY (propulsion, combat systems, and damage control) need to be defined.
The combat systems and damage control load percentages could be determined by
analyzing current ship designs and comparing total connected loads to actual
loads during different operating conditions. These would most likely be different
for different classes of ships, so the analysis would be time consuming and
require extensive amounts of data. The propulsion load percentage would most
likely be determined on a case basis, depending on the mission of the ship.
2. A method for accounting for the presence of pulsed-power weapons should be
developed. Most likely, this would involve separately analyzing the plant during
operation of the weapon (since large amounts of power during some charging
time would be required) and without operation of the weapon. In the case of a
ship with integrated electric drive propulsion, operation of the weapon might
involve a reduction in speed during the charging cycle.
68

3. Fuel consumption should be addressed earlier in the design process. Currently,
the fuel required to be carried on board is based on the fuel consumption of the
propulsion and ship service electrical generator engines at a single load value. In
a ship with integrated electric drive propulsion, this calculation becomes even
more difficult since power from any generator can be used for propulsion ando
ships service electrical loads, causing the operating points to vary. The required
fuel calculation method should be reevaluated for electric drive ships.
There are also improvements which can be made to SMOKEY (which the author
did not have time to do) which would improve the usability and usefulness of the
program:
1. The limit on the number of generators which can be entered into a single
configuration should be removed. Some very large ships (such as aircraft
carriers) might conceivably require more than twelve generators.
2. The limit on the number of configurations which can be evaluated and plotted in
a single run should be removed, since it was an arbitrary limit based on the
graphical output. The user should be allowed to try as many plant configurations
as desired, then rerun the program with the best candidates if the graphs are too
busy.
3. The program should be revised to allow restarting without exiting totally. This
would save time (and aggravation on the part of the user) when evaluating several
loading cases.
69

4. The capability to input a ship operating profile rather than a single load index
should be considered. This would complicate the program, but would provide the
designer an additional basis for comparison between plants with similar reliability
characteristics at the single load index chosen. This would probably be most
appropriate for auxiliary ships, since there operation is much more predictable
than a combatant and a reasonably accurate operating profile could be developed.
5. The program should consider fuel consumption. This is a difficult problem
because of the complex way in which fuel requirements are presently calculated.
Therefore, this improvement would probably best be made after the fuel
requirement calculation method was reevaluated for electric drive ships.
6. The program should consider the area and volume required by the generators, as
well as the cross sectional areas of the intakes and exhausts. The total area and
volumed required by the plant are important factors in the design of a ship, and
should also be used when comparing candidate configurations.
Overall, the methodology of SMOKEY is sound and removes some of the
weaknesses of the current method. More work is necessary, however, for the program to
be made fully applicable and usable for all ships.
70

References
[1] Doerry, N.H., "Advanced Numerical Methods for Simulating Nonlinear
Multirate Lumped Parameter Models," Thesis, Ph.D., M.I.T., May 1991.
[2] Amy, J.V., "Composite System Stability Methods Applied to Advanced
Shipboard Electric Power Systems," Thesis, Ph.D., M.I.T., May 1992.
[3] Whitcomb, C.A., "Composite System Analysis of Advanced Shipboard
Electrical Power Distribution Systems," Thesis, Engineer, M.I.T., May 1992.
[4] Department of Defense, Interface Standard for Shipboard Systems, Section
300A, Electric Power, Alternating Current, MIL-STD-1399(NAVY), 13 October 1987.
[5] NAVSEA Technical Manual TE660-AA-MMD-010, TIGER Users Manual,
Version 8.21, September 1987.
[6] Fink, D. and H. Beaty, Standard Handbook f&r Eletic Engjn 12th
Edition, McGraw Hill, 1987.
[7] Billinton, Roy and Ronald N. Allan, Lliabily Assesmnt gf Lag Electric
PoSwer Kluwer Academic Publishers, 1988.
[8] Billinton, Roy and Ronald N. Allan, RliabiliIX Evaluation of EUSUgindg
sxm6 an wd Ighnig Plenum Press, 1983.
[9] Billinton, Roy and Ronald N. Allan, kijailil Evaluation of Power
Sxuma Plenum Press, 1984.
[10] Kelley, K., "Some Economic Principles for Pricing Wheeled Power,"
NRRI-87-7, 1987.
71

[I I] Course Notes for M.I.T. Course 13.412, Principles of Naval Ship Design,
Fall Semester 1991.
[12] Graham, C. and J. Hamly, "Simplified Math Model for the Design of Naval
Frigates," Revision 3, 1 August 1991.
[13] Department of the Navy Design Data Sheet 310-1, Electrical System Load
and Power Analysis for Surface Ships, 1 July 1980.
[14] Gibbs and Cox Drawing Number 3003-0005 Revision M, DDG-51 Electric
Load Analysis, 20 September 1988.
[15] Ship System Status Program, USS JOHN F. KENNEDY (CV 67) Electrical
System Baseline Report, 4 June 1991.
[16] Draft Report: Advanced Electrical Systems for Future Navy Surface
Combatants, Westinghouse Electric Corporation, 18 June 1992.
[17] Microsoft Visual Basic Programming System for Windows, Version 2.0,
Programmers Guide, 1992.
[18] Drake, Alvin W., Fundamentals of Applied Probability Theory,
McGraw-Hill, 1967.
[19] Naval Sea Systems Command Report 05MR-004-84, DDG-51 Guided
Missile Destroyer Contract Design Reliability, Maintainability, Availability Analysis,
September 1984.
[20] Carmichael, A.Douglas, Mark A. Hugel and Mark T. Stanko, Report
Number 92-4, "Naval Propulsion Systems: An Evaluation of Alternative Technologies,"
Department of Ocean Engineering, M.I.T., October, 1992.
72

[21] Course Notes for M.I.T. Course 13.21, Ship Power and Propulsion, Fall
Semester 1990.
[22] St John, L.G., "Analysis of Superconducting Machines for Naval Ship
Propulsion," Thesis, Engineer, M.I.T., May 1978.
[23] Keenan, P.J., D.M. McGee, J.J. McGlothin, "Heavy Lift Ship Design
Project," February 1993.
73

Appendix A. SMOKEY Source Code
'Smokey 1.0 was originally written in Microsoft Visual Basic 1.0 by J.J. McGlothin'as part of a Masters Thesis in Electrical Engineering at MIT'during the time period November 1992 to January 1993.During January 1993, the program was transfenr to Visual Basic 2.0 to'facilitate the addition of the graphing routines.Version 1.0 of this program was completed 16 January 1993. Additional effort'is required to create online help if necessary.This program uses the graphing routine supplied with the Professional Version'of Visual Basic 2.0, and therefore requires the following files (in addition'to Windows and the executable file SMOKEY.EXE) to run:
GRAPH VBXGSW.EXEGSWDLL.DLL
These files, as well as the Visual Basic Run-Time Library file (VBRUN200.DLL)'should be placed in the Microsoft Windows \SYSTEM subdirectory or'the subdirectory where SMOKEY.EXE is located.
Global WepLoad As SingleGlobal PropLoad As SingleGlobal DCLoad As SingleGoa VtLoad As SingleGlobal NVLoad As SingleGlobal TotLoad As SingleGlobal M As IntegerGlobalNAs bnegGlobal TotCap(l To 10) As SingleGlobal ToICost( To 10) As SingleGlobal TotWt(1 To 10) As SingleSNumGen(l To 10) As SingleGlobal Prob(l To 10) As SingleGlobal ProbReadout As String * 7
0Memry management fincions for determining system infrmation'displayed in the About Dialog
'Returns the cuarren system configurations faDeclve Function GetWinFlags Lib "k er 0 As Long
'I Rtrns the Ibe of fiv. bytes in the global hegDecar Functionm Gt Spew Lib "kenel" (ByVal fahg%) As Long
'System configuration flapsGlobel Coast WFCPU286 - &H2&Global Cont WFCPW$J36 - &H4&Global Coast WFCPU4$6 - &•HSOb"l Coast WF.T.ANDARD - &HIO&Gloa Coast WF..NHANCED - &HT0&Gloal Coan WF-_Ox$7 - &H400&
74
Begin Form CopyrBackColor - &HOOCOCOCO&BorderStyle - 0 'NoneCaption = "Smokey"ControlBox - 0 UFalseHeight - 2745Icon - COPYRLFRX:0000Left =210LinkMode - I 'SourceLinkTopic "Formi"MaxButton 0 ValseMinButton 0 'FalseScaleHeight 2340ScaleWidth 4200Top - 3150Width - 4320Begin Timer Timerl
Interval - 2000Left -240Top -240
EndBegin Image Image2
Height - 40Left -3240Picture - COPYI.FRX-0302Top -1200Width - 480
EndBeginlImagelImagel
Height - 480Left -480Picture - COPYR.FRX0604Top -1200Width -480
EndBegin Label Label2
BackColor - &HOOCOCOCO&Caption -"J.J.MGohi
Height -255Left -1440TabIndex - 1Top -1560Width - 1335
EndBeg Label Labell
BackCokor - &HOOCOCOCO&Caption - "Copyrit 1993"Hdgh -255Left -1440Tablnda -0TOp -1080Width - 1335
Bad
Be&n La LabWr3
75

BackColor - &HOOCOCOCO&Caption - "Smokey Version 1.0"FontBold - -1 TrueFontItalic - 0 'FalseFontName - "MS Sans Serif"FontSize - 9.75FontStrikethru 0 FalseFontUnderline - -1 TrueHeight - 495Left 1080Tablndex - 2Top -360Width - 2175
EndEndThis form is the startup form which displays the program name and version and Copyright information.'The form is displayed about 2 seconds, then starts the program by loading the load information form.
Sub CommandlCiick 0M-1LOADFRM.ShowUnload Copyr
End Sub
Sub TimerlTimer 0M-1LOADFRM.ShowUnload Copyr
End Sub
76
Begin Form LoedfrmCaption - "Load Information"Height - 5910Icon - LOADFRM.FRXO0000Left =1440LinkMode - I 'SourceLinkTopic , "Form3"MaxButton = 0 FalseScaleHeight = 5220ScaleWidth = 4815Top - 1095Width = 4935Begin CommandButton Commandl
Caption = "OK"Default - -1 TrueHeight - 615Left -1440TabIndex = 6Top =4440
Width = 1935EndBegin TextBox NVText
Height - 495Left -2040Tablndex - 5Top - 3720Width - 1815
EndBegin TextBox VitText
Height - 495Left -2040TabIndex = 4Top -3000Width - 1815
EndBegin TextBox DCText
Height 495Left -2040Tablndex - 3Top f2280Width - 1815
EndBegin TextBox PrpText
Height - 495Left -2040TabIndex = 2Top -1560Width - 1815
EndBegin TextBox WepText
ih -495Left -2040TabIndex - ITop -840
77
Width - 1815EndBegin Label Label6
Caption - "kw"Height - 255Left -4080Tablndex = 11Top = 3840Width = 375
EndBegin Label Labell 1
Caption - "Non-Vital"Height - 255Left -480TabIndex = 16Top -3840Width = 855
EndBegin Label LabelS
Caption - "kw"Height - 255Left -4080Tablndex - 10Top - 3120Width - 375
EndBegin Label LabellO
Caption - witar"Height - 255Left -720Tablndex - 15Top - 3120Width - 495
EndBegin Label Label4
Caption - "kIwHeight - 255Left -4080Tablndex - 9Top -2400Width - 375
EndBegin Label Label9
Caption 'Dmag Conuol-Height -255Left -240Tablndex - 14Top -2400Width - 1455
EndBne Label Lab@13
Capion -qkw"Hogt -255LeA -4080
78
TabIndex = 8Top - 1680Width - 375
EndBegin Label Label8
Caption - "Propulsion"Height - 255Left -480TabIndex = 13Top - 1680Width - 975
EndBegin Label LabeI2
Caption - 'kw"Height - 255Left -4080TabIndex - 7Top -960Width - 375
EndBegin Label Label7
Caption - "Combat Systems"Height - 255Left -240TabIndex - 12Top -960Width - 1455
EndBegin Label Labell
Caption - "Input All Loads in KW"Height - 255Left -1200Tablndex - 0Top -240Width - 1935
EndBegin Menu File
Caption - "&File"Begin Menu Exit
Captim - "E&xit"End
EndBegin mnHelp
Caption - "&HeWp"Begin Menu About
Caption - "&About"End
EndEnd"Mbis fin inputs the eletical load inftrmaon.
Sub AbouLCUCk 0Dispay te Infmation bnrm.*mAbouLShow
79
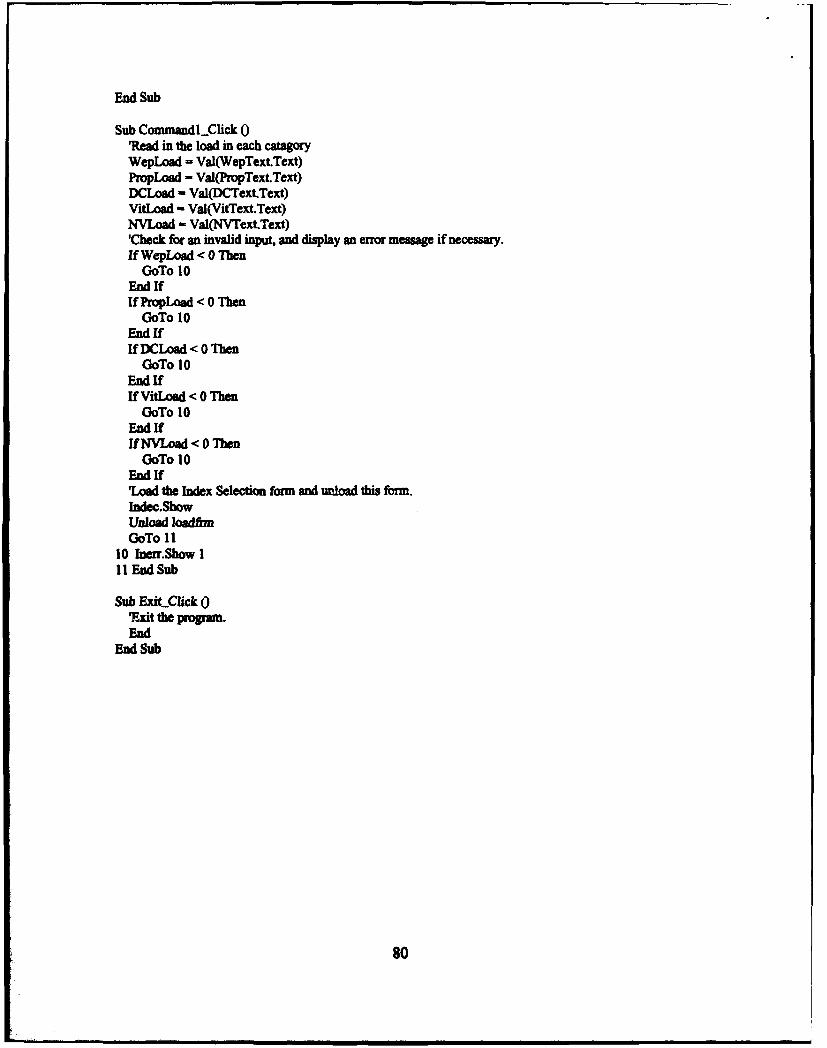
End Sub
Sub CommandlClick 0'Read in the load in each cataMgoryWepLoad - Val(WepText.Text)PropLoad = Val(PropText.Text)DCLoad - Val(DCText.Text)Vitdoad Val(VitText.Text)NVYAad - Val(NVText.Text)'Check for an invalid input, and display an error message if necessary.If WepLoad < 0 Then
GoTo 10EndlfIf PropLoad < 0 Then
GoTo 10EndIfIf DCLoad < 0 Then
GoTo 10EndlfIf VitLoad < 0 Then
GoTo 10EndlfIfNVLoad < 0 Then
GoTo 10Endlf'ad the Index Selection form and unload this fobm.Indec.ShowUnload loadfrmGoTo 11
10 Inerr.Show I11 End Sub
Sub ExitClick 0TAit the program.End
End Sub
8o

Begin Form IndecBorderStyle = I 'Fixed SingleCaption "Select Index"Height - 5265Icon - INDEC.FRX:0000Left = 1905LinkTopic = "Form2"MaxButton = 0 'FalseScaleHeight - 4575ScaleWidth - 4335Top -1095Width - 4455Begin CommandButton Commandl
Caption - "OK"Default = -I 'TrueHeight = 495Left - 2520TabIndex - 11Top -3600Width - 1455
EndBegin TextBox Text8
BorderStyle - 0 'NoneHeight - 855Left -480MultiLine - -1 'TrueTabIndex - 10Text - "Note: Vital Loads are automatically included in the total."Top -3480Width - 1575
EndBegin TextBox Text7
BorderStyle - 0 'NoneHeight - 255Left -120TabIndex - 9Text - "Damage Control"Top - 2880Width - 1575
EndBegin TextBox Text6
BorderStyle - 0 'NoneHeight - 255Left -120Tablndex - 8Text - "Propulsion"Top -2040Width - 1575
EndBegin TextBox Text5
BordaStle - 0 'Nneight - 255
Left -120TabIndex -7
81
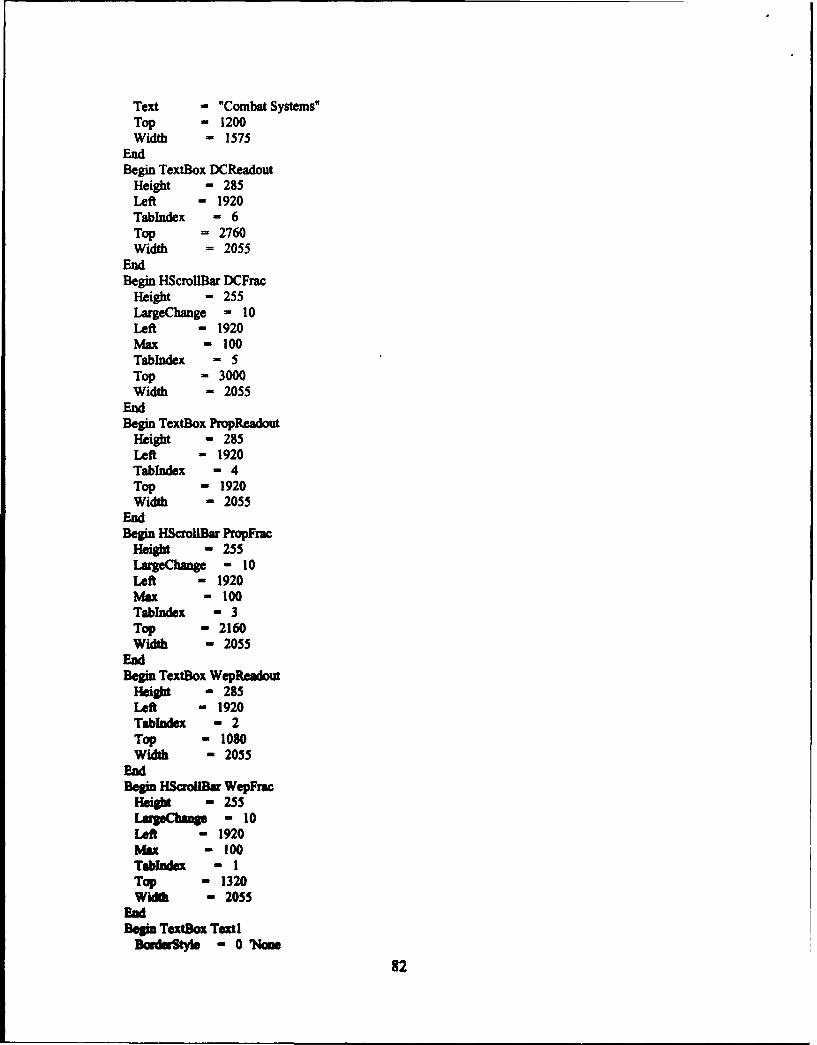
Text - "Combat Systems"Top - 1200Width - 1575
EndBegin TextBox DCReadout
Height - 285Left - 1920TabIndex - 6Top =2760Width = 2055
EndBegin HScrollBar DCFrac
Height - 255LargeChange = 10Left - 1920Max -100TabIndex - 5Top -3000Width - 2055
EndBegin TextBox PropReadout
Height - 285Left - 1920TabIndex - 4Top - 1920Width - 2055
EndBegin HScrollBar PropFrac
Height - 255LargeChange - 10Left - 1920Max -100TabIndex - 3Top -2160Width - 2055
EndBegin TextBox WepReadout
Height - 285Left - 1920TabIndex - 2Top -1080Width - 2055
EndBegin HScrollBw WepFrac
Height - 255LaeChang - 10Left - 1920Max -100Tablndex - ITop - 1320Width - 2055
EndBegin TextBox Teti
Dodrty - 0 aiM
82

Enabled = 0 'FalseHeight 735Left =120MultiLine = -I 'TrueTabIndex = 0Text - "This program will compute the probability that the configuration input will be able
to supply the selected percentages of the total load:"Top = 120Width = 4095
EndBegin Menu File
Caption - "&File"Begin Menu Exit
Caption = "E&xit"End
EndBegin Menu Help
Caption - "&Help"Begin Menu About
Caption - "&About"End
EndEndThis form allows the user to select the desired relvwbfty index.
Sub AboutClick 0'Display the information form.frmAbout.Show
End Sub
Sub CommandlClick 0'Compute the total loadTempLoad - (WepFrac.Value * WepLod + PropFrac.Value * PropLoad + DCFrac.Value * DCLod)TotLoad - TempLoad / 100 + VitLoadN-I'Display the Generawo Input form and unload this form.Genfrm.ShowUnload Indec
End Sub
Sub DCFracChag 0'Select and display the percentage of Dumae Control load to be included in the total load.DClaadouLText - Forma&*(DCFrc.Value)
End Sub
Sub ExitClick 0Exft the progna.End
End Sub
Sub PropFracf•hoge 0'Select md display the percentage of propulsion load to be included in the total load.PRepladouText - FodMVA(PropFrc.Value)
End Sub83

Sub WepFracChange 0'Select and display the percentage of combat systems load to be included in the total load.WepReadout.Text - Format(WepFrac.Value)
End Sub
84
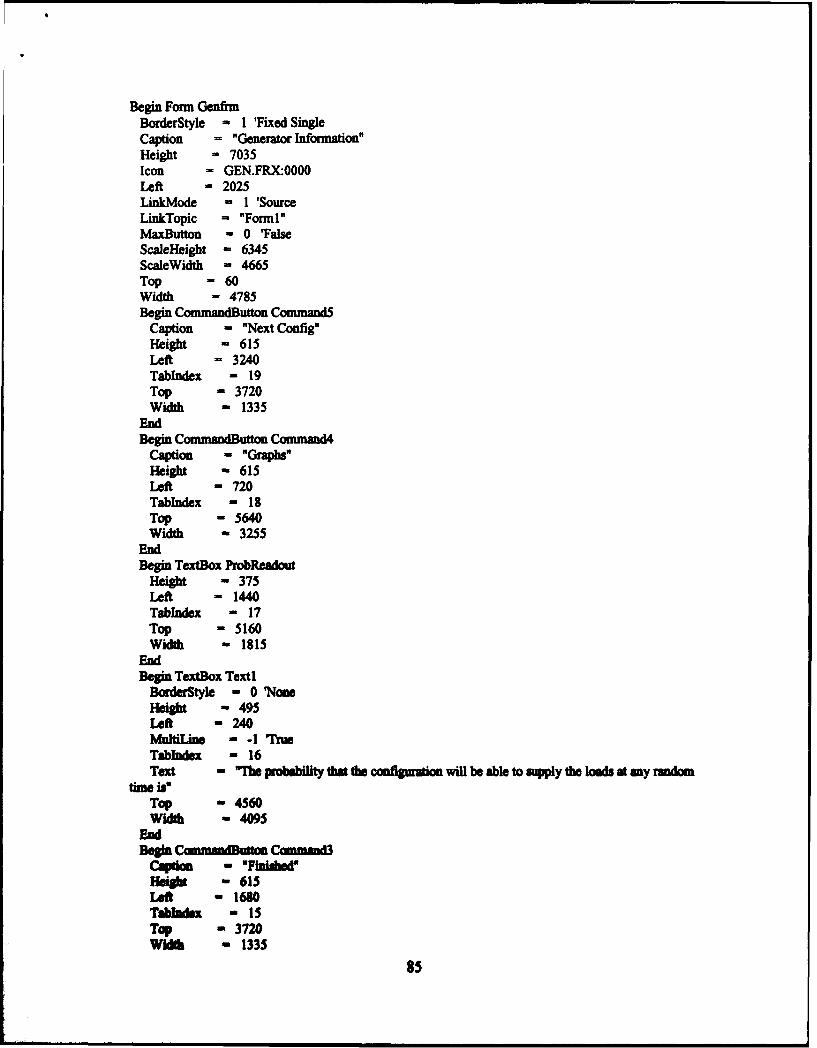
Begin Form GenfrmBorderStyle = 1 Fixed SingleCaption = "Generator Information"Height - 7035Icon = GEN.FRX:0000Left = 2025LinkMode -1 'SourceLinkTopic "Forml"MaxButton - 0 'FalseScaleHeight - 6345ScaleWidth - 4665Top -60Width - 4785Begin CommandButton Command5
Caption - "Next Config"Height - 615Left =3240TabIndex m 19Top - 3720Width - 1335
EndBegin Commandutton Command4
Caption - "Graphs"Height - 615Left - 720Tablndex - 18Top - 5640Width - 3255
EndBegin TextBox ProbReadout
Height - 375Left -1440Tablndex - 17Top -5160Width - 1815
EndBegin TextBox Texti
BorderStyle - 0 'NoneHeight - 495Left -240MultiLine - -1 'TrueTablndex - 16Text - The prmobility that the configuraton will be able to supply the loads at any random
tifm e ITop -4560Width - 4095
EadBe&a • Cmmd3
Caption - 'Finidud"Hteit - 615Left -1680TabIiune - 15Top -3720Widt - 1335
85
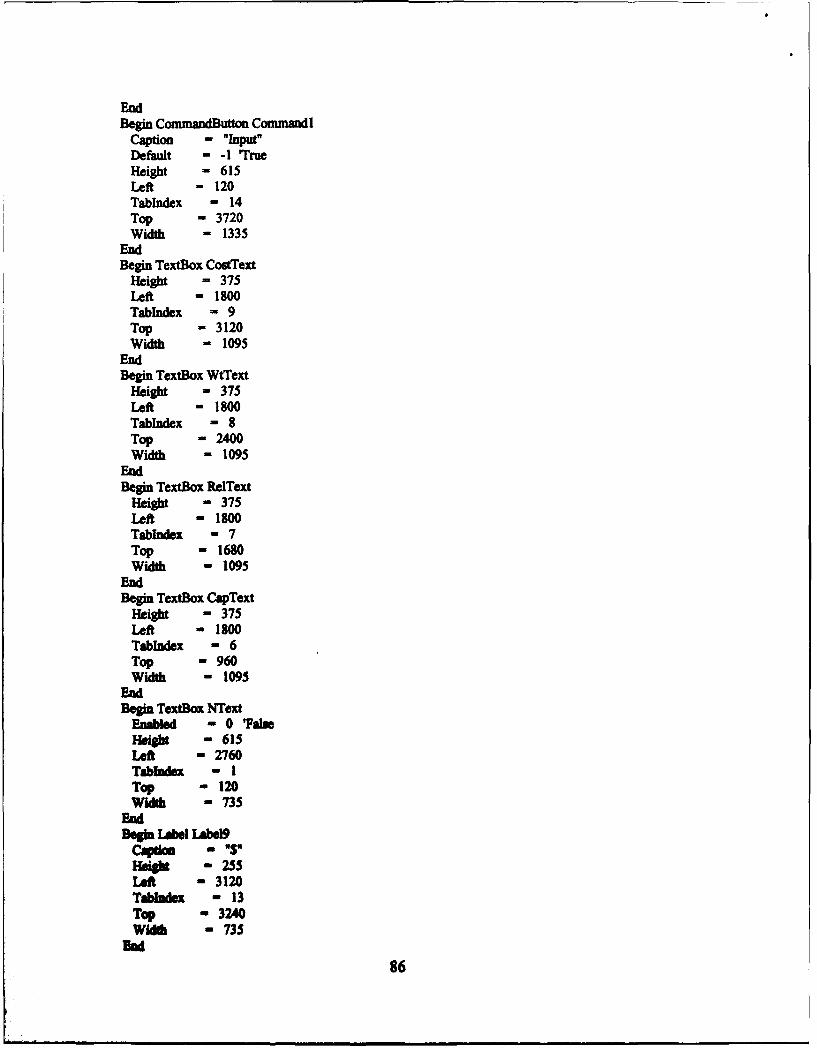
EndBegin CommandButton Commandl
Caption - "Iaput"Default - -1 'TrueHeight - 615Left -120Tabindex - 14Top - 3720Width - 1335
EndBegin TextBox CostText
Height = 375Left -1800TabIndex = 9Top - 3120Width = 1095
EndBegin TextBox WtText
Height - 375Left -1800TabIndex - 8Top -2400Width - 1095
EndBegin TextBox RelText
Height - 375Left -1800TabIndex - 7Top -1680Width - 1095
EndBegin TextBox CapText
Height - 375Left -1800TabIndex - 6Top -960Width - 1095
EndBegin TextBox NText
Enabled - 0 TalseHeight - 615Left -2760Tabbndex - 1Top -120Width -735
EadBeg Label LA•bS
Capt" -Heigt -255Left 3120Tabledux - 13Top -3240Wida - 735
lad86
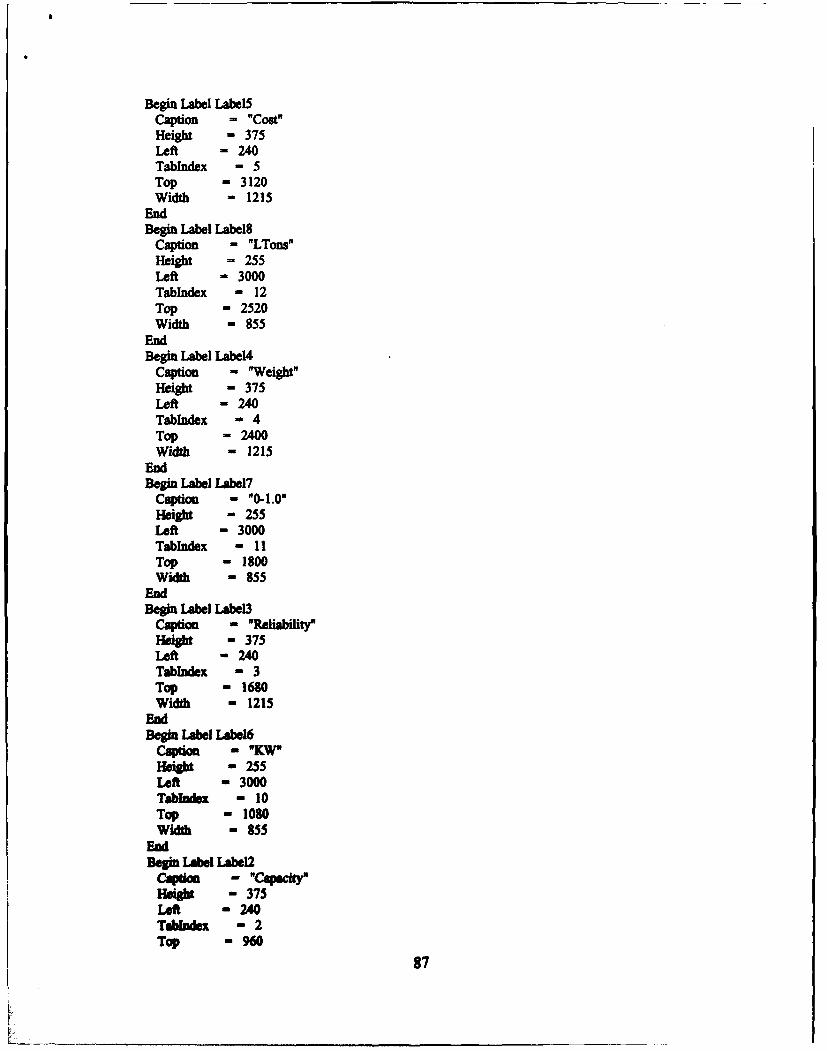
Begin Label LabeLSCaption = "Cost"Height = 375Left -240TabIndex - 5Top - 3120Width - 1215
EndBegin Label Label8
Caption - "LTons"Height - 255Left -3000TabIndex - 12Top - 2520Width - 855
EndBegin Label LabeI4
Caption - "Weight"Height - 375Left -240TabIndex - 4Top -2400Width - 1215
EndBegin Label Label7
Caption - "0-1.0"Height - 255Left -3000TabIndex - 11Top - 1800Width - 855
EndBegin Label LabeI3
Caption "Reliabiity"Height - 375Left -240Tablndex - 3Top -1680Width - 1215
EndBegin Label Labe16
Caption -KWHeight - 255Left -3000Tablndex - 10Top -1080Width - 855
EndBegin Label Label2
eh - 375Left -240Tabladex -2Top -960
87
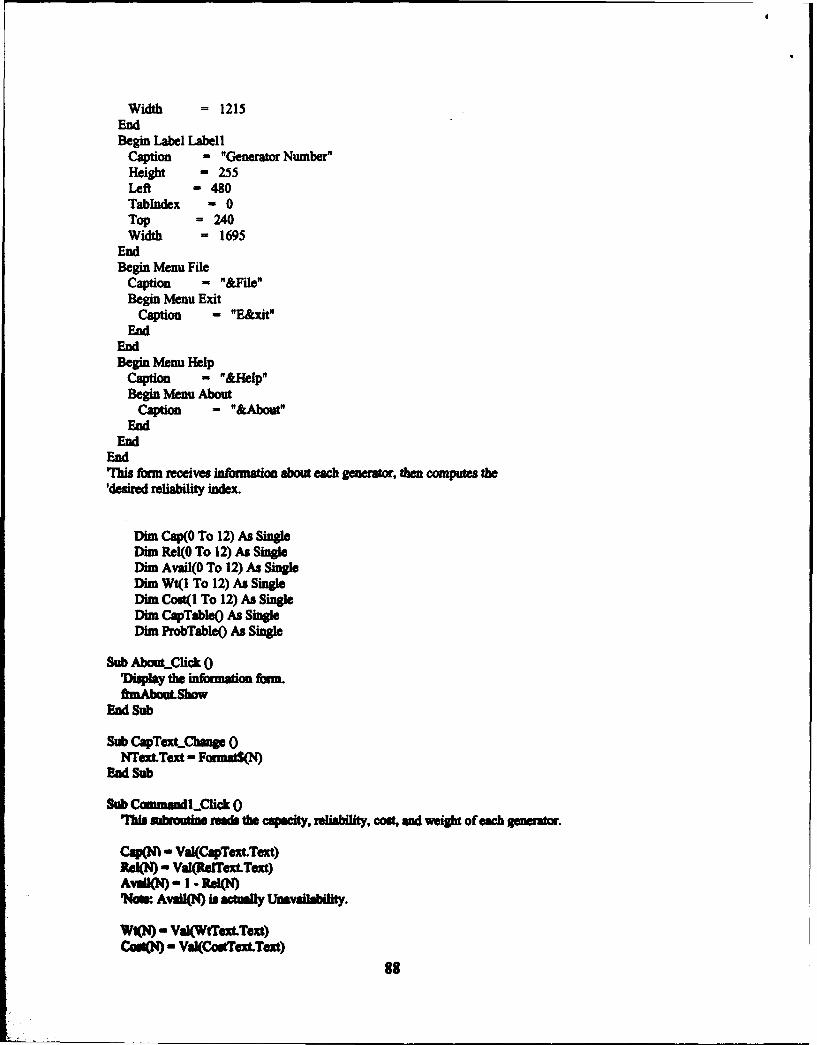
Width = 1215EndBegin Label Labell
Caption - "Generator Number"Height - 255Left -480Tablndex w 0Top =240Width = 1695
EndBegin Menu File
Caption - "&File"Begin Menu Exit
Caption - "E&xit"End
EndBegin Menu Help
Caption - "&&Help"Begin Menu About
Caption - "&About-End
EndEnd"7his ftm receives information about each generator, then computes the'desired reliability index.
Dim Cap(0 To 12) As SingleDim Rel(0 To 12) As SingleDim Avail(0 To 12) As SingleDim Wt(t To 12) As SingleDim Cost(1 To 12) As SingleDim CapTableo As SingleDim ProbTableO As Single
Sub About-Click 0'Dis the Wnmation frm.f.mAboutSbow
End Sub
Sub CapTen-Chage 0NrextText - Formal S
End Sub
Sub CommmalClick 0'kmtois gb inab redsoh capacity, reliability, couok and weight of each generator.
CrIP4 = Val(CapTexText)R = V& rrelTexLText)AYM =- I -Rel(N)'NoW: Avi(N) is actmaly Unaail ity.
WOO - VSl(WtTGextOT )C41M w- Val(Co9at.eText)
88

'Display an error message if any parameter input is invalid.
If Cap(N) <= O# Then GoTo 12
If R�1(N)> 1# Then GoTo 12
If R�l(N) <= O# Then GoTo 12
If Wt(N) < O# Then GoTo 12'Display the information.CapText.Text = Format$(Cap(N))RelText.Text = Foimat$(Rel(N))WtText.Text - Format$(Wt(N))CostText.Text - Format$(Cost(N))¶[ncrement N by I to get ready for the next generator.N-N+ IlEN- 13 Then
'Display an error message if the mix number of generators per configuration (12) is exceeded.Generr. Show
End IfNText.Text = Format$(N)GoTo 13
12 Inerr.Show
13 End Sub
SubCoinmand3_CickO'This subroutine calculates the reliability index for the configuration inputDimiAsintegerDim J As IntegerDimKAslntegerDim L As IntegerDimlRAslntegerDim Start As IntegerDim StopLoop As IntegerDim Stoplt As IntegerDim CapSum As SingleDim CostSum As SingleDim WtSum As Single'Sub�act I from the number of generator. since I was added at the end of the input subroutine.N-N-i'Calculate the total capacity, coat, and weight of the configuration input.Dim Upliniit As IntegertJpljmj�m(2A�1RaDim CapTable(O To Uplimit) As SingleReDim ProbTable(O To Uplimit) As SingleFor i - I To N Step I
CapSum - CapSum 4- CapQ)CoatSwn - �ostSwn + Cost(i)WtSum - WtSuin + Wt(l)
Nexti�DIapIay an error message if you don't have enough capacity.If ToeLoad> CapSum Then Earor2.Show I
89
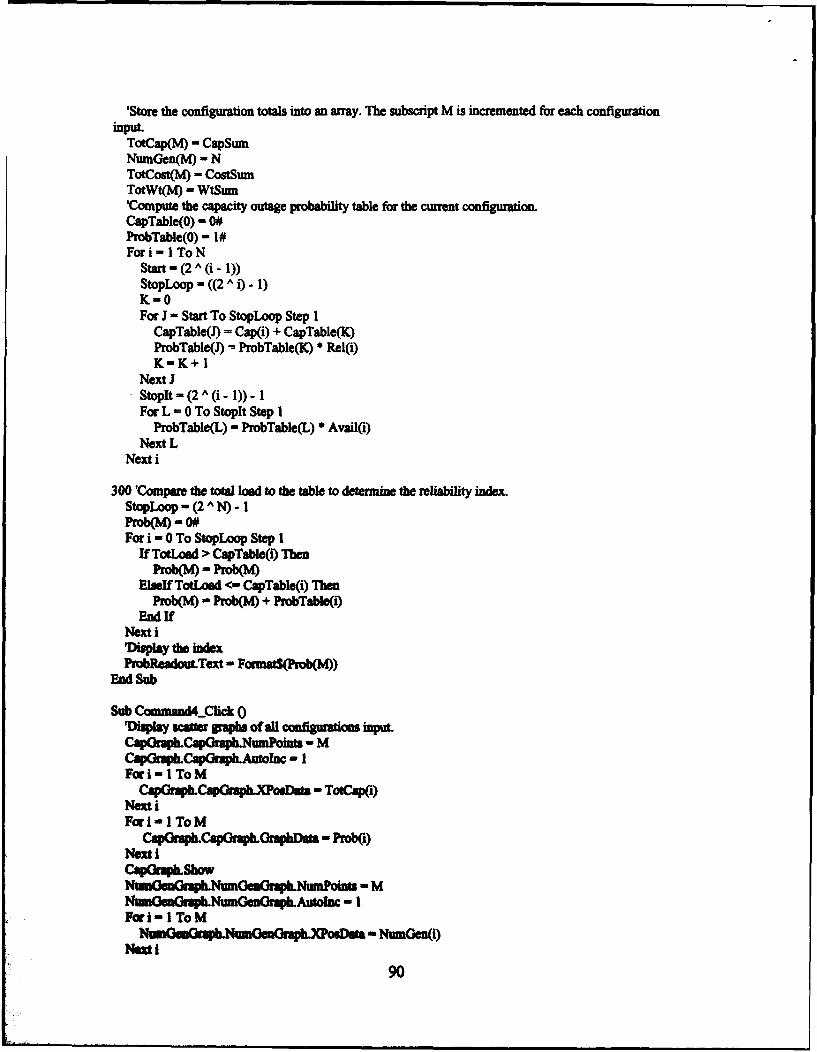
'Store the configuration totals into an array. The subscript M is incremented for each configuration
TotCap(M - CapSumNumGen(M - NTotCost(M) - CostSumTotWt(M) - WtSum'Compute the capacity outage probability table for the current configuration.CapTable(0) - 0ProbTable(0)-MFor i -1I To N
Start - (2 A (i _ 1))StopLoop = ((2 A j) -1K-0For J - Start To StopLoop Step 1
CapTable(J - Cap(i) + CapTable(K)ProbTable(J) -= ProbTable(K) *Rel(i)K-K+ 1
Next JStopIt -(2 ^(i - 1)) - 1For L -0 To StopIt Step I
ProbTable(L) - ProbTable(L) * AvailQ)Next L
Next i
300 'Compare the total load to the table to detertime the reliability index.StopLoop _ (2 AN) -1Prob(M) - 0For i - 0 To StopLoop Step 1
If Totdoad > CapTable(i) ThenProb(M) - Prob(M
ElselfTodAWe <- CapTable(i) ThenProbM - Prob(M + ProbTable(i)
End UNext i'Diplay the indexProblmadout.Text - FormadS4Prob(N))
End Sub
Sub Command4...Click 0'Dsplay scatte grapbs of all configurations input.Cap~rapILCapGMpbNumPoints - MCupauupICap~apILAutOInc - IFork -1I To M
CAP~raPILCq = X~d~f -TOICapO
For i -I To MCsp~mplLCap~hupLGraphData - Probi)
Non iC~aw~rphhow
NurapINumnGulrVpLNwnPoints - MNiualsmrap.Nwnen~mplAutolne -1I
For -1I To M
90
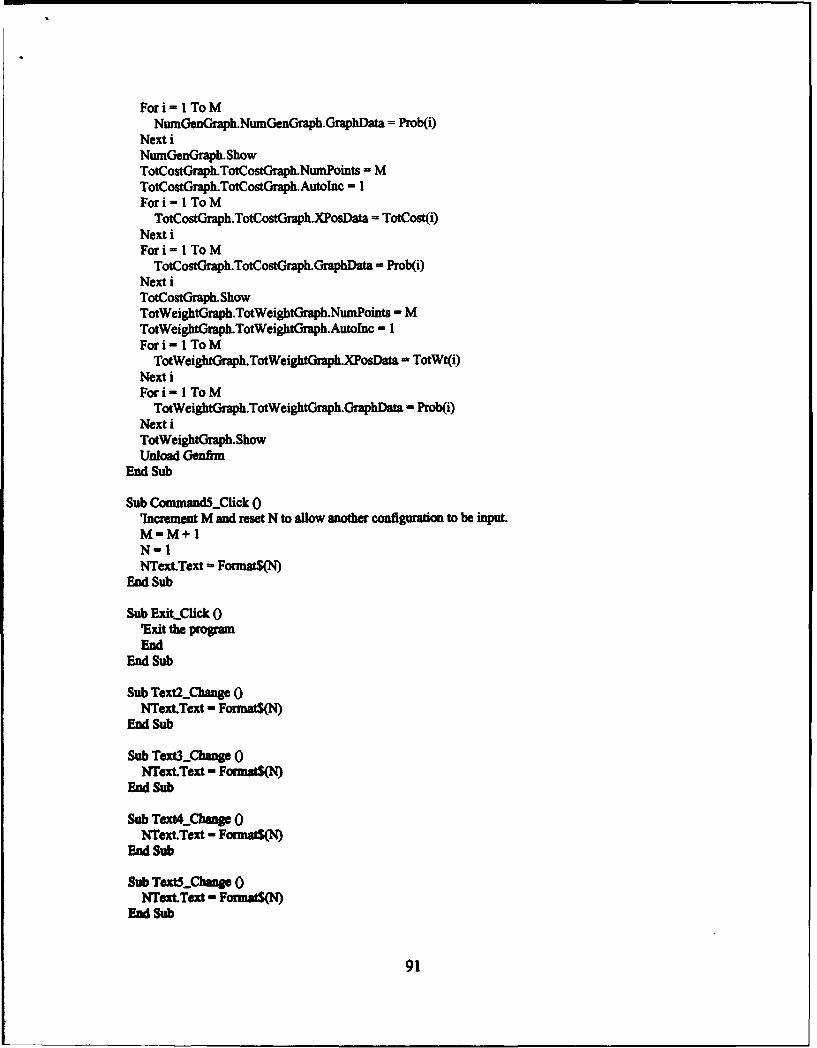
For i- I To MNumGenGraph.Num~ien~raph.GraphData = Prob(i)
Next iNumGenGraph. ShowTotCostGraph.TotCostGraph.NwnPoints - MTotCostGraph.TotCostGraph.Autolnc = 1For i - 1 To M
TotCostGrph.TotCost~raph.XPosData -TotCost(i)Next iFor i- I To M
TotCostGraph.TotCostGrah.GraphData = Prob(i)Next iTotCostGraph.ShowTotWeightGraph.TotWeightGraph.NiumPoints - MTotWeightGraphTotWeigjitGraph.Autolnc -1IFor i -1 To M
TotWeightGraph.TotWeight~raph.XosData - TotWtQi)Next iFor i I To M
TotWeighto-aph.TotWeighitGraph.GraphData - Prob(i)Next iTotWeight~lraph. ShowUnload Genfim
End Sub
Sub Command.5_Click 0'Increment M and reset N to allow anothe configuration to be input.M-M+1N-1NText.Text - Format$(N)
End Sub
Sub Exit-Click 0'Exit the programEnd
End Sub
Sub Text2_Change 0NText.Text - Format$(N
End Sub
Sub Text3t.Change 0NText.Text - FormatS(N
End Sub
Sub Text4_Change 0NText.Text - ForanaS(N)
End Sub
Sub Text5...Change 0NText.Text - FormatS(N
End Sub
91

Begin Form CapGraphAutoRedraw -1I 'TrueBorderStyle = I 'Fixed SingleCaption - "Capacity"Height - 5565Icon - CAPGRAPH.FRX:0000Left = 60LinkTopic = "Forml"MaxButton = 0 TalseScaleHeight = 4875ScaleWidth = 7365Top =555Width = 7485Begin GRAPH CapGraph
BottoinTitle - "Total Installed Capacity"ColorData - CAPGRAPH.FLRX0302DrawMode = 3 BlitExtraData = CAPGRAPH.FRX-0304FontFamily = CAPGRAPH.FRX0306FontSize - CAPGRAPH.FRX-030AFontStyle - CAPGRAPH.FRX-0314GraphCaption - "Index vs Total Installed Capacity"GraphData CAPGRAPH.FRXO0318GraphType - 9 'ScatterHeight - 4695LabelText - CAPGRAPILFRXO032CLeft -120LeftTitle - "Index"LegendText - CAPGRAPILFRX:032EPatternData CAPGRAPH.FRX0330RandomDats - 0 'OffSymbolData - CAPGRAPILFRX:0332TabIndex - 0Top 120Width - 7095XPoI)sta - CAPGRAPH.FRX0336YAxisMax - IYAxisMin - 0.5YAxisStyle - 2 t saer-deflnedYAxisT'cks - 5
EndBegin Manu File
Captim - "-&FileBegin Menu Print
Cao - "-& t"EndBegin Menu Exit
Caption - "Htxit"End
EndDOOMn MAIR HeIpCatin - "AJleip"
Be&i Menu AbouCaption -"&About9
92

EndEnd
EndThis form displays a scatter graph of the chosen index as a function of the total installed capacity
Sub AbouLClick 0'Display the information formfrmAbout.Show
End Sub
Sub Exit-Click 0'Exit the programEnd
End Sub
Sub Print-Click 0'Send this graph to the printerPrintFonn
End Sub
93
Begi Form NumnGenGraphAutoRedraw - -1 TrueBorderStyle -I 'Fixed SingleCaption ' Number of Generators"Height =5565
Icon - NUMGENGR-FRX:0000Left = 150LinkTopic ="Form 1VMaxButton =0 'FalseScaleHeight =4875
Scale Width =7365
TOP =915Width -7485
Begin GRAPH NumGenGraphBottomTitle ="Total Number of Generators"ColorData -NUMGENGRYFRX:0302
DrawMode =3 'BuitExtraData - NUMGENGR.FRX:0304FontFamily -NUTMGENGILFRXO0306
FontSize - NUMGENGILFRXO030AFontStyle - NUMGENGlLFRX:0314GraphCaption -"Index vs Total Number of Generators"GraphData - NUMGENGKLFRX-O318GraphType -9 'ScatterHeight =4695
LabelText - NUMGENGR.FRXO031CLeft -120LeflTitle -"Index"
LegendText =NUMGENGR.FRX-03IE
Pattemn~ata -NUTMGENGR.FRX-0320
RasdomData - 0 'OffSymbolData - NUMGENOILFRX-0322Tablndex -0
TOP -120Width -7095
XPosData - NUMGENGR.FRX-0324YAxisMax 1YAxisMin -0.5
YAxisStylo 2 Ulser-deflnedYAxisTicks 5
EndBegin Menu File
Caption - W&ilewBegi Menu Prin
Caption -"&PritwEndBegin Menu Exit
Caption - E&xWtEad
EndBegin Menu Hep
Caption - "&HWpBegin Ma About
Capt~ion "&About94

EndEnd
EndTMis form displays a scatter graph of the selected reliability index vs the total number of generators.
Sub AbouLClick 0'Display the Information form.fimAbout.Show
End Sub
Sub Exit-Click 0'Exit the program.End
End Sub
Sub PrintClick 0'Send this graph to the printer.PrintForm
End Sub
95

Begin Form TotCostGraphAutoRedraw _ -I TrueBorderStyle -I 'Fixed SingleCaption -"Cost"
Height =5565
Icon -TOTCOSTG.FRX:OOO0
Left =240LinkTopic - "Formi"MaxButton - 0 TFalseScaleffeight - 4875ScaleWidth - 7365TOP -1260Width -7485
Begin GRAPH TotCostnraphBottomTitle -"Total Cost"ColorData = TOTCOSTG.FRX:0302DrawMode =3 'BfitExtraData - TOTCOSTG.FRX 03 04FontFamily -TOTCOSTG.FRX:0306
FontSize - TOTCOSTG.FRXO3OAFontStyle - TOTCOSTG.FRXLO3I4GraphCaption -"Index vs Total Cost"GraphData - TOTCOSTG.FRX-0318GraphType -9 'ScatterHeight -4695
LabelText - TOTCOSTG.FRX:031CLeft -120LeftTitle -"Index"
LegendText -TOTCOSTG.FRXO031E
PatternData - TOTCOSTG.FRX0320RandomnData -0 'OffSymbolData - TOTCOSTG.FRX-0322TabIndex -0
TOP -120Width -7095
XPosDat - TOTCOSTO.FRX-0324YAxisMax IYAxisMin -0.5
YAxisStyle -2 rUser-defluedYAxisTicks -5
EndBeg& Menu File
Caption - W&ile-Begin mm Print~
Caption - &PrlntEndBegin Menu Exit
Caption - "~e~xtEnd
EnMBegin Menu Help
Cmdton m AlupBegin Mesu About
Captio - &About96

EndEnd
EndThis form displays a scatter graph of the selected reliability index vs the total cost of the generators.
Sub About-Click 0Display the Information form.ftmAbout.Show
End Sub
Sub Exit-Click 0'Exit the program.End
End Sub
Sub PrinLClick 0'Send this graph to the printer.PrintForm
End Sub
97
Begin Form TotWeightGraphAutoRedraw -- 1 'TrueBorderStyle I 1 ¶ixed SingleCaption -"Weight"
Height -5565
Icon - TOTWEIGH.FRX 0000Left - 315LinkTopic - "Form2"MtaxButton -0 'FalseScaleHeight -4875
ScaedeWidth -7365
TOP 1620Width -7485
Begin GRAPH TotWeightGraphBottomTitle -"Total Weight"ColorData - TOTWEIGH.FRX 0302Draw~lode =3 'BlitExtraData - TOT WEIGILFRXO0304FontFamily -TOT WEIGH.FRX:0306FontSize - TOT WEIGILFRX:030AFontStyle - TOTWEIGH.FRX-0314GraphCaption -"Index vs Total Weight"GraphData - TOTWEIGH.FRX-0318GraphType -9 'ScatterHeight -4695
LabelText - TOTWEIGRiFRX-031CLeft -120Leftritle -"Index"
LegendText -TOTWEIGILFRXO031E
PatternData - TOT WEIGILFRX-0320Randen~ts -0 'Off
SymbolData - TOT WEIGHLFRX-0322TabIndex -0
TOP -120Width -7095
XPouData - TOT WEIGILFRX-0324YAxisMax - 1YAxisMin - 0.5YAxiaStyle - 2 'User-definedYAxisTicks 5
EndBegin Menu File
Captio - W&ile-Beg& Man Prig
EndBegin Mensu Exit
Captio - T&xit"End
DAd
Caption - "M~ewp2%is Mm About
Captio - &AboW
98
EndEnd
EndThis form displays a scatter graph of the selected reliability index vs the total weight of the generators.
Sub About-Click 0'Display the Information form.frmAbout.Show
End Sub
Sub ExiLClick 0'Exit the program.End
End Sub
Sub PrintClick 0'Send this graph to the printer.PrintForm
End Sub
99
Begin Form frmAboutBorderStyle = 3 TFixed DoubleCaption = "About Smokey"ControlBox = 0 'alseHeight = 2520Icon - ABOUT.FRX 0000Left -915LinkTopic - "Forml"MaxButton = 0 TalseMinButton - 0 'FalseScaleHeight - 2115ScaleWidth = 5130Top = 1080Width = 5250Begin CommandButton Commandl
Cancel - -I 'TrueCaption = "OK"Default - -I T'rueHeight - 330Left = 4080TabIndex - 0Top -225Width - 930
EndBegin Label ibiCoProcessorlnfo
Height - 195Left - 3165Tablndex - 6Top - 1815Width - 1695
EndBegin Label ibR~odelnfo
Height - 195Left -885Tablndex - 5Top - 1350Width - 2280
EndBegin Label lbiMemaryinfo
Height - 195Left - 3165TabIndex - 4Top -1605Width - 1725
EndBe&i Lim Lnim
BorderWidth - 2X1 = 900X2 - 4725YI - 1230Y2 - 1230
EadBeO& LAbe Label3
AgoBizm - -1 '7m.100
Caption = "Math Co-Processor."Height - 195Left =900TabIndex w 3Top = 1815Width = 1680
EndBegin Label Label2
AutoSize = -1 TrueCaption = "Memory:"Height = 195Left =900TabIndex - 2Top = 1575Width = 720
EndBegin Label Labell
AutoSize = -I TrueCaption = "Smokey Version 1.0"Height - 195Left -900Tablndex - 1Top -225Width - 1755
EndBegin Image Imagel
Height - 480Left =165Picture - ABOUr.FRX0302Top -225Width - 480
EndEndThis form displays infomation about the system and the version of Smokey that is running
Sub CommandlClick 0Unload Me
End Sub
Sub FormJ..bsd 0Dim Wila As Long
'Center formLeft - Scruen.Width 2 - Width /2Top - Saeen.ieigiht /2 - Height / 2
'Retrieve current Windows system and memory configurationWinoap-G(etWinolap
'Display made Winf ionIfT11nFla And WFJDE ANCED Then
MlhModelnfb - "386 Eahamced Mode"
IbModelo - *Stadard Mode"
101
End If
Display math co-processor informationIf WinFlags And WF8Ox87 Then
lblCoProcessorInfo - "Present"Else
ibiCoProcessorInfo - "Not Present"End If
'Scan global heap to get memory informationtemp - GetFreeSpace(O)If Sgn(temp) = -I Then
FreeSpace = CLng(temp + l&) Xor &HFFFFFFFFElse
FreeSpace = tempEnd If
'Divide by 1024 to display info in KBFreeSpace = FreeSpace / 1024ibiMemorylnfo - Format(FreeSpace, "#,#") +" KB Free"
End Sub
102
Begin Form InerrBackColor - &HOOOOFFFF&BorderStyle - 3 ¶Fixed DoubleCaption - "Error"ControlBox - 0 tFalseHeight - 2895Left - 1035LinkMode - 1 'SourceLinkTopic "Form2"MaxButton 0 'FalseMinButton 0 TalseScaleHeight 2490ScaleWidth 4170Top -1140Width - 4290Begin CommandButton Commandl
BackColor - &HOOCOCOCO&Caption - "Try Again"Default = -1 'TrueHeight - 615Left -360TabIndex - ITop -1440Width - 3495
EndBegin Label Labell
BackColor - &HOOOOFFFF&Caption - "Improper Input Value!"Height - 255Left - 1080Tablndex - 0Top -720Width - 1935
EndEnd'This form is displayed whenever an biproper value (eg reabiity > 1) is inuL
Sub CommandlClick 0'Rturn to the form where the improper value was imput.Unload eirt
End Sub
103

Begin Form GenerrBackColor - &HOOOOFFFF&BorderStyle - 1 'Fixed SingleCaption -"Generator Error"ControlBox - 0 'FalseHeight -3105
Left -1035
LinkMode - I 'SourceLinkTopic = "orm2"MaxButton =0 'FalseMmButton -0 'FalseScaleHeight -2700
ScaleWidth =3555
TOP =1140Width -3675
Begin Co anutn CommandiCaption - "IOK"Default - -1 'TrueHeight - 615Left -840TabIndex -1ITOP -1680Width -1935
EndBegin Leibel Labell
BackColor -&HOO0OFFFF&
Caption - You'we entered the Maximum Number of Generatos Allowable. You muat""fifnshi or ""Wut" here"
Height - 55Left -360TabIndex -o0TOP -240Width -2895
EndEnd'Tis form is displayed wheneve the total number of generator ailowable per configuration (12) is
Sub CommuandlClick 0'eTrAU to the geeator input fAxm
End Sub
104
Begin Form Error2BackColor - &H00008000&BorderStyle - 3 'Fixed DoubleCaption - "Error"ControlBox - 0 'FalseHeight - 2850Left - 1035LinkMode - 1 'SourceLinkTopic "Form3"MaxButton 0 TalseMinButton 0 'FalseScaleHeight 2445ScaleWidth 3765Top -1140Width - 3885Begin CommandButton Commandl
Caption - "OK"Default - -1 'TrueHeight - 735Left -840Tablndex - ITop - 1320Width - 2055
EndBegin Label Labell
BackColor - &H00008000&Caption - "Load Exceeds Total System Capacity. Add Another Generator orQuit."Height - 735Left -240TabIndex - 0Top -240Width - 3255
EndEnd'is form is displayed whenever the total load exceeds the total installed capacity
Sub Commandl_Click 0Return to the Generator input form.
Unload Efror2End Sub
105
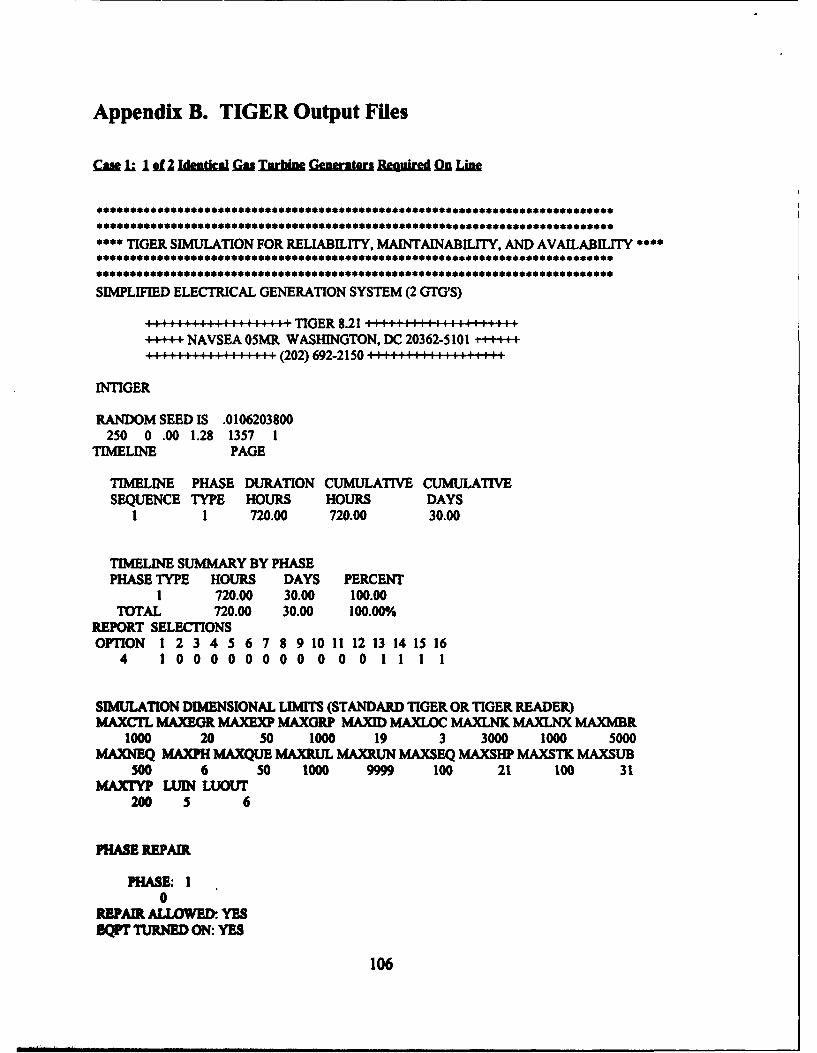
Appendix B. TIGER Output Files
Ca I.. 1.of ldmdW fm TImrbi Generators Bamicd On Lin
* **.** ** ********* ***.******** *** ****** ***** ************* *****.*******. ***** ** *
** TIGER SIMULATION FOR RELIABILITY, MAINTAINABILITY, AND AVAILABILITY *
SIMPLIFIED ELECTRICAL GENERATION SYSTEM (2 GTG'S)
I1:, s,.: 1 1& ::l'.&',:::',:l TIG ER 8.21 & I::a::a::m:&::aa:a&::::m :::
4----NAVSEA 05MR WASHINGTON, DC 20362-5101 i+-+++:::: ',:: :::: :::(202)692-2150 : :: : ::: : : :
INTIGER
RANDOM SEED IS .0106203800250 0 .00 1.28 1357 1
TIMELINE PAGE
TIMELINE PHASE DURATION CUMULATIVE CUMULATIVESEQUENCE TYPE HOURS HOURS DAYS
1 1 720.00 720.00 30.00
TIMELINE SUMMARY BY PHASEPHASE TYPE HOURS DAYS PERCENT
1 720.00 30.00 100.00TOTAL 720.00 30.00 100.00%
REPORT SELECTIONSOPTION 1 2 3 4 5 6 7 8 9 10 11 12 13 14 15 16
4 1 0 0 0 0 0 0 0 0 0 0 0 1 1 1 1
SIMULATION DIMENSIONAL LIMITS (STANDARD TIGER OR TIGER READER)MAXCTL MAXEGR MAXEXP MAXORP MAXID MAXLOC MAXLNK MAXLNX MAXMBR
1000 20 50 1000 19 3 3000 1000 5000MAXNJEQ MAXPH MAXQUE MAXRUL MAXRUN MAXSEQ MAXSHP MAXSTK MAXSUB
500 6 50 1000 9999 100 21 100 31MAXrYP LUIN LUOUT
200 5 6
PHASE REPAIR
PHASE: I0
REPAIR ALLOWE. YESBQIT TURNED ON: YES
106
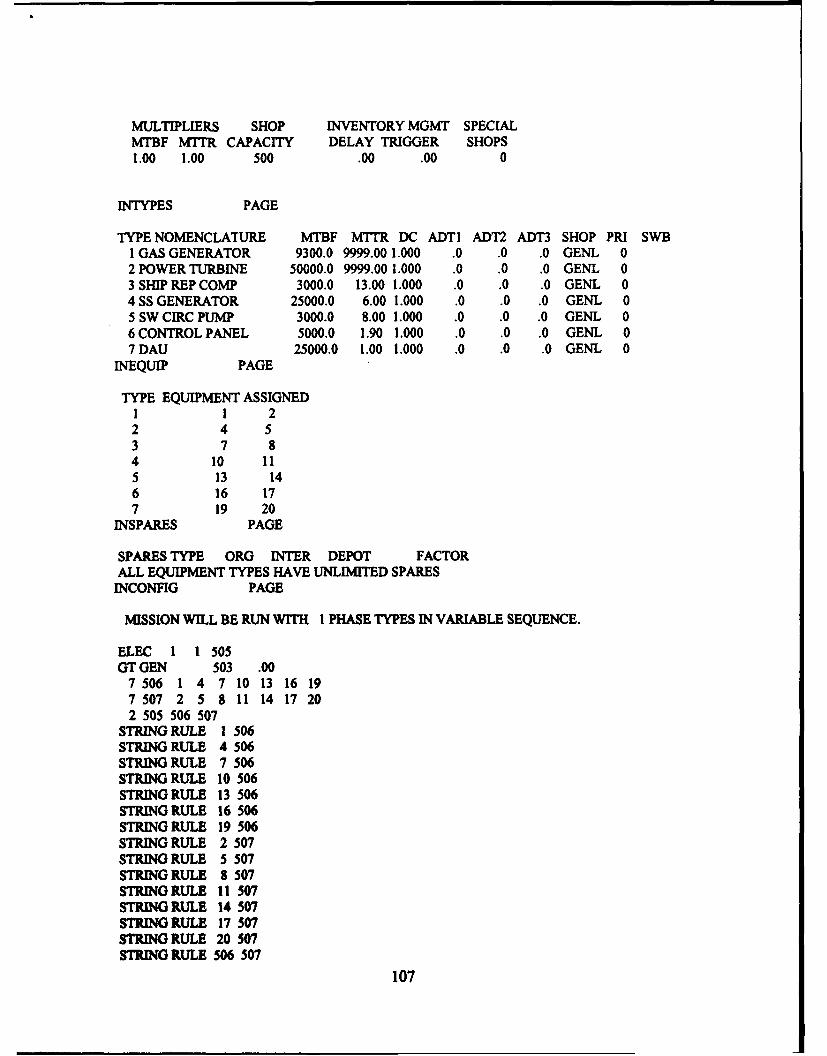
MULTIPLIERS SHOP INVENTORY MGMT SPECIALMTBF MTMR CAPACITY DELAY TRIGGER SHOPS1.00 1.00 500 .00 .00 0
INTYPES PAGE
TYPE NOMENCLATURE MTBF M7TR DC ADTI ADT2 ADT3 SHOP PRI SWB1 GAS GENERATOR 9300.0 9999.00 1.000 .0 .0 .0 GENL 02 POWER TURBINE 50000.0 9999.00 1.000 .0 .0 .0 GENL 03 SHIP REP COMP 3000.0 13.00 1.000 .0 .0 .0 GENL 04 SS GENERATOR 25000.0 6.00 1.000 .0 .0 .0 GENL 05 SW CIRC PUMP 3000.0 8.00 1.000 .0 .0 .0 GENL 06 CONTROL PANEL 5000.0 1.90 1.000 .0 .0 .0 GENL 07 DAU 25000.0 1.00 1.000 .0 .0 .0 GENL 0
INEQUIP PAGE
TYPE EQUIPMENT ASSIGNED1 1 22 4 53 7 84 10 115 13 146 16 177 19 20
INSPARES PAGE
SPARES TYPE ORG INTER DEPOT FACTORALL EQUIPMENT TYPES HAVE UNLIMIlTED SPARES
INCONFIG PAGE
MISSION WILL BE RUN WITH I PHASE TYPES IN VARIABLE SEQUENCE.
ELEC 1 1 505GT GEN 503 .00
7 506 1 4 7 10 13 16 197 507 2 5 8 11 14 17 202 505 506 507
STRING RULE 1 506STRING RULE 4 506STRING RULE 7 506STRING RULE 10 506STRING RULE 13 506STRING RULE 16 506STRING RULE 19 506STRING RULE 2 507STRING RULE 5 507STRING RULE 8 507STRING RULE 11 507STRING RULE 14 507STRING RULE 17 507STRING RULE 20 507STRING RULE 506 507
107

INPUT DATA HIGH VALUES
DURATION TYPES GROUPS EQUIPS PH-SEQ PH-TYP TRIALS720.00 7 507 20 1 1 250
OUTTIGER PAGE
RELIABILITY FOR PHASE 1, 1 .236 RELIABILITY THRU PHASE 1 .236AVERAGE AVAILABILITY AVG. AVAIL. THRU PHASE 1 .907
FOR PHASE 1, 1 .907 TIME (END OF PHASE) 720.000INSTANT AVAILABILITY INSTANT AVAILABILITY
AT BEGINNING OF PHASE 1.000 AT END OF PHASE .828FINAL SUMM4ARY STATS PAGE
SYSTEM FIGURES OF MERIT AFTER250 MISSION TRIALS MEAN STANDARD DEVIATION
OF THE SAMPLE MEANAT END OF MISSION:
RELIABILITY .236 .027RELIABILITY LOWER PRECISION LIMIT(BASED ON STANDARD DEVIATION CRITERIA) .202
INSTANTANEOUS AVAILABILITY .828 .024
AVERAGE AVAILABILITY .907 .013
ESTIMATES OF LONG-TERM VALUES:MEAN TIME BETWEEN FAILURES 497.9MEAN TIME TO REPAIR 55.2AVAILABILITY .900
MISSION PERFORMANCE (FAILURE & REPAIR INFORMATIONCALCULATED FROM TIGER SIMULATION DATA):
MEAN UP TIME 538.9 9.443MEAN DOWN TIME 55.2 9.443MEAN REPAIR TIME 8.2 .655MEAN ACTIVE REPAIR TIME 8.2 .655MEAN TIME TO FIRST FAILURE 520.6 20.546
TOTAL NO. OF SYSTEM FAILURES - 303
108
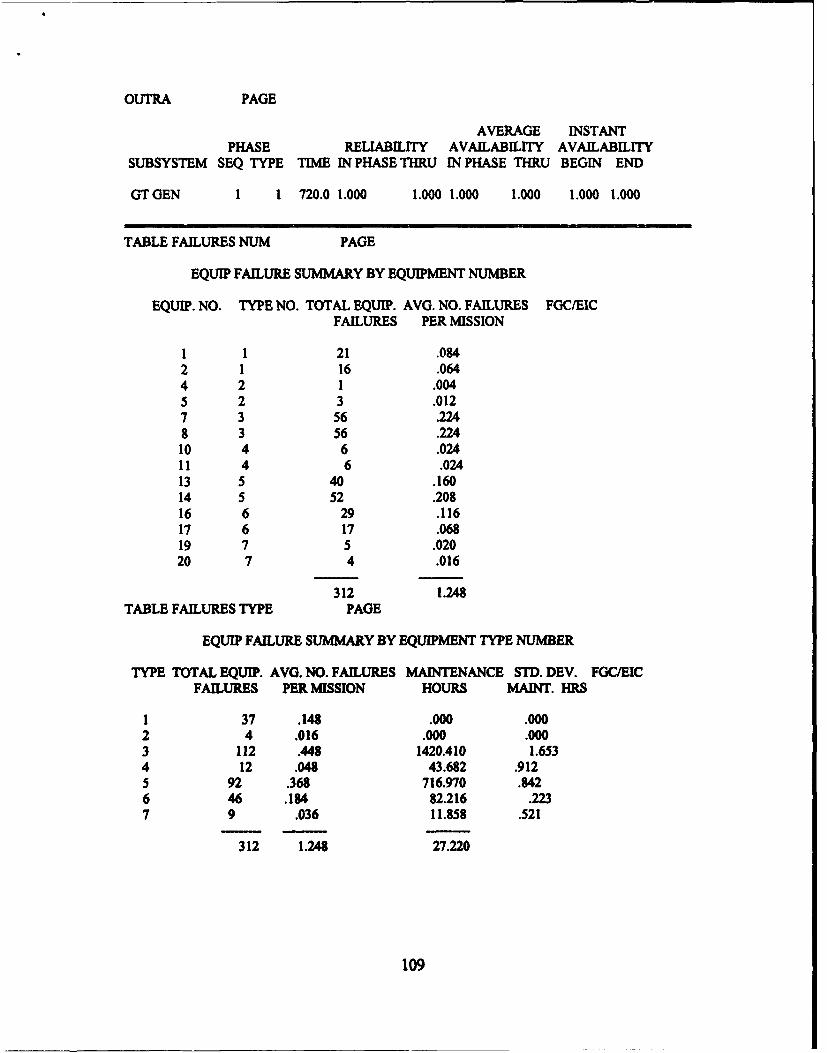
OUTRA PAGE
AVERAGE INSTANTPHASE RELIABILITY AVAILABILITY AVAILABILITY
SUBSYSTEM SEQ TYPE TIME IN PHASE THRU IN PHASE THRU BEGIN END
GTGEN 1 1 720.0 1.000 1.000 1.000 1.000 1.000 1.000
TABLE FAILURES NUM PAGE
EQUIP FAILURE SUMMARY BY EQUIPMENT NUMBER
EQUIP. NO. TYPE NO. TOTAL EQUIP. AVG. NO. FAILURES FGC/EICFAILURES PER MISSION
1 1 21 .0842 1 16 .0644 2 1 .0045 2 3 .0127 3 56 .2248 3 56 .22410 4 6 .02411 4 6 .02413 5 40 .16014 5 52 .20816 6 29 .11617 6 17 .06819 7 5 .02020 7 4 .016
312 1.248
TABLE FAILURES TYPE PAGE
EQUIP FAILURE SUMMARY BY EQUIPMENT TYPE NUMBER
TYPE TOTAL EQUIP. AVG. NO. FAILURES MAINTENANCE STD. DEV. FGC/EICFAILURES PER MISSION HOURS MAINT. HRS
1 37 .148 .000 .0002 4 .016 .000 .0003 112 .448 1420.410 1.6534 12 .048 43.682 .9125 92 .368 716.970 .8426 46 .184 82.216 .2237 9 .036 11.858 .521
312 1.248 27.220
109
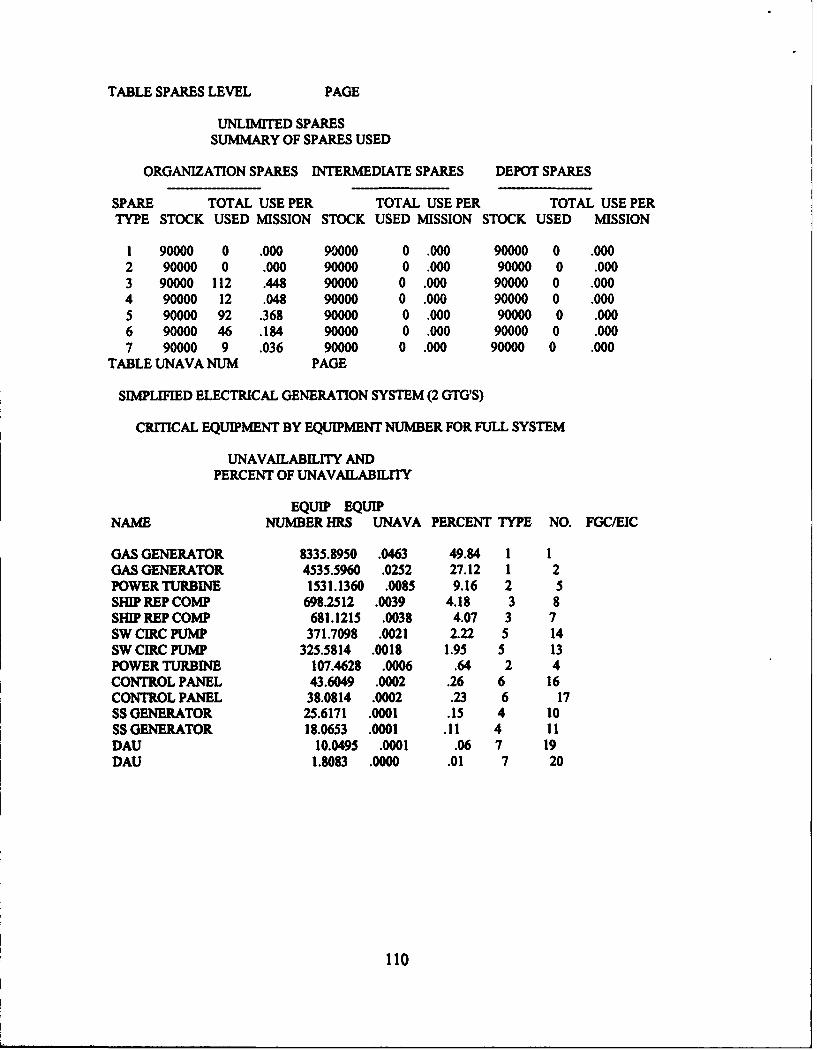
TABLE SPARES LEVEL PAGE
UNLIMITED SPARESSUMMARY OF SPARES USED
ORGANIZATION SPARES INTERMEDIATE SPARES DEPOT SPARES
SPARE TOTAL USE PER TOTAL USE PER TOTAL USE PERTYPE STOCK USED MISSION STOCK USED MISSION STOCK USED MISSION
1 90000 0 .000 90000 0 .000 90000 0 .0002 90000 0 .000 90000 0 .000 90000 0 .0003 90000 112 .448 90000 0 .000 90000 0 .0004 90000 12 .048 90000 0 .000 90000 0 .0005 90000 92 .368 90000 0 .000 90000 0 .0006 90000 46 .184 90000 0 .000 90000 0 .0007 90000 9 .036 90000 0 .000 90000 0 .000
TABLE UNAVA NUM PAGE
SIMPLIFIED ELECTRICAL GENERATION SYSTEM (2 GTG'S)
CRITICAL EQUIPMENT BY EQUIPMENT NUMBER FOR FULL SYSTEM
UNAVAILABILITY ANDPERCENT OF UNAVAILABILITY
EQUIP EQUIPNAME NUMBER HRS UNAVA PERCENT TYPE NO. FGC/EIC
GAS GENERATOR 8335.8950 .0463 49.84 1 1GAS GENERATOR 4535.5960 .0252 27.12 1 2POWERTURBINE 1531.1360 .0085 9.16 2 5SHIP REP COMP 698.2512 .0039 4.18 3 8SHIP REP COMP 681.1215 .0038 4.07 3 7SW CIRC PUMP 371.7098 .0021 2.22 5 14SW CIRC PUMP 325.5814 .0018 1.95 5 13POWER TURBINE 107.4628 .0006 .64 2 4CONTROL PANEL 43.6049 .0002 .26 6 16CONTROL PANEL 38.0814 .0002 .23 6 17SS GENERATOR 25.6171 .0001 .15 4 10SSGENERATOR 18.0653 .0001 .11 4 11DAU 10.0495 .0001 .06 7 19DAU 1.8083 .0000 .01 7 20
110
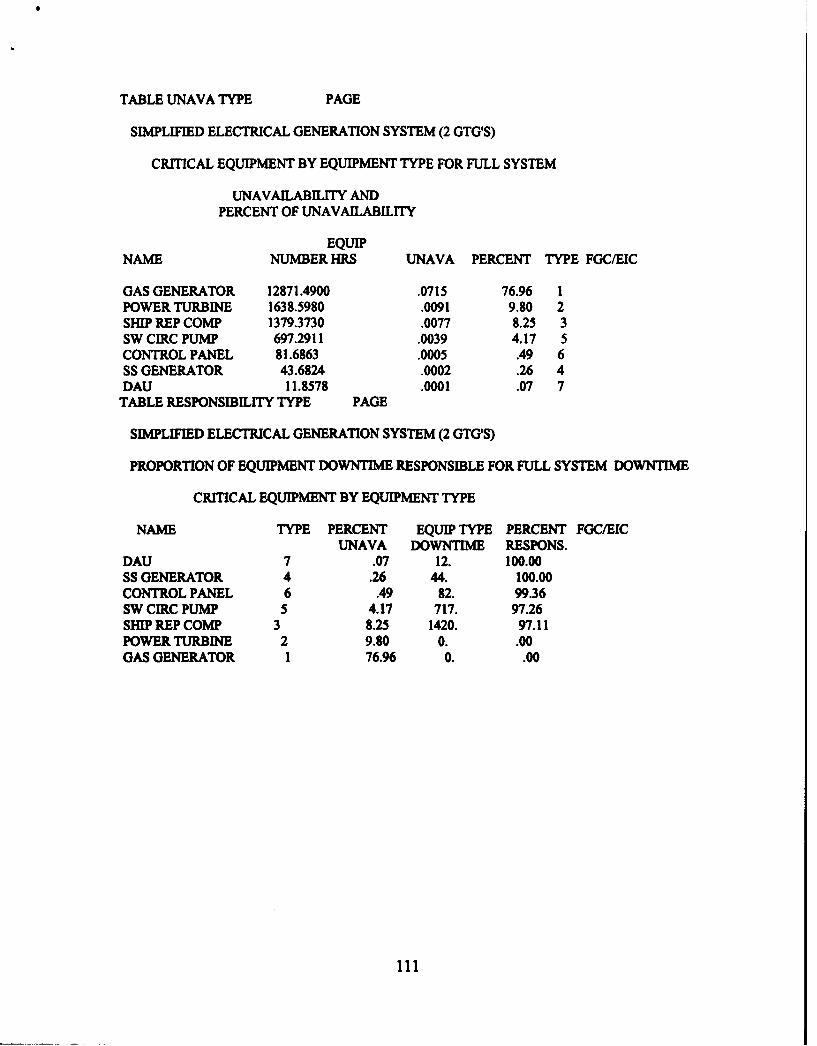
TABLE UNAVA TYPE PAGE
SIMPLIFIED ELECTRICAL GENERATION SYSTEM (2 GTG'S)
CRITICAL EQUIPMENT BY EQUIPMENT TYPE FOR FULL SYSTEM
UNAVAILABILITY ANDPERCENT OF UNAVAILABILITY
EQUIPNAME NUMBER HRS UNAVA PERCENT TYPE FGC/EIC
GAS GENERATOR 12871.4900 .0715 76.96 1POWER TURBINE 1638.5980 .0091 9.80 2SHIP REP COMP 1379.3730 .0077 8.25 3SW CIRC PUMP 697.2911 .0039 4.17 5CONTROL PANEL 81.6863 .0005 .49 6SS GENERATOR 43.6824 .0002 .26 4DAU 11.8578 .0001 .07 7TABLE RESPONSIBILITY TYPE PAGE
SIMPLIFIED ELECTRICAL GENERATION SYSTEM (2 GTG'S)
PROPORTION OF EQUIPMENT DOWNTIME RESPONSIBLE FOR FULL SYSTEM DOWNTIME
CRITICAL EQUIPMENT BY EQUIPMENT TYPE
NAME TYPE PERCENT EQUIP TYPE PERCENT FGC/EICUNAVA DOWNTIME RESPONS.
DAU 7 .07 12. 100.00SS GENERATOR 4 .26 44. 100.00CONTROL PANEL 6 .49 82. 99.36SW CIRC PUMP 5 4.17 717. 97.26SHIP REP COMP 3 8.25 1420. 97.11POWER TURBINE 2 9.80 0. .00GAS GENERATOR 1 76.96 0. .00
111
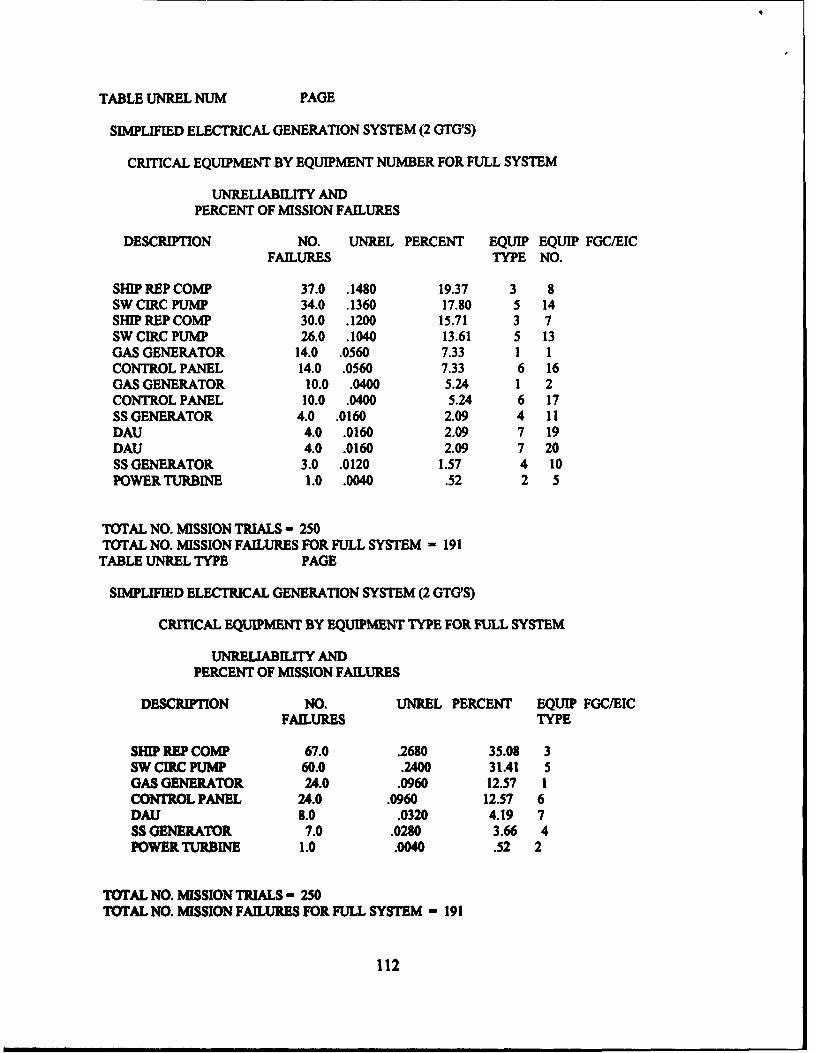
TABLE UNREL NUM PAGE
SIMPLIFIED ELECTRICAL GENERATION SYSTEM (2 GTG'S)
CRITICAL EQUIPMENT BY EQUIPMENT NUMBER FOR FULL SYSTEM
UNRELIABILITY ANDPERCENT OF MISSION FAILURES
DESCRIPTION NO. UNREL PERCENT EQUIP EQUIP FGC/EICFAILURES TYPE NO.
SHIP REP COMP 37.0 .1480 19.37 3 8SW CIRC PUMP 34.0 .1360 17.80 5 14SHIP REP COMP 30.0 .1200 15.71 3 7SW CIRC PUMP 26.0 .1040 13.61 5 13GAS GENERATOR 14.0 .0560 7.33 1 1CONTROL PANEL 14.0 .0560 7.33 6 16GAS GENERATOR 10.0 .0400 5.24 1 2CONTROL PANEL 10.0 .0400 5.24 6 17SS GENERATOR 4.0 .0160 2.09 4 11DAU 4.0 .0160 2.09 7 19DAU 4.0 .0160 2.09 7 20SS GENERATOR 3.0 .0120 1.57 4 10POWER TURBINE 1.0 .0040 .52 2 5
TOTAL NO. MISSION TRIALS - 250TOTAL NO. MISSION FAILURES FOR FULL SYSTEM - 191
TABLE UNREL TYPE PAGE
SIMPLIFIED ELECTRICAL GENERATION SYSTEM (2 GTG'S)
CRITICAL EQUIPMENT BY EQUIPMENT TYPE FOR FULL SYSTEM
UNRELIABILITY ANDPERCENT OF MISSION FAILURES
DESCRIPTION NO. UNREL PERCENT EQUIP FGC/EICFAILURES TYPE
SHIP REP COMP 67.0 .2680 35.08 3SW CIRC PUMP 60.0 .2400 31.41 5GAS GENERATOR 24.0 .0960 12.57 1CONTROL PANEL 24.0 .0960 12.57 6DAU 8.0 .0320 4.19 7
SS GENERATOR 7.0 .0280 3.66 4POWER TURBINE 1.0 .0040 .52 2
TOTAL NO. MISSION TRIALS - 250TOTAL NO. MISSION FAILURES FOR FULL SYSTEM - 191
112
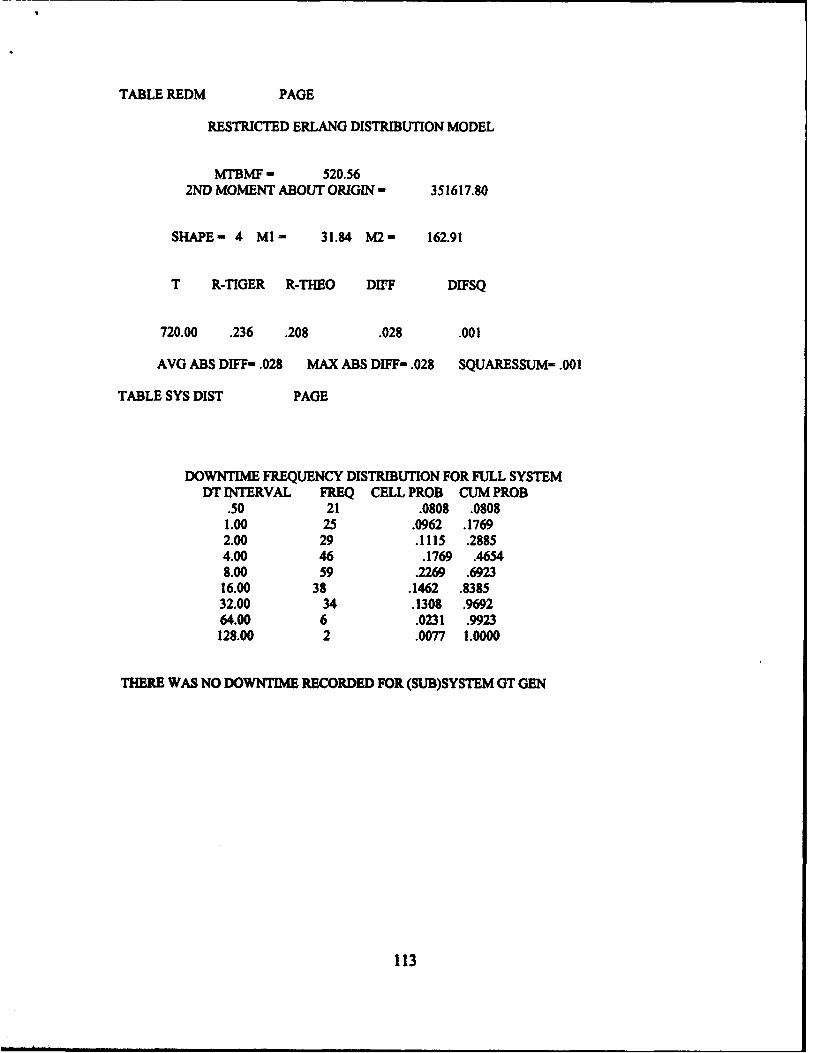
TABLE REDM PAGE
RESTRICTED ERLANG DISTRIBUTION MODEL
MTBMF - 520.56
2ND MOMENT ABOUT ORIGIN = 351617.80
SHAPE - 4 MI- 31.84 M2- 162.91
T R-TIGER R-THEO DIFF DIFSQ
720.00 .236 .208 .028 .001
AVG ABS DIFF- .028 MAX ABS DIFF- .028 SQUARESSUM- .001
TABLE SYS DIST PAGE
DOWNTIME FREQUENCY DISTRIBUTION FOR FULL SYSTEMDT INTERVAL FREQ CELL PROB CUM PROB
.50 21 .0808 .08081.00 25 .0962 .17692.00 29 .1115 .28854.00 46 .1769 .46548.00 59 .2269 .692316.00 38 .1462 .838532.00 34 .1308 .969264.00 6 .0231 .9923128.00 2 .0077 1.0000
THERE WAS NO DOWNTIME RECORDED FOR (SUB)SYSTEM GT GEN
113
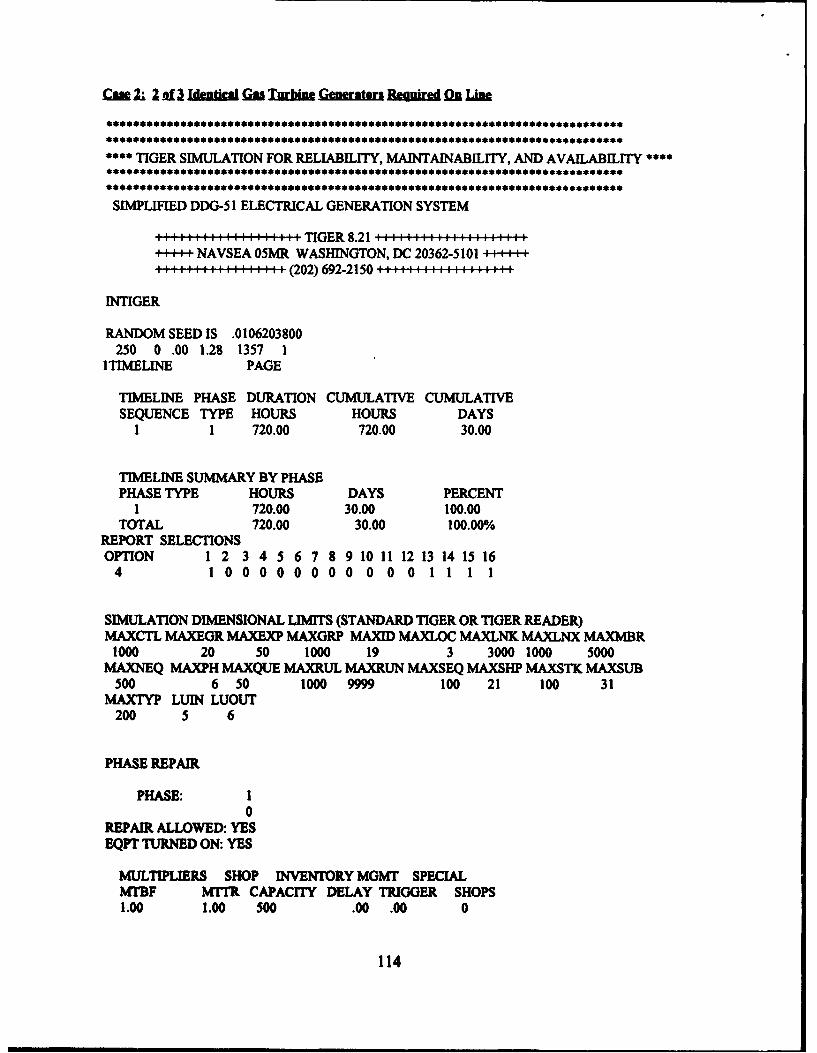
CLmZ- 2 of a Ida" GaTa Genert e aMgird On Ling
**TIGER SIMULATION FOR RELIABILITY, MAINTAINABILITY, AND AVAILABILITY ****
SIMPLIFIED DDG-51 ELECTRICAL GENERATION SYSTEM
Am 1! 1 1, 1 1 Is I Is! :::: TIG ER S.21 @I : l I :l ', ',:: ',l @1, a :As :::
NAVSEA 05MR WASHINGTON, DC 20362-5101 ++++1 1-s-iti1: 1: : : ::(202)692-2150 A I: I 1 11 I 1 416 11
INTIGER
RANDOM SEED IS .0106203800250 0 .00 1.28 1357 1
ITIMELINE PAGE
TIMELINE PHASE DURATION CUMULATIVE CUMULATIVESEQUENCE TYPE HOURS HOURS DAYS
1 1 720.00 720.00 30.00
TIMELINE SUMMARY BY PHASEPHASE TYPE HOURS DAYS PERCENT
1 720.00 30.00 100.00TOTAL 720.00 30.00 100.00%
REPORT SELECTIONSOPTION 1 2 3 4 5 6 7 8 9 10 11 12 13 14 15 16
4 1 0 0 0 0 0 0 0 0 0 0 0 1 1 1 1
SIMULATION DIMENSIONAL LIMITS (STANDARD TIGER OR TIGER READER)MAXCTL MAXEGR MAXEXP MAXGRP MAXID MAXLOC MAXLNK MAXLNX MAXMBR
1000 20 50 1000 19 3 3000 1000 5000MAXNEQ MAXPH MAXQUE MAXRUL MAXRUN MAXSEQ MAXSEHP MAXSTK MAXSUB
500 6 50 1000 9999 100 21 100 31MAXTYP LUIN LUOUT
200 5 6
PHASE REPAIR
PHASE: I0
REPAIR ALLOWED:. YESEQPT TURNED ON: YES
MULTIPLIERS SHOP INVENTORY MGMT SPECIALMTBF MTTR CAPACITY DELAY TRIGGER SHOPS1.00 1.00 500 .00 .00 0
114
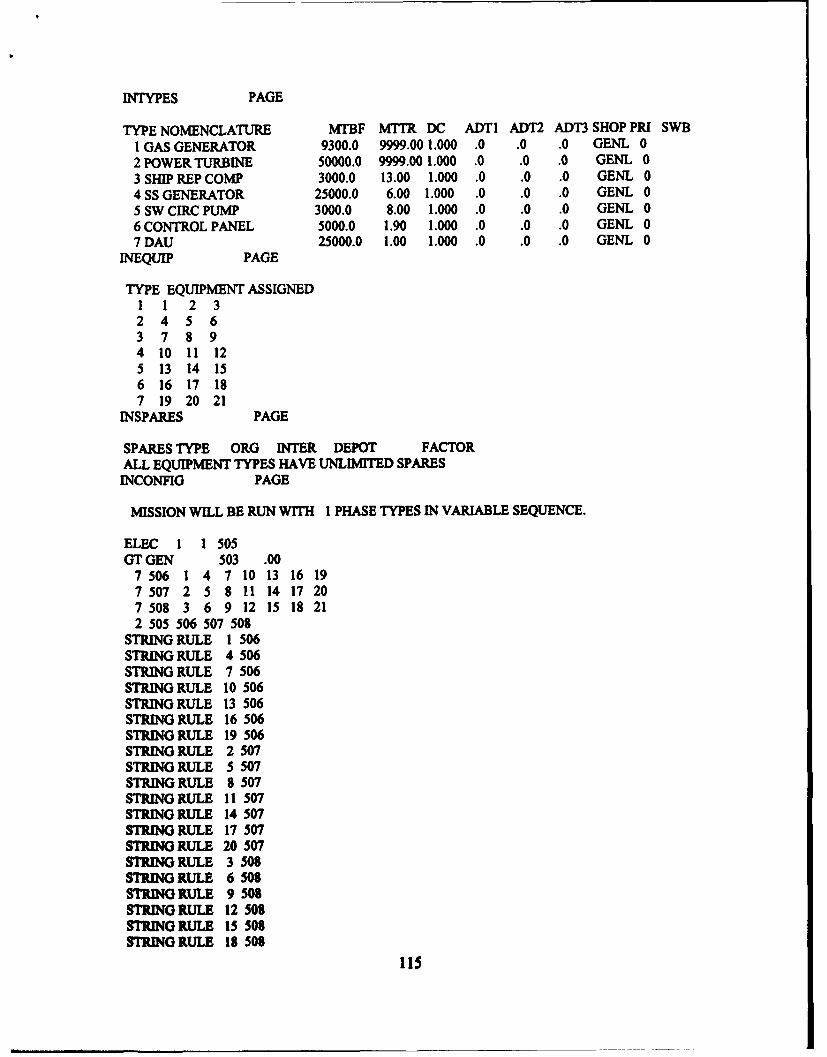
INTYPES PAGE
TYPE NOMENCLATURE MTBF MITR DC ADTI ADT2 ADT3 SHOP PRI SWBI GAS GENERATOR 9300.0 9999.00 1.000 .0 .0 .0 GENL 02 POWER TURBINE 50000.0 9999.00 1.000 .0 .0 .0 GENL 03 SHIP REP COMP 3000.0 13.00 1.000 .0 .0 .0 GENL 04 SS GENERATOR 25000.0 6.00 1.000 .0 .0 .0 GENL 05 SW CIRC PUMP 3000.0 8.00 1.000 .0 .0 .0 GENL 06 CONTROL PANEL 5000.0 1.90 1.000 .0 .0 .0 GENL 07DAU 25000.0 1.00 1.000 .0 .0 .0 GENL 0
INEQUIP PAGE
TYPE EQUIPMENT ASSIGNED1 1 2 32 4 5 63 7 8 94 10 11 125 13 14 156 16 17 187 19 20 21
INSPARES PAGE
SPARES TYPE ORG INTER DEPOT FACTORALL EQUIPMENT TYPES HAVE UNLIMITED SPARES
INCONFIG PAGE
MISSION WILL BE RUN WITH 1 PHASE TYPES IN VARIABLE SEQUENCE.
ELEC 1 1 505GT GEN 503 .00
7 506 1 4 7 10 13 16 197 507 2 5 8 11 14 17 207 508 3 6 9 12 15 18 212 505 506 507 508
STRING RULE 1 506STRING RULE 4 506STRING RULE 7 506STRING RULE 10 506STRING RULE 13 506STRING RULE 16 506STRING RULE 19 506STRING RULE 2 507STRING RULE 5 507STRING RULE 8 507STRING RULE 11 507STRING RULE 14 507STRING RULE 17 507STRING RULE 20 507STRING RULE 3 508STRING RULE 6 508STRING RULE 9 508STRING RULE 12 508STRING RULE 15 508STRING RULE 18 508
115
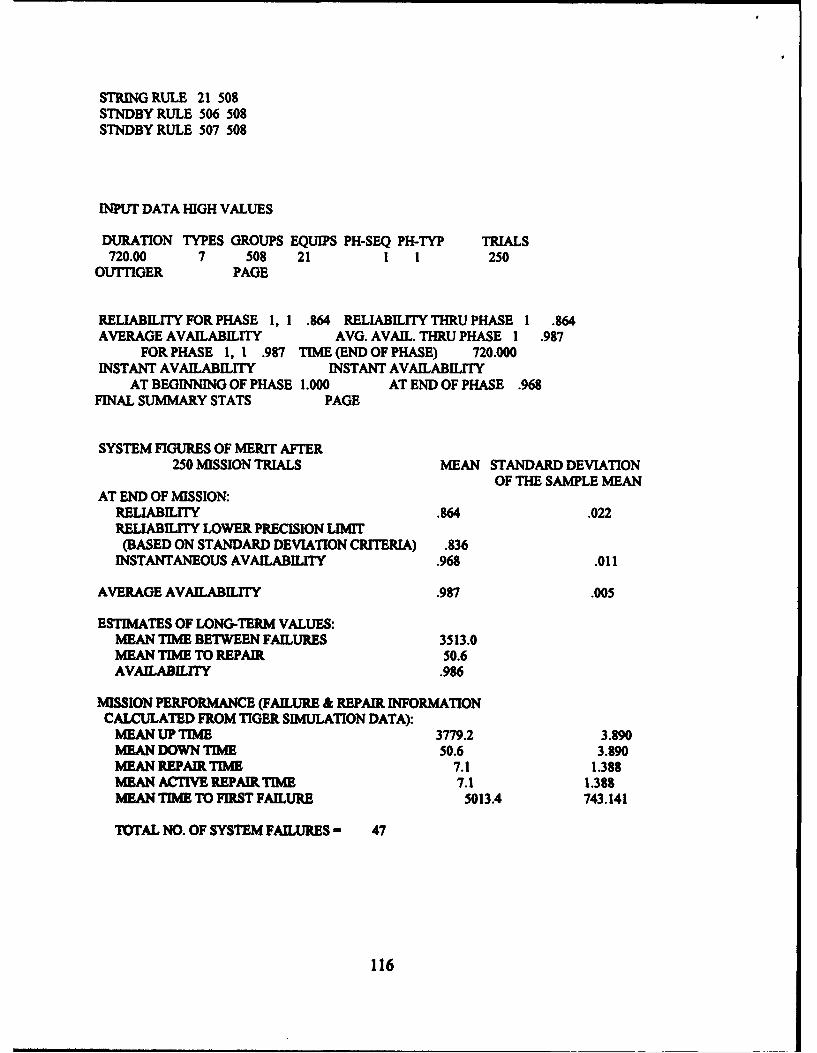
STRING RULE 21 508STNDBY RULE 506 508STNDBY RULE 507 508
INPU DATA HIGH VALUES
DURATION TYPES GROUPS EQUIPS PH-SEQ PH-TYP TRIALS720.00 7 508 21 1 1 250
OUTIIGER PAGE
RELIABILITY FOR PHASE 1, 1 .864 RELIABILITY THRU PHASE 1 .864AVERAGE AVAILABILITY AVG. AVAIL. THRU PHASE 1 .987
FOR PHASE 1, 1 .987 TIME (END OF PHASE) 720.000INSTANT AVAILABILITY INSTANT AVAILABILITY
AT BEGINNING OF PHASE 1.000 AT END OF PHASE .968FINAL SUMMARY STATS PAGE
SYSTEM FIGURES OF MERIT AFTER250 MISSION TRIALS MEAN STANDARD DEVIATION
OF THE SAMPLE MEANAT END OF MISSION:
RELIABILITY .864 .022RELIABILITY LOWER PRECISION LIMIT(BASED ON STANDARD DEVIATION CRITERIA) .836
INSTANTANEOUS AVAILABILITY .968 .011
AVERAGE AVAILABILITY .987 .005
ESTIMATES OF LONG-TERM VALUES:MEAN TIME BETWEEN FAILURES 3513.0MEAN TIME TO REPAIR 50.6AVAILABILITY .986
MISSION PERFORMANCE (FAILURE & REPAIR INFORMATIONCALCULATED FROM TIGER SIMULATION DATA):
MEAN UP TIME 3779.2 3.890MEAN DOWN TIME 50.6 3.890MEAN REPAIR TIME 7.1 1.388MEAN ACTIVE REPAIR, TIME 7.1 1.388MEAN TIME TO FIRST FAILURE 5013.4 743.141
TOTAL NO. OF SYSTEM FAILURES - 47
116
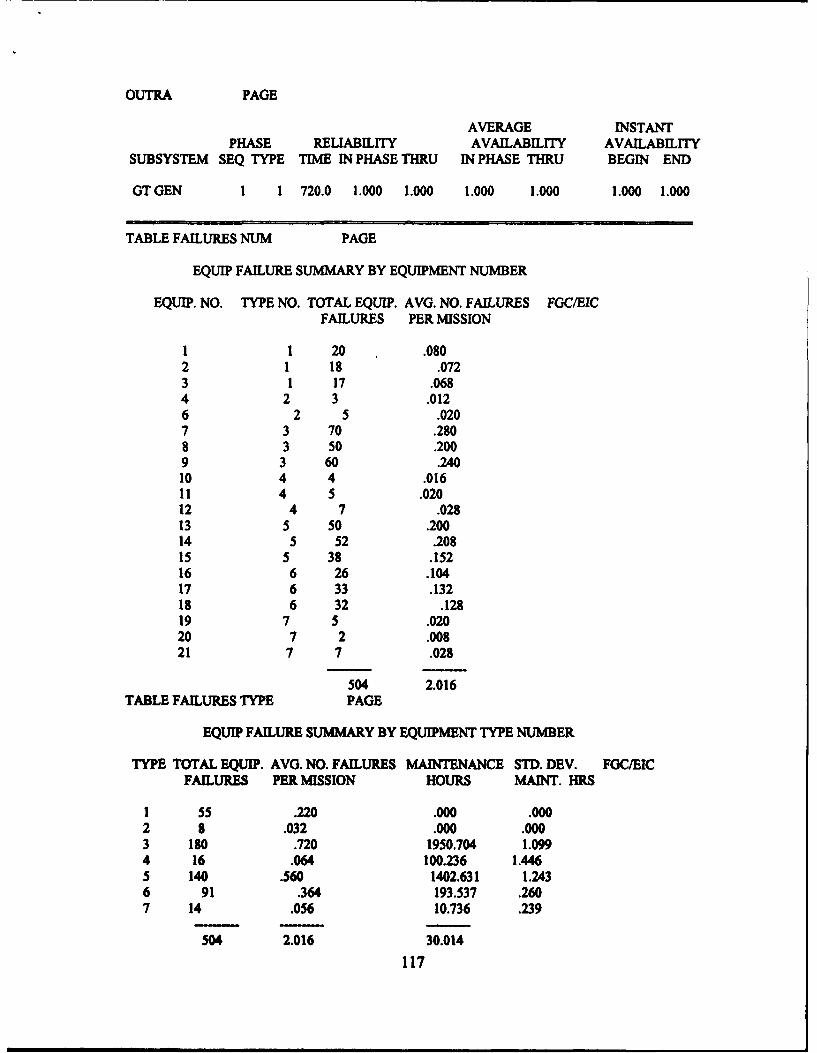
OUTRA PAGE
AVERAGE INSTANTPHASE RELIABILITY AVAILABILITY AVAILABILITY
SUBSYSTEM SEQ TYPE TIME IN PHASE THRU IN PHASE THRU BEGIN END
GT GEN 1 1 720.0 1.000 1.000 1.000 1.000 1.000 1.000
TABLE FAILURES NUM PAGE
EQUIP FAILURE SUMMARY BY EQUIPMENT NUMBER
EQUIP. NO. TYPE NO. TOTAL EQUIP. AVG. NO. FAILURES FGC/EICFAILURES PER MISSION
1 1 20 .0802 1 18 .0723 1 17 .0684 2 3 .0126 2 5 .0207 3 70 .2808 3 50 .2009 3 60 .24010 4 4 .01611 4 5 .02012 4 7 .02813 5 50 .20014 5 52 .20815 5 38 .15216 6 26 .10417 6 33 .13218 6 32 .12819 7 5 .02020 7 2 .00821 7 7 .028
504 2.016
TABLE FAILURES TYPE PAGE
EQUIP FAILURE SUMMARY BY EQUIPMENT TYPE NUMBER
TYPE TOTAL EQUIP. AVG. NO. FAILURES MAINTENANCE STD. DEV. FGC/EICFAILURES PER MISSION HOURS MAINT. HRS
1 55 .220 .000 .0002 8 .032 .000 .0003 180 .720 1950.704 1.0994 16 .064 100.236 1.4465 140 .560 1402.631 1.2436 91 .364 193.537 .2607 14 .056 10.736 .239
504 2.016 30.014
117
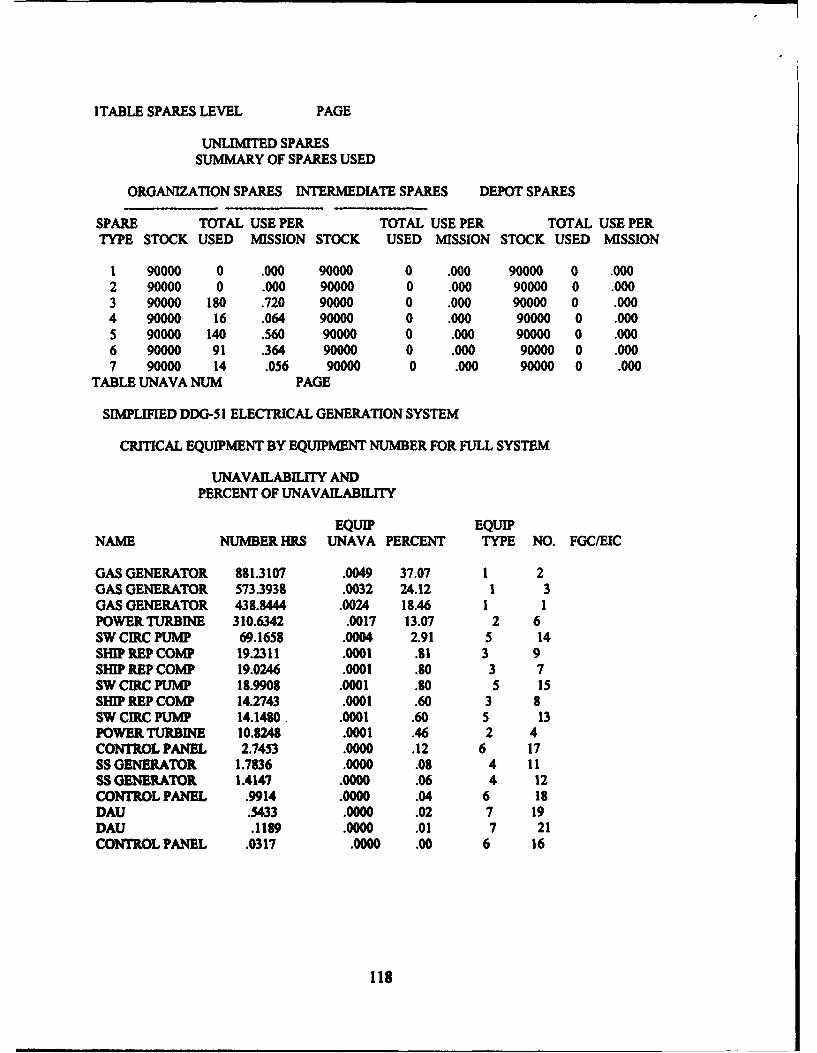
ITABLE SPARES LEVEL PAGE
UNLIMITED SPARESSUMMARY OF SPARES USED
ORGANIZATION SPARES INTERMEDIATE SPARES DEPOT SPARES
SPARE TOTAL USE PER TOTAL USE PER TOTAL USE PERTYPE STOCK USED MISSION STOCK USED MISSION STOCK USED MISSION
1 90000 0 .000 90000 0 .000 90000 0 .0002 90000 0 .000 90000 0 .000 90000 0 .0003 90000 180 .720 90000 0 .000 90000 0 .0004 90000 16 .064 90000 0 .000 90000 0 .0005 90000 140 .560 90000 0 .000 90000 0 .0006 90000 91 .364 90000 0 .000 90000 0 .0007 90000 14 .056 90000 0 .000 90000 0 .000
TABLE UNAVA NUM PAGE
SIMPLIFIED DDG-51 ELECTRICAL GENERATION SYSTEM
CRITICAL EQUIPMENT BY EQUIPMENT NUMBER FOR FULL SYSTEM
UNAVAILABILITY ANDPERCENT OF UNAVAILABILrIY
EQUIP EQUIPNAME NUMBER HRS UNAVA PERCENT TYPE NO. FGC/EIC
GAS GENERATOR 881.3107 .0049 37.07 1 2GAS GENERATOR 573.3938 .0032 24.12 1 3GAS GENERATOR 438.8444 .0024 18.46 1 1POWER TURBINE 310.6342 .0017 13.07 2 6SW CIRC PUMP 69.1658 .0004 2.91 5 14SHIP REP COMP 19.2311 .0001 .81 3 9SHIP REP COMP 19.0246 .0001 .80 3 7SW CIRC PUMP 18.9908 .0001 .80 5 15SHIP REP COMP 14.2743 .0001 .60 3 8SW CIRC PUMP 14.1480 .0001 .60 5 13POWER TURBINE 10.8248 .0001 .46 2 4CONTROL PANEL 2.7453 .0000 .12 6 17SS GENERATOR 1.7836 .0000 .08 4 11SS GENERATOR 1.4147 .0000 .06 4 12CONTROL PANEL .9914 .0000 .04 6 18DAU .5433 .0000 .02 7 19DAU .1189 .0000 .01 7 21CONTROL PANEL .0317 .0000 .00 6 16
118
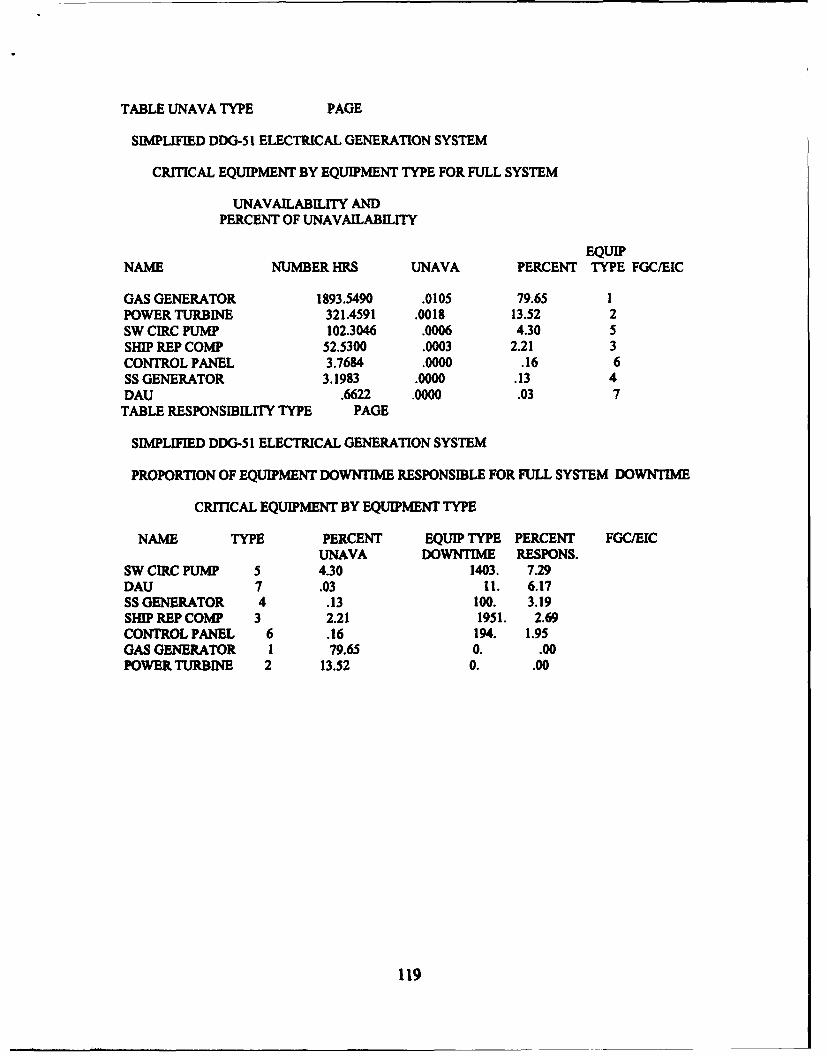
TABLE UNAVA TYPE PAGE
SIMPLIFIED DDG-51 ELECTRICAL GENERATION SYSTEM
CRITICAL EQUIPMENT BY EQUIPMENT TYPE FOR FULL SYSTEM
UNAVAILABILITY ANDPERCENT OF UNAVAILABILITY
EQUIPNAME NUMBER HRS UNAVA PERCENT TYPE FGC.EIC
GAS GENERATOR 1893.5490 .0105 79.65 1POWER TURBINE 321.4591 .0018 13.52 2SW CIRC PUMP 102.3046 .0006 4.30 5SHIP REP COMP 52.5300 .0003 2.21 3CONTROL PANEL 3.7684 .0000 .16 6SS GENERATOR 3.1983 .0000 .13 4DAU .6622 .0000 .03 7
TABLE RESPONSIBILITY TYPE PAGE
SIMPLIFIED DDG-51 ELECTRICAL GENERATION SYSTEM
PROPORTION OF EQUIPMENT DOWNTIME RESPONSIBLE FOR FULL SYSTEM DOWNTIME
CRITICAL EQUIPMENT BY EQUIPMENT TYPE
NAME TYPE PERCENT EQUIP TYPE PERCENT FGC/EICUNAVA DOWNTIME RESPONS.
SW CIRC PUMP 5 4.30 1403. 7.29DAU 7 .03 It. 6.17SS GENERATOR 4 .13 100. 3.19SHIP REP COMP 3 2.21 1951. 2.69CONTROL PANEL 6 .16 194. 1.95GAS GENERATOR 1 79.65 0. .00POWER TURBINE 2 13.52 0. .00
119
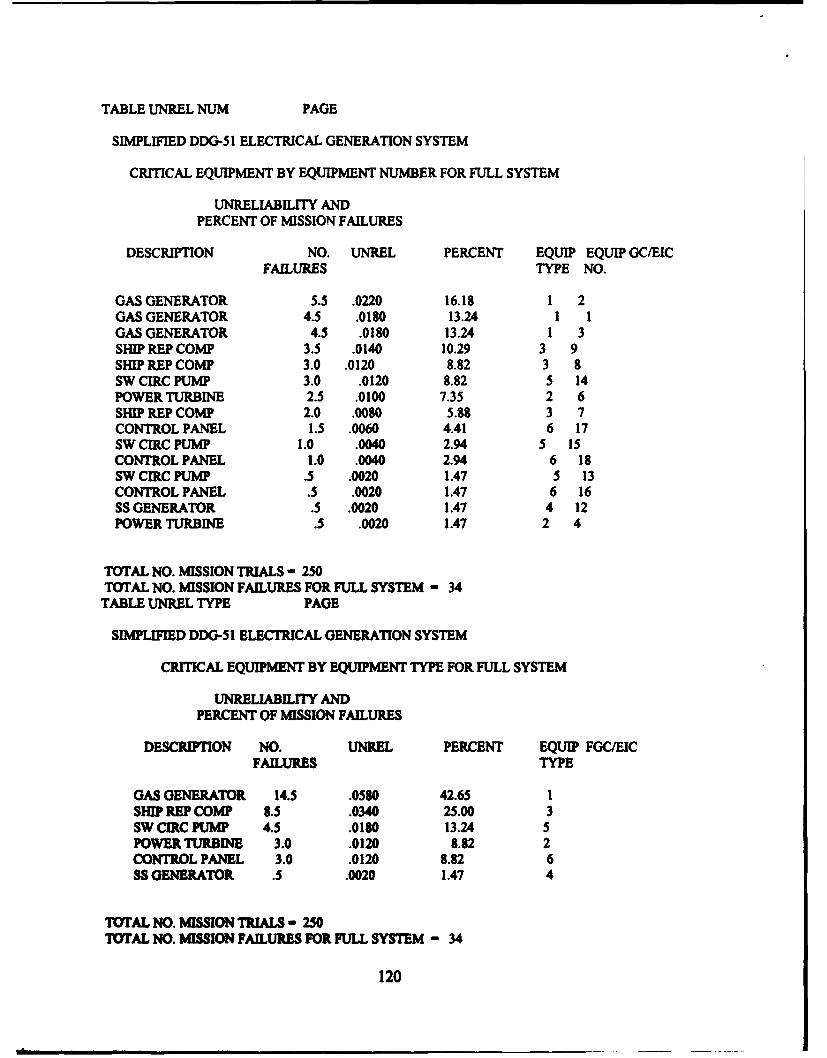
TABLE UNREL NUM PAGE
SIMPLIFIED DDG-51 ELECTRICAL GENERATION SYSTEM
CRITICAL EQUIPMENT BY EQUIPMENT NUMBER FOR FULL SYSTEM
UNRELIABILITY ANDPERCENT OF MISSION FAILURES
DESCRIPTION NO. UNREL PERCENT EQUIP EQUIP GC/EICFAILURES TYPE NO.
GAS GENERATOR 5.5 .0220 16.18 1 2GAS GENERATOR 4.5 .0180 13.24 1 1GAS GENERATOR 4.5 .0180 13.24 1 3SHIP REP COMP 3.5 .0140 10.29 3 9SHIP REP COMP 3.0 .0120 8.82 3 8SW CIRC PUMP 3.0 .0120 8.82 5 14POWER TURBINE 2.5 .0100 7.35 2 6SHIP REP COMP 2.0 .0080 5.88 3 7CONTROL PANEL 1.5 .0060 4.41 6 17SW CIRC PUMP 1.0 .0040 2.94 5 15CONTROL PANEL 1.0 .0040 2.94 6 18SW CIRC PUMP .5 .0020 1.47 5 13CONTROL PANEL .5 .0020 1.47 6 16SS GENERATOR .5 .0020 1.47 4 12POWER TURBINE .5 .0020 1.47 2 4
TOTAL NO. MISSION TRIALS - 250TOTAL NO. MISSION FAILURES FOR FULL SYSTEM - 34TABLE UNREL TYPE PAGE
SIMPLIFIED DDG-51 ELECTRICAL GENERATION SYSTEM
CRITICAL EQUIPMENT BY EQUIPMENT TYPE FOR FULL SYSTEM
UNRELIABILITY ANDPERCENT OF MISSION FAILURES
DESCRIPTION NO. UNREL PERCENT EQUIP FGC/EICFAILURES TYPE
GAS GENERATOR 14.5 .0580 42.65 1SHIP REP COMP 8.5 .0340 25.00 3SW CIRC PUMP 4.5 .0180 13.24 5POWER TURBINE 3.0 .0120 8.82 2CONTROL PANEL 3.0 .0120 8.82 6SS GENERATOR .5 .0020 1.47 4
TOTAL NO. MISSION TRIALS - 250TOTAL NO. MISSION FAILURES FOR FULL SYSTEM - 34
120
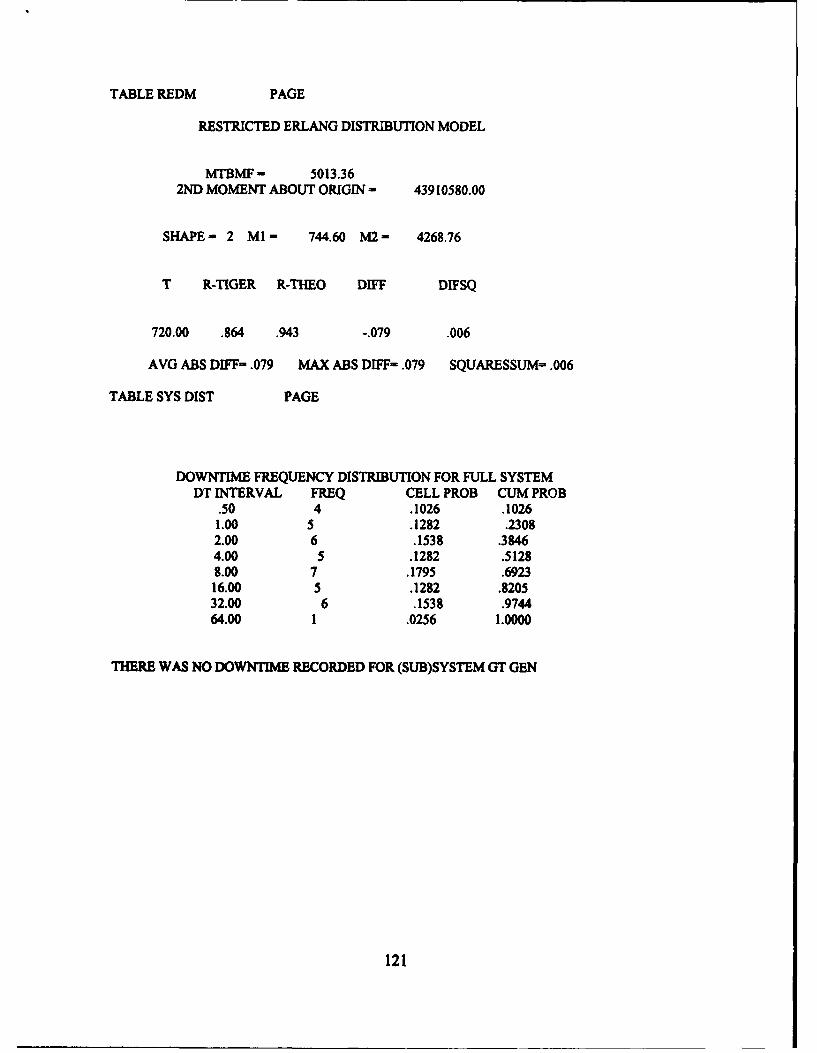
TABLE REDM PAGE
RESTRICTED ERLANG DISTRIBUTION MODEL
MTBMF- 5013.362ND MOMENT ABOUT ORIGIN - 43910580.00
SHAPE - 2 MI - 744.60 M2 4268.76
T R-TIGER R-THEO DIFF DIFSQ
720.00 .864 .943 -.079 .006
AVG ABS DIFF- .079 MAX ABS DIFF- .079 SQUARESSUM- .006
TABLE SYS DIST PAGE
DOWNTIME FREQUENCY DISTRIBUTION FOR FULL SYSTEMDT INTERVAL FREQ CELL PROB CUM PROB
.50 4 .1026 .10261.00 5 .1282 .23082.00 6 .1538 .38464.00 5 .1282 .51288.00 7 .1795 .692316.00 5 .1282 .820532.00 6 .1538 .974464.00 1 .0256 1.0000
THERE WAS NO DOWNTIME RECORDED FOR (SUB)SYSTEM GT GEN
121
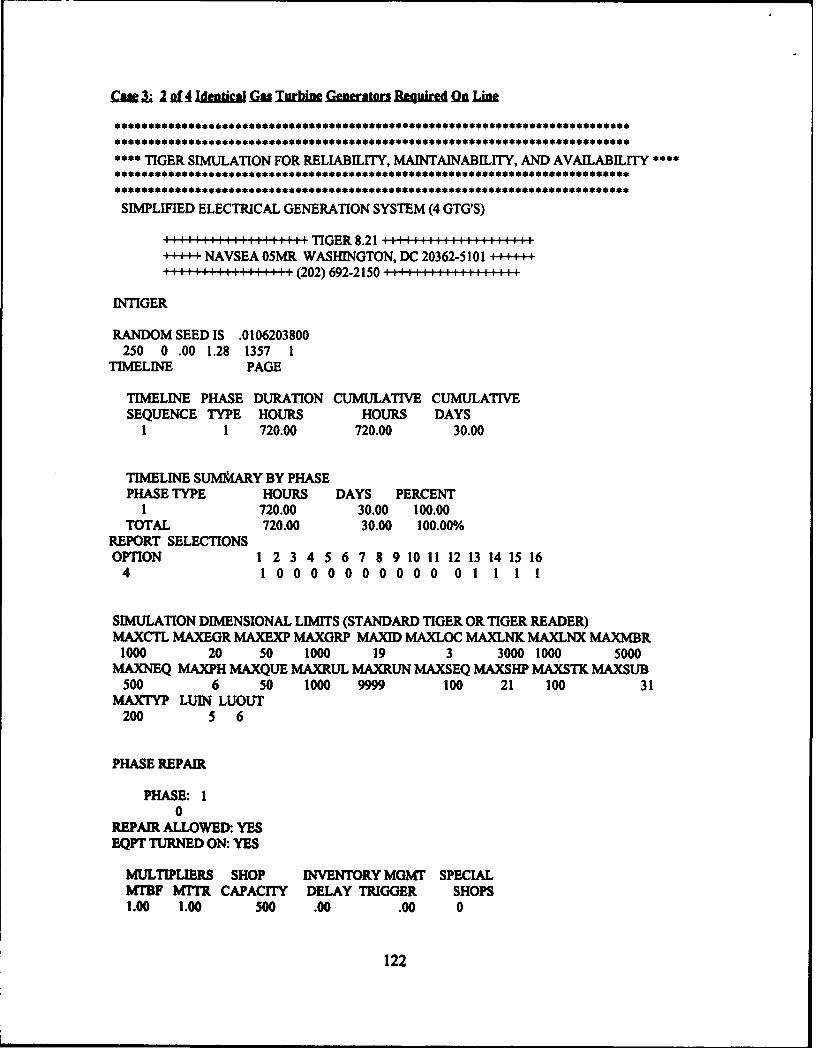
Cme 3I 2I t4 IdmiaI Gas Iui Generator Bagiud On Lint
****************** * ******************* *** ***** ** *** ** **************
**** TIGER SIMULATION FOR RELIABILITY, MAINTAINABILITY, AND AVAILABILITY*
SIMPLIFIED ELECTRICAL GENERATION SYSTEM (4 GTG'S)
- NAVSEA 05MR WASHINGTON, DC 20362-5 101111111111111111(202) 692-2150 III:1111
INTIGER
RANDOM SEED IS .0106203800250 0 .00 1.28 1357 1
TIMELINE PAGE
TIMELINE PHASE DURATION CUMULATIVE CUMULATIVESEQUENCE TYPE HOURS HOURS DAYS
1 1 720.00 720.00 30.00
TIMELINE SUMIARY BY PHASEPHASE TYPE HOURS DAYS PERCENT
1 720.00 30.00 100.00TOTAL 720.00 30.00 100.00%
REPORT SELECTIONSOPTION 1 2 3 4 5 6 7 8 9 10 11 12 13 14 15 16
4 1 0000000000 0 1 1 1 1
SIMULATION DIMENSIONAL LIMITS (STANDARD TIGER OR TIGER READER)MAXCTL MAXEGR MAXEXP MAXGRP MAXID MAXLOC MAXLNK MAXLNX MAXMBR
1000 20 50 1000 19 3 3000 1000 5000MAXNEQ MAXPH MAXQUE MAXRUL MAXRUN MAXSEQ MAXSIHP MAXSTK MAXSUB
500 6 50 1000 9999 100 21 100 31MAXTYP LUIN LUOUT
200 5 6
PHASE REPAIR
PHASE: 10
REPAIR ALLOWED:. YESEQPT TURNED ON: YES
MULTIPLIERS SHOP INVENTORY MGMT SPECIALMTBF MTTR CAPACITY DELAY TRIGGER SHOPS1.00 1.00 500 .00 .00 0
122
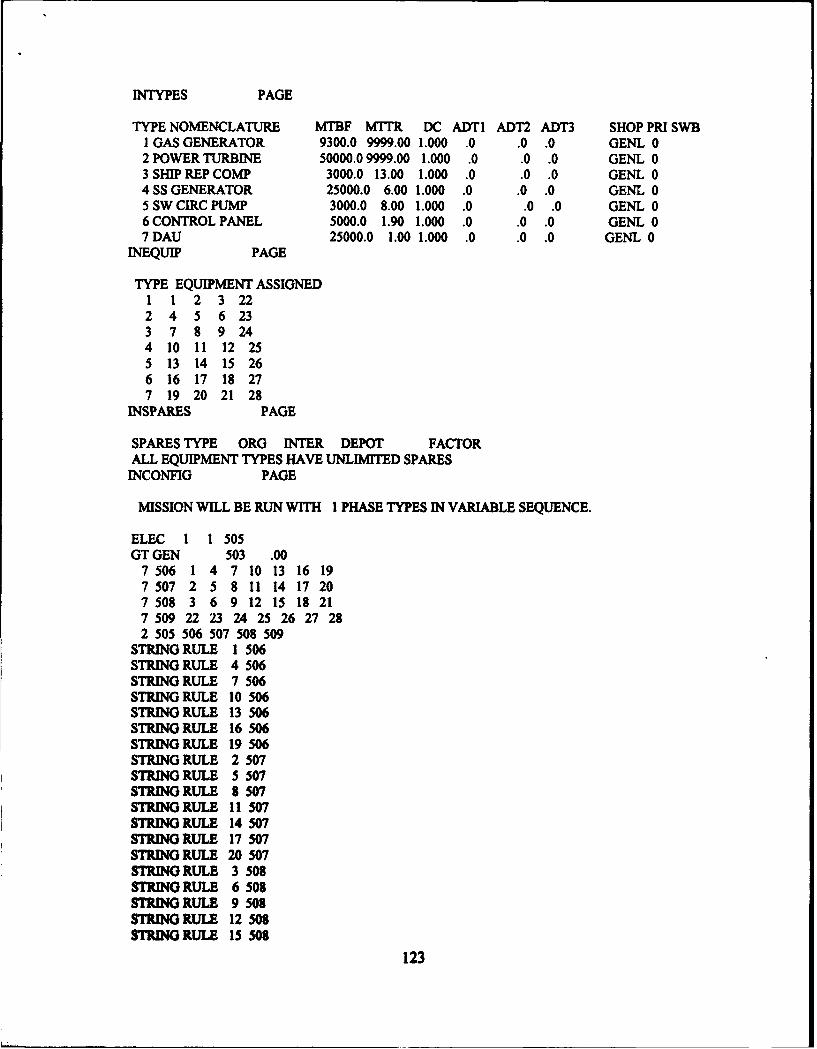
INTYPES PAGE
TYPE NOMENCLATURE MTBF MITTR DC ADTI ADT2 ADT3 SHOP PRI SWBI GAS GENERATOR 9300.0 9999.00 1.000 .0 .0 .0 GENL 02 POWER TURBINE 50000.0 9999.00 1.000 .0 .0 .0 GENL 03 SHIP REP COMP 3000.0 13.00 1.000 .0 .0 .0 GENL 04 SS GENERATOR 25000.0 6.00 1.000 .0 .0 .0 GENL 05 SW CIRC PUMP 3000.0 8.00 1.000 .0 .0 .0 GENL 06 CONTROL PANEL 5000.0 1.90 1.000 .0 .0 .0 GENL 07DAU 25000.0 1.00 1.000 .0 .0 .0 GENL 0
INEQUIP PAGE
TYPE EQUIPMENT ASSIGNED1 1 2 3 222 4 5 6 233 7 8 9 244 10 11 12 255 13 14 15 266 16 17 18 277 19 20 21 28
INSPARES PAGE
SPARES TYPE ORG INTER DEPOT FACTORALL EQUIPMENT TYPES HAVE UNLIMITED SPARES
INCONFIG PAGE
MISSION WILL BE RUN WITH 1 PHASE TYPES IN VARIABLE SEQUENCE.
ELEC 1 1 505GT GEN 503 .00
7 506 1 4 7 10 13 16 197 507 2 5 8 11 14 17 207 508 3 6 9 12 15 18 217 509 22 23 24 25 26 27 282 505 506 507 508 509
STRING RULE 1 506STRING RULE 4 506STRING RULE 7 506STRING RULE 10 506STRING RULE 13 506STRING RULE 16 506STRING RULE 19 506STRING RULE 2 507STRING RULE 5 507STRING RULE 8 507STRING RULE 11 507STRING RULE 14 507STRING RULE 17 507STRING RULE 20 507STRING RULE 3 508STRING RULE 6 508STRING RULE 9 508STRING RULE 12 508STRING RULE 15 508
123
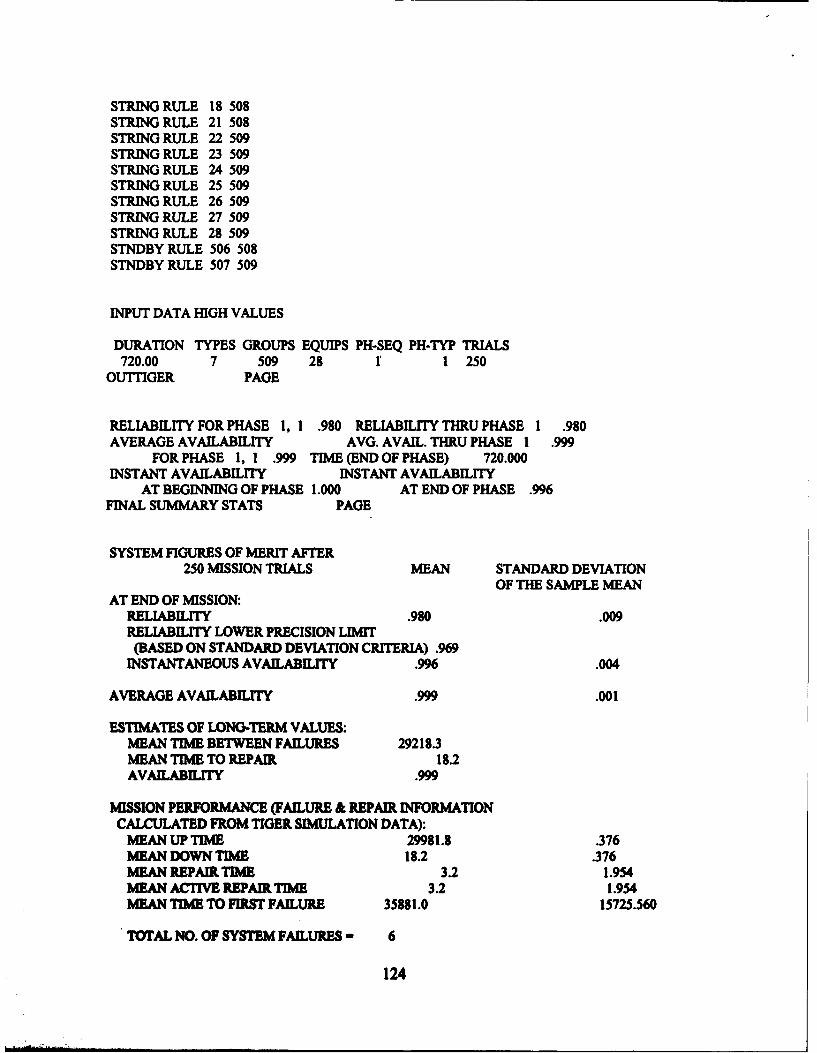
STRING RULE 18 508STRING RULE 21 508STRING RULE 22 509STRING RULE 23 509STRING RULE 24 509STRING RULE 25 509STRING RULE 26 509STRING RULE 27 509STRING RULE 28 509STNDBY RULE 506 508STNDBY RULE 507 509
INPUT DATA HIGH VALUES
DURATION TYPES GROUPS EQUIPS PH-SEQ PH-TYP TRIALS720.00 7 509 28 1 1 250
OUITIGER PAGE
RELIABILITY FOR PHASE 1, 1 .980 RELIABILITY THRU PHASE 1 .980AVERAGE AVAILABILITY AVG. AVAIL. THRU PHASE 1 .999
FOR PHASE 1, 1 .999 TIME (END OF PHASE) 720.000INSTANT AVAILABILITY INSTANT AVAILABILITY
AT BEGINNING OF PHASE 1.000 AT END OF PHASE .996FINAL SUMMARY STATS PAGE
SYSTEM FIGURES OF MERIT AFTER250 MISSION TRIALS MEAN STANDARD DEVIATION
OF THE SAMPLE MEANAT END OF MISSION:
RELIABILITY .980 .009RELIABILITY LOWER PRECISION LIMIT(BASED ON STANDARD DEVIATION CRITERIA) .969
INSTANTANEOUS AVAILABILITY .996 .004
AVERAGE AVAILABILITY .999 .001
ESTIMATES OF LONG-TERM VALUES:MEAN TIME BETWEEN FAILURES 29218.3MEAN TIME TO REPAIR 18.2AVAILABILITY .999
MISSION PERFORMANCE (FAILURE & REPAIR INFORMATIONCALCULATED FROM TIGER SIMULATION DATA):
MEAN UP TIME 29981.8 .376MEAN DOWN TIME 18.2 .376MEAN REPAIR TIME 3.2 1.954MEAN ACTIVE REPAIR TIME 3.2 1.954MEAN TIME TO FIRST FAILURE 35881.0 15725.560
TOTAL NO. OF SYSTEM FAILURES - 6
124
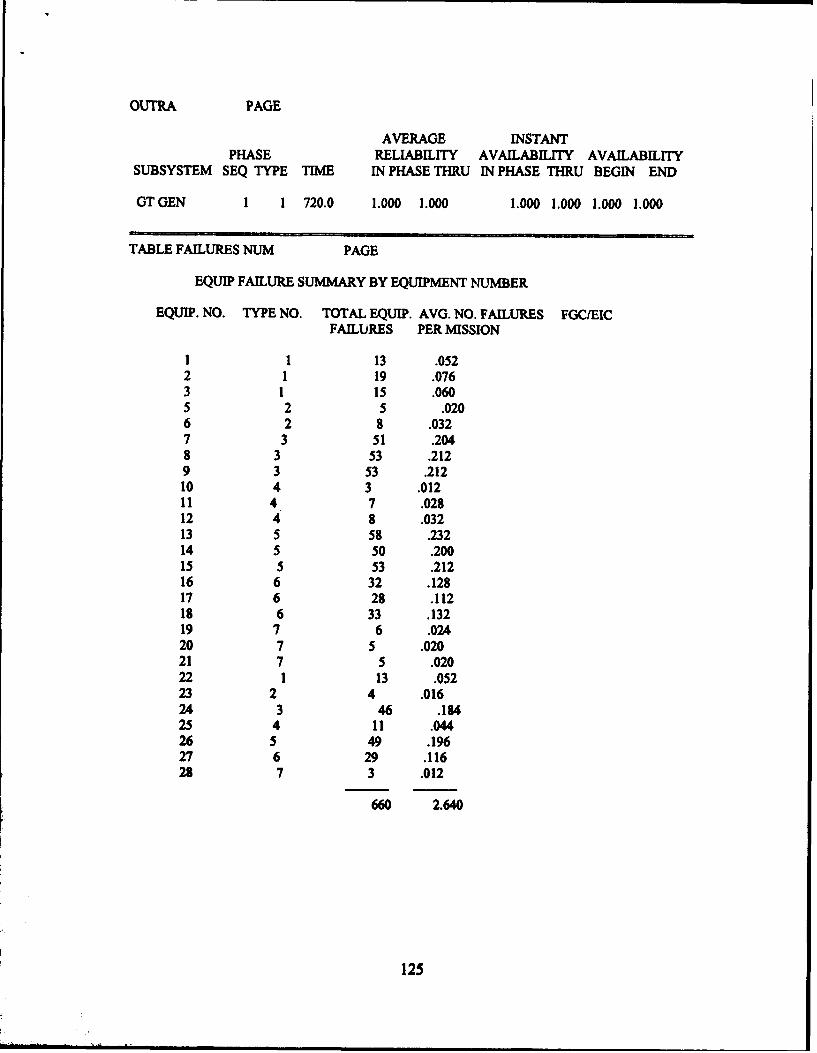
OUTRA PAGE
AVERAGE INSTANTPHASE RELIABILITY AVAILABILITY AVAILABILITY
SUBSYSTEM SEQ TYPE TIME IN PHASE THRU IN PHASE THRU BEGIN END
GTGEN 1 1 720.0 1.000 1.000 1.000 1.000 1.000 1.000
TABLE FAILURES NUM PAGE
EQUIP FAILURE SUMMARY BY EQUIPMENT NUMBER
EQUIP. NO. TYPE NO. TOTAL EQUIP. AVG. NO. FAILURES FGCIEICFAILURES PER MISSION
1 1 13 .0522 1 19 .0763 1 15 .0605 2 5 .0206 2 8 .0327 3 51 .2048 3 53 .2129 3 53 .21210 4 3 .01211 4 7 .02812 4 8 .03213 5 58 .23214 5 50 .20015 5 53 .21216 6 32 .12817 6 28 .11218 6 33 .13219 7 6 .02420 7 5 .02021 7 5 .02022 1 13 .05223 2 4 .01624 3 46 .18425 4 11 .04426 5 49 .19627 6 29 .11628 7 3 .012
660 2.640
125
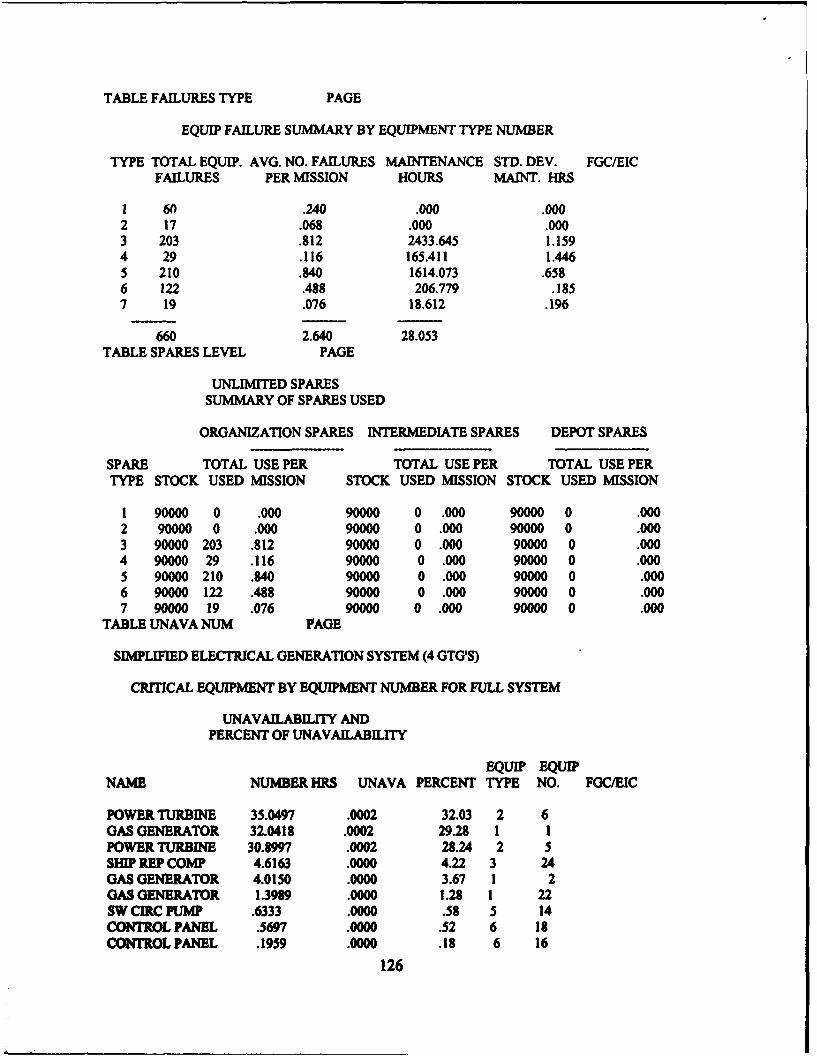
TABLE FAILURES TYPE PAGE
EQUIP FAILURE SUMMARY BY EQUIPMENT TYPE NUMBER
TYPE TOTAL EQUIP. AVG. NO. FAILURES MAINTENANCE STD. DEV. FGC/EICFAILURES PER MISSION HOURS MAINT. HRS
1 60 .240 .000 .0002 17 .068 .000 .0003 203 .812 2433.645 1.1594 29 .116 165.411 1.4465 210 .840 1614.073 .6586 122 .488 206.779 .1857 19 .076 18.612 .196
660 2.640 28.053TABLE SPARES LEVEL PAGE
UNLIMITED SPARES
SUMMARY OF SPARES USED
ORGANIZATION SPARES INTERMEDIATE SPARES DEPOT SPARES
SPARE TOTAL USE PER TOTAL USE PER TOTAL USE PERTYPE STOCK USED MISSION STOCK USED MISSION STOCK USED MISSION
1 90000 0 .000 90000 0 .000 90000 0 .0002 90000 0 .000 90000 0 .000 90000 0 .0003 90000 203 .812 90000 0 .000 90000 0 .0004 90000 29 .116 90000 0 .000 90000 0 .0005 90000 210 .840 90000 0 .000 90000 0 .0006 90000 122 .488 90000 0 .000 90000 0 .0007 90000 19 .076 90000 0 .000 90000 0 .000
TABLE UNAVA NUM PAGE
SIMPLIFIED ELECTRICAL GENERATION SYSTEM (4 GTG'S)
CRITICAL EQUIPMENT BY EQUIPMENT NUMBER FOR FULL SYSTEM
UNAVAILABILITY ANDPERCENT OF UNAVAILABILITY
EQUIP EQUIPNAME NUMBER HRS UNAVA PERCENT TYPE NO. FGC/EIC
POWERTURBINE 35.0497 .0002 32.03 2 6GAS GENERATOR 32.0418 .0002 29.28 1 1POWER TURBINE 30.8997 .0002 28.24 2 5SHIP REP COMP 4.6163 .0000 4.22 3 24GAS GENERATOR 4.0150 .0000 3.67 1 2GAS GENERATOR 1.3989 .0000 1.28 1 22SW CIRC PUMP .6333 .0000 .58 5 14CONTROL PANEL .5697 .0000 .52 6 18CONTROL PANEL .1939 .0000 .18 6 16
126
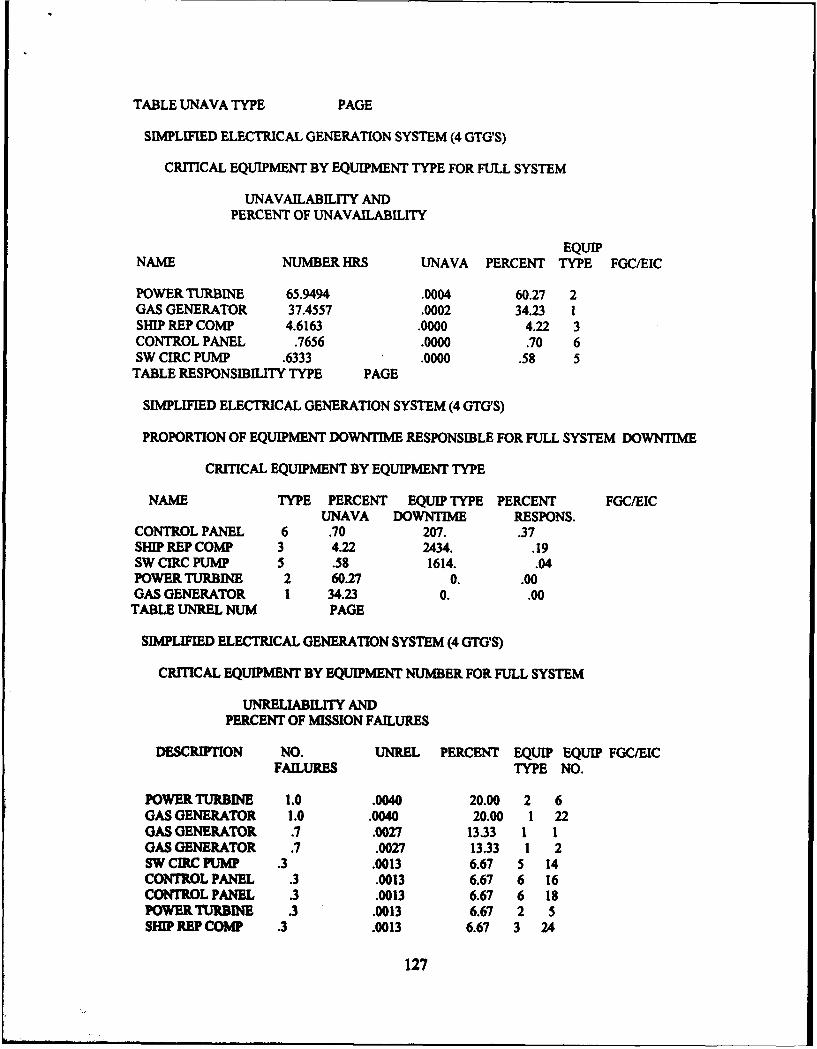
TABLE UNAVA TYPE PAGE
SIMPLIFIED ELECTRICAL GENERATION SYSTEM (4 GTG'S)
CRITICAL EQUIPMENT BY EQUIPMENT TYPE FOR FULL SYSTEM
UNAVAILABILITY ANDPERCENT OF UNAVAILABILITY
EQUIPNAME NUMBER HRS UNAVA PERCENT TYPE FGC/EIC
POWER TURBINE 65.9494 .0004 60.27 2GAS GENERATOR 37.4557 .0002 34.23 1SHIP REP COMP 4.6163 .0000 4.22 3CONTROL PANEL .7656 .0000 .70 6SW CIRC PUMP .6333 .0000 .58 5TABLE RESPONSIBILITY TYPE PAGE
SIMPLIFIED ELECTRICAL GENERATION SYSTEM (4 GTG'S)
PROPORTION OF EQUIPMENT DOWNTIME RESPONSIBLE FOR FULL SYSTEM DOWNTIME
CRITICAL EQUIPMENT BY EQUIPMENT TYPE
NAME TYPE PERCENT EQUIP TYPE PERCENT FGC/EICUNAVA DOWNTIME RESPONS.
CONTROL PANEL 6 .70 207. .37SHIP REP COMP 3 4.22 2434. .19SW CIRC PUMP 5 .58 1614. .04POWER TURBINE 2 60.27 0. .00GAS GENERATOR 1 34.23 0. .00
TABLE UNREL NUM PAGE
SIMPLIFIED ELECTRICAL GENERATION SYSTEM (4 GTG'S)
CRITICAL EQUIPMENT BY EQUIPMENT NUMBER FOR FULL SYSTEM
UNRELIABILITY ANDPERCENT OF MISSION FAILURES
DESCRIPTION NO. UNREL PERCENT EQUIP EQUIP FGC/EICFAILURES TYPE NO.
POWER TURBINE 1.0 .0040 20.00 2 6GAS GENERATOR 1.0 .0040 20.00 1 22GAS GENERATOR .7 .0027 13.33 1 1GAS GENERATOR .7 .0027 13.33 1 2SW CIRc PUMP .3 .0013 6.67 5 14CONTROL PANEL .3 .0013 6.67 6 16CONTROL PANEL .3 .0013 6.67 6 18POWER TURBINE .3 .0013 6.67 2 5SHIP REP COMP .3 .0013 6.67 3 24
127
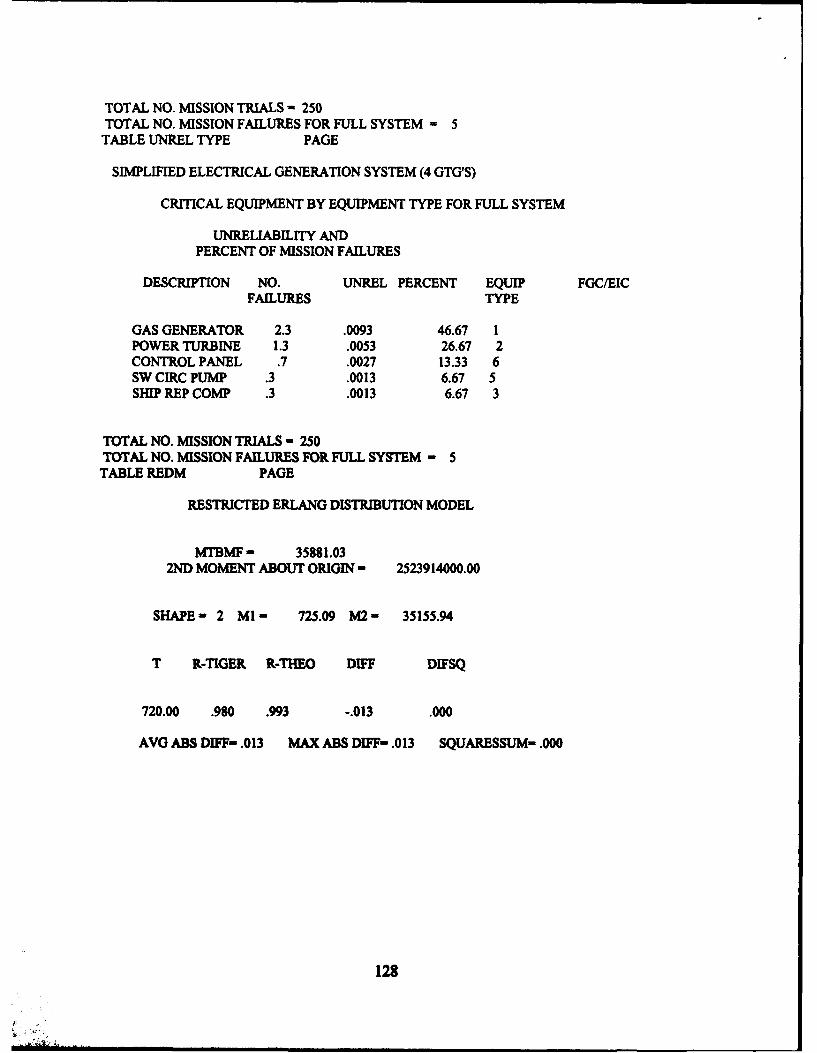
TOTAL NO. MISSION TRIALS - 250TOTAL NO. MISSION FAILURES FOR FULL SYSTEM - 5
TABLE UNREL TYPE PAGE
SIMPLIFIED ELECTRICAL GENERATION SYSTEM (4 GTG'S)
CRITICAL EQUIPMENT BY EQUIPMENT TYPE FOR FULL SYSTEM
UNRELIABILITY ANDPERCENT OF MISSION FAILURES
DESCRIPTION NO. UNREL PERCENT EQUIP FGC/EICFAILURES TYPE
GAS GENERATOR 2.3 .0093 46.67 1POWER TURBINE 1.3 .0053 26.67 2CONTROL PANEL .7 .0027 13.33 6SW CIRC PUMP .3 .0013 6.67 5SHIP REP COMP .3 .0013 6.67 3
TOTAL NO. MISSION TRIALS - 250TOTAL NO. MISSION FAILURES FOR FULL SYSTEM - 5
TABLE REDM PAGE
RESTRICTED ERLANG DISTRIBUTION MODEL
MTBMF - 35881.03
2ND MOMENT ABOUT ORIGIN - 2523914000.00
SHAPE - 2 MI- 725.09 M2 - 35155.94
T R-TIGER R-THEO DIFF DIFSQ
720.00 .980 .993 -.013 .000
AVG ABS DIFF- .013 MAX ABS DIFF- .013 SQUARESSUM- .000
128
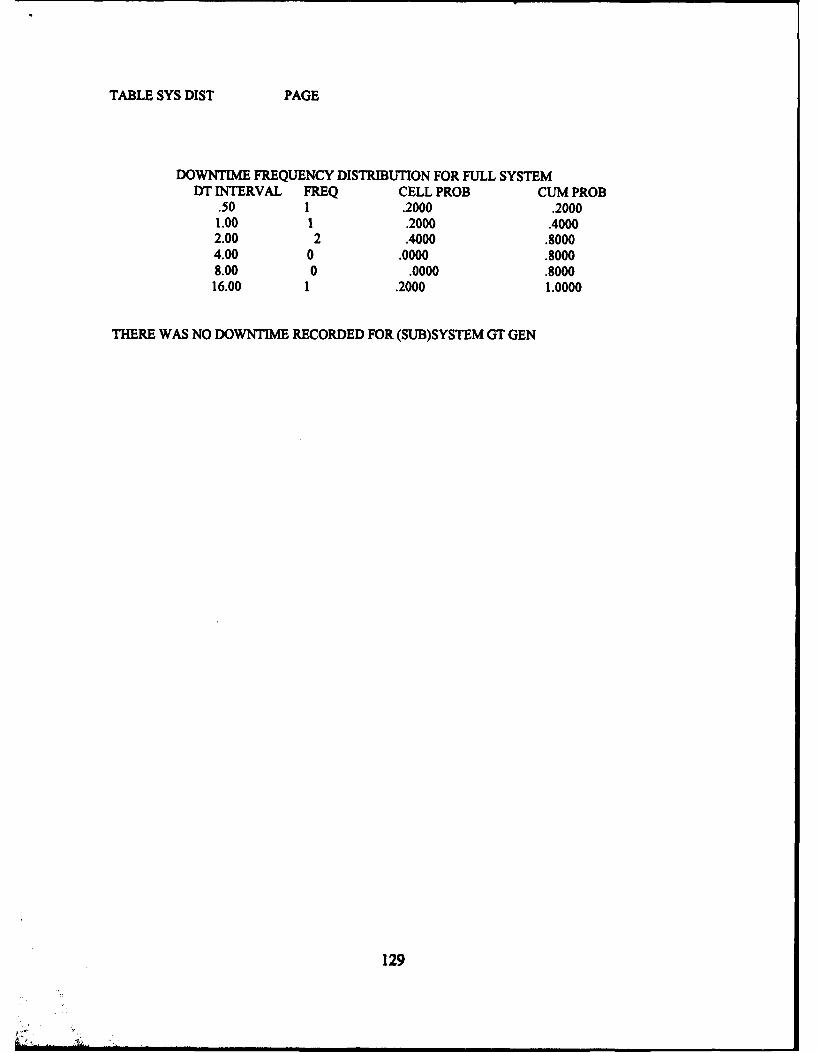
TABLE SYS DIST PAGE
DOWNTIME FREQUENCY DISTRIBUTION FOR FULL SYSTEMDT INTERVAL FREQ CELL PROB CUM PROB
.50 1 .2000 .20001.00 1 .2000 .40002.00 2 .4000 .80004.00 0 .0000 .80008.00 0 .0000 .800016.00 1 .2000 1.0000
THERE WAS NO DOWNTIME RECORDED FOR (SUB)SYSTEM GT GEN
129

Appendix C. ASSET Output Files
DDG-51 Qit fUei
ADVANCED SURFACE SHIP EVALUATION TOOL (ASSET)MONOHULL SURFACE COMBATANT PROGRAM (MONOSC)VERSION 3.3DATED OCTOBER 23,1992
ASSET/MONOSC VERSION 3.3 - RESISTANCE MODULE - 3/11/93 11.37.52.
PRINTED REPORT NO. 1 - SUMMARY
RESID RESIST IND TAYLOR BILGE KEEL IND PRESENTFRICTION LINE IND 1ITC SHAFT SUPPORT TYPE IND OPEN STRUTENDUR DISP IND AVG DISP PRPLN SYS RESIST IND CALCENDUR CONFIG IND NO TS PROP TYPE IND CPSONAR DRAG IND HULL SONAR DOME IND PRESENTSKEG IND PRESENT RUDDER TYPE IND SPADE
FULL LOAD WT, LTON 8314.0 CORR ALW 0.00040AVG ENDUR DISP, LTON 8013.9 DRAG MARGIN FAC 0.080USABLE FUEL WT, LTON 1127.6 TRAILSHAFr PWR FACNO RUDDERS 2.NO FIN PAIRS 0. PRPLN SYS RESIST FRACPROP TIP CLEAR RATIO 0.16 MAX SPEED 0.146NO PROP SHAFTS 2. SUSTN SPEED 0.162PROP DIA, FT 17.00 ENDUR SPEED 0.329
PRINTED REPORT NO. 2 - SPEED-POWER MATRIX
RESID RESIST IND TAYLORENDUR DISP END AVG DISP
130
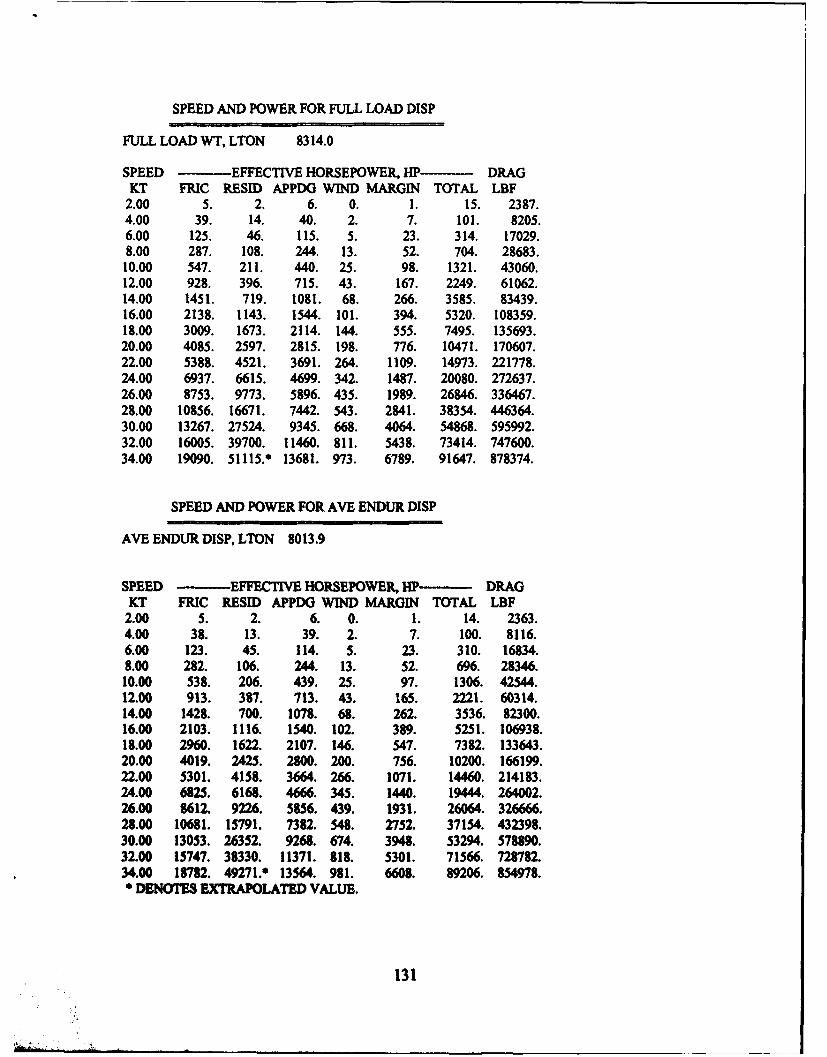
SPEED AND POWER FOR FULL LOAD DISP
FULL LOAD WT, LTON 8314.0
SPEED - EFFECTIVE HORSEPOWER, HP- DRAGKT FRIC RESID APPDG WIND MARGIN TOTAL LBF2.00 5. 2. 6. 0. 1. 15. 2387.4.00 39. 14. 40. 2. 7. 101. 8205.6.00 125. 46. 115. 5. 23. 314. 17029.8.00 287. 108. 244. 13. 52. 704. 28683.10.00 547. 211. 440. 25. 98. 1321. 43060.12.00 928. 396. 715. 43. 167. 2249. 61062.14.00 1451. 719. 1081. 68. 266. 3585. 83439.16.00 2138. 1143. 1544. 101. 394. 5320. 108359.18.00 3009. 1673. 2114. 144. 555. 7495. 135693.20.00 4085. 2597. 2815. 198. 776. 10471. 170607.22.00 5388. 4521. 3691. 264. 1109. 14973. 221778.24.00 6937. 6615. 4699. 342. 1487. 20080. 272637.26.00 8753. 9773. 5896. 435. 1989. 26846. 336467.28.00 10856. 16671. 7442. 543. 2841. 38354. 446364.30.00 13267. 27524. 9345. 668. 4064. 54868. 595992.32.00 16005. 39700. 11460. 811. 5438. 73414. 747600.34.00 19090. 51115.* 13681. 973. 6789. 91647. 878374.
SPEED AND POWER FOR AVE ENDUR DISP
AVE ENDUR DISP, LTON 8013.9
SPEED EFFECTIVE HORSEPOWER, HP DRAGKT FRIC RESID APPDG WIND MARGIN TOTAL LBF
2.00 5. 2. 6. 0. 1. 14. 2363.4.00 38. 13. 39. 2. 7. 100. 8116.6.00 123. 45. 114. 5. 23. 310. 16834.8.00 282. 106. 244. 13. 52. 696. 28346.10.00 538. 206. 439. 25. 97. 1306. 42544.12.00 913. 387. 713. 43. 165. 2221. 60314.14.00 1428. 700. 1078. 68. 262. 3536. 82300.16.00 2103. 1116. 1540. 102. 389. 5251. 106938.18.00 2960. 1622. 2107. 146. 547. 7382. 133643.20.00 4019. 2425. 2800. 200. 756. 10200. 166199.22.00 5301. 4158. 3664. 266. 1071. 14460. 214183.24.00 6825. 6168. 4666. 345. 1440. 19444. 264002.26.00 8612. 9226. 5856. 439. 1931. 26064. 326666.28.00 10681. 15791. 7382. 548. 2752. 37154. 432398.30.00 13053. 26352. 9268. 674. 3948. 53294. 578890.32.00 15747. 38330. 11371. 818. 5301. 71566. 728782.34.00 18782. 49271.* 13564. 981. 6608. 89206. 854978.* DENOTES EXTRAPOLATED VALUE.
131
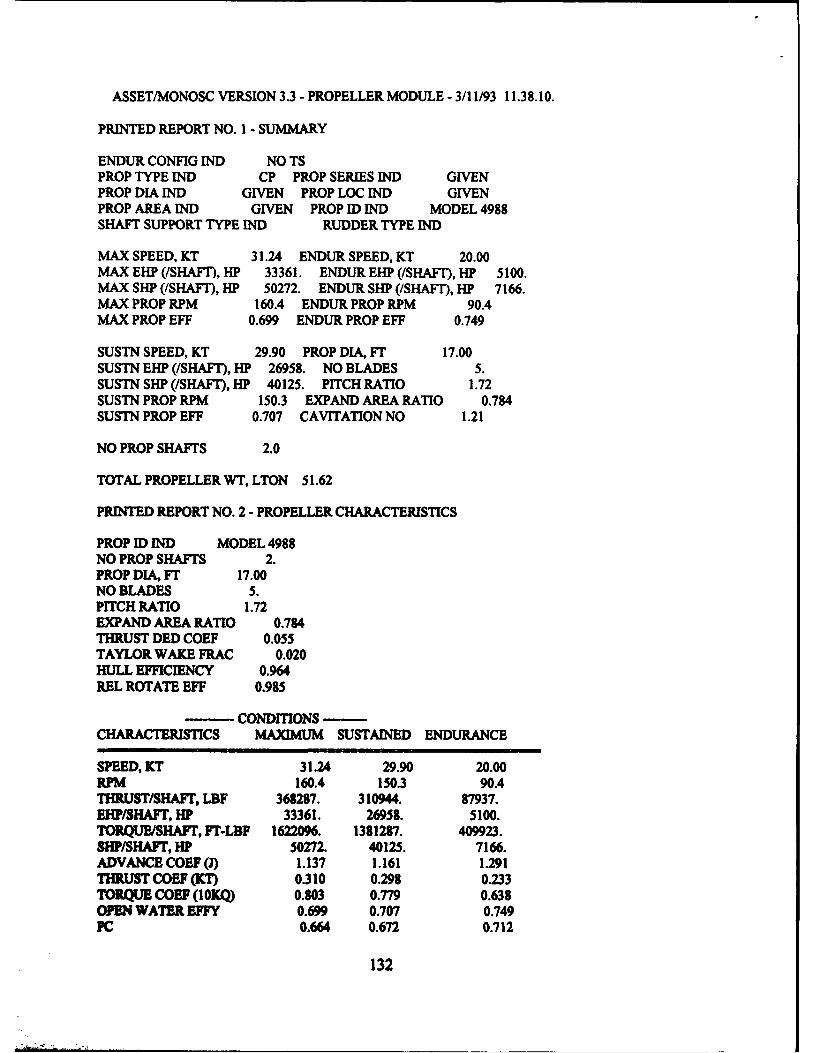
ASSET/MONOSC VERSION 3.3 - PROPELLER MODULE - 3/11/93 11.38.10.
PRINTED REPORT NO. 1 - SUMMARY
ENDUR CONFIG IND NO TSPROP TYPE IND CP PROP SERIES IND GIVENPROP DIA IND GIVEN PROP LOC IND GIVENPROP AREA IND GIVEN PROP ID IND MODEL 4988SHAFT SUPPORT TYPE IND RUDDER TYPE IND
MAX SPEED, KT 31.24 ENDUR SPEED, KT 20.00MAX EHP (/SHAFT), HP 33361. ENDUR EIP (/SHAFT), HP 5100.MAX SHP (/SHAFT), HP 50272. ENDUR SHP (/SHAFT), HP 7166.MAX PROP RPM 160.4 ENDUR PROP RPM 90.4MAX PROP EFF 0.699 ENDUR PROP EFF 0.749
SUSTN SPEED, KT 29.90 PROP DIA, FT 17.00SUSTN EHP (/SHAFT), HP 26958. NO BLADES 5.SUSTN SHP (/SHAFT), HP 40125. PITCH RATIO 1.72SUSTN PROP RPM 150.3 EXPAND AREA RATIO 0.784SUSTN PROP EFF 0.707 CAVITATION NO 1.21
NO PROP SHAFTS 2.0
TOTAL PROPELLER WT, LTON 51.62
PRINTED REPORT NO. 2 - PROPELLER CHARACTERISTICS
PROP ID IND MODEL 4988NO PROP SHAFTS 2.PROP DIA, FT 17.00NO BLADES 5.PITCH RATIO 1.72EXPAND AREA RATIO 0.784THRUST DED COEF 0.055TAYLOR WAKE FRAC 0.020HULL EFFICIENCY 0.964REL ROTATE EFF 0.985
- CONDITIONSCHARACTERISTICS MAXIMUM SUSTAINED ENDURANCE
SPEED, KT 31.24 29.90 20.00RPM 160.4 150.3 90.4THRUST/SHAFT, LBF 368287. 310944. 87937.EHP/SHAFr, HiP 33361. 26958. 5100.TORQUEISHAFT, FT-LBF 1622096. 1381287. 409923.SEHP/SHAFr, HP 50272. 40125. 7166.ADVANCE COEF (J) 1.137 1.161 1.291THRUST COEF (KO) 0.310 0.298 0.233TORQUE COEF (1OKQ) 0.803 0.779 0.638OPEN WATER EFFY 0.699 0.707 0.749PC 0.664 0.672 0.712
132
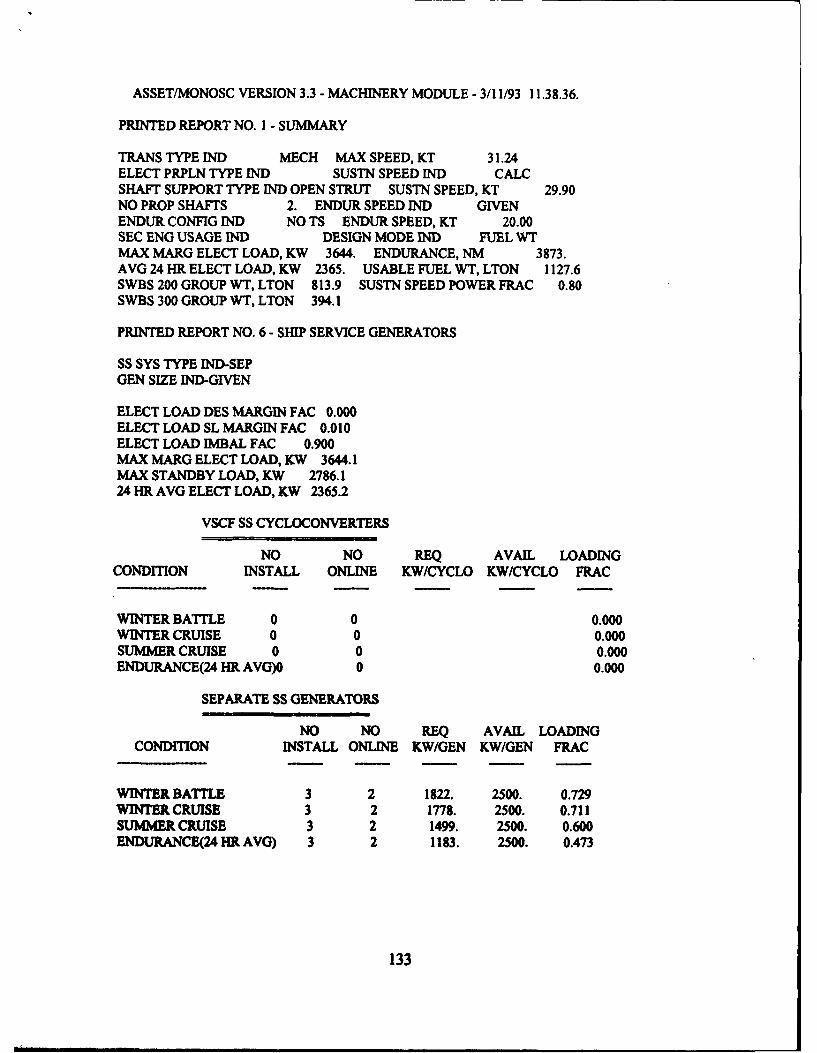
ASSET/MONOSC VERSION 3.3 - MACHINERY MODULE - 3/11/93 11.38.36.
PRINTED REPORT NO. I - SUMMARY
TRANS TYPE IND MECH MAX SPEED, KT 31.24ELECT PRPLN TYPE IND SUSTN SPEED IND CALCSHAFT SUPPORT TYPE IND OPEN STRUT SUSTN SPEED, KT 29.90NO PROP SHAFTS 2. ENDUR SPEED IND GIVENENDUR CONFIG IND NO TS ENDUR SPEED, KT 20.00SEC ENG USAGE IND DESIGN MODE IND FUEL WTMAX MARG ELECT LOAD, KW 3644. ENDURANCE, NM 3873.AVG 24 HR ELECT LOAD, KW 2365. USABLE FUEL WT, LTON 1127.6SWBS 200 GROUP WT, LTON 813.9 SUSTN SPEED POWER FRAC 0.80SWBS 300 GROUP WT, LTON 394.1
PRINTED REPORT NO. 6- SHIP SERVICE GENERATORS
SS SYS TYPE IND-SEPGEN SIZE IND-GIVEN
ELECT LOAD DES MARGIN FAC 0.000ELECT LOAD SL MARGIN FAC 0.010ELECT LOAD IMBAL FAC 0.900MAX MARG ELECT LOAD, KW 3644.1MAX STANDBY LOAD, KW 2786.124 HR AVG ELECT LOAD, KW 2365.2
VSCF SS CYCLOCONVERTERS
NO NO REQ AVAIL LOADINGCONDITION INSTALL ONLINE KW/CYCLO KW/CYCLO FRAC
WINTER BATITLE 0 0 0.000WINTER CRUISE 0 0 0.000SUMMER CRUISE 0 0 0.000ENDURANCE(24 HR AVG)0 0 0.000
SEPARATE SS GENERATORS
NO NO REQ AVAIL LOADINGCONDITION INSTALL ONLINE KW/GEN KW/GEN FRAC
WINTER BATTLE 3 2 1822. 2500. 0.729WINTER CRUISE 3 2 1778. 2500. 0.711SUMMER CRUISE 3 2 1499. 2500. 0.600ENDURANCE(24 HR AVG) 3 2 1183. 2500. 0.473
133
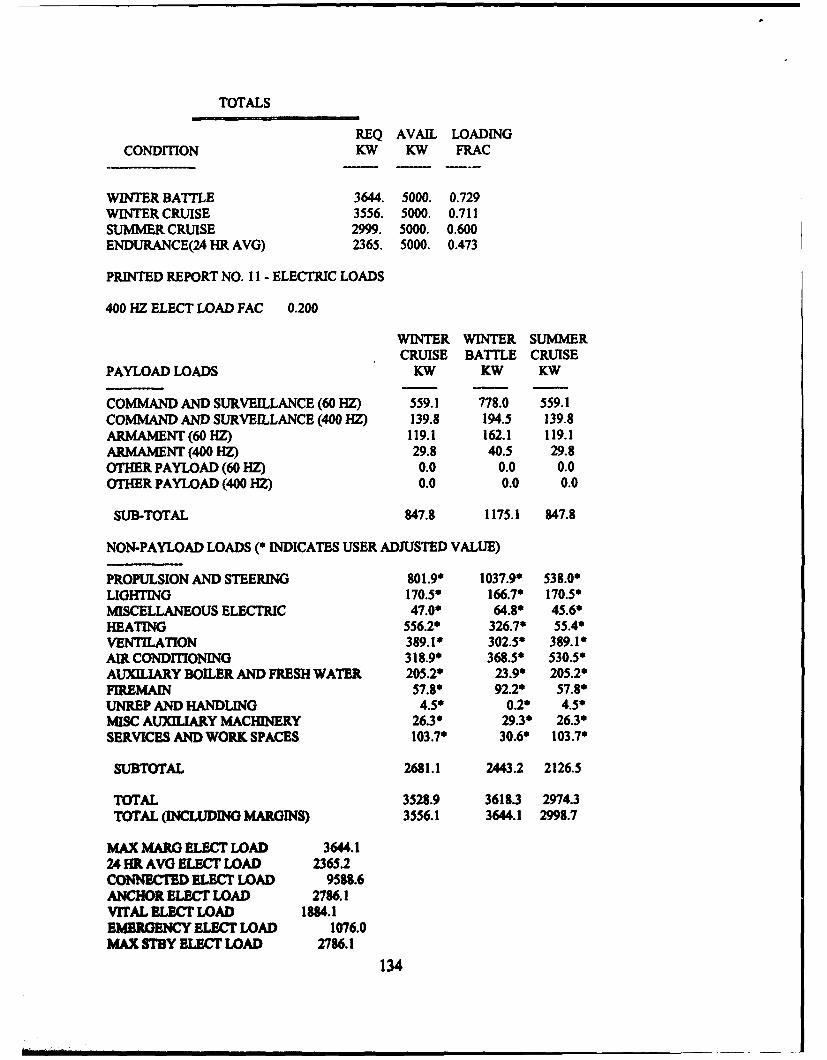
TOTALS
REQ AVAIL LOADINGCONDITION KW KW FRAC
WINTER BATTLE 3644. 5000. 0.729WINTER CRUISE 3556. 5000. 0.711SUMMER CRUISE 2999. 5000. 0.600ENDURANCE(24 HR AVG) 2365. 5000. 0.473
PRINTED REPORT NO. I - ELECTRIC LOADS
400 HZ ELECT LOAD FAC 0.200
WINTER WINTER SUMMERCRUISE BATTLE CRUISE
PAYLOAD LOADS KW KW KW
COMMAND AND SURVEILLANCE (60 HZ) 559.1 778.0 559.1COMMAND AND SURVEILLANCE (400 HZ) 139.8 194.5 139.8ARMAMENT (60 HZ) 119.1 162.1 119.1ARMAMENT (400 HZ) 29.8 40.5 29.8OTHER PAYLOAD (60 HZ) 0.0 0.0 0.0OTHER PAYLOAD (400 HZ) 0.0 0.0 0.0
SUB-TOTAL 847.8 1175.1 847.8
NON-PAYLOAD LOADS (* INDICATES USER ADJUSTED VALUE)
PROPULSION AND STEERING 801.9' 1037.9" 538.0*LIGHTING 170.50 166.7' 170.5"MISCELLANEOUS ELECTRIC 47.0* 64.8* 45.6*HEATING 556.2* 326.7* 55.4*VENTILATION 389.1" 302.5* 389.1'AIR CONDITIONING 318.9* 368.5* 530.5*AUXILIARY BOILER AND FRESH WATER 205.20 23.90 205.2*FIREMAIN 57.8' 92.2* 57.8*UNREP AND HANDLING 4.5* 0.2* 4.5*MISC AUXILIARY MACHINERY 26.3' 29.3' 26.30SERVICES AND WORK SPACES 103.7' 30.6' 103.70
SUBTOTAL 2681.1 2443.2 2126.5
TOTAL 3528.9 3618.3 2974.3TOTAL (INCLUDING MARGINS) 3556.1 3644.1 2998.7
MAX MARG ELECT LOAD 3644.124 HR AVG ELECT LOAD 2365.2CONNECTED ELECT LOAD 9588.6ANCHOR ELECT LOAD 2786.1VITAL ELECT LOAD 1884.1EMERGENCY ELECT LOAD 1076.0MAX STBY ELECT LOAD 2786.1
134

HIM DRUM fin
AL NCED SURFACE SHIP EVALUATION TOOL (ASSET)MONOHULL L AND A TYPE SHIPS (MONOLA)VERSION 1.0DATED OCTOBER 28, 1992
ASSET/MONOLA VERSION 1.0 - RESISTANCE MODULE - 3/18/93 14.45.26.
PRINTED REPORT NO. 1 - SUMM4ARY
RESID RESIST IND TAYLOR BILGE KEEL IND PRESENTFRICTION LINE IND rIrC SHAFT SUPPORT TYPE IND PODENDUR DISP [ND FULL LOAD PRPLN SYS RESIST IND CALCENDUR CONFIG IND NO TS PROP TYPE IN FPSONAR DRAG IND SONAR DOME ND NONESKEG MN NONE RUDDER TYPE IND INTEGRAL
FULL LOAD WT, LTON 41170.6 CORR ALW 0.00050AVG ENDUR DISP, LTON 41170.6 DRAG MARGIN FAC 0.110USABLE FUEL WT, LTON 4837.4 TRAILSHAFT PWR FACNO RUDDERS 2.NO FIN PAIRS 0. PRPLN SYS RESIST FRACPROP TIP CLEAR RATIO 0.10 MAX SPEED 0.120NO PROP SHAFTS 2. SUSTN SPEED 0.127PROP DIA, FT 14.14 ENDUR SPEED 0.127
PRINTED REPORT NO. 2 - SPEED-POWER MATRIX
RESID RESIST IND TAYLORENDUR DISP IND FULL LOAD
SPEED AND POWER FOR FULL LOAD DISP
FULL LOAD WT, LTON 41170.6
SPEED - EFFECTIVE HORSEPOWER, HP DRAGKT FRIC RESID APPDG WIND MARGIN TOTAL LBF
2.00 17. 7. 12. 0. 4. 40. 6549.4.00 125. 55. 61. 3. 27. 270. 22002.6.00 404. 185. 156. 11. 83. 839. 45590.8.00 932. 439. 306. 26. 187. 1891. 77027.10.00 1783. 857. 519. 51. 353. 3564. 116136.12.00 3030. 1481. 801. 89. 594. 5995. 162794.14.00 4746. 2351. 1157. 141. 923. 9319. 216908.16.00 7000. 3510. 1594. 210. 1355. 13670. 278404.18.00 9864. 5059. 2122. 300. 1908. 19253. 348551.
135
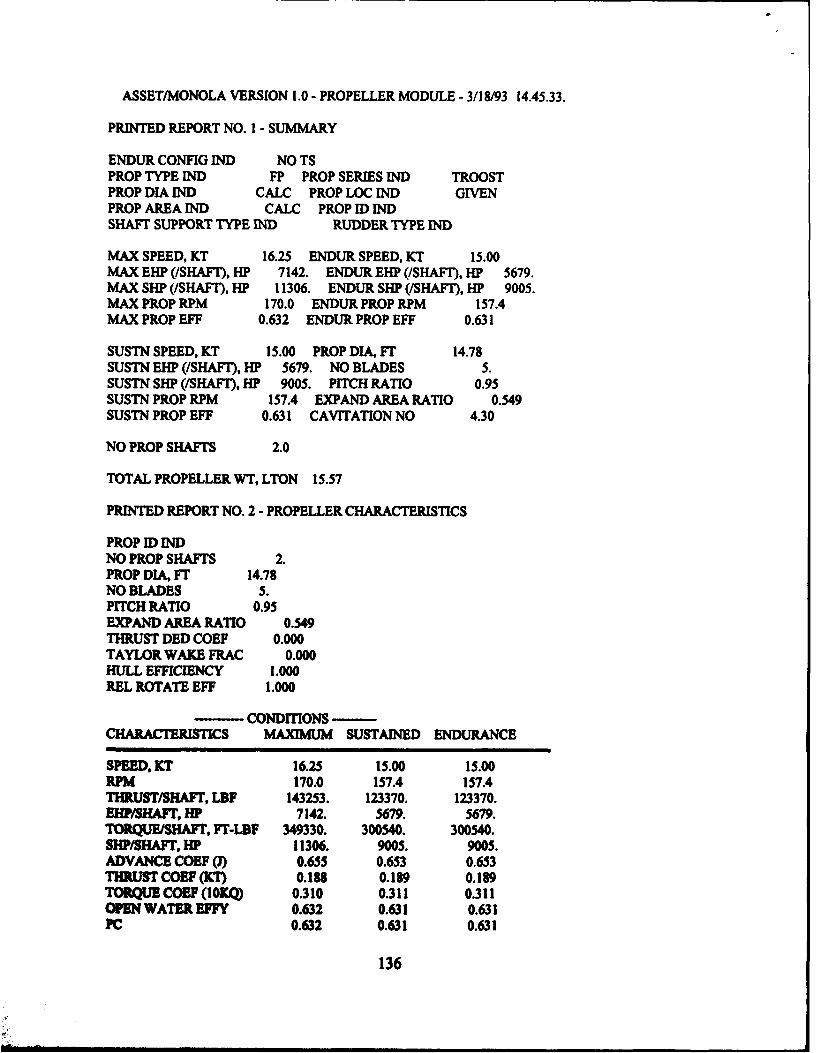
ASSET/MONOLA VERSION 1.0- PROPELLER MODULE - 3/18/93 14.45.33.
PRINTED REPORT NO. 1 - SUMMARY
ENDUR CONFIG IND NO TSPROP TYPE IND FP PROP SERIES IND TROOSTPROP DIA IND CALC PROP LOC IND GIVENPROP AREA IND CALC PROP ID INDSHAFT SUPPORT TYPE IND RUDDER TYPE IND
MAX SPEED, KT 16.25 ENDUR SPEED, KT 15.00MAX EHP (/SHAFT), HP 7142. ENDUR EIHP (/SHAFT), HP 5679.MAX SHP (/SHAFT), HP 11306. ENDUR SHP (/SHAFT), HP 9005.MAX PROP RPM 170.0 ENDUR PROP RPM 157.4MAX PROP EFF 0.632 ENDUR PROP EFF 0.631
SUSTN SPEED, KT 15.00 PROP DIA, FT 14.78SUSTN EIHP (/SHAFT), HP 5679. NO BLADES 5.SUSTN SHP (/SHAFT), HP 9005. PITCH RATIO 0.95SUSTN PROP RPM 157.4 EXPAND AREA RATIO 0.549SUSTN PROP EFF 0.631 CAVITATION NO 4.30
NO PROP SHAFTS 2.0
TOTAL PROPELLER WT, LTON 15.57
PRINTED REPORT NO. 2 - PROPELLER CHARACTERISTICS
PROP ID INDNO PROP SHAFTS 2.PROP DIA, FT 14.78NO BLADES 5.PITCH RATIO 0.95EXPAND AREA RATIO 0.549THRUST DED COEF 0.000TAYLOR WAKE FRAC 0.000HULL EFFICIENCY 1.000REL ROTATE EFF 1.000
CONDITIONS -
CHARACTERISTICS MAXIMUM SUSTAINED ENDURANCE
SPEED. KT 16.25 15.00 15.00RPM 170.0 157.4 157.4THRUST/SHAFT, LBF 143253. 123370. 123370.EMH/SHAFT, HP 7142. 5679. 5679.TORQUE/SHAFr, FI-LBF 349330. 300540. 300540.SlIP/SHAFT, HP 11306. 9005. 9005.ADVANCE COEF (J) 0.655 0.653 0.653THRUSTCOEF(OT) 0.188 0.189 0.189"TORQUE COEF (10MQ 0.310 0.311 0.311OPEN WATER EFFY 0.632 0.631 0.631PC 0.632 0.631 0.631
136
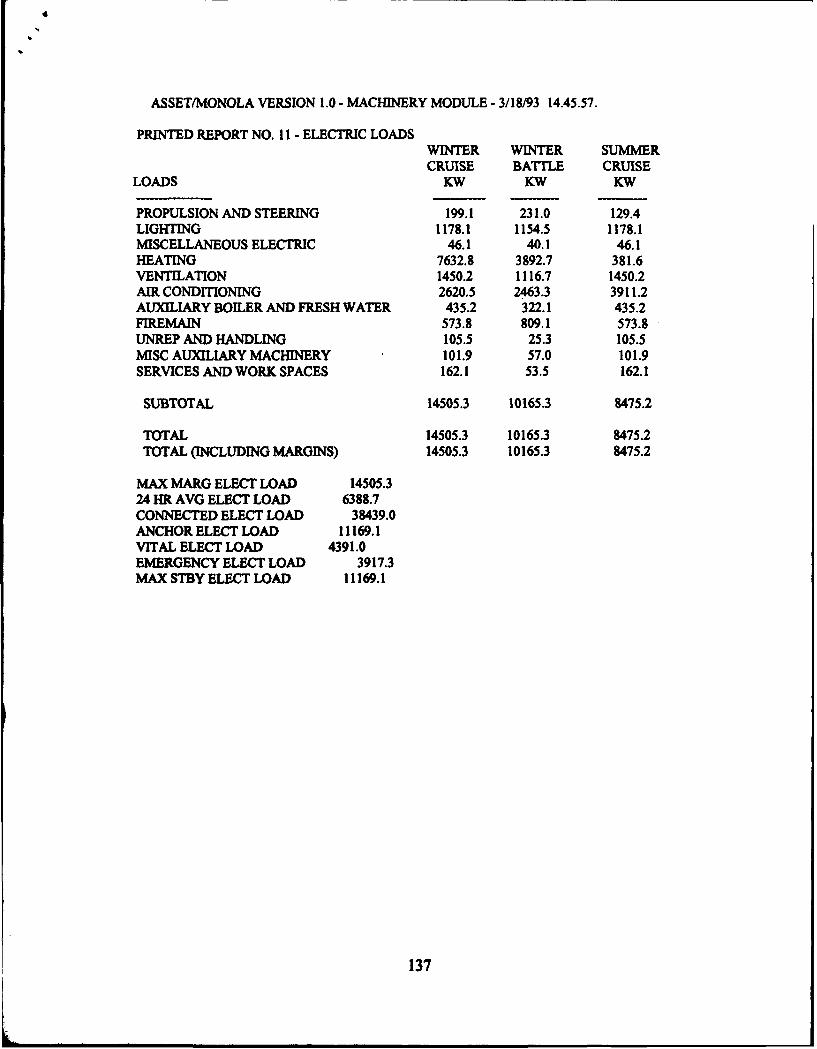
ASSET/MONOLA VERSION 1.0 - MACHINERY MODULE - 3/18/93 14.45.57.
PRINTED REPORT NO. I - ELECTRIC LOADSWINTER WINTER SUMMERCRUISE BATTLE CRUISE
LOADS KW KW KW
PROPULSION AND STEERING 199.1 231.0 129.4LIGHTING 1178.1 1154.5 1178.1MISCELLANEOUS ELECTRIC 46.1 40.1 46.1HEATING 7632.8 3892.7 381.6VENTILATION 1450.2 1116.7 1450.2AIR CONDITIONING 2620.5 2463.3 3911.2AUXILIARY BOILER AND FRESH WATER 435.2 322.1 435.2FIREMAIN 573.8 809.1 573.8UNREP AND HANDLING 105.5 25.3 105.5MISC AUXILIARY MACHINERY 101.9 57.0 101.9SERVICES AND WORK SPACES 162.1 53.5 162.1
SUBTOTAL 14505.3 10165.3 8475.2
TOTAL 14505.3 10165.3 8475.2TOTAL (INCLUDING MARGINS) 14505.3 10165.3 8475.2
MAX MARG ELECT LOAD 14505.324 HR AVG ELECT LOAD 6388.7CONNECTED ELECT LOAD 38439.0ANCHOR ELECT LOAD 11169.1VITAL ELECT LOAD 4391.0EMERGENCY ELECT LOAD 3917.3MAX STBY ELECT LOAD 11169.1
137

Since it was desired to work with the total connected load and not the operating
loads, the following procedure was used to estimate the total connected load.
I. The worst case load in each category estimated by ASSET was taken as the
starting point. Since the worst case heating load was higher than the worst air
conditioning load, the air conditioning load was ignored for this analysis.
2. The loads in each category were changed based on the basis of the estimate as
discussed above to determine the actual maximum operating load.
3. The loads in each category were multiplied by 2.65 as an estimate of the total
connected load in that category.
4. The total connected loads in each category were then increased by 10% for
growth margin.
The above procedure is considered both reasonable and conservative given the
nature of the HL(X). The results are summarized in Table 1.
139
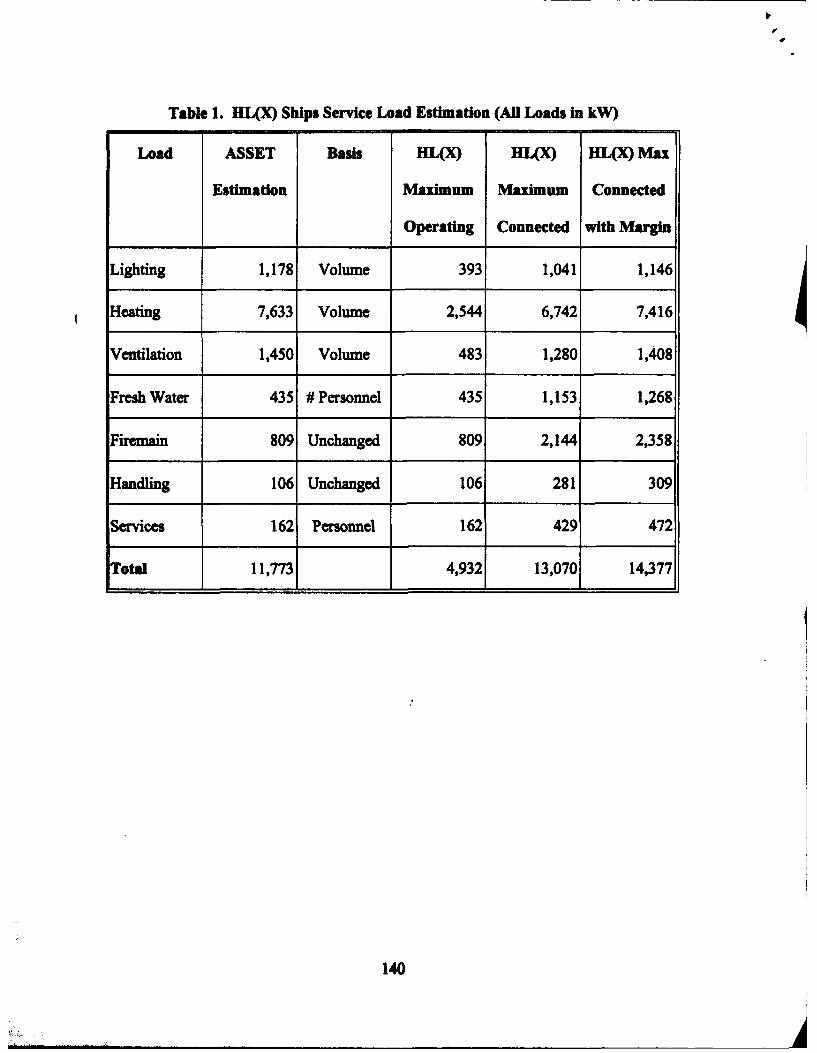
Table 1. HL(X) Ships Service Load Estimation (AUl Loads In kW)
Load ASSET Basis HL(X) HL(X) HL(X) Max
Estimation Maximum Maximum Connected
Operating Connected with Margin
Lighting 1,178 Volume 393 1,041 1,146
Heating 7,633 Volume 2,544 6,742 7,416
Ventilation 1,450 Volume 483 1,280 1,408
Fresh Water 435 # Personnel 435 1,153 1,268
Firemain 809 Unchanged 809 2,144 2,358
Handling 106 Unchanged 106 281 309
Services 162 Personnel 162 429 472
Total 11,773 4,932 13,070 14,377
140