Embed Size (px)
Citation preview

FILATEX INDIA LIMITED CIN N0.L17119DN1990PLC000091
FI L/S E/2018-19/40 1st November, 2018
National Stock Exchange o f India Limited Listing Department5th Floor, Exchange Plaza, C - l, Block-G, Bandra-Kurla Complex, Bandra (E) Mumbai-400 051 Security Symbol: FILATEX
BSE Limited Listing Department25th Floor, Pheroze Jeejeebhoy Towers Dalai Street,Mumbai - 400 001 Security Code: 526227
Sub: Investor Presentation - October 2018
Dear Sirs/ Madam,
Pursuant to Regulation 30(2) of the SEBI (Listing Obligations and Disclosure Requirements) Regulations, 2015 read w ith Para A of Part A o f Schedule III, please find enclosed herewith the Investor Presentation - October 2018 which we propose to share w ith Analysts & Investors.
This is for your inform ation and records please.
Thanking You,
Yours Faithfully,For FILATEX INDIA LIMITED
COM PANY SECRETARY
Enel.: a/a
C O R P O R A T E O F F IC E R E G D . O F F IC E & W O R K S S U R A T O F F IC E M U M B A I O F F IC E
Bhageria House43 Community Centre New Friends Colony New Delhi ■ 110025, India
S. No. 274 Demni Road Dadra - 396193 U.T. of-Dadra & Nagar Haveli India
Bhageria House Ring Road Surat ■ 395002 India
321, Maker Chamber • V Nariman Point Mumbai - 400021 India
P +91.11.26312503,26848633/44 F +91.11.26849915 E [email protected]
P +91.260.2668343/8510 F +91.260.2668344E [email protected]
P +91.261.4030000 F +91.261.2310796 E [email protected]
Website: www.filatex.com
P +91.22.22026005/06 F +91.22.22026006 E [email protected]
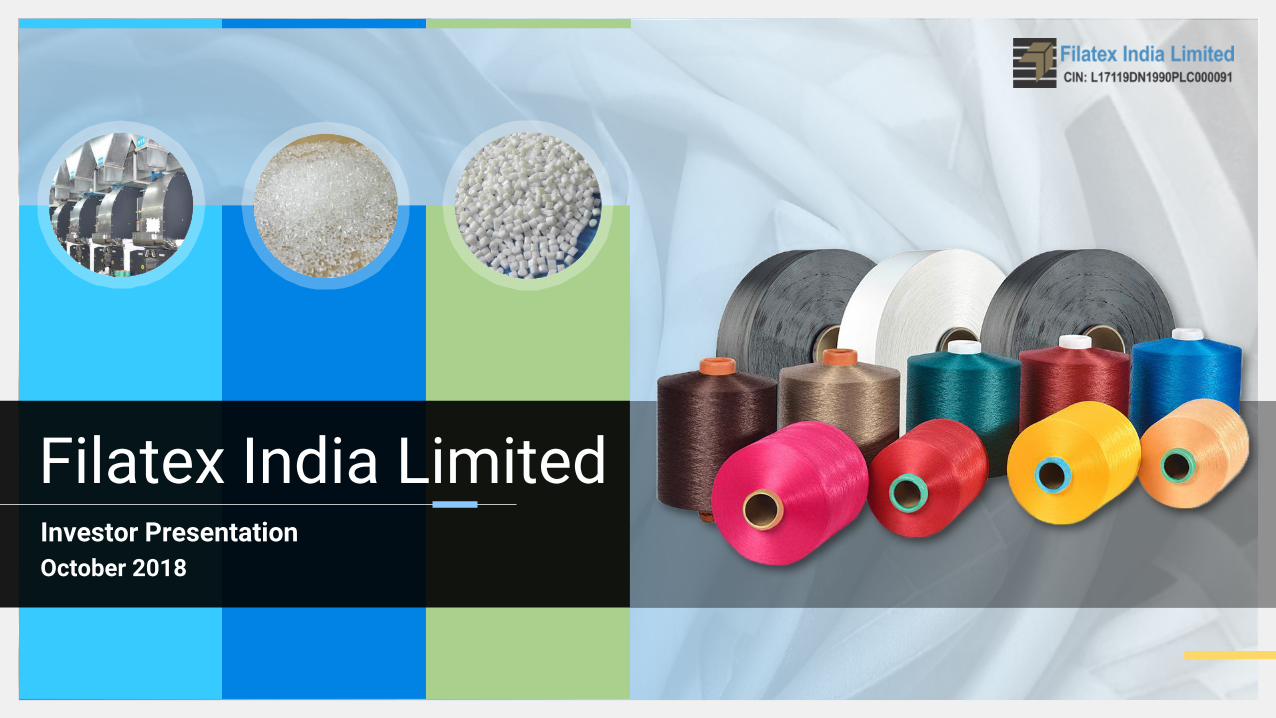
Filatex India LimitedInvestor Presentation
October 2018
FIL | Investor Presentation | October 2018
DisclaimerThis presentation and the accompanying slides (the “Presentation”), which have been prepared by Filatex India Limited (the “Company”), have been prepared solely forinformation purposes and do not constitute any offer, recommendation or invitation to purchase or subscribe for any securities, and shall not form the basis or be relied on inconnection with any contract or binding commitment what so ever. No offering of securities of the Company will be made except by means of a statutory offering documentcontaining detailed information about the Company.
This Presentation has been prepared by the Company based on information and data which the Company considers reliable, but the Company makes no representation orwarranty, express or implied, whatsoever, and no reliance shall be placed on, the truth, accuracy, completeness, fairness and reasonableness of the contents of thisPresentation. This Presentation may not be all inclusive and may not contain all of the information that you may consider material. Any liability in respect of the contents of,or any omission from, this Presentation is expressly excluded.
Certain matters discussed in this Presentation may contain statements regarding the Company’s market opportunity and business prospects that are individually andcollectively forward-looking statements. Such forward-looking statements are not guarantees of future performance and are subject to known and unknown risks,uncertainties and assumptions that are difficult to predict. These risks and uncertainties include, but are not limited to, the performance of the Indian economy and of theeconomies of various international markets, the performance of the industry in India and world-wide, competition, the company’s ability to successfully implement itsstrategy, the Company’s future levels of growth and expansion, technological implementation, changes and advancements, changes in revenue, income or cash flows, theCompany’s market preferences and its exposure to market risks, as well as other risks. The Company’s actual results, levels of activity, performance or achievements coulddiffer materially and adversely from results expressed in or implied by this Presentation. The Company assumes no obligation to update any forward-looking informationcontained in this Presentation. Any forward-looking statements and projections made by third parties included in this Presentation are not adopted by the Company and theCompany is not responsible for such third party statements and projections.
2
FIL | Investor Presentation | 2017-18
Co
nte
nt
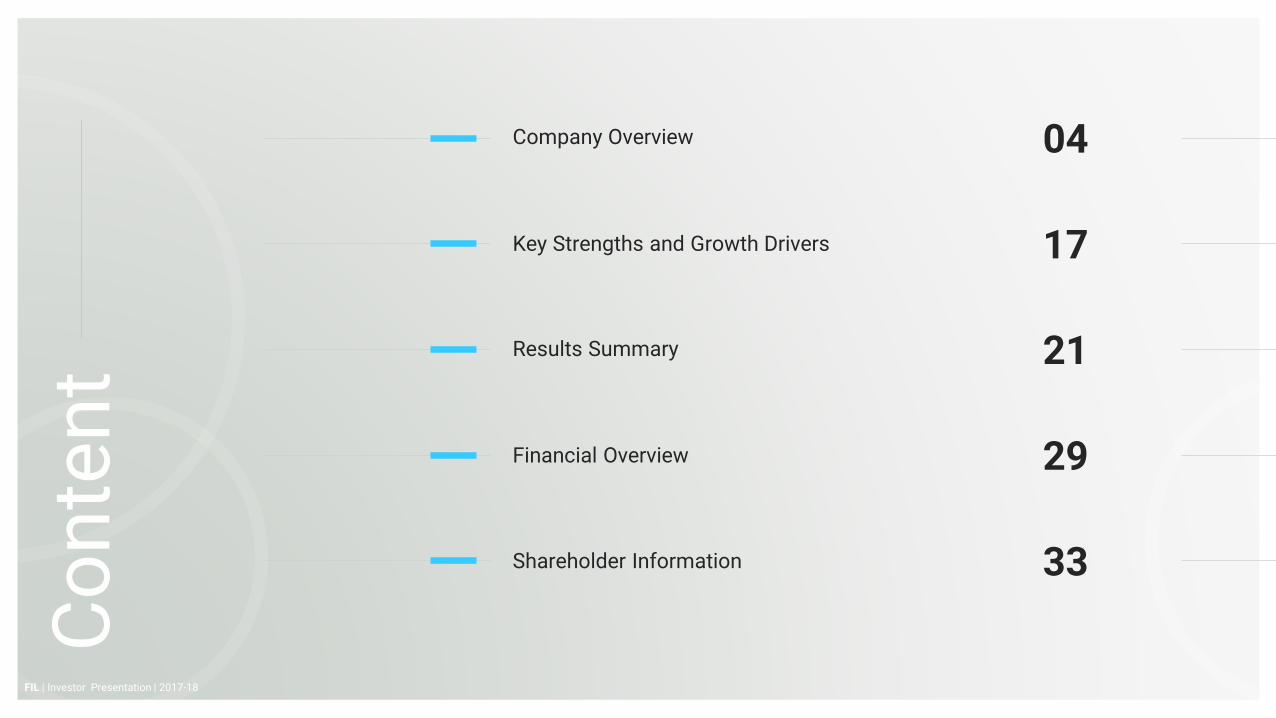
Company Overview 04
Key Strengths and Growth Drivers 17
Results Summary 21
Financial Overview 29
Shareholder Information 33
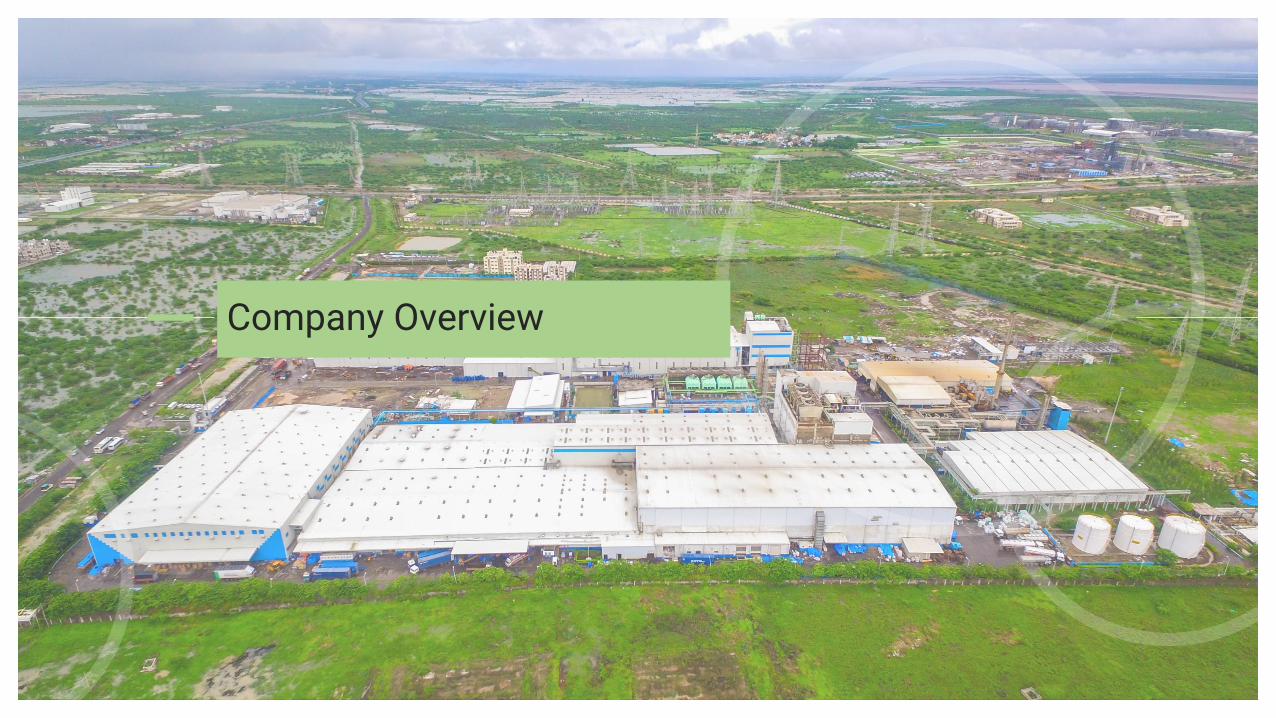
Company Overview
FIL | Investor Presentation | October 2018
About Us
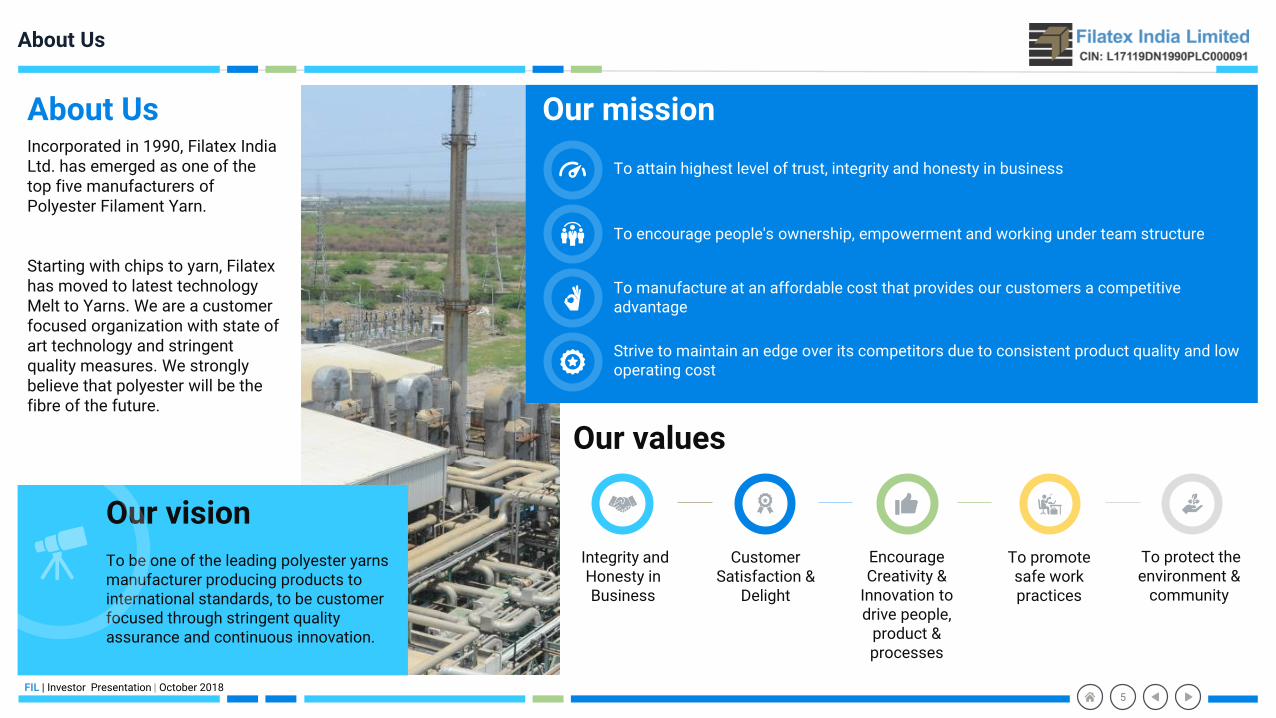
About UsIncorporated in 1990, Filatex India Ltd. has emerged as one of the top five manufacturers of Polyester Filament Yarn.
Starting with chips to yarn, Filatexhas moved to latest technology Melt to Yarns. We are a customer focused organization with state of art technology and stringent quality measures. We strongly believe that polyester will be the fibre of the future.
Our vision
To be one of the leading polyester yarns manufacturer producing products to international standards, to be customer focused through stringent quality assurance and continuous innovation.
Our mission
Integrity and Honesty in Business
Our values
Customer Satisfaction &
Delight
Encourage Creativity &
Innovation to drive people,
product & processes
To promote safe work practices
To protect the environment &
community
5
To attain highest level of trust, integrity and honesty in business
To manufacture at an affordable cost that provides our customers a competitive advantage
To encourage people's ownership, empowerment and working under team structure
Strive to maintain an edge over its competitors due to consistent product quality and low operating cost
FIL | Investor Presentation | October 2018
Polyester – The Preferred Fibre
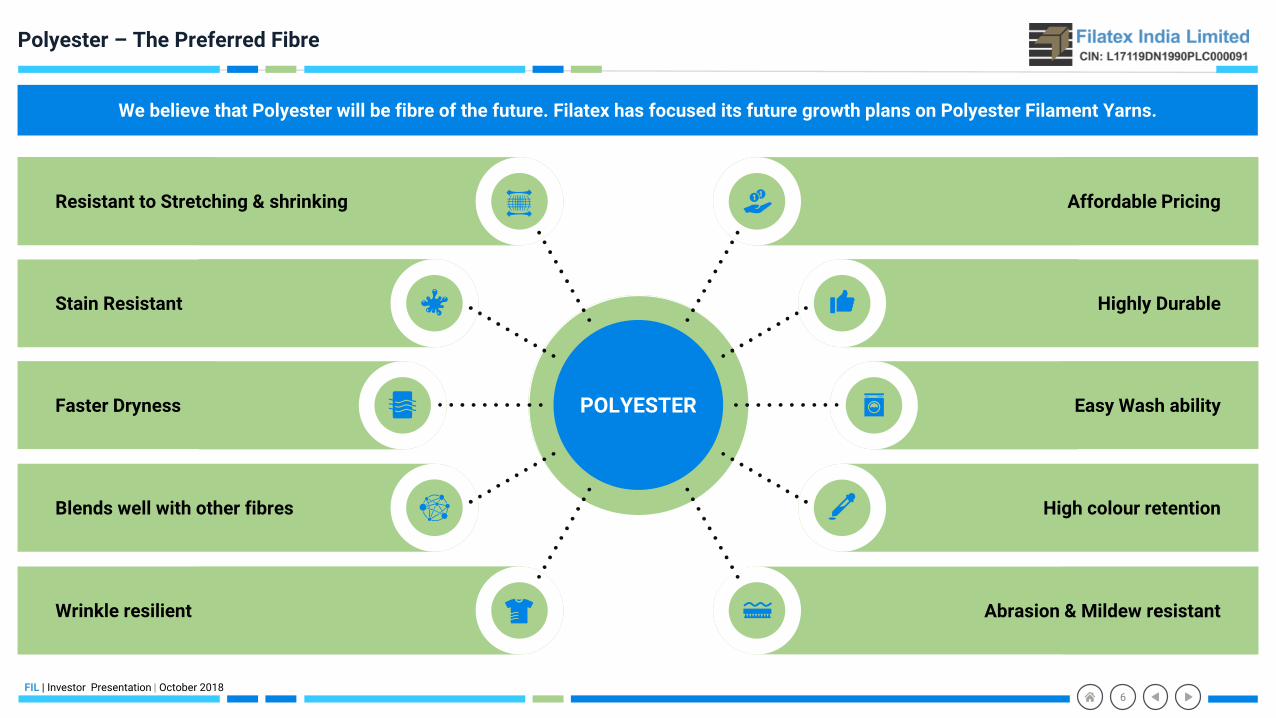
We believe that Polyester will be fibre of the future. Filatex has focused its future growth plans on Polyester Filament Yarns.
Resistant to Stretching & shrinking
Stain Resistant
Faster Dryness
Blends well with other fibres
Wrinkle resilient
Affordable Pricing
Highly Durable
Easy Wash ability
High colour retention
Abrasion & Mildew resistant
POLYESTER
6
FIL | Investor Presentation | October 2018
Salient Facts And Figures
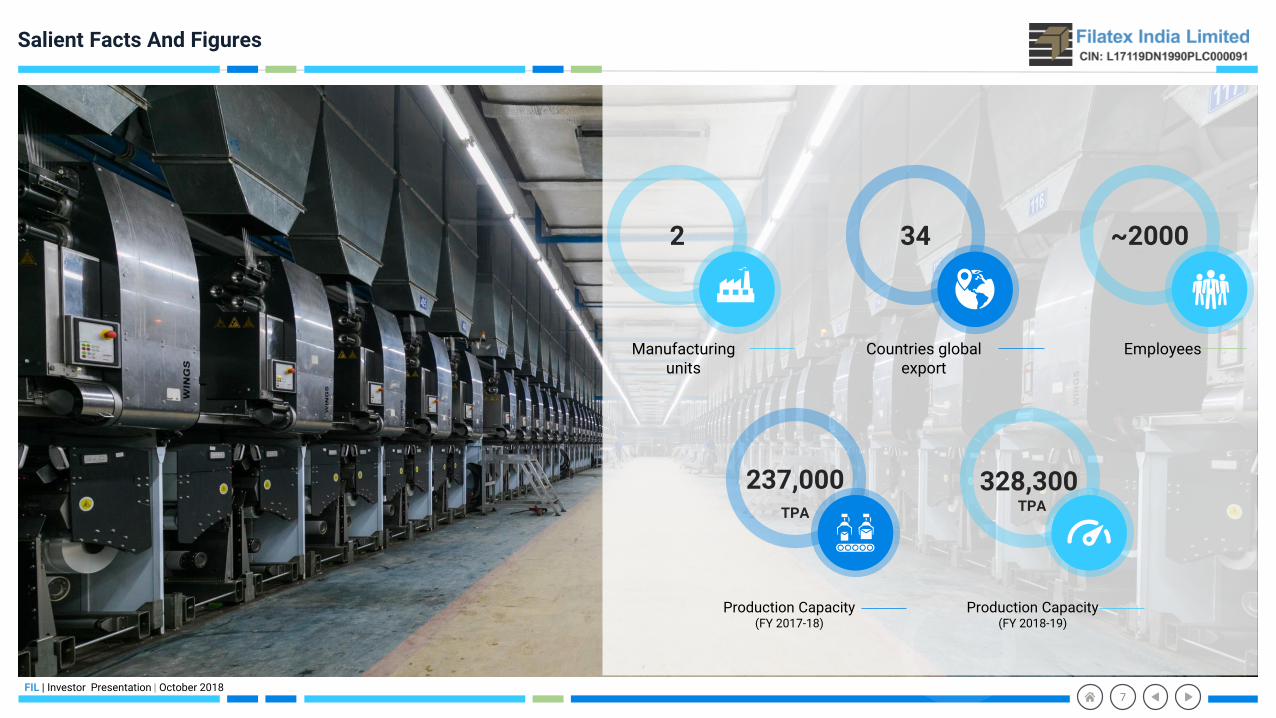
Employees
~2000
Countries global export
34
Manufacturing units
2
Production Capacity(FY 2018-19)
328,300 TPA
Production Capacity(FY 2017-18)
237,000 TPA
7
FIL | Investor Presentation | October 2018
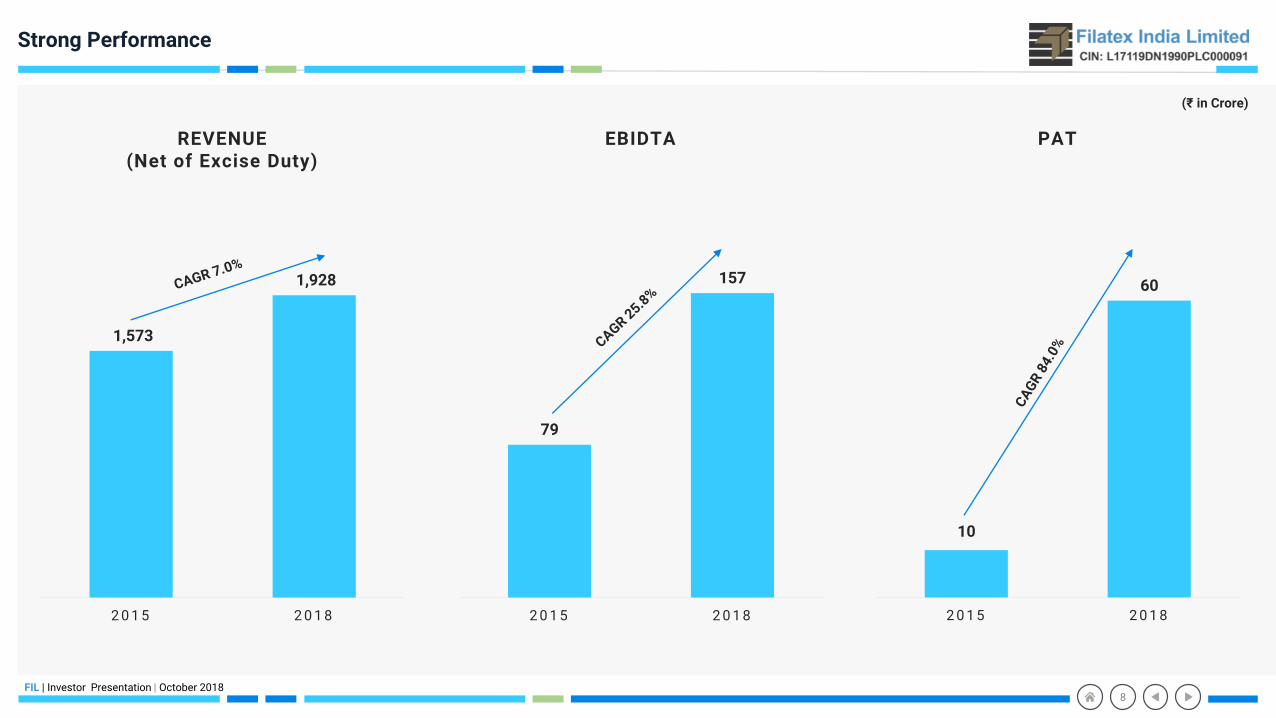
79
157
2 0 1 5 2 0 1 8
EBIDTA
Strong Performance
10
60
2 0 1 5 2 0 1 8
PAT
1,573
1,928
2 0 1 5 2 0 1 8
REVENUE (Net of Excise Duty)
(₹ in Crore)
8
FIL | Investor Presentation | October 2018
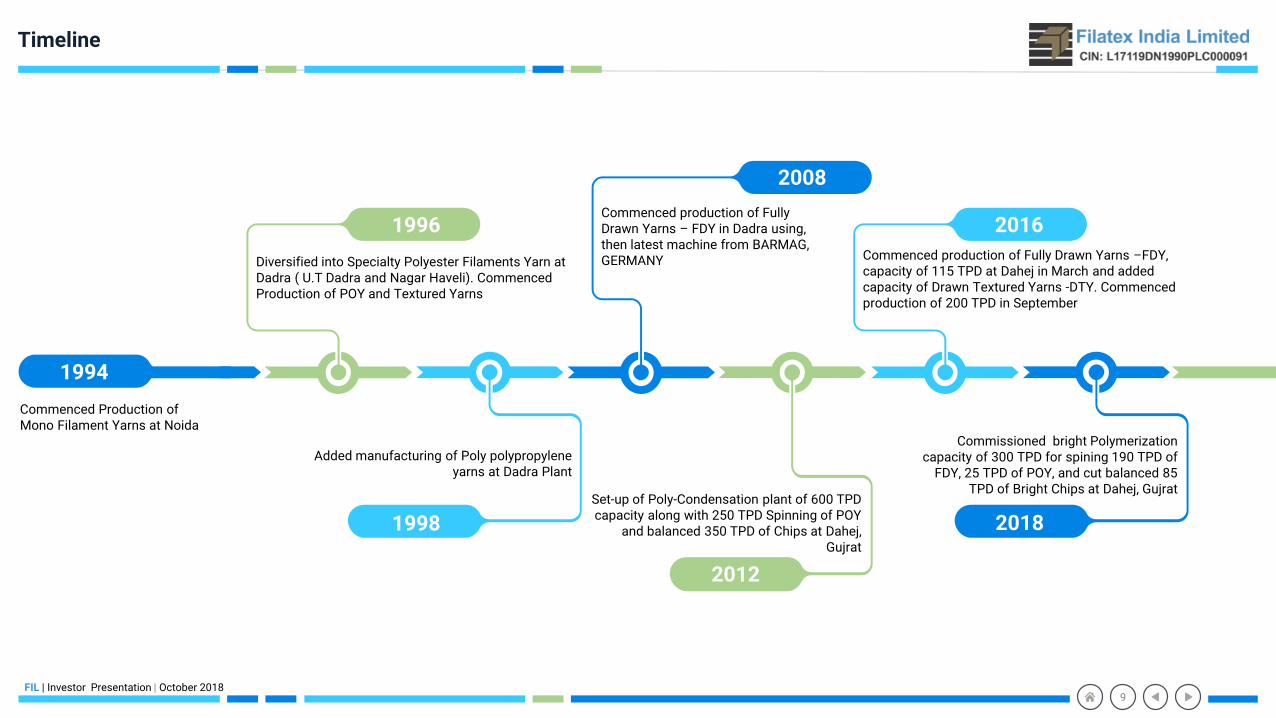
Timeline
19941996
1998
2008
2012
2016
2018
Commissioned bright Polymerization capacity of 300 TPD for spining 190 TPD of
FDY, 25 TPD of POY, and cut balanced 85 TPD of Bright Chips at Dahej, Gujrat
Commenced production of Fully Drawn Yarns –FDY, capacity of 115 TPD at Dahej in March and added capacity of Drawn Textured Yarns -DTY. Commenced production of 200 TPD in September
Commenced production of Fully Drawn Yarns – FDY in Dadra using, then latest machine from BARMAG, GERMANYDiversified into Specialty Polyester Filaments Yarn at
Dadra ( U.T Dadra and Nagar Haveli). Commenced Production of POY and Textured Yarns
Set-up of Poly-Condensation plant of 600 TPD capacity along with 250 TPD Spinning of POY
and balanced 350 TPD of Chips at Dahej, Gujrat
Added manufacturing of Poly polypropylene yarns at Dadra Plant
Commenced Production of Mono Filament Yarns at Noida
9
1994

FIL | Investor Presentation | October 201810
Production Process Flowchart
MEG PTA
RAW MATERIALS TO FINISHED PRODUCTS AT DAHEJ PLANT
PTA PASTE TANK
ESTERIFICATIONREACTOR-1
900 TPD
Catalyst
ESTERIFICATIONREACTOR-2
PRE POLYREACTOR
FINISHER
BRIGHT STREAM
BaSo4
300 TPD
85 TPD 190 TPD
ESTERIFICATIONREACTOR-2
PRE POLYREACTOR
FINISHER
CHIPS
DTY
TiO2
600 TPD
SEMI DULL STREAM
180 TPD
POY
280 TPD
200 TPD
POY PARTIALLY ORIENTED YARNDTY DRAW TEXTURIZING YARNSFDY FULLY DRAWN YARN
25 TPD
FDY
140 TPD
CHIPS FDYPOY
FIL | Investor Presentation | October 2018
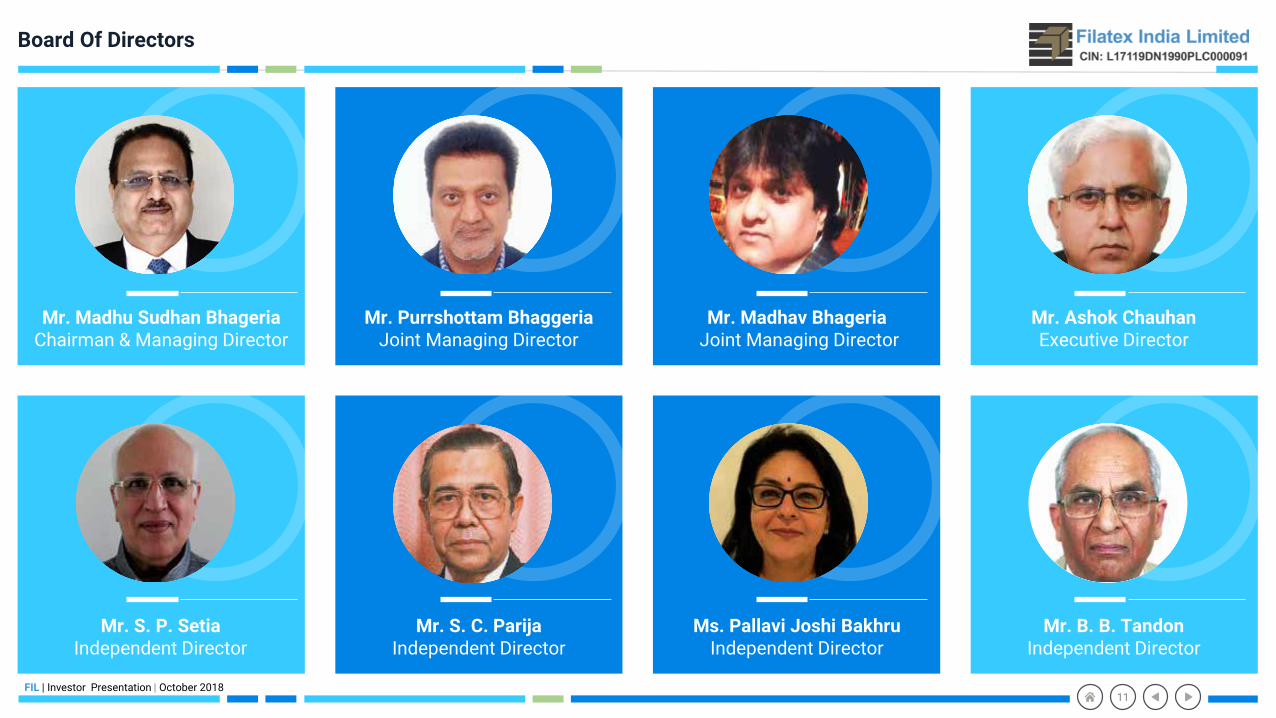
Board Of Directors
Mr. Madhu Sudhan BhageriaChairman & Managing Director
Mr. Purrshottam BhaggeriaJoint Managing Director
Mr. Madhav BhageriaJoint Managing Director
Mr. Ashok Chauhan Executive Director
Mr. S. P. SetiaIndependent Director
Mr. S. C. ParijaIndependent Director
Ms. Pallavi Joshi BakhruIndependent Director
Mr. B. B. TandonIndependent Director
11
FIL | Investor Presentation | October 2018
Geographical Presence
Canada
USA
Colombia
Peru
Brazil
ArgentinaNew Delhi
Dahej
Surat Dadra
Mumbai
Exporting to
34 countries
across the Globe
Over 50% of
DTYproduction is
exported
Exports contributed
~20% ofoverall
Revenues in FY18
Capacity increased over
the years
From 500MTPA
To 328,300MTPA
Dadar & Nagar Havelli (UT)
Dahej (Gujarat)
Manufacturing Facilities : 2
New Delhi
Surat
Mumbai
Marketing Office : 3
New Delhi
Corporate Office
12
Mexico
Chile
Domican Republic
Ecuador
Portugal
Morocco
AlgeriaEgypt
Turkey
Iran
Poland
Latvia
Kenya
Nepal
Bangladesh
Thailand
South Korea
Dubai
Germany
Italy
Indonesia
S. Africa
Spain
UK
Uzbekistan
Vietnam
Slovenia
FIL | Investor Presentation | October 2018
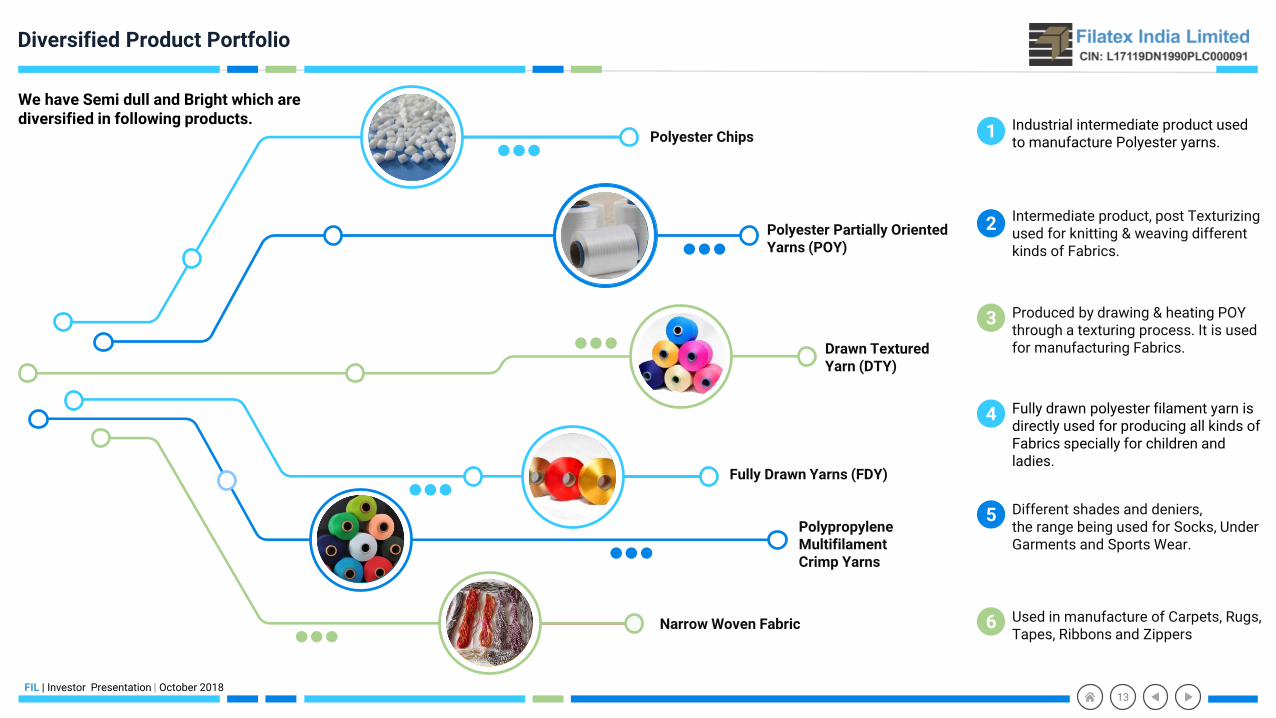
Diversified Product Portfolio
Drawn Textured Yarn (DTY)
Polyester Partially Oriented Yarns (POY)
Polypropylene Multifilament Crimp Yarns
Fully Drawn Yarns (FDY)
Narrow Woven Fabric
Polyester Chips
13
We have Semi dull and Bright which are diversified in following products.
Intermediate product, post Texturizing used for knitting & weaving different kinds of Fabrics.
2
5 Different shades and deniers,the range being used for Socks, UnderGarments and Sports Wear.
6 Used in manufacture of Carpets, Rugs, Tapes, Ribbons and Zippers
4 Fully drawn polyester filament yarn is directly used for producing all kinds of Fabrics specially for children and ladies.
Industrial intermediate product used to manufacture Polyester yarns.
1
Produced by drawing & heating POY through a texturing process. It is used for manufacturing Fabrics.
3
FIL | Investor Presentation | October 2018
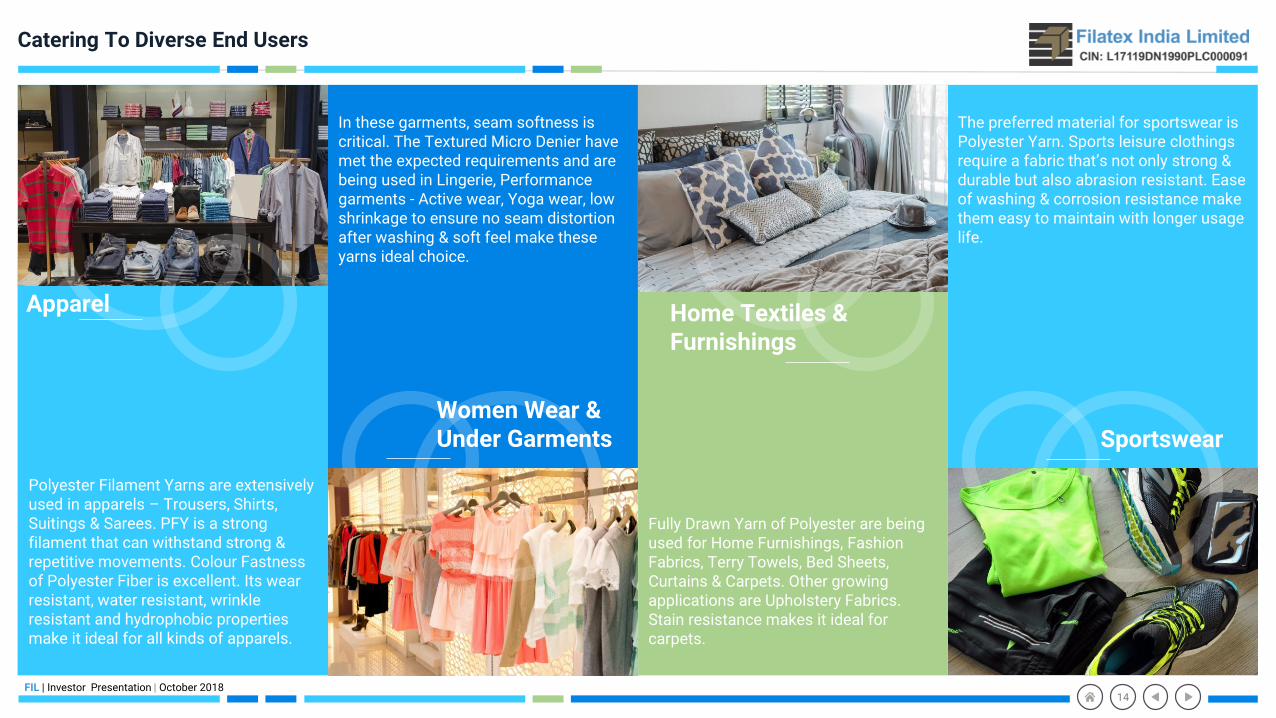
Catering To Diverse End Users
Polyester Filament Yarns are extensively used in apparels – Trousers, Shirts, Suitings & Sarees. PFY is a strong filament that can withstand strong & repetitive movements. Colour Fastness of Polyester Fiber is excellent. Its wear resistant, water resistant, wrinkle resistant and hydrophobic properties make it ideal for all kinds of apparels.
Fully Drawn Yarn of Polyester are being used for Home Furnishings, Fashion Fabrics, Terry Towels, Bed Sheets, Curtains & Carpets. Other growing applications are Upholstery Fabrics. Stain resistance makes it ideal for carpets.
Home Textiles & Furnishings
Sportswear
Apparel
Women Wear & Under Garments
The preferred material for sportswear is Polyester Yarn. Sports leisure clothingsrequire a fabric that’s not only strong & durable but also abrasion resistant. Ease of washing & corrosion resistance make them easy to maintain with longer usage life.
In these garments, seam softness is critical. The Textured Micro Denier have met the expected requirements and are being used in Lingerie, Performance garments - Active wear, Yoga wear, lowshrinkage to ensure no seam distortion after washing & soft feel make these yarns ideal choice.
14
FIL | Investor Presentation | October 2018
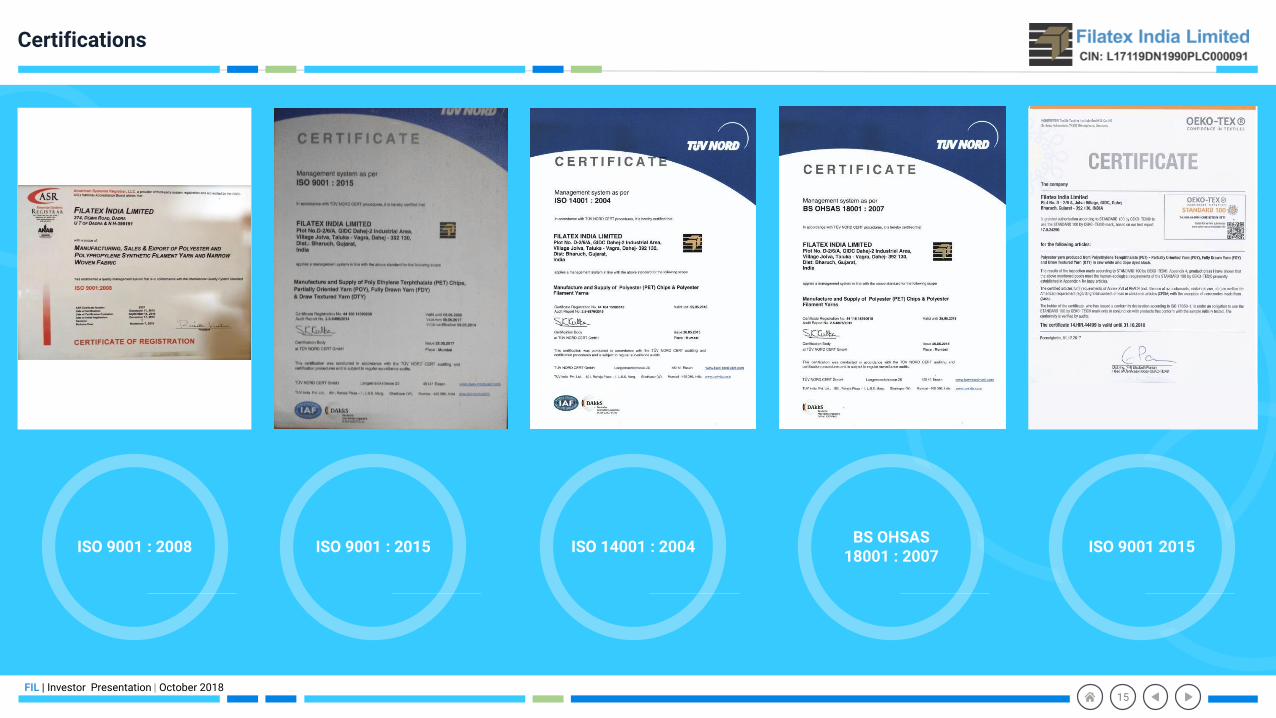
Certifications
ISO 9001 : 2008 ISO 9001 : 2015 ISO 14001 : 2004BS OHSAS
18001 : 2007
15
ISO 9001 2015
FIL | Investor Presentation | October 2018
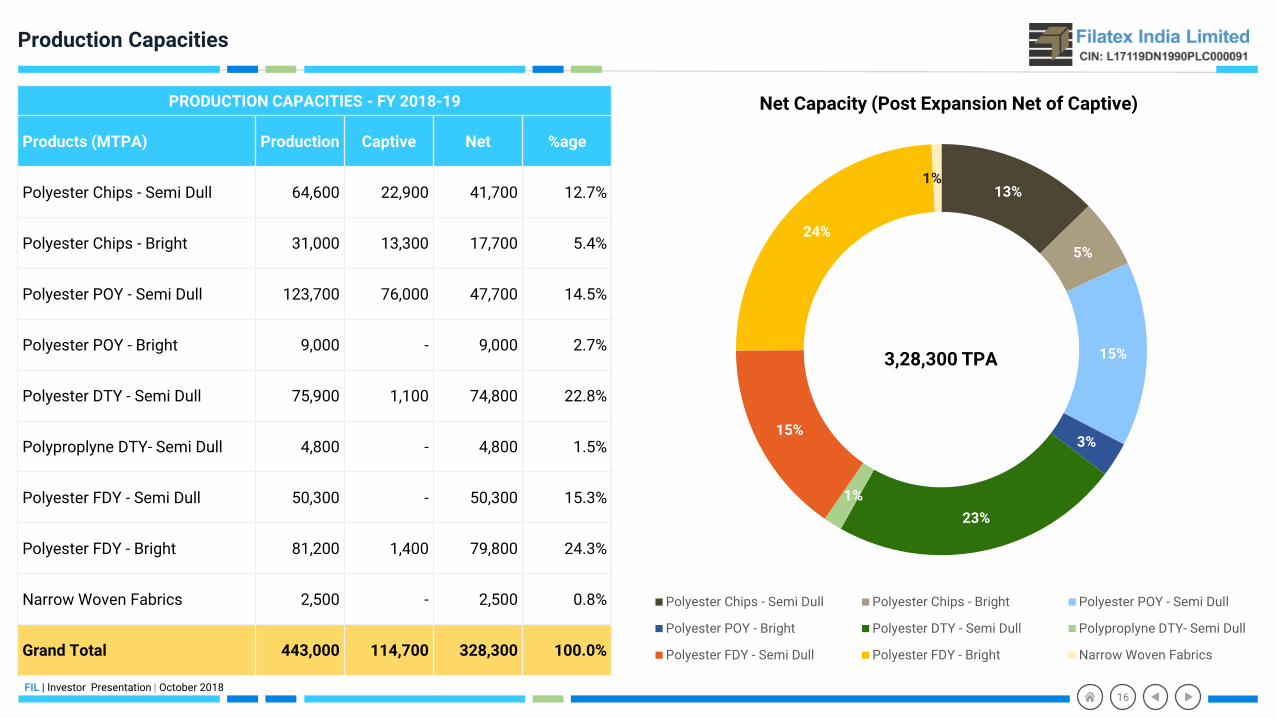
Production Capacities
Net Capacity (Post Expansion Net of Captive)PRODUCTION CAPACITIES - FY 2018-19
Products (MTPA) Production Captive Net %age
Polyester Chips - Semi Dull 64,600 22,900 41,700 12.7%
Polyester Chips - Bright 31,000 13,300 17,700 5.4%
Polyester POY - Semi Dull 123,700 76,000 47,700 14.5%
Polyester POY - Bright 9,000 - 9,000 2.7%
Polyester DTY - Semi Dull 75,900 1,100 74,800 22.8%
Polyproplyne DTY- Semi Dull 4,800 - 4,800 1.5%
Polyester FDY - Semi Dull 50,300 - 50,300 15.3%
Polyester FDY - Bright 81,200 1,400 79,800 24.3%
Narrow Woven Fabrics 2,500 - 2,500 0.8%
Grand Total 443,000 114,700 328,300 100.0%
13%
5%
15%
3%
23%
1%
15%
24%
1%
Polyester Chips - Semi Dull Polyester Chips - Bright Polyester POY - Semi Dull
Polyester POY - Bright Polyester DTY - Semi Dull Polyproplyne DTY- Semi Dull
Polyester FDY - Semi Dull Polyester FDY - Bright Narrow Woven Fabrics
16
3,28,300 TPA

Key Strengths and Growth Drivers
FIL | Investor Presentation | October 2018
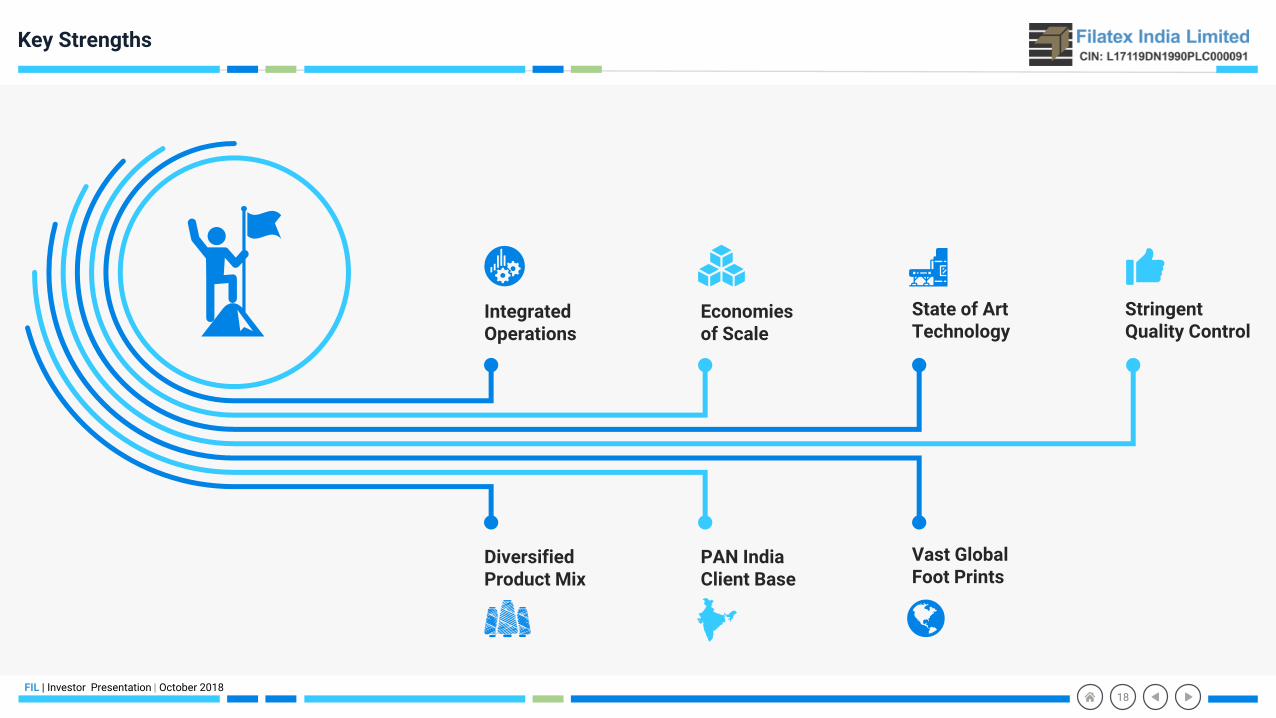
Key Strengths
18
IntegratedOperations
State of Art Technology
Economiesof Scale
Stringent Quality Control
Diversified Product Mix
Vast Global Foot Prints
PAN India Client Base

FIL | Investor Presentation | October 2018
Growth drivers (1/2)
o India’s per capita income at current prices during 2017-18 is estimated to have attained a level of Rs. 1,12,835 as compared to the estimates for the year 2016-17 of Rs. 1,03,870 showing a rise of 8.6 percent.
o Increased disposable income simulated the demand for value-added products. The demand for premium apparel is likely to increase adding to the ‘feel good’ factor, catalyzing polyester demand.
o If India’s GDP growth rate is 7%, the textile sector will grow at 10.5%. The employment and GDP growth would result in increasing per capita income. When per capita income crosses the threshold value of around 2.5-3 lacs, the growth in domestic demand would be explosive.
o According to projections, an estimated 140 million Indians could move to cities by 2020 and 700 million by 2050.
o Besides, the number of cities with population above one million could nearly double with increase in the number of mega-cities (above five million) to 10 by 2021 and 36 by 2051.
o Urbanization is expected to result in a growing demand for daily wear, casual wear, sportswear & other lifestyle products which are durable in nature meeting aesthetic requirements as well.
o The new indirect tax regime is expected to enhance compliance, uniform tax rates and structure with the removal of cascading taxes resulting in lower transaction costs.
o The polyester yarn industry is likely to benefit. Major yarn producers are likely to cater the fabric and garment sector after rationalization of GST.
o Now, Fabric and Garment sector is likely to see a good investment from organized sector.
Increasing Per Capita Income Rapid Urbanization Government Policies
19
FIL | Investor Presentation | October 2018
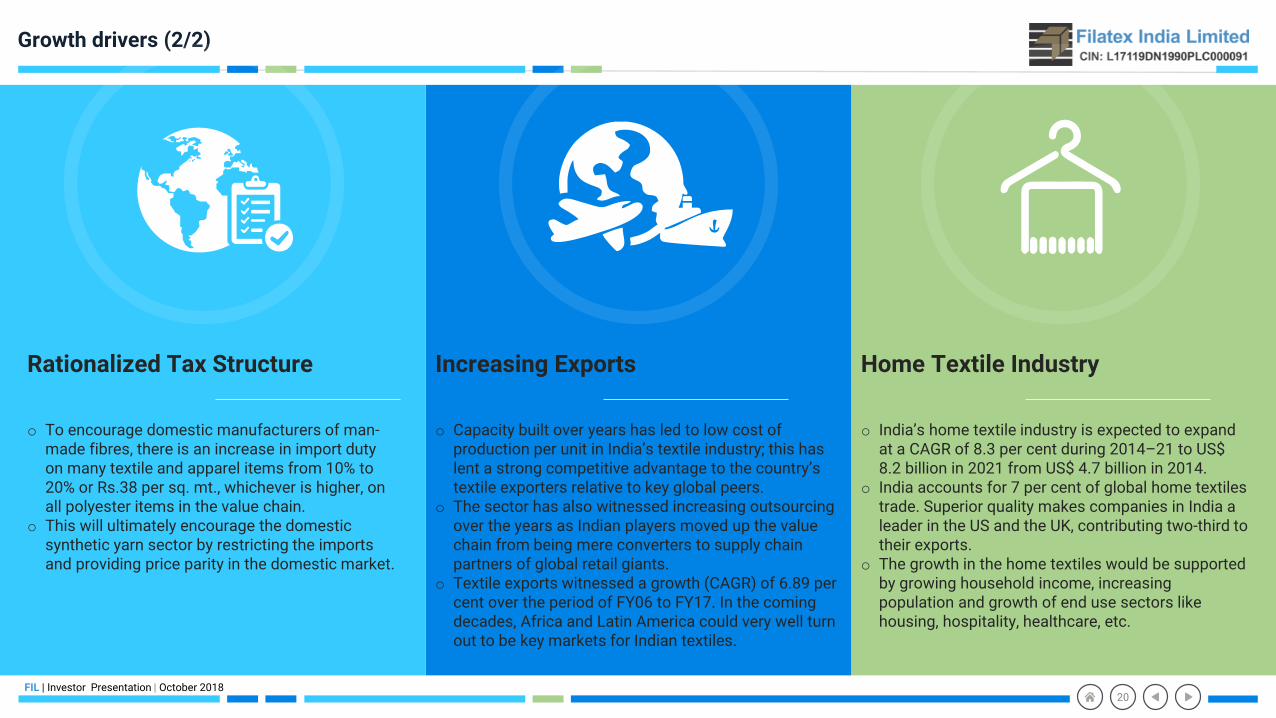
Growth drivers (2/2)
o To encourage domestic manufacturers of man-made fibres, there is an increase in import duty on many textile and apparel items from 10% to 20% or Rs.38 per sq. mt., whichever is higher, on all polyester items in the value chain.
o This will ultimately encourage the domestic synthetic yarn sector by restricting the imports and providing price parity in the domestic market.
o Capacity built over years has led to low cost of production per unit in India’s textile industry; this has lent a strong competitive advantage to the country’s textile exporters relative to key global peers.
o The sector has also witnessed increasing outsourcing over the years as Indian players moved up the value chain from being mere converters to supply chain partners of global retail giants.
o Textile exports witnessed a growth (CAGR) of 6.89 per cent over the period of FY06 to FY17. In the coming decades, Africa and Latin America could very well turn out to be key markets for Indian textiles.
o India’s home textile industry is expected to expand at a CAGR of 8.3 per cent during 2014–21 to US$ 8.2 billion in 2021 from US$ 4.7 billion in 2014.
o India accounts for 7 per cent of global home textiles trade. Superior quality makes companies in India a leader in the US and the UK, contributing two-third to their exports.
o The growth in the home textiles would be supported by growing household income, increasing population and growth of end use sectors like housing, hospitality, healthcare, etc.
Rationalized Tax Structure Increasing Exports Home Textile Industry
20

Results Summary
FIL | Investor Presentation | October 2018
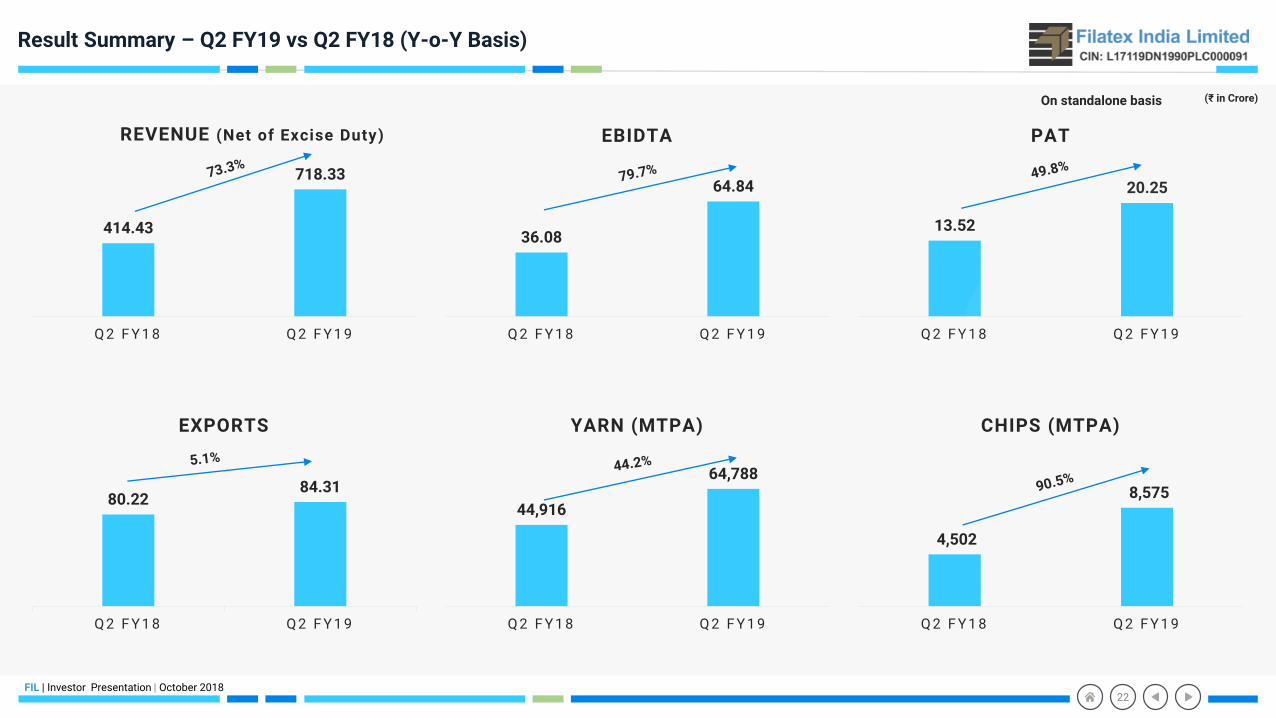
Result Summary – Q2 FY19 vs Q2 FY18 (Y-o-Y Basis)
414.43
718.33
Q 2 F Y 1 8 Q 2 F Y 1 9
REVENUE (Net of Excise Duty)
36.08
64.84
Q 2 F Y 1 8 Q 2 F Y 1 9
EBIDTA
13.52
20.25
Q 2 F Y 1 8 Q 2 F Y 1 9
PAT
22
80.2284.31
Q 2 F Y 1 8 Q 2 F Y 1 9
EXPORTS
44,916
64,788
Q 2 F Y 1 8 Q 2 F Y 1 9
YARN (MTPA)
4,502
8,575
Q 2 F Y 1 8 Q 2 F Y 1 9
CHIPS (MTPA)
(₹ in Crore)On standalone basis
FIL | Investor Presentation | October 2018
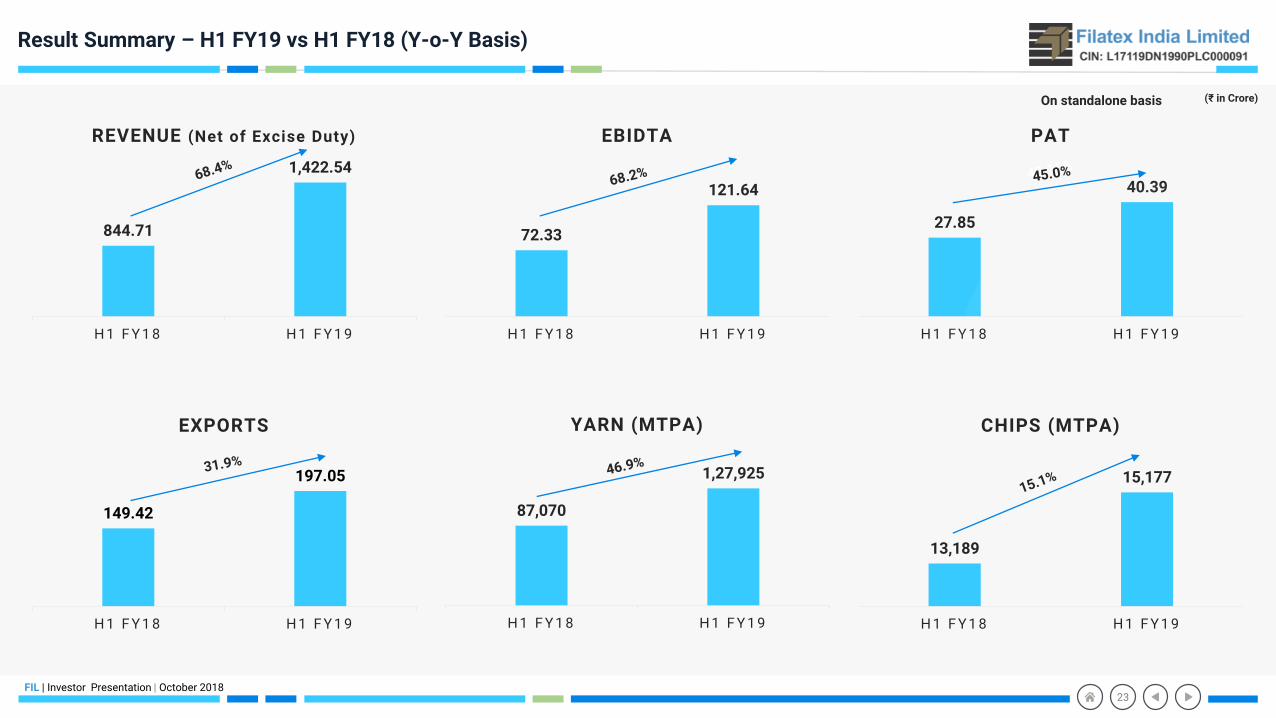
Result Summary – H1 FY19 vs H1 FY18 (Y-o-Y Basis)
844.71
1,422.54
H 1 F Y 1 8 H 1 F Y 1 9
REVENUE (Net of Excise Duty)
72.33
121.64
H 1 F Y 1 8 H 1 F Y 1 9
EBIDTA
27.85
40.39
H 1 F Y 1 8 H 1 F Y 1 9
PAT
23
149.42
197.05
H 1 F Y 1 8 H 1 F Y 1 9
EXPORTS
13,189
15,177
H 1 F Y 1 8 H 1 F Y 1 9
CHIPS (MTPA)
(₹ in Crore)On standalone basis
87,070
1,27,925
H 1 F Y 1 8 H 1 F Y 1 9
YARN (MTPA)
FIL | Investor Presentation | October 2018
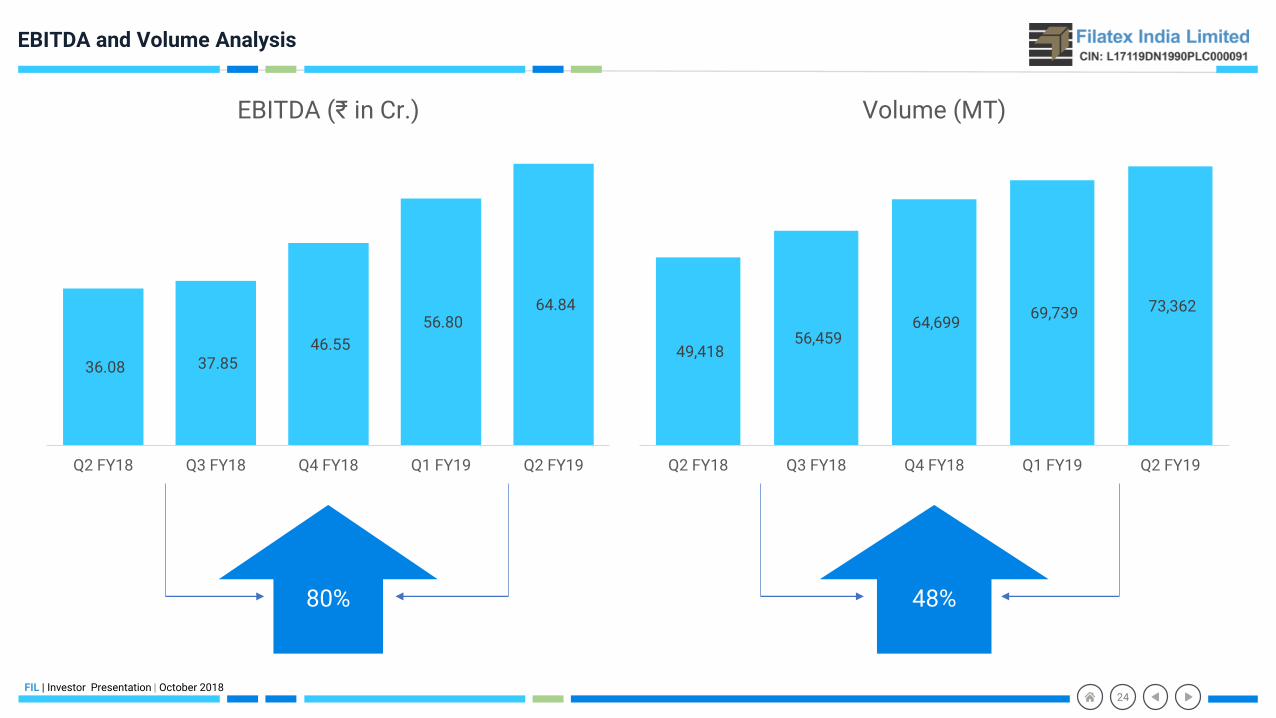
EBITDA and Volume Analysis
36.08 37.85 46.55
56.80 64.84
Q2 FY18 Q3 FY18 Q4 FY18 Q1 FY19 Q2 FY19
EBITDA (₹ in Cr.)
80%
49,418 56,459
64,699 69,739 73,362
Q2 FY18 Q3 FY18 Q4 FY18 Q1 FY19 Q2 FY19
Volume (MT)
48%
24
FIL | Investor Presentation | October 2018
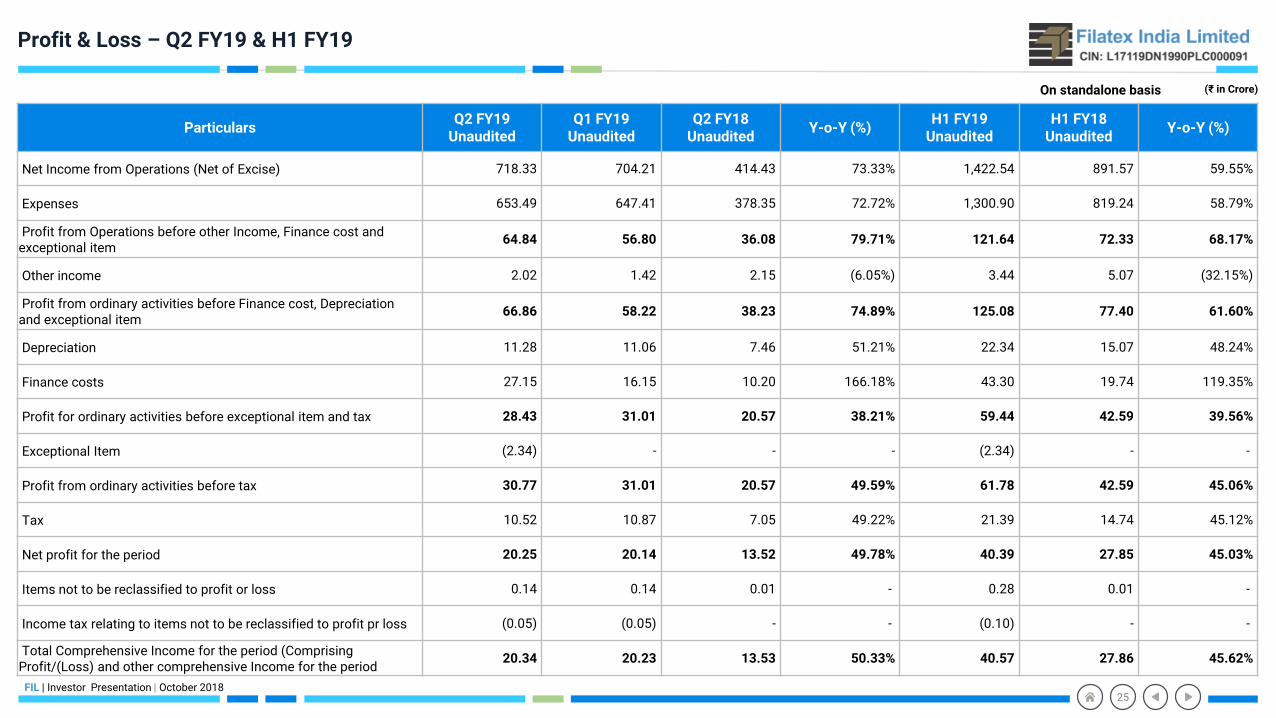
Profit & Loss – Q2 FY19 & H1 FY19
ParticularsQ2 FY19
UnauditedQ1 FY19
UnauditedQ2 FY18
UnauditedY-o-Y (%)
H1 FY19Unaudited
H1 FY18Unaudited
Y-o-Y (%)
Net Income from Operations (Net of Excise) 718.33 704.21 414.43 73.33% 1,422.54 891.57 59.55%
Expenses 653.49 647.41 378.35 72.72% 1,300.90 819.24 58.79%
Profit from Operations before other Income, Finance cost and exceptional item
64.84 56.80 36.08 79.71% 121.64 72.33 68.17%
Other income 2.02 1.42 2.15 (6.05%) 3.44 5.07 (32.15%)
Profit from ordinary activities before Finance cost, Depreciation and exceptional item
66.86 58.22 38.23 74.89% 125.08 77.40 61.60%
Depreciation 11.28 11.06 7.46 51.21% 22.34 15.07 48.24%
Finance costs 27.15 16.15 10.20 166.18% 43.30 19.74 119.35%
Profit for ordinary activities before exceptional item and tax 28.43 31.01 20.57 38.21% 59.44 42.59 39.56%
Exceptional Item (2.34) - - - (2.34) - -
Profit from ordinary activities before tax 30.77 31.01 20.57 49.59% 61.78 42.59 45.06%
Tax 10.52 10.87 7.05 49.22% 21.39 14.74 45.12%
Net profit for the period 20.25 20.14 13.52 49.78% 40.39 27.85 45.03%
Items not to be reclassified to profit or loss 0.14 0.14 0.01 - 0.28 0.01 -
Income tax relating to items not to be reclassified to profit pr loss (0.05) (0.05) - - (0.10) - -
Total Comprehensive Income for the period (Comprising Profit/(Loss) and other comprehensive Income for the period
20.34 20.23 13.53 50.33% 40.57 27.86 45.62%
(₹ in Crore)On standalone basis
25
FIL | Investor Presentation | October 2018
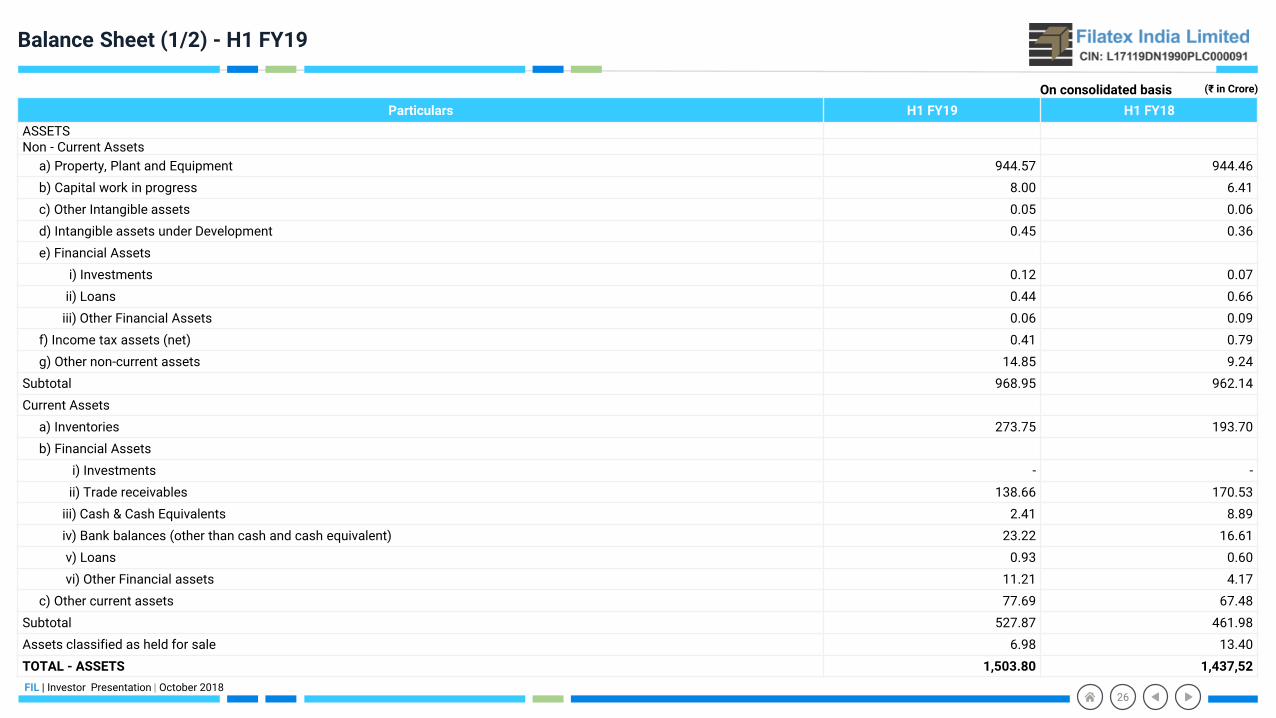
Balance Sheet (1/2) - H1 FY19
Particulars H1 FY19 H1 FY18
ASSETSNon - Current Assets
a) Property, Plant and Equipment 944.57 944.46
b) Capital work in progress 8.00 6.41
c) Other Intangible assets 0.05 0.06
d) Intangible assets under Development 0.45 0.36
e) Financial Assets
i) Investments 0.12 0.07
ii) Loans 0.44 0.66
iii) Other Financial Assets 0.06 0.09
f) Income tax assets (net) 0.41 0.79
g) Other non-current assets 14.85 9.24
Subtotal 968.95 962.14
Current Assets
a) Inventories 273.75 193.70
b) Financial Assets
i) Investments - -
ii) Trade receivables 138.66 170.53
iii) Cash & Cash Equivalents 2.41 8.89
iv) Bank balances (other than cash and cash equivalent) 23.22 16.61
v) Loans 0.93 0.60
vi) Other Financial assets 11.21 4.17
c) Other current assets 77.69 67.48
Subtotal 527.87 461.98
Assets classified as held for sale 6.98 13.40
TOTAL - ASSETS 1,503.80 1,437,52
(₹ in Crore)
26
On consolidated basis
FIL | Investor Presentation | October 2018
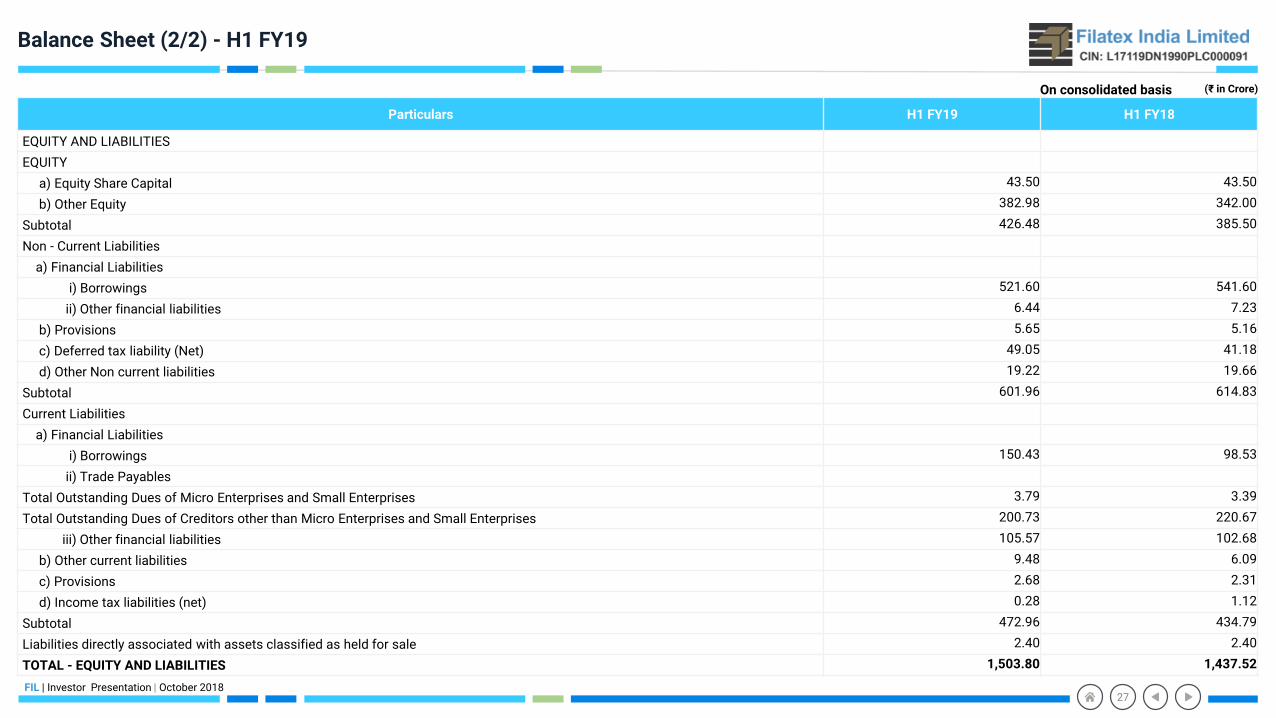
Balance Sheet (2/2) - H1 FY19
Particulars H1 FY19 H1 FY18
EQUITY AND LIABILITIES
EQUITY
a) Equity Share Capital 43.50 43.50
b) Other Equity 382.98 342.00
Subtotal 426.48 385.50
Non - Current Liabilities
a) Financial Liabilities
i) Borrowings 521.60 541.60
ii) Other financial liabilities 6.44 7.23
b) Provisions 5.65 5.16
c) Deferred tax liability (Net) 49.05 41.18
d) Other Non current liabilities 19.22 19.66
Subtotal 601.96 614.83
Current Liabilities
a) Financial Liabilities
i) Borrowings 150.43 98.53
ii) Trade Payables
Total Outstanding Dues of Micro Enterprises and Small Enterprises 3.79 3.39
Total Outstanding Dues of Creditors other than Micro Enterprises and Small Enterprises 200.73 220.67
iii) Other financial liabilities 105.57 102.68
b) Other current liabilities 9.48 6.09
c) Provisions 2.68 2.31
d) Income tax liabilities (net) 0.28 1.12
Subtotal 472.96 434.79
Liabilities directly associated with assets classified as held for sale 2.40 2.40
TOTAL - EQUITY AND LIABILITIES 1,503.80 1,437.52
(₹ in Crore)
27
On consolidated basis
FIL | Investor Presentation | October 2018
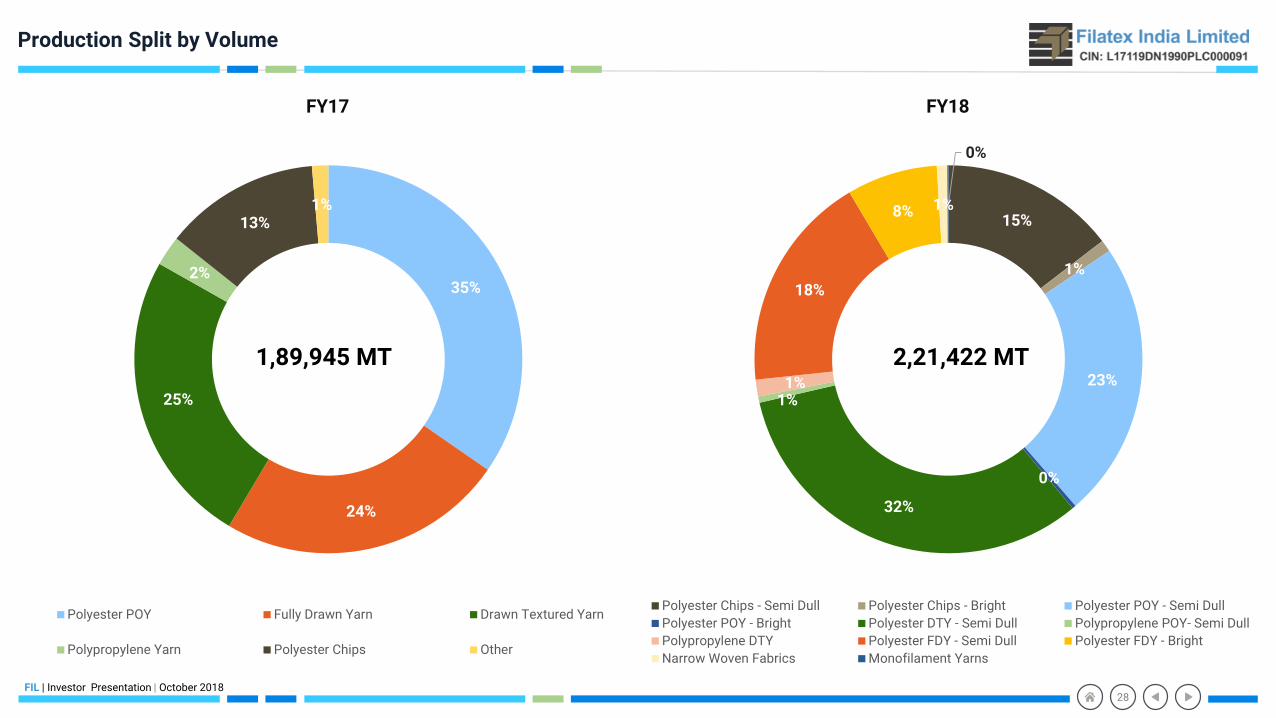
Production Split by Volume
35%
24%
25%
2%
13%1%
FY17
Polyester POY Fully Drawn Yarn Drawn Textured Yarn
Polypropylene Yarn Polyester Chips Other
1,89,945 MT
15%
1%
23%
0%
32%
1%1%
18%
8% 1%
0%
FY18
Polyester Chips - Semi Dull Polyester Chips - Bright Polyester POY - Semi Dull
Polyester POY - Bright Polyester DTY - Semi Dull Polypropylene POY- Semi Dull
Polypropylene DTY Polyester FDY - Semi Dull Polyester FDY - Bright
Narrow Woven Fabrics Monofilament Yarns
2,21,422 MT
28
Financial Overview
FIL | Investor Presentation | October 2018
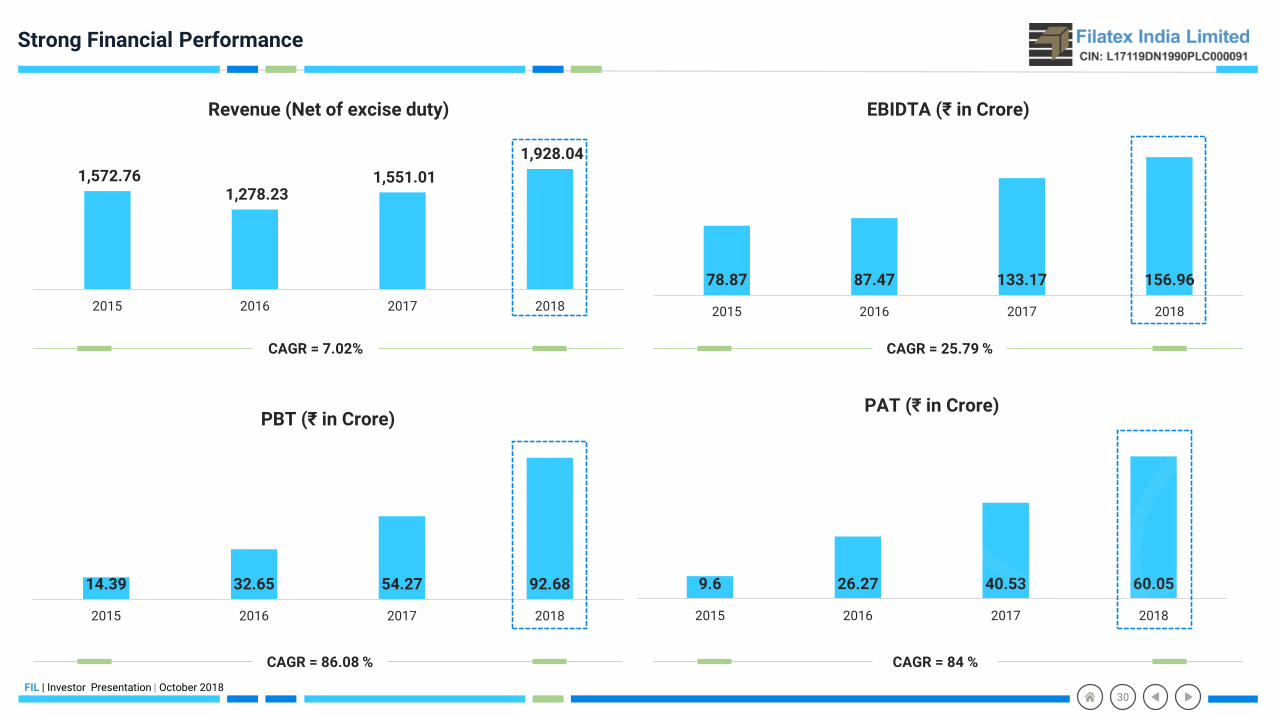
9.6 26.27 40.53 60.050
10
20
30
40
50
60
70
2015 2016 2017 2018
PAT (₹ in Crore)
Strong Financial Performance
78.87 87.47 133.17 156.960
20
40
60
80
100
120
140
160
180
2015 2016 2017 2018
EBIDTA (₹ in Crore)
1,572.76 1,278.23
1,551.01
1,928.04
2015 2016 2017 2018
Revenue (Net of excise duty)
14.39 32.65 54.27 92.680
10
20
30
40
50
60
70
80
90
100
2015 2016 2017 2018
PBT (₹ in Crore)
CAGR = 7.02% CAGR = 25.79 %
CAGR = 86.08 % CAGR = 84 %
(₹ in Crore)
30
FIL | Investor Presentation | October 2018
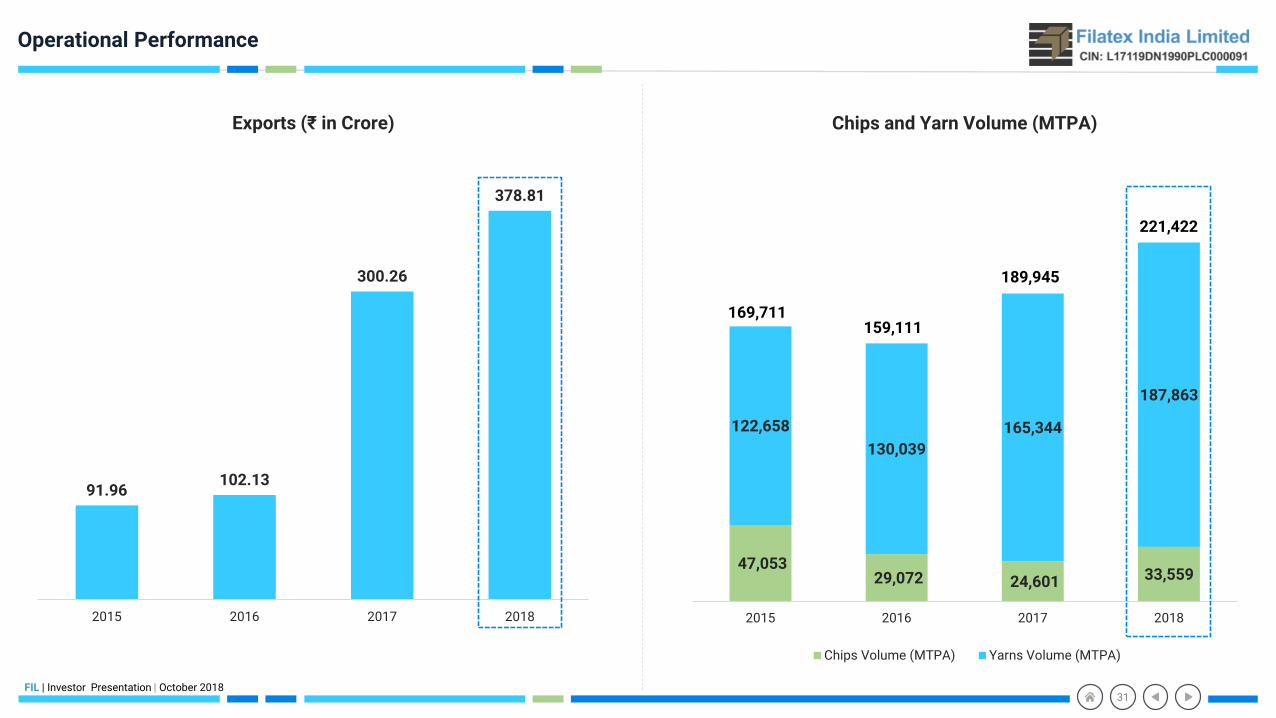
Operational Performance
91.96102.13
300.26
378.81
2015 2016 2017 2018
Exports (₹ in Crore)
31
47,053 29,072 24,601 33,559
122,658
130,039
165,344
187,863
2015 2016 2017 2018
Chips and Yarn Volume (MTPA)
Chips Volume (MTPA) Yarns Volume (MTPA)
221,422
169,711
189,945
159,111

FIL | Investor Presentation | October 2018
Profit & Loss
Particulars 2015 2016 2017 2018
Revenue from operations (gross) 1,730.59 1,418.80 1,709.68 1,974.90
Less : Excise duty 157.83 140.57 158.67 46.86
Revenue from operations (net) 1,572.76 1,278.23 1,551.01 1,928.04
Other Income 9.70 10.67 12.15 10.64
Total Revenue 1,582.46 1,288.90 1,563.16 1,938.68
Expenses
Cost of material consumed 1,093.56 966.71 1,232.67 1,529.85
Purchases of traded goods 263.87 83.82 38.04 34.80
(Increase)/decrease in Inventories of finished goods work in progress & stock in trade -7.43 1.22 -45.41 -13.51
Employee benefits expense 35.39 40.01 46.97 48.75
Finance cost 53.60 51.19 58.64 44.10
Depreciation & amortization expense 20.57 21.27 28.97 30.82
Other Expenses 108.50 99.06 145.57 171.19
Total Expenses 1,568.06 1,263.27 1,505.45 1,846.00
Profit/(loss) before exceptional items & tax - 14.39 25.63 57.71
Exceptional Items [Profit/(Loss)] - 6.97 -3.44 -
Profit/(loss) before tax 14.39 32.60 54.27 92.68
Tax Expense:
Current tax (MAT) 3.01 6.96 11.78 19.68
MAT credit entitlement -3.01 -6.96 - -
Taxation for earlier years 0.02 - - -
Deferred tax 4.78 6.38 1.96 13.26
Total tax expense 4.80 6.38 13.74 32.94
Net profit/(loss) after tax 9.60 26.22 40.53 59.74
Other Comprehensive Income/(Loss)
Items not to be reclassified to profit or loss - - 0.01 0.48
Income tax relating to items not to be reclassified to profit or loss - - -0.01 -0.17
Comprehensive Profit/(Loss) for the Period 9.60 26.22 40.53 60.05
Earnings Per Share (EPS) in Rupees
-Basic 3.12 8.19 10.20 13.73
-Diluted 3.12 8.06 9.29 13.52
(₹ in Crore)
32
On consolidated basis
FIL | Investor Presentation | October 2018
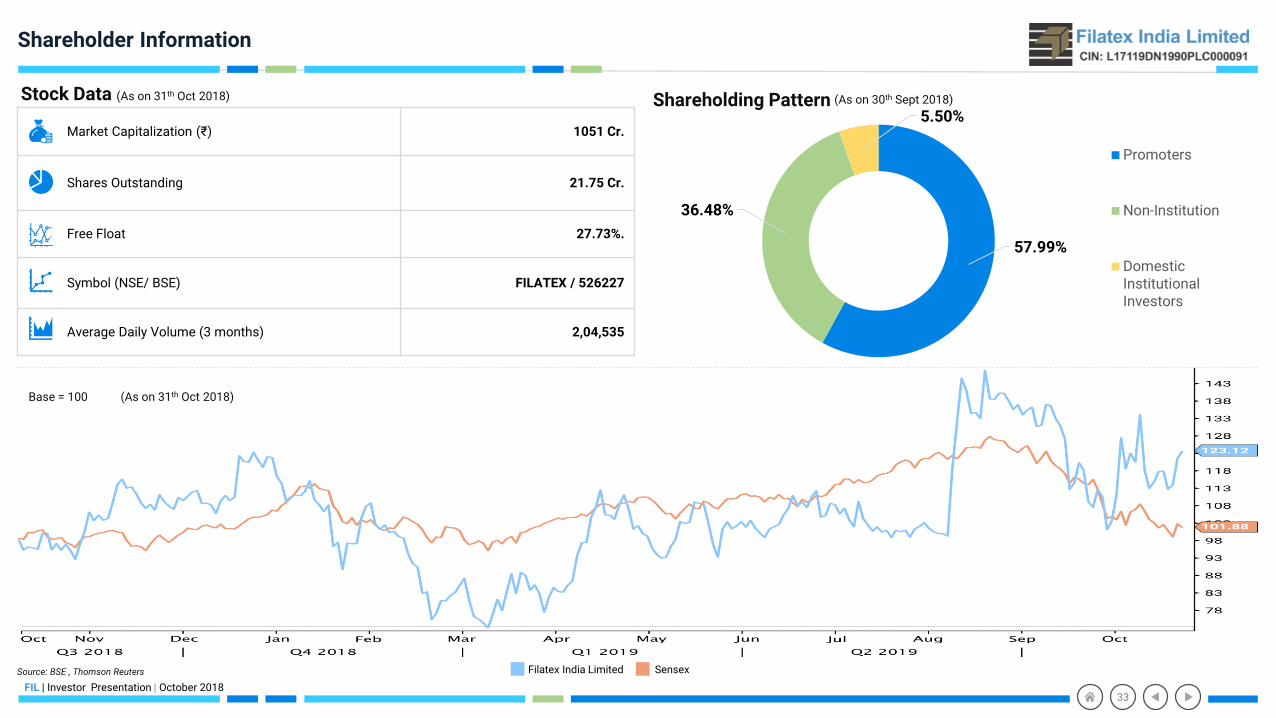
Shareholder Information
Market Capitalization (₹) 1051 Cr.
Shares Outstanding 21.75 Cr.
Free Float 27.73%.
Symbol (NSE/ BSE) FILATEX / 526227
Average Daily Volume (3 months) 2,04,535
Stock Data (As on 31th Oct 2018)
33
57.99%
36.48%
5.50%Shareholding Pattern
Promoters
Non-Institution
DomesticInstitutionalInvestors
(As on 30th Sept 2018)
Source: BSE , Thomson Reuters Filatex India Limited Sensex
Base = 100 (As on 31th Oct 2018)
Filatex India Limited
BHAGERIA HOUSE, 43 Community Centre,New Friends Colony, New Delhi – 110025Ph: +91-11-26312503Fax: +91-11-26849915Email: [email protected]: L17119DN1990PLC000091
Thank You
S-ANCIAL TECHNOLOGIES PVT. LTDRonak [email protected]
215, Shivshakti Industrial Estate, J. R. Boricha Marg,Lower Parel (E), Mumbai – 400011, Tel: +91 902 936 1001
Investor Relations Advisors:


![A novel method for ring spinning performance evaluation ... · yarn faults [3]. Accordingly, ... yarns are produced using the ring spinning system for creating the yarn core, usually](https://img.dokumen.tips/doc/110x75/5afb6e727f8b9ae92b8f13a5/a-novel-method-for-ring-spinning-performance-evaluation-faults-3-accordingly.jpg)