Embed Size (px)
Citation preview
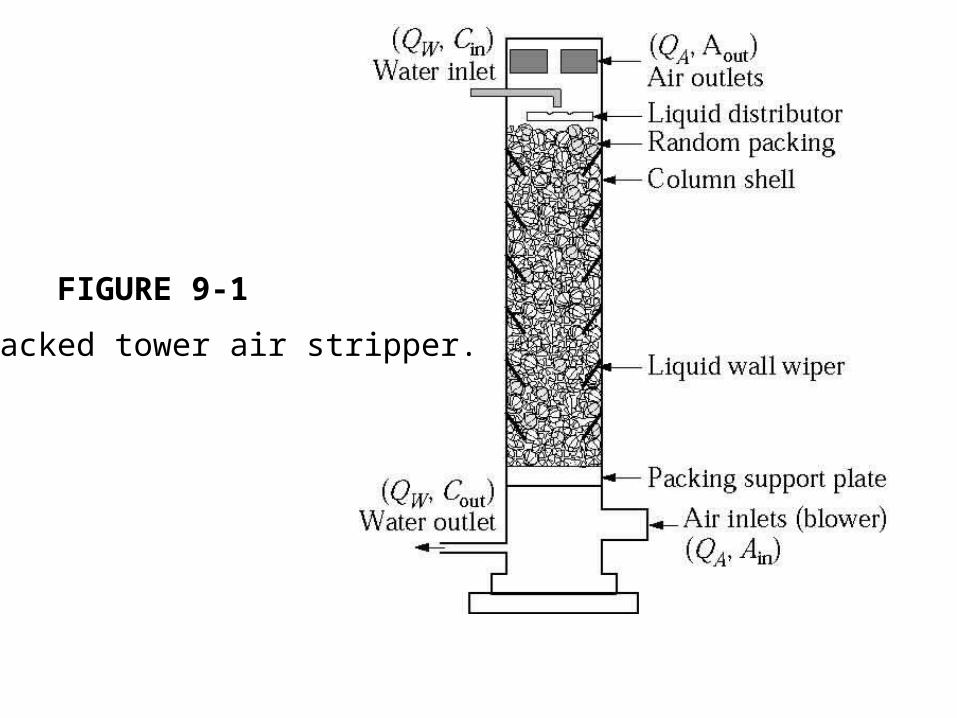
FIGURE 9-1
Packed tower air stripper.
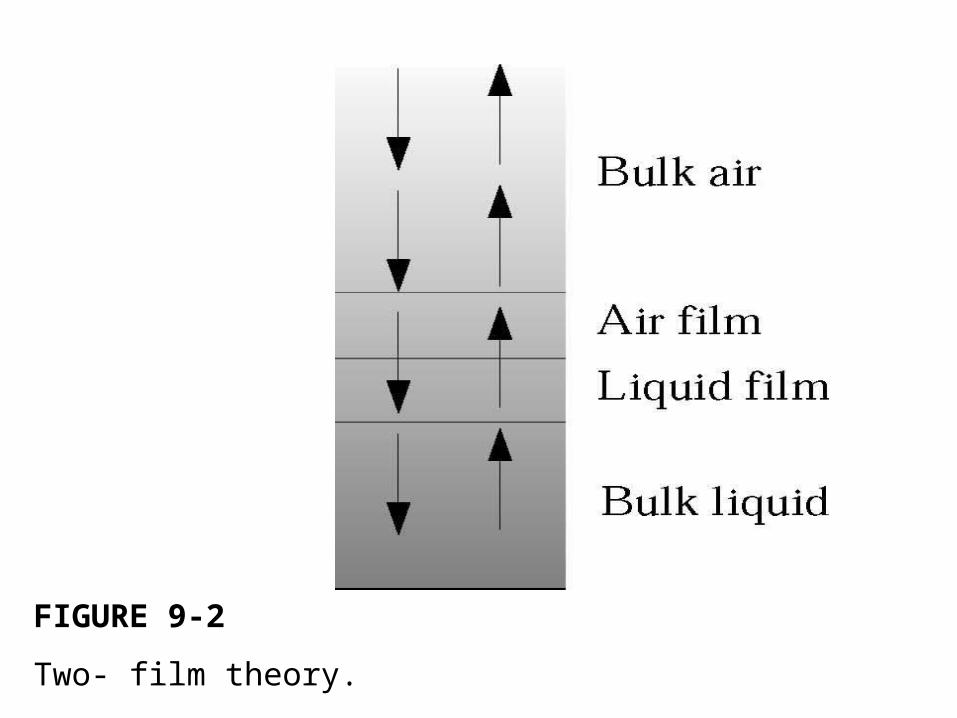
FIGURE 9-2
Two- film theory.
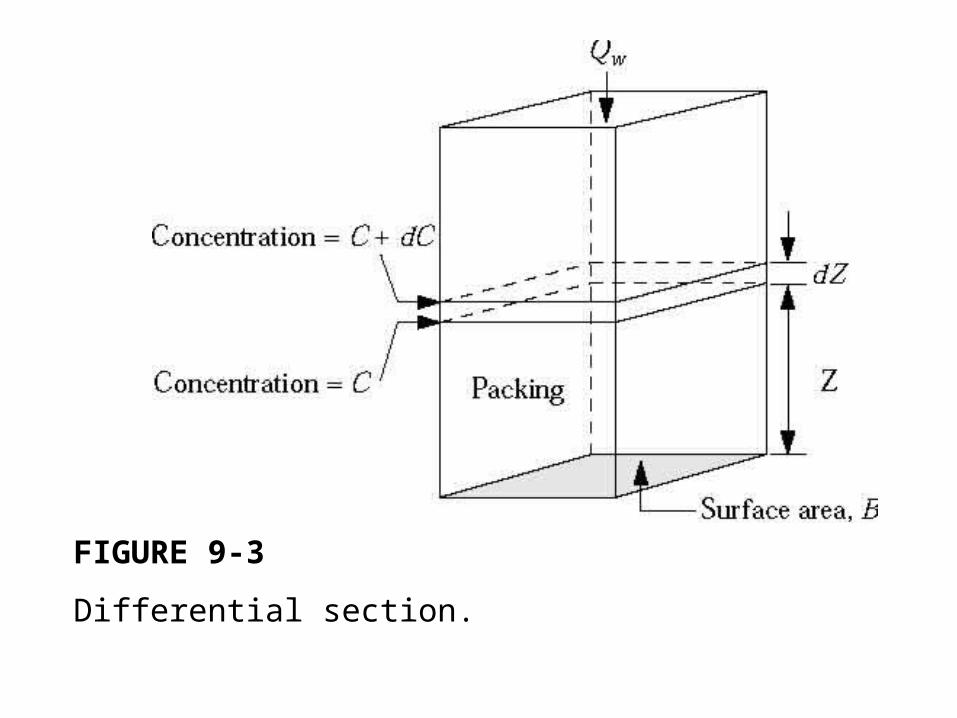
FIGURE 9-3
Differential section.
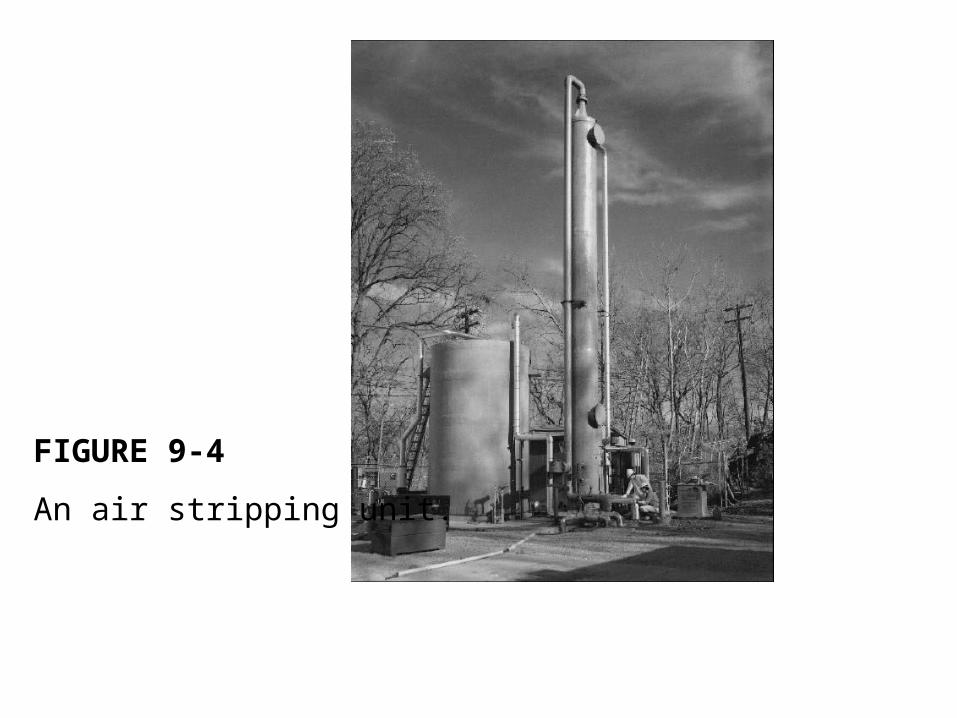
FIGURE 9-4
An air stripping unit.
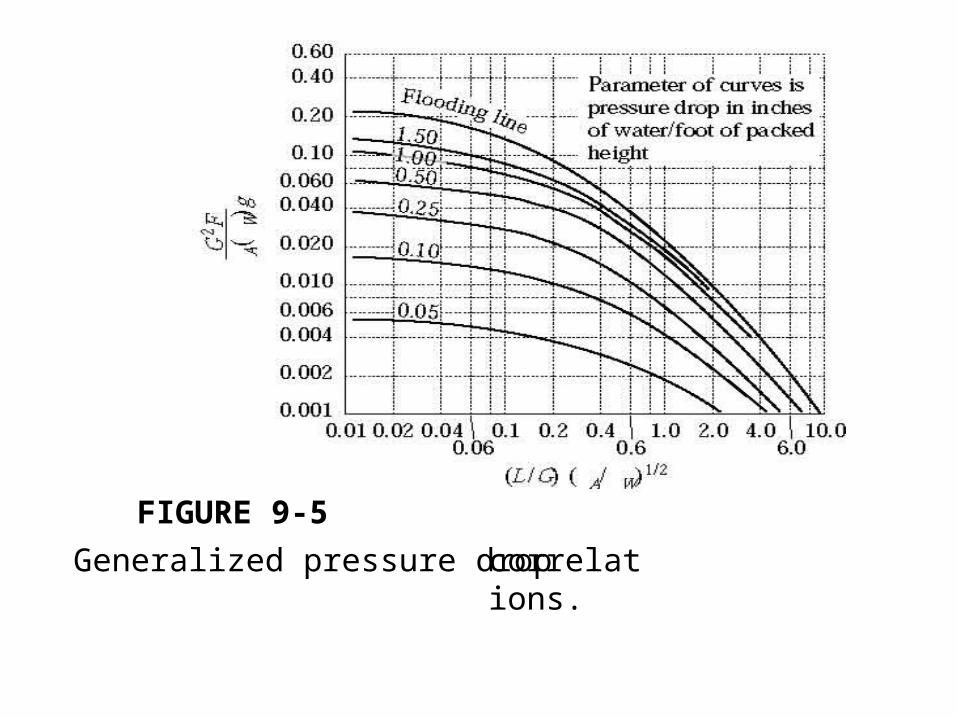
FIGURE 9-5
Generalized pressure dropcorrelations.
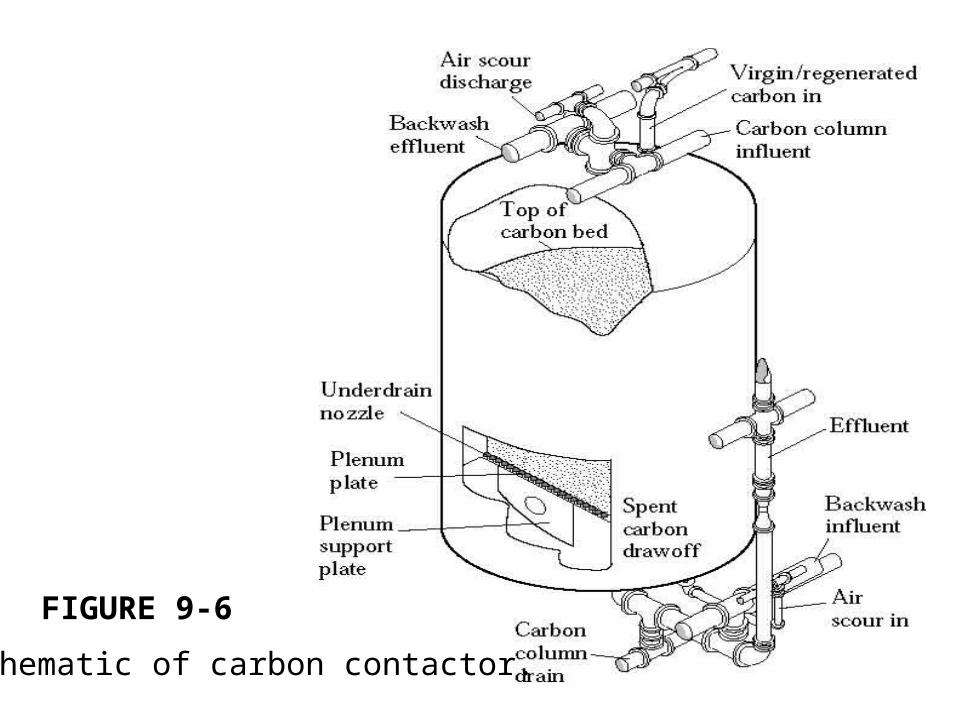
FIGURE 9-6
Schematic of carbon contactor.
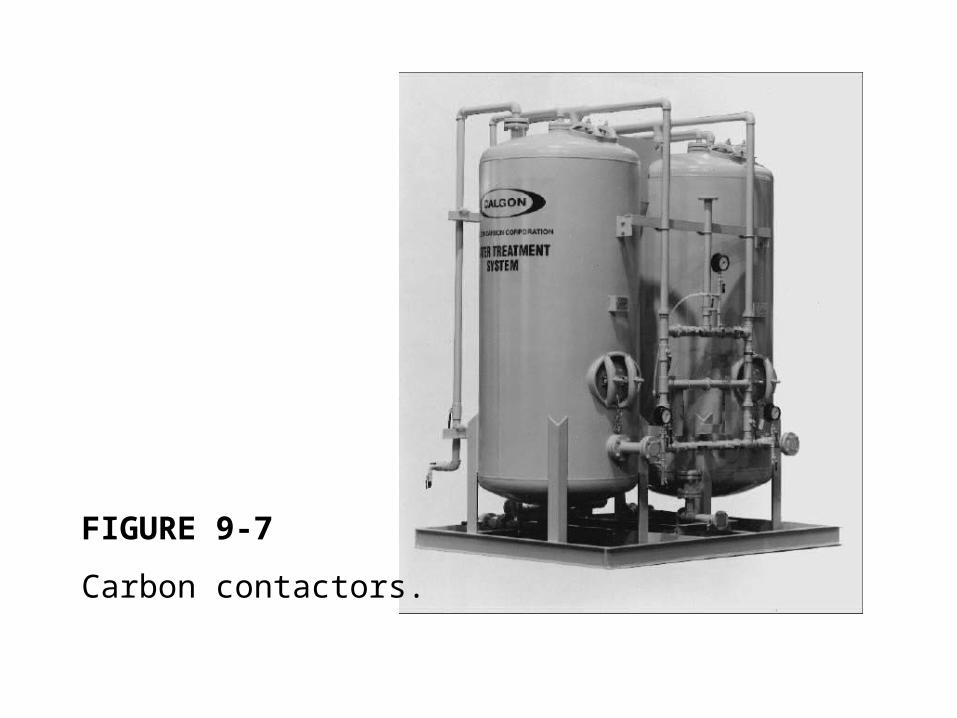
FIGURE 9-7
Carbon contactors.
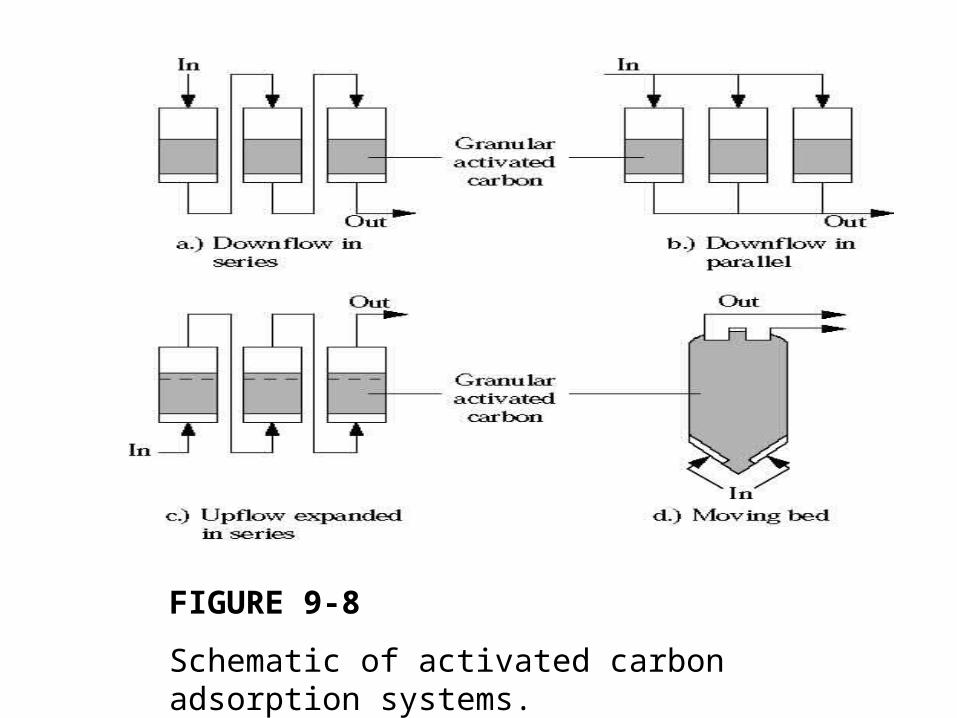
FIGURE 9-8
Schematic of activated carbon adsorption systems.

FIGURE 9-9
Transport processes.
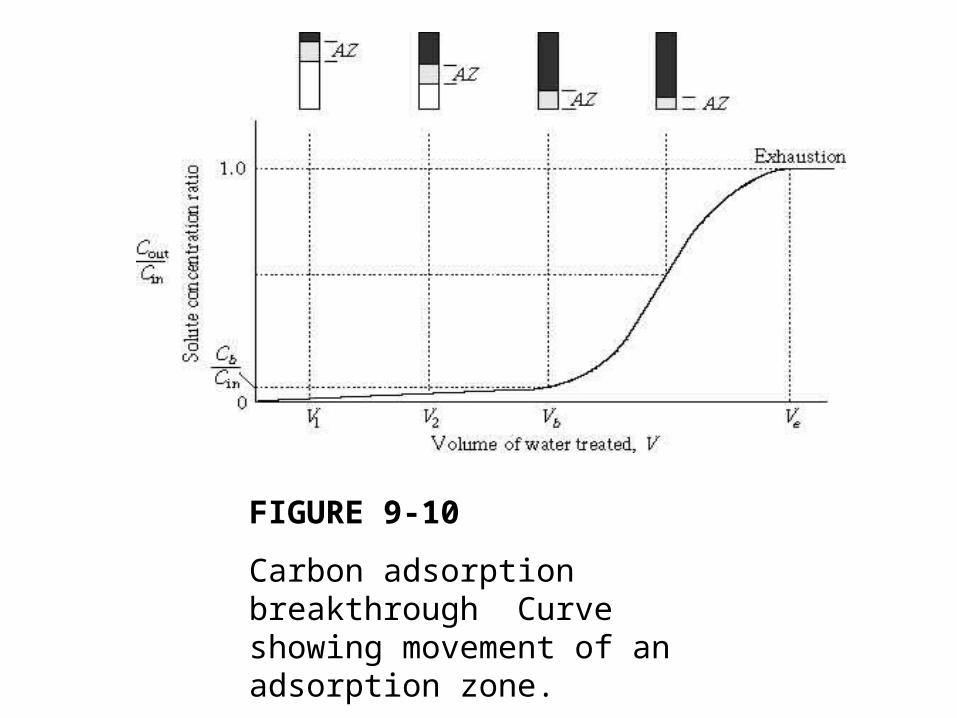
FIGURE 9-10
Carbon adsorption breakthrough Curve showing movement of an adsorption zone.
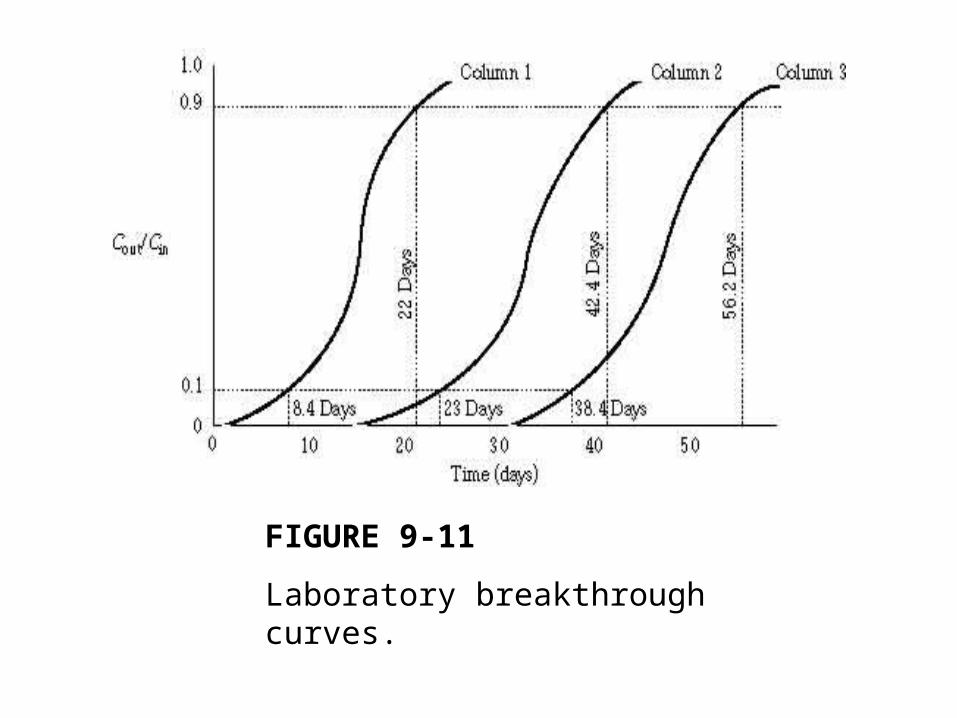
FIGURE 9-11
Laboratory breakthrough curves.
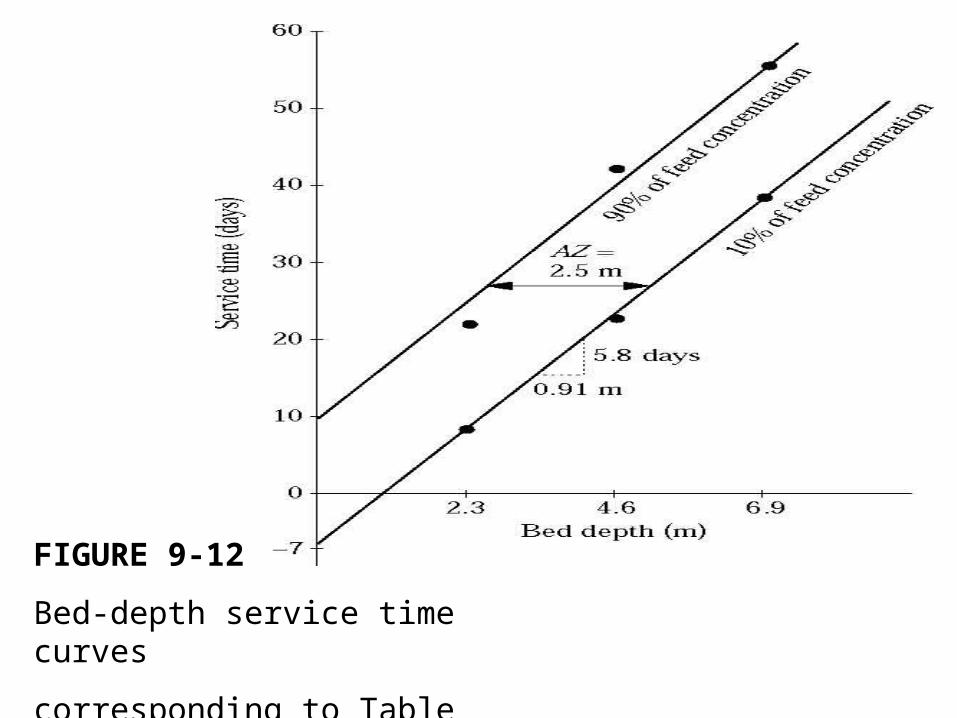
FIGURE 9-12
Bed-depth service time curves
corresponding to Table 9-4.

FIGURE 9-13
Atmospheric pressure steam stripping column.
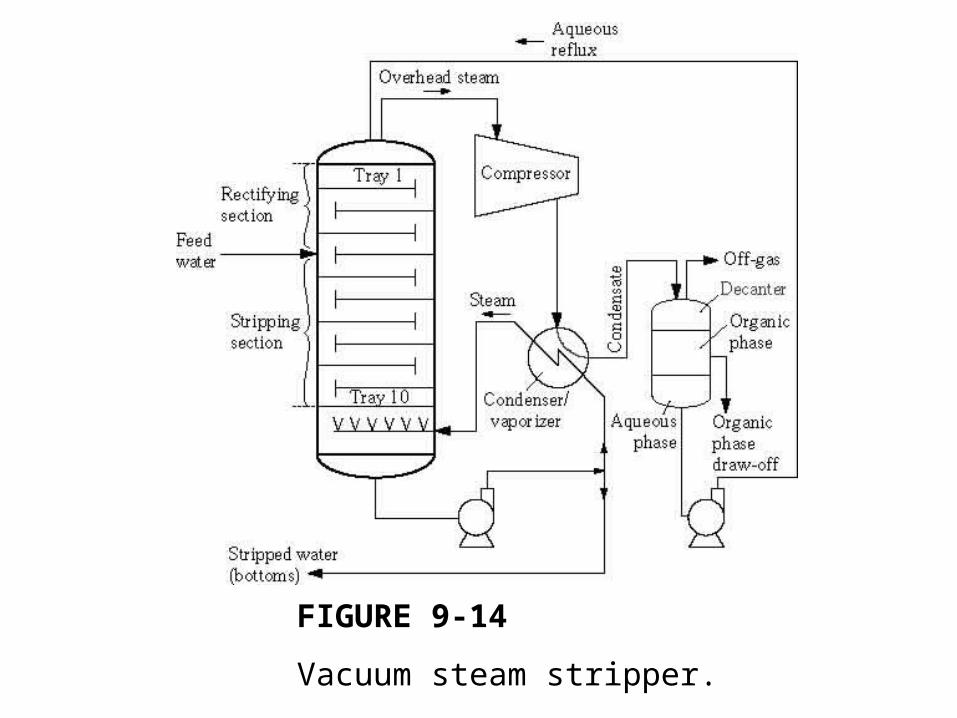
FIGURE 9-14
Vacuum steam stripper.
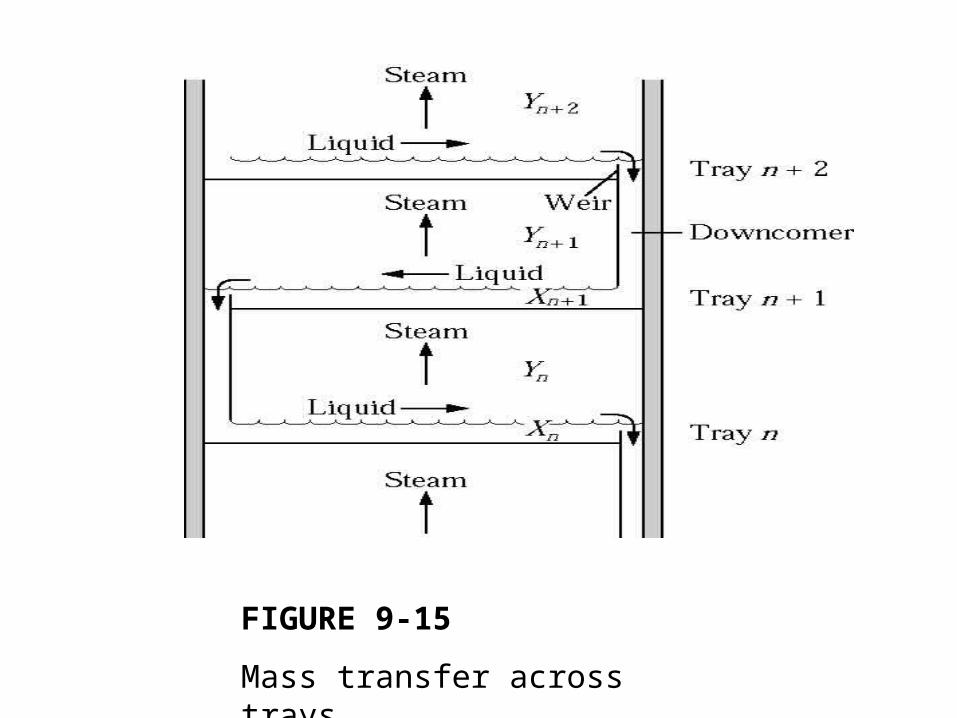
FIGURE 9-15
Mass transfer across trays.
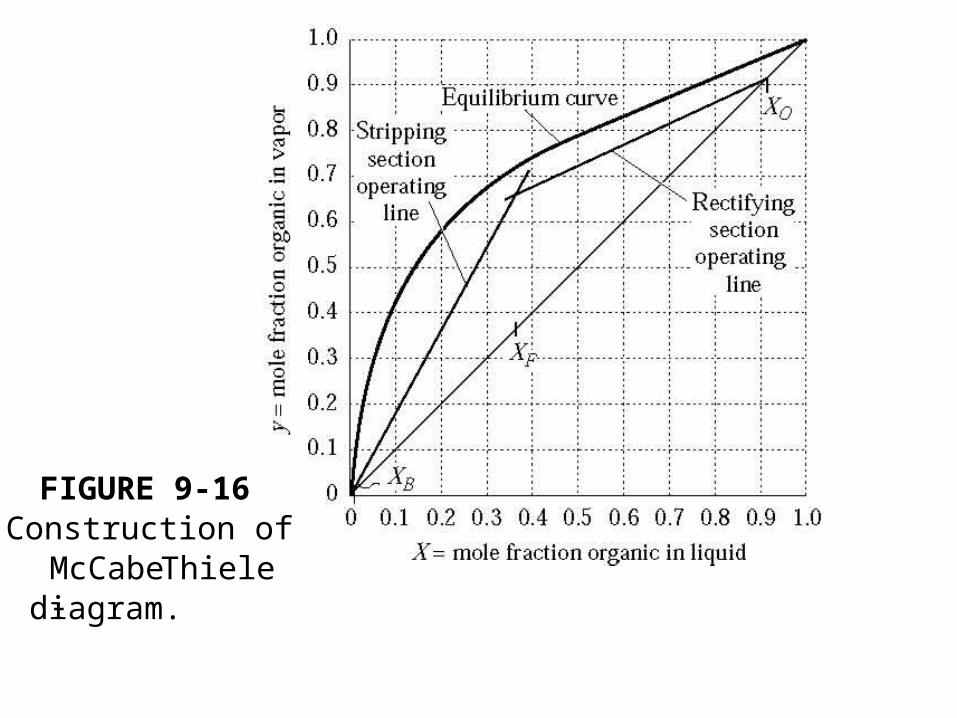
FIGURE 9-16Construction of
McCabe-
Thielediagram.
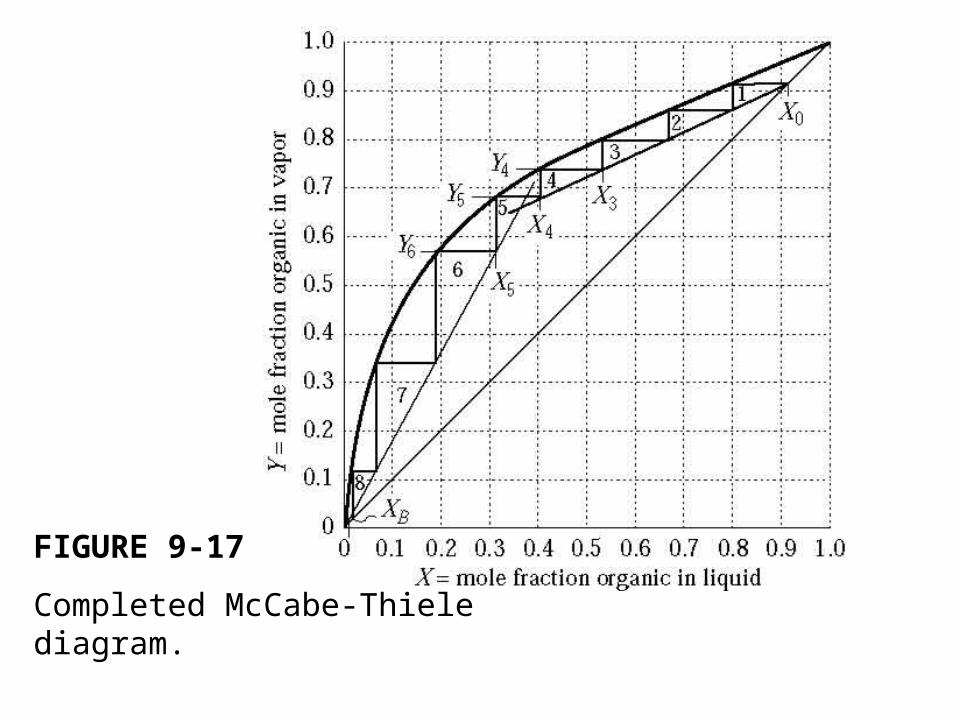
FIGURE 9-17
Completed McCabe-Thiele diagram.
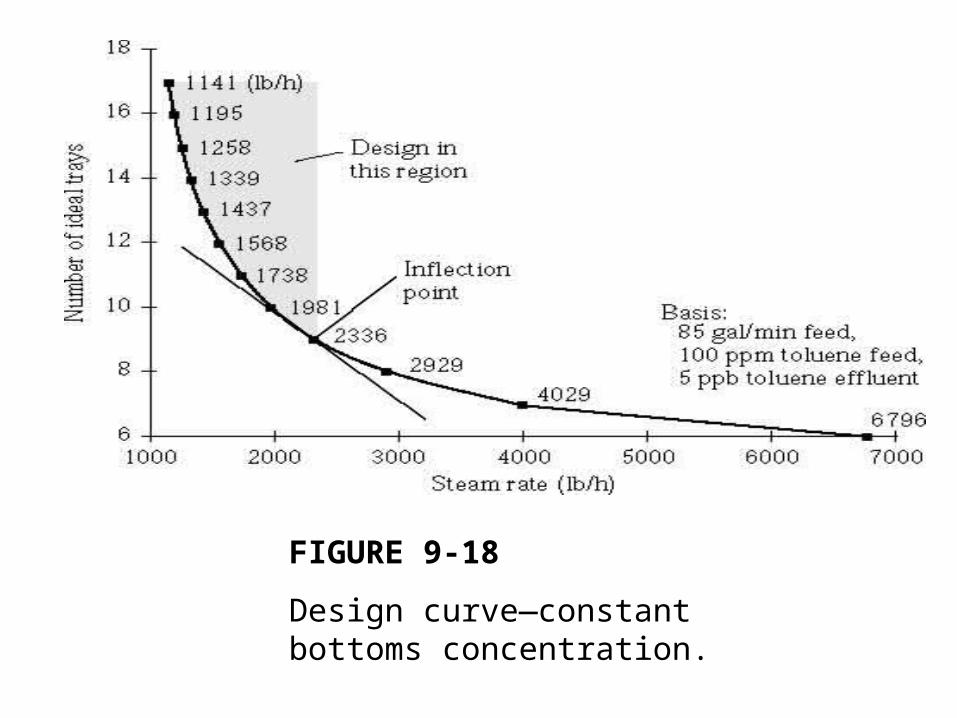
FIGURE 9-18
Design curve—constant bottoms concentration.

FIGURE 9-19
Plate types.
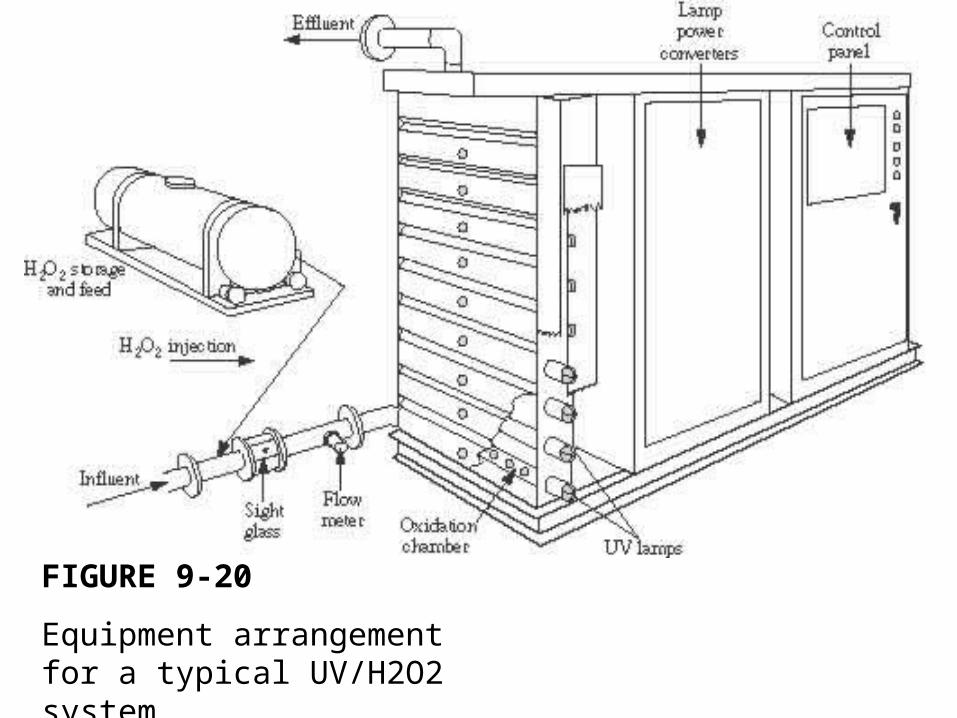
FIGURE 9-20
Equipment arrangement for a typical UV/H2O2 system.

FIGURE 9-21Destruction of chlorinatedorganics by ozone with andwithout UV radiation.
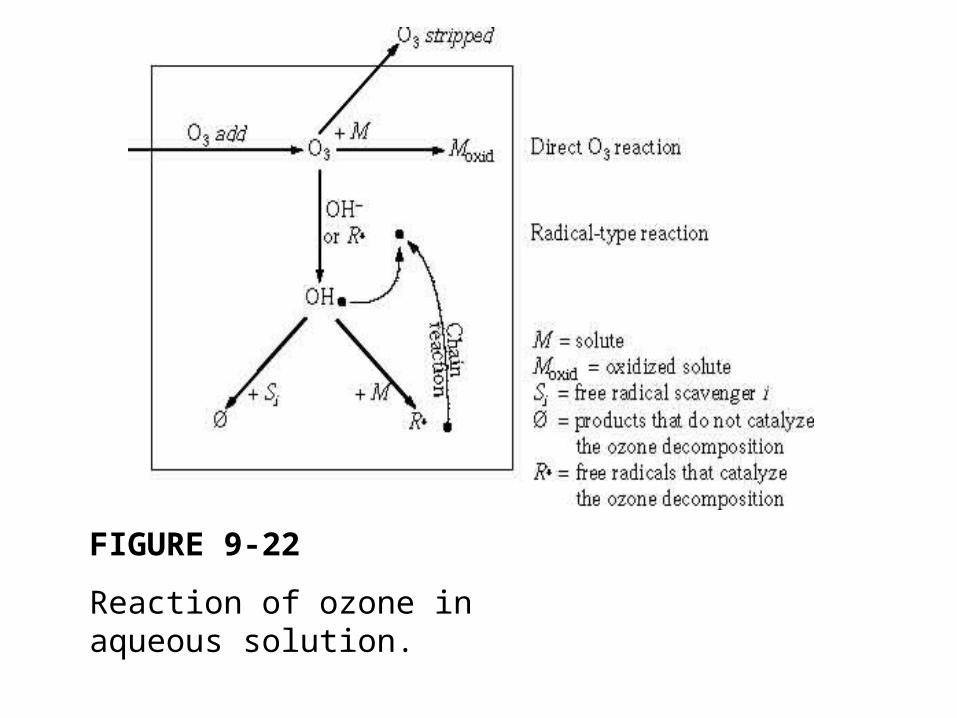
FIGURE 9-22
Reaction of ozone in aqueous solution.
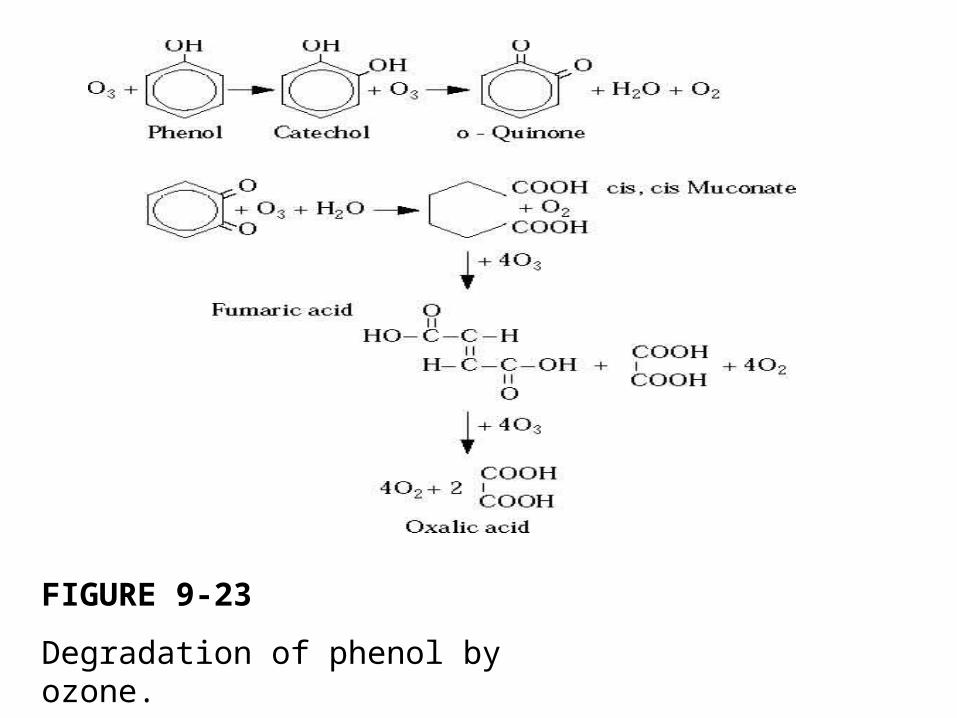
FIGURE 9-23
Degradation of phenol by ozone.
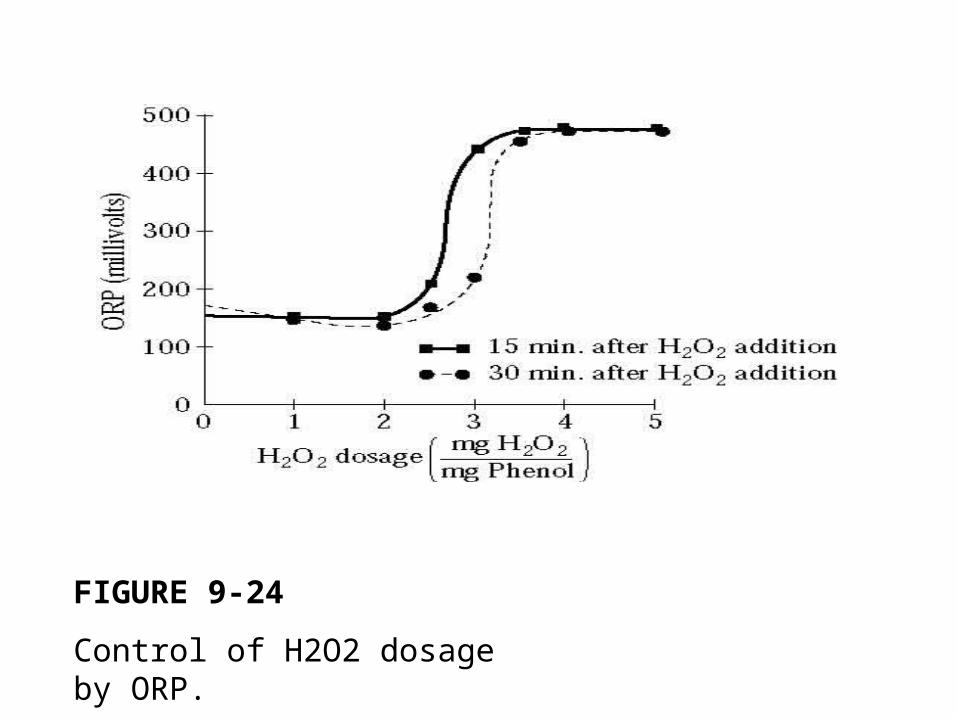
FIGURE 9-24
Control of H2O2 dosage by ORP.
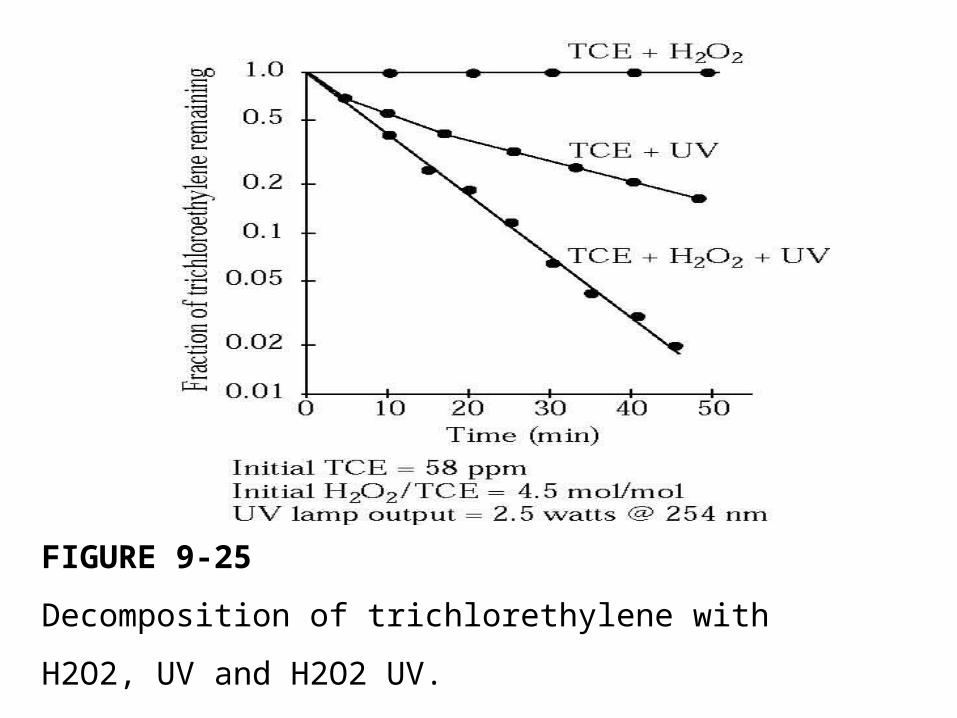
FIGURE 9-25
Decomposition of trichlorethylene with
H2O2, UV and H2O2 UV.
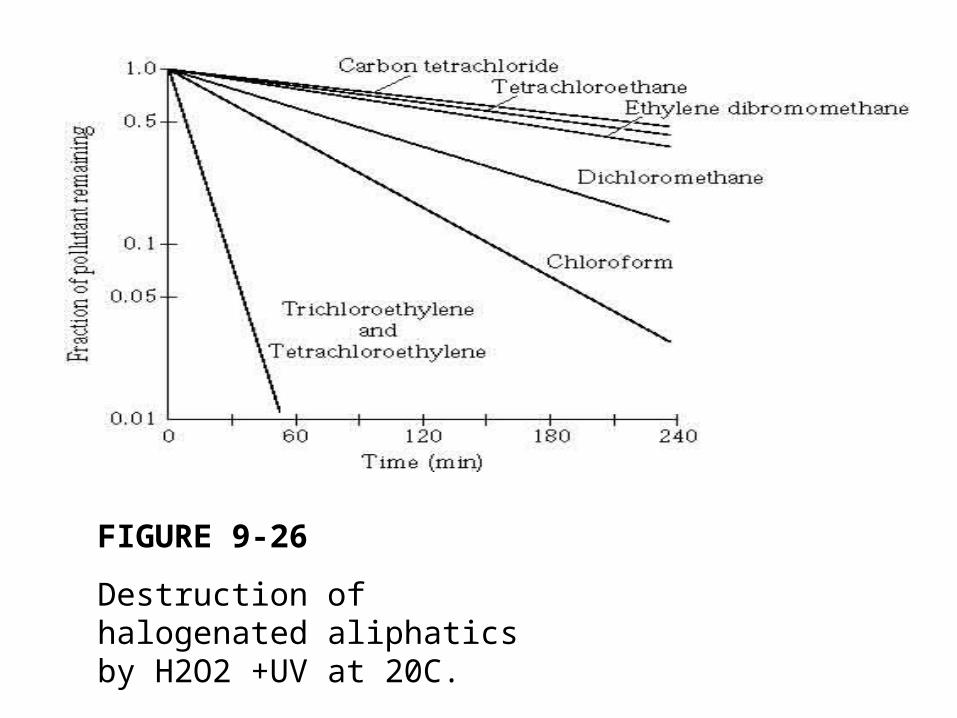
FIGURE 9-26
Destruction of halogenated aliphatics by H2O2 +UV at 20C.
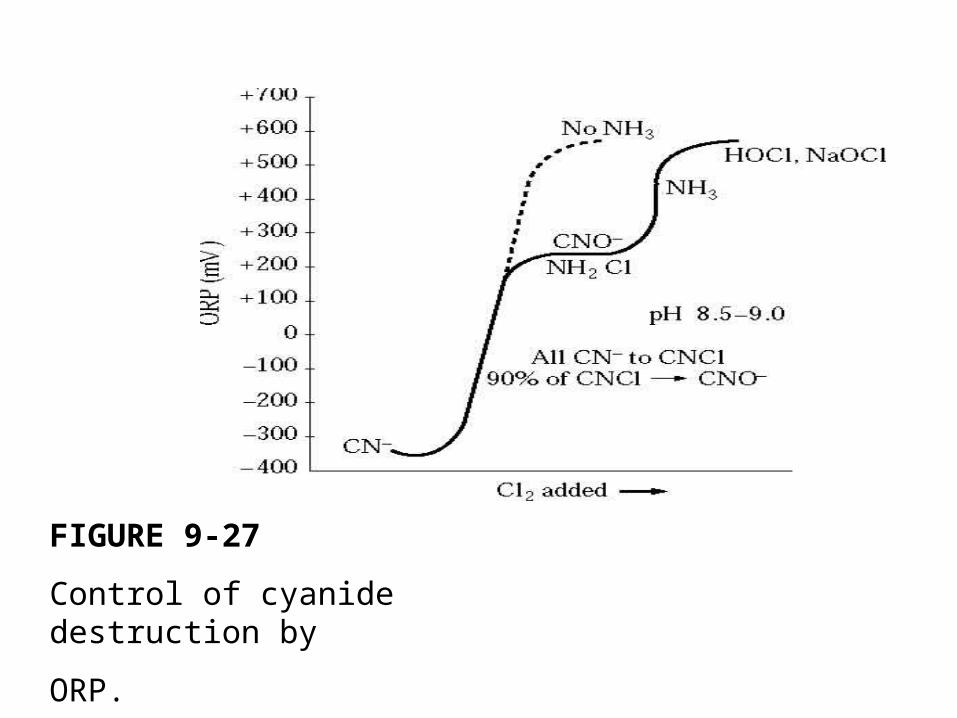
FIGURE 9-27
Control of cyanide destruction by
ORP.
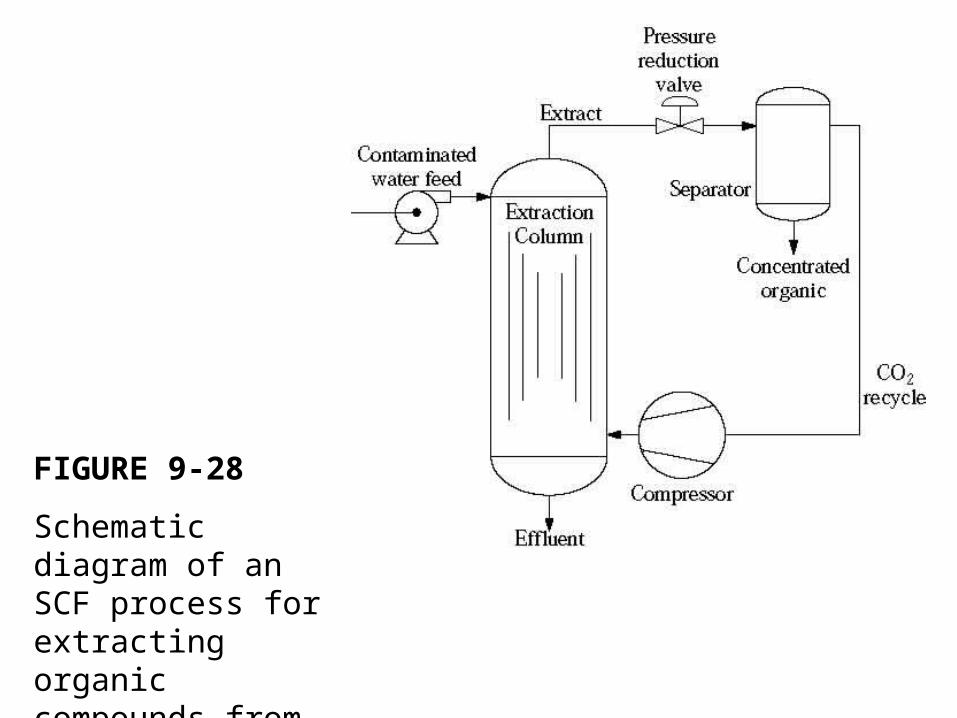
FIGURE 9-28
Schematic diagram of an SCF process for extracting organic compounds from water using CO2.

FIGURE 9-29
Process schematic diagram for SCF oxidation of an aqueous waste.

FIGURE 9-30
Pressure temperature phase
diagram for water.

FIGURE 9-31
Variation in reduced density (ρR ) near the critical point for a pure compound.
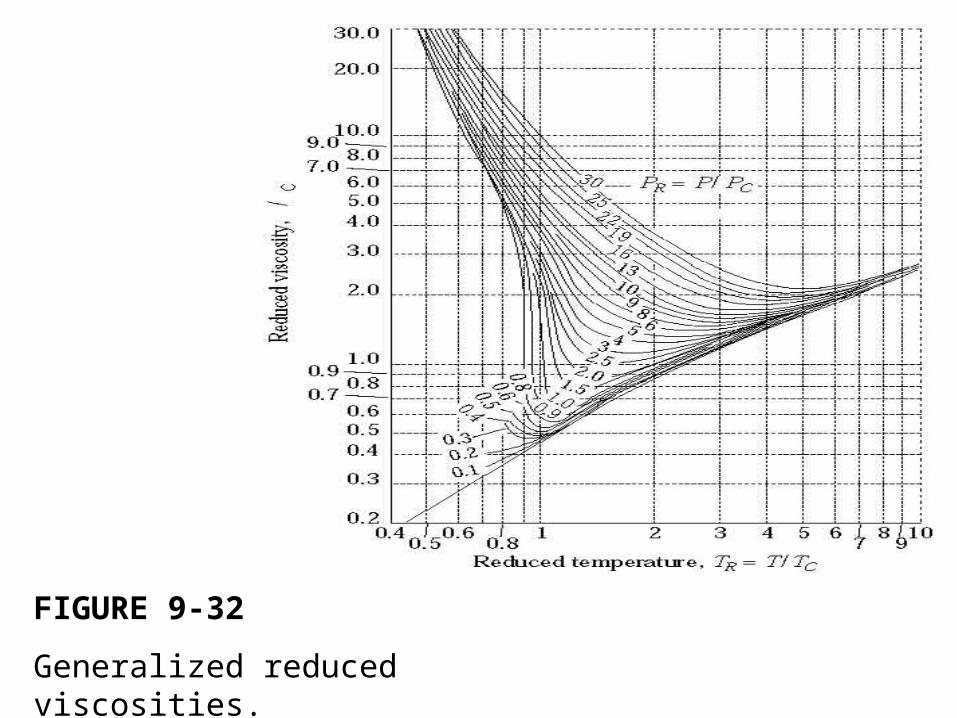
FIGURE 9-32
Generalized reduced viscosities.

FIGURE 9-33
Properties of water at 250 atm.
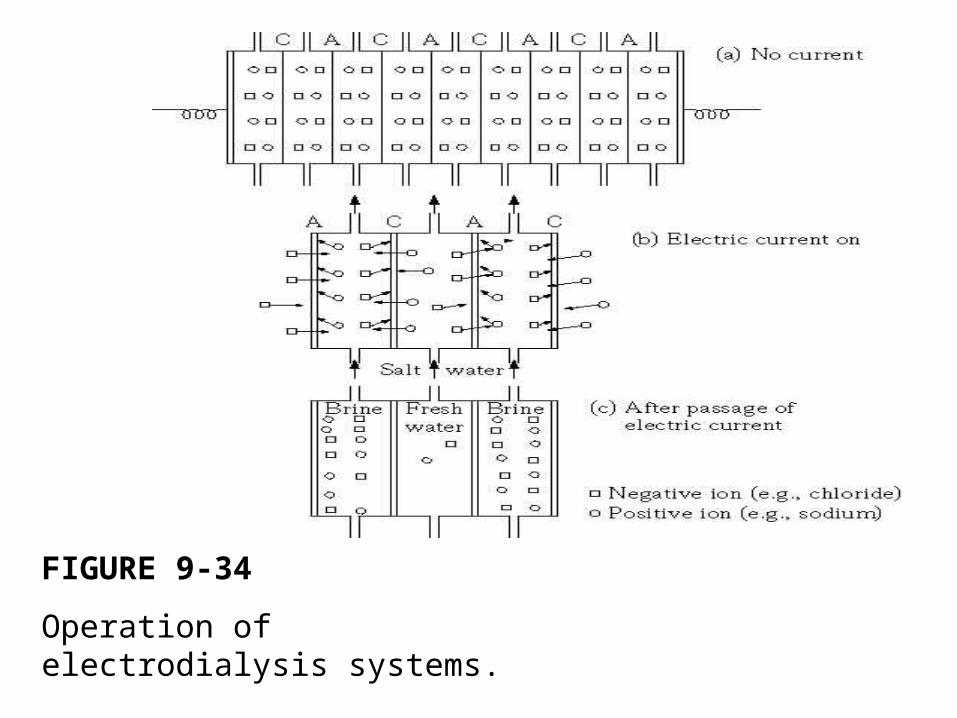
FIGURE 9-34
Operation of electrodialysis systems.
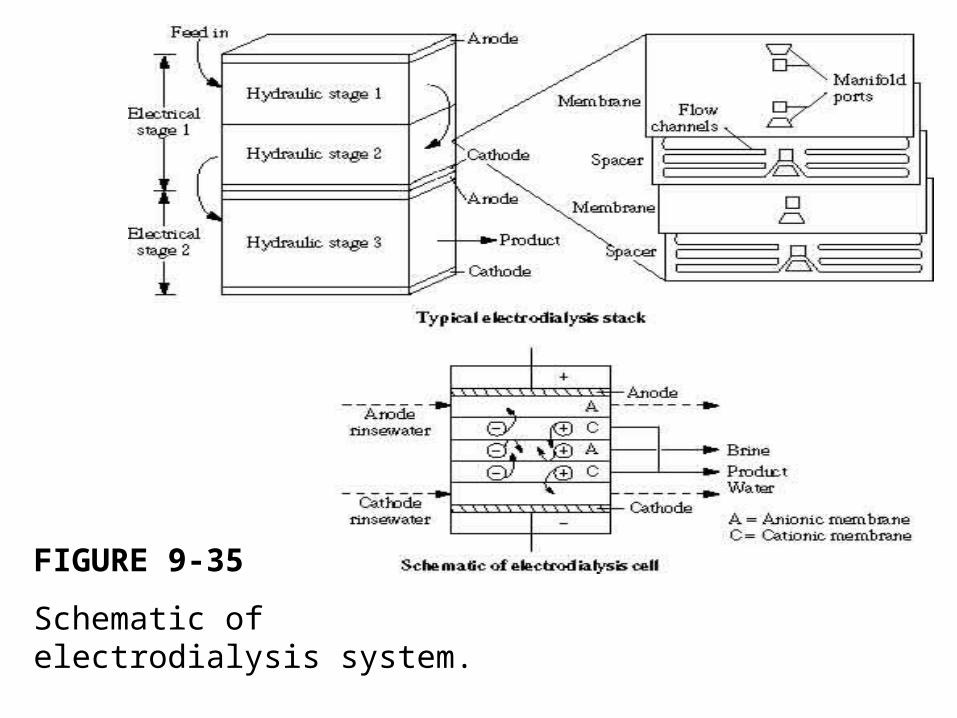
FIGURE 9-35
Schematic of electrodialysis system.
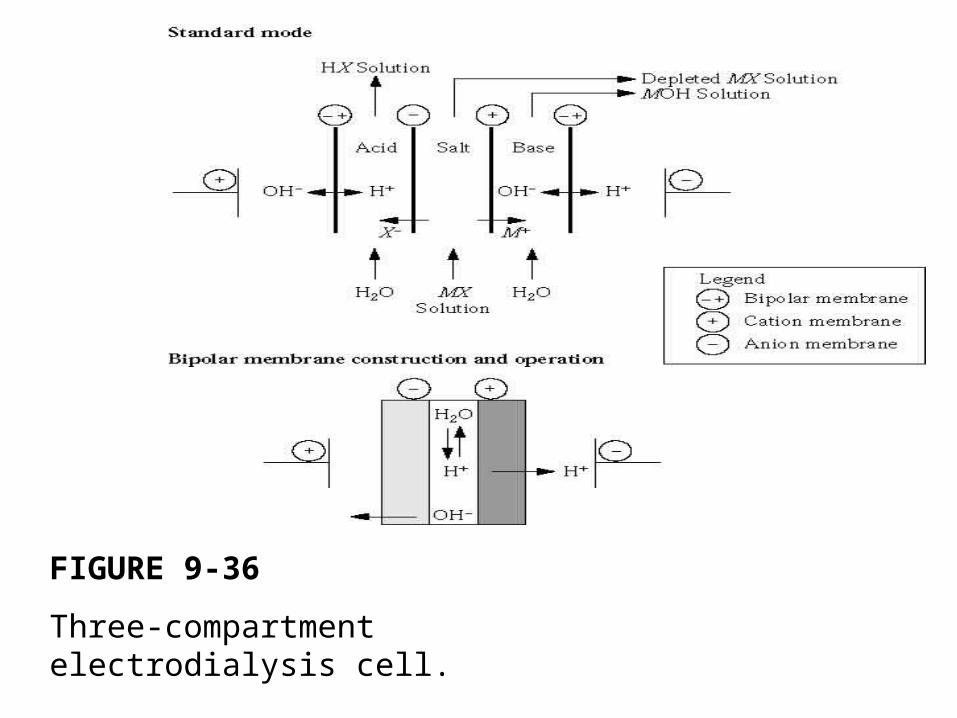
FIGURE 9-36
Three-compartment electrodialysis cell.
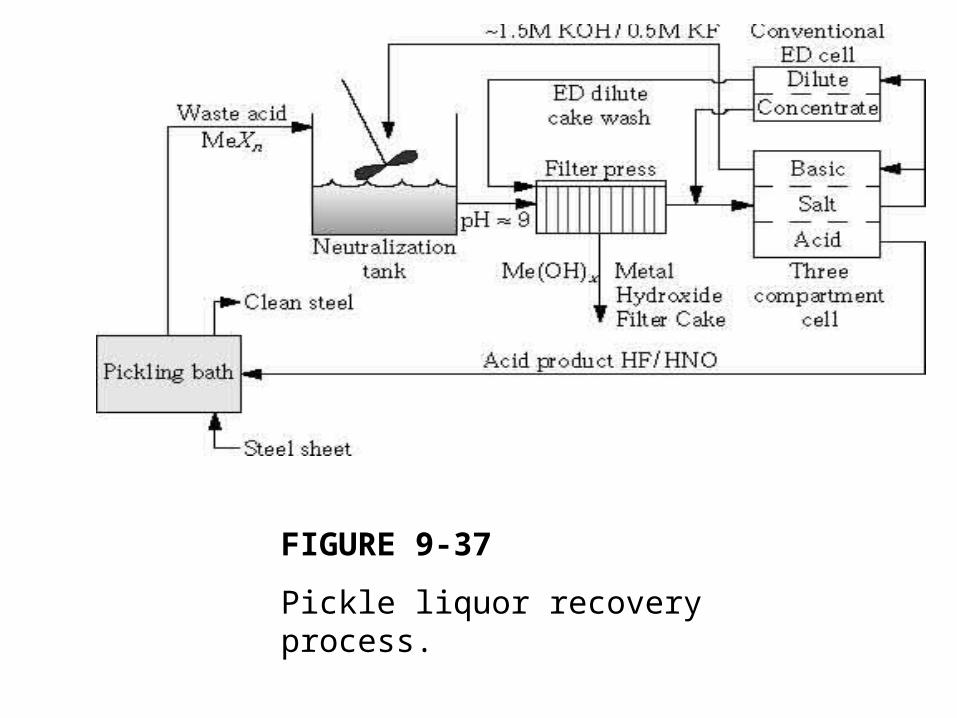
FIGURE 9-37
Pickle liquor recovery process.
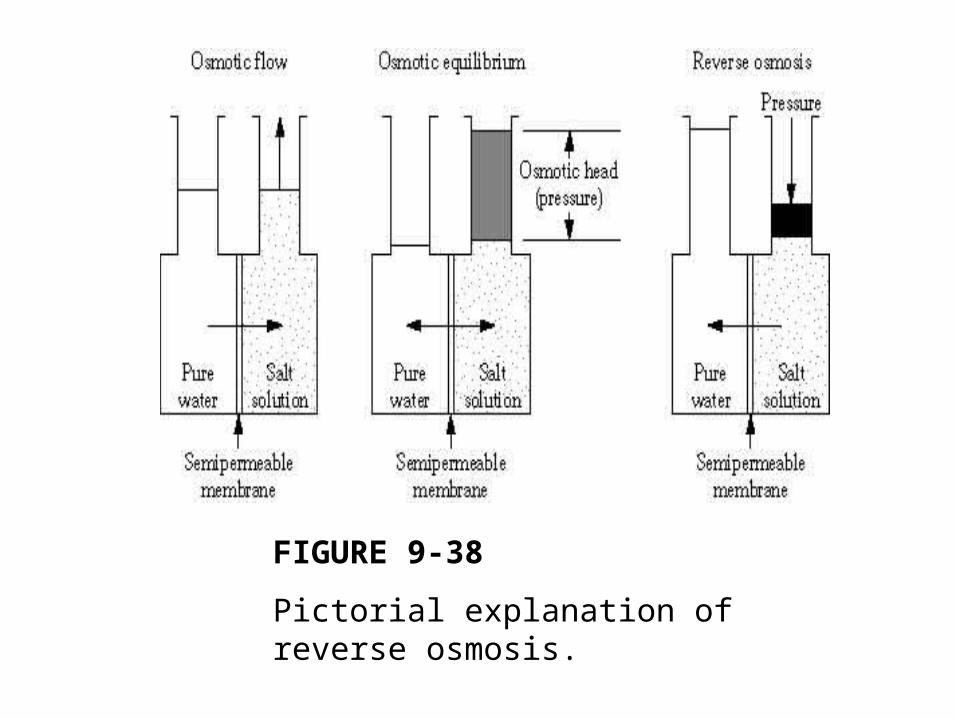
FIGURE 9-38
Pictorial explanation of reverse osmosis.

FIGURE 9-39
Flow diagram for a reverse osmosis system treating plating rinsewater.
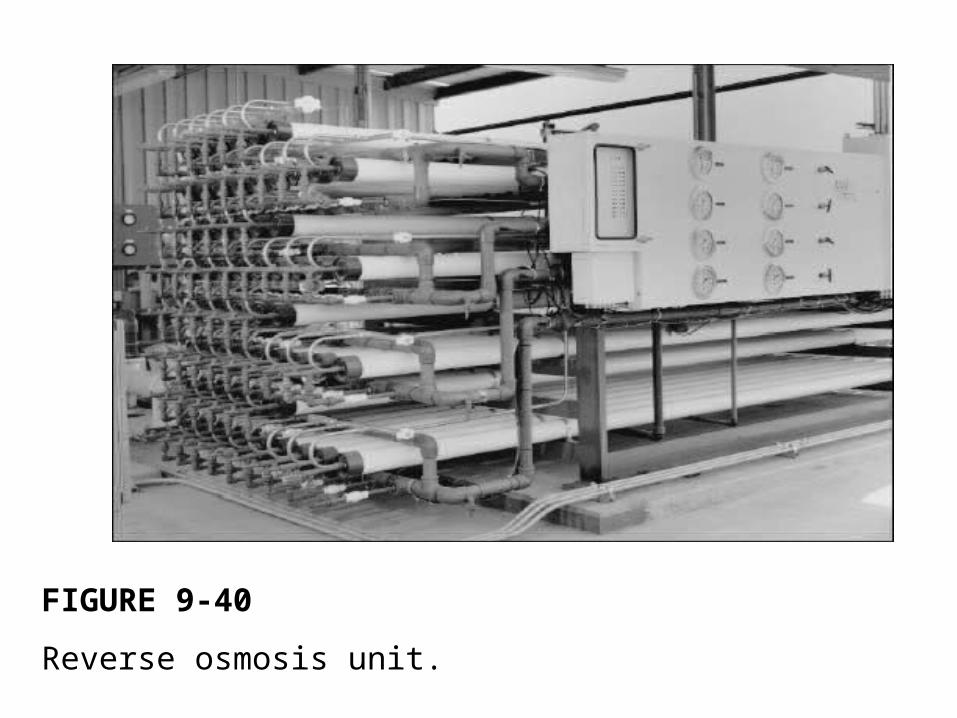
FIGURE 9-40
Reverse osmosis unit.
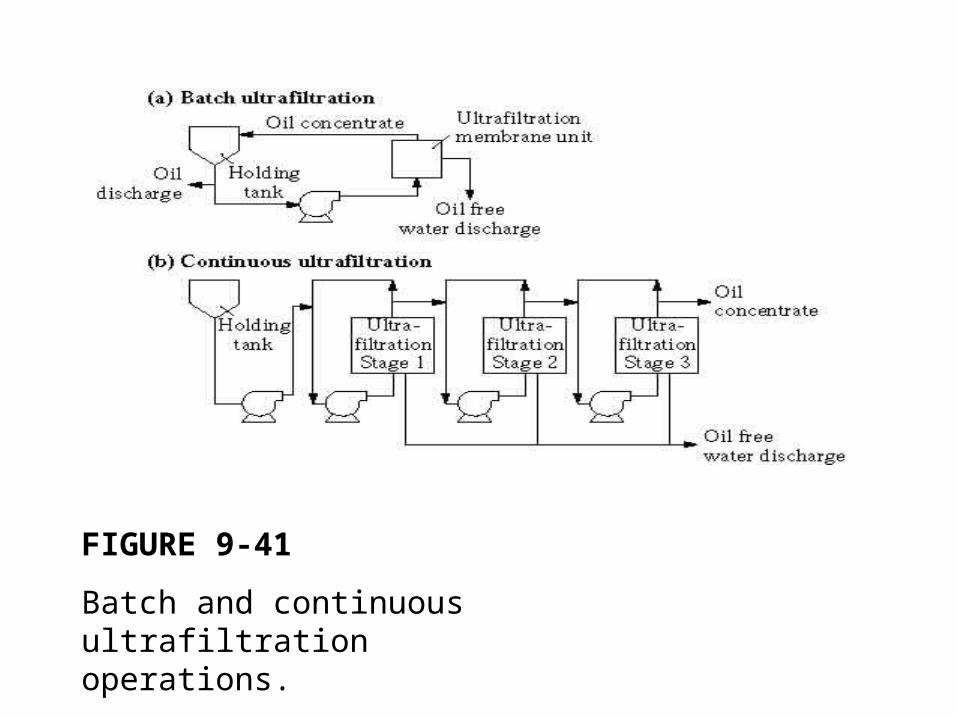
FIGURE 9-41
Batch and continuous ultrafiltration operations.

FIGURE 9-42
Verification of the solute permeation
model for Tomhannock natural organic
matter (NOM).
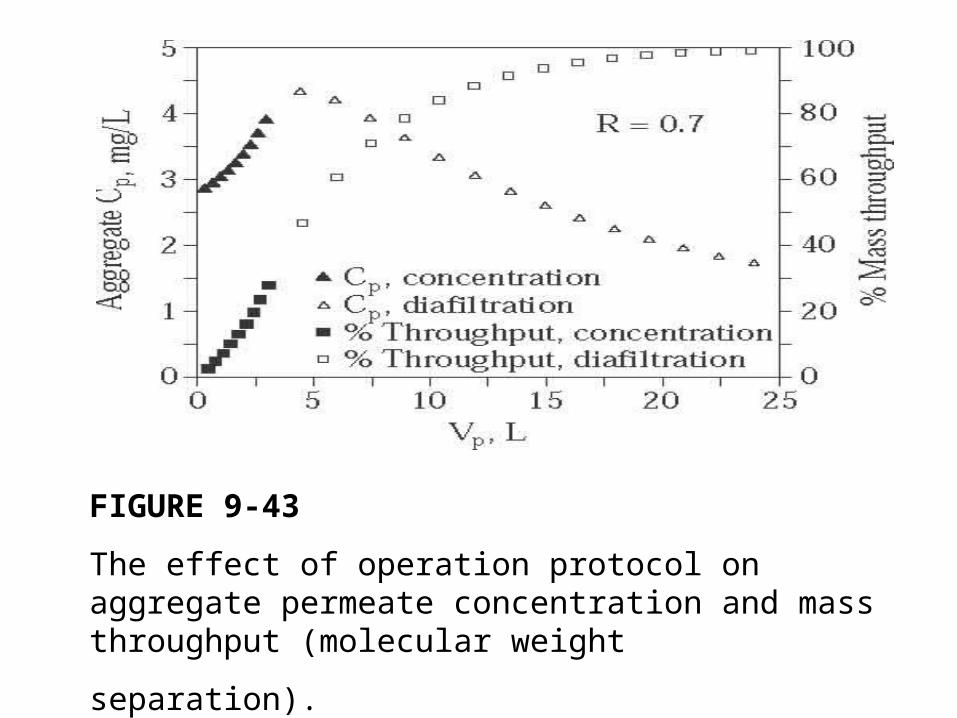
FIGURE 9-43
The effect of operation protocol on aggregate permeate concentration and mass throughput (molecular weight
separation).