Embed Size (px)
Citation preview
NREL is a national laboratory of the U.S. Department of Energy, Office of Energy Efficiency and Renewable Energy, operated by the Alliance for Sustainable Energy, LLC.
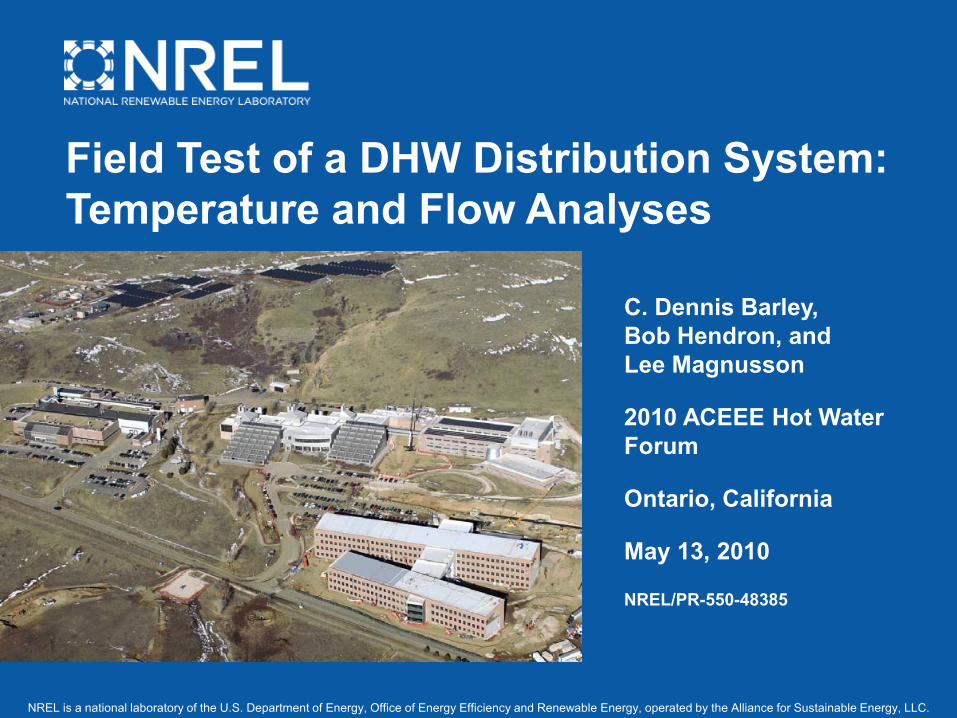
Field Test of a DHW Distribution System: Temperature and Flow Analyses
C. Dennis Barley, Bob Hendron, and Lee Magnusson
2010 ACEEE Hot Water Forum
Ontario, California
May 13, 2010
NREL/PR-550-48385
Innovation for Our Energy Future
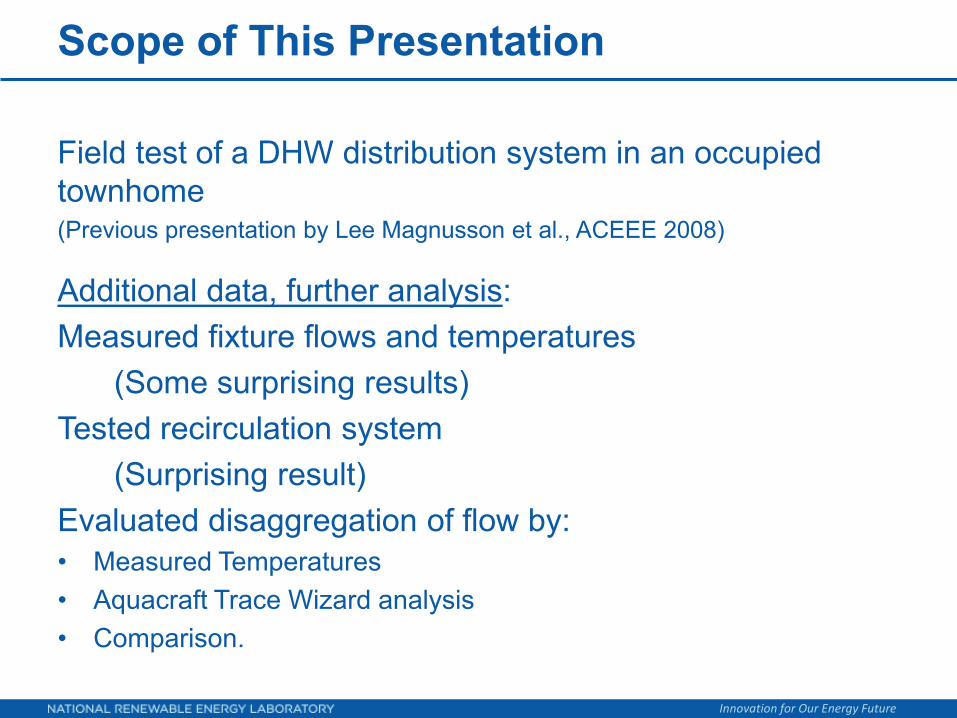
Scope of This Presentation
Field test of a DHW distribution system in an occupied townhome (Previous presentation by Lee Magnusson et al., ACEEE 2008)
Additional data, further analysis:Measured fixture flows and temperatures
(Some surprising results)Tested recirculation system
(Surprising result)Evaluated disaggregation of flow by:• Measured Temperatures• Aquacraft Trace Wizard analysis• Comparison.

Innovation for Our Energy Future
Description of Home
Solar Row, in Boulder, Colorado3-story, 1,700 finished ft2
+ Semi-finished basement, 587 ft2
3 bedrooms, 2 occupants.Solar DHW/space combination systemCondensing boiler backup
Unit 1→
Credit: Paul Norton/NREL
Innovation for Our Energy Future
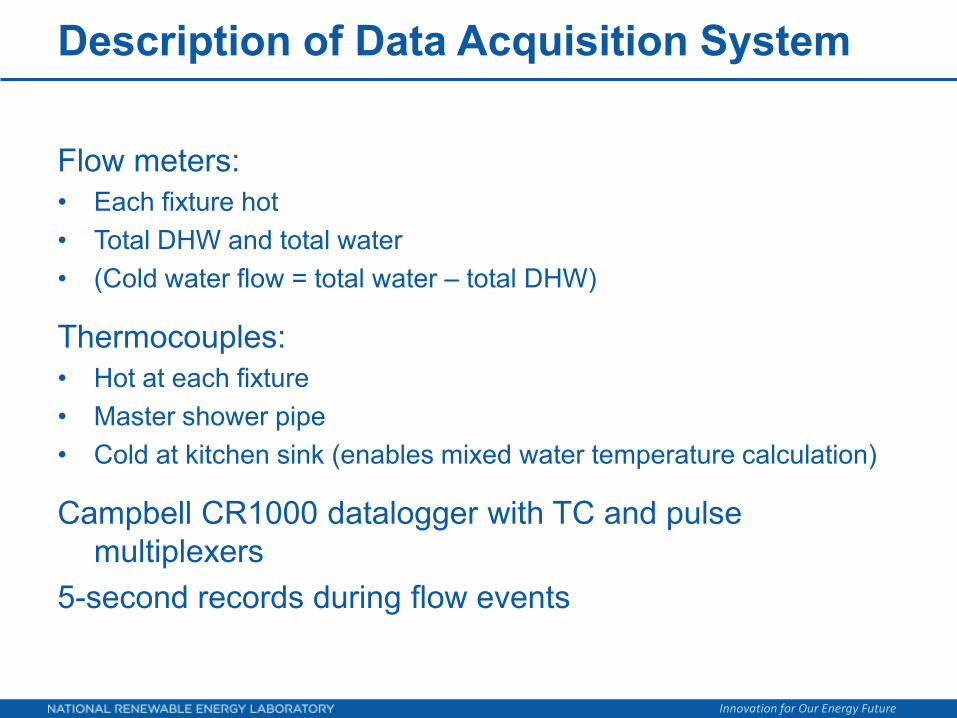
Description of Data Acquisition System
Flow meters: • Each fixture hot• Total DHW and total water• (Cold water flow = total water – total DHW)
Thermocouples:• Hot at each fixture• Master shower pipe• Cold at kitchen sink (enables mixed water temperature calculation)
Campbell CR1000 datalogger with TC and pulse multiplexers
5-second records during flow events
Innovation for Our Energy Future
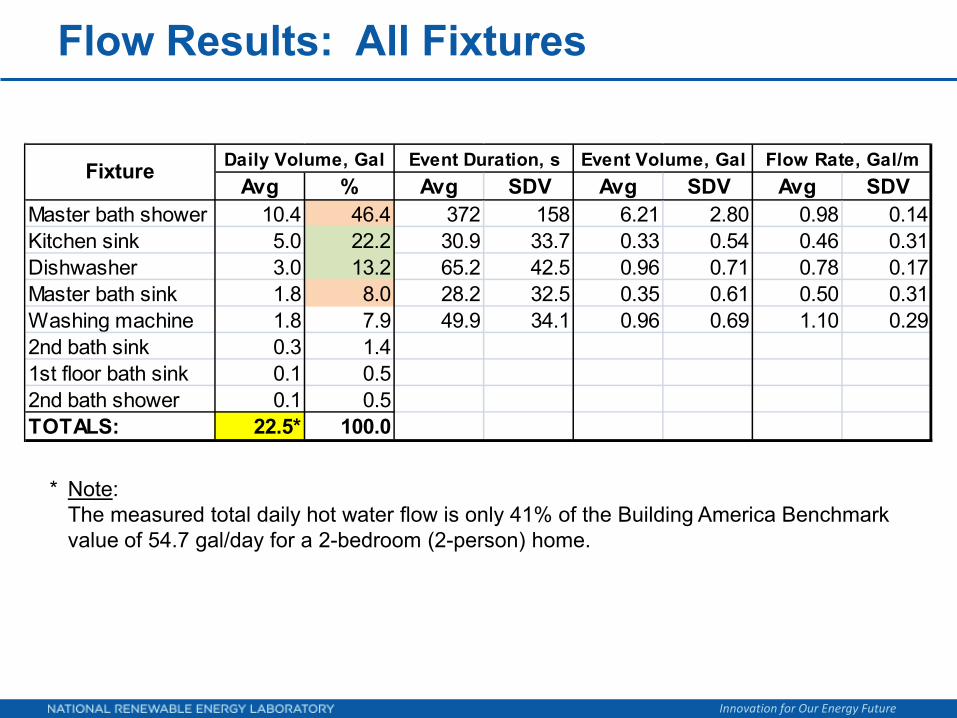
Flow Results: All Fixtures
* Note: The measured total daily hot water flow is only 41% of the Building America Benchmark value of 54.7 gal/day for a 2-bedroom (2-person) home.
Avg % Avg SDV Avg SDV Avg SDVMaster bath shower 10.4 46.4 372 158 6.21 2.80 0.98 0.14Kitchen sink 5.0 22.2 30.9 33.7 0.33 0.54 0.46 0.31Dishwasher 3.0 13.2 65.2 42.5 0.96 0.71 0.78 0.17Master bath sink 1.8 8.0 28.2 32.5 0.35 0.61 0.50 0.31Washing machine 1.8 7.9 49.9 34.1 0.96 0.69 1.10 0.292nd bath sink 0.3 1.41st floor bath sink 0.1 0.52nd bath shower 0.1 0.5TOTALS: 22.5* 100.0
Fixture Daily Volume, Gal Event Duration, s Event Volume, Gal Flow Rate, Gal/m
Innovation for Our Energy Future
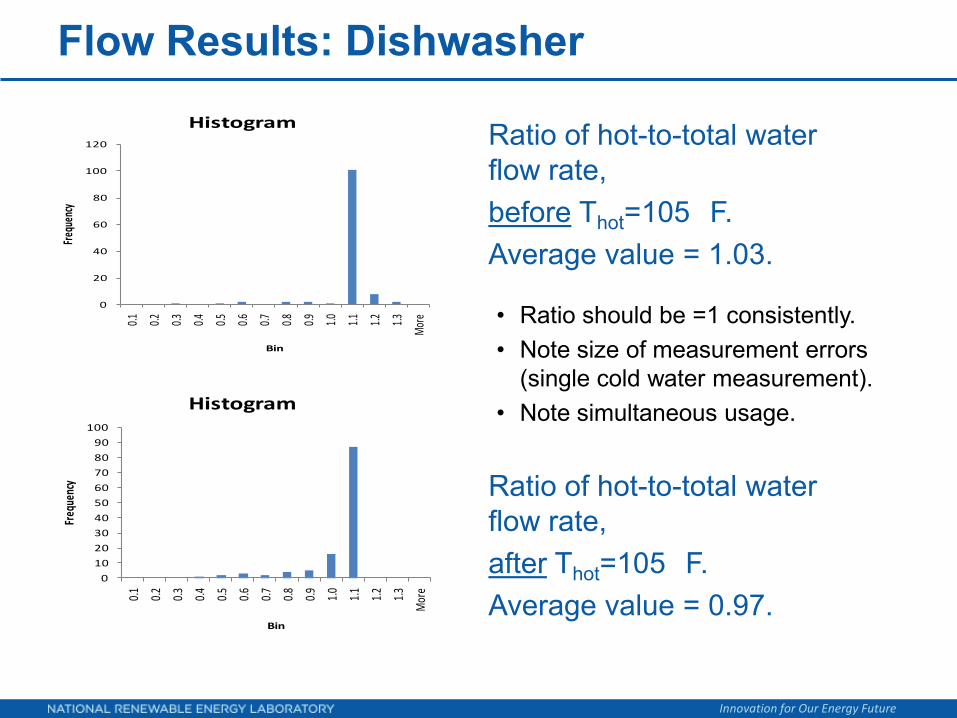
Flow Results: Dishwasher
Ratio of hot-to-total water flow rate,before Thot=105 F.Average value = 1.03.
0
20
40
60
80
100
1200.1 0.2 0.3 0.4 0.5 0.6 0.7 0.8 0.9 1.0 1.1 1.2 1.3
Mor
e
Freq
uenc
y
Bin
Histogram
0
10
20
30
40
50
60
70
80
90
100
0.1 0.2 0.3 0.4 0.5 0.6 0.7 0.8 0.9 1.0 1.1 1.2 1.3
Mor
e
Freq
uenc
y
Bin
Histogram
• Ratio should be =1 consistently.• Note size of measurement errors
(single cold water measurement).• Note simultaneous usage.
Ratio of hot-to-total water flow rate,after Thot=105 F.Average value = 0.97.
Innovation for Our Energy Future
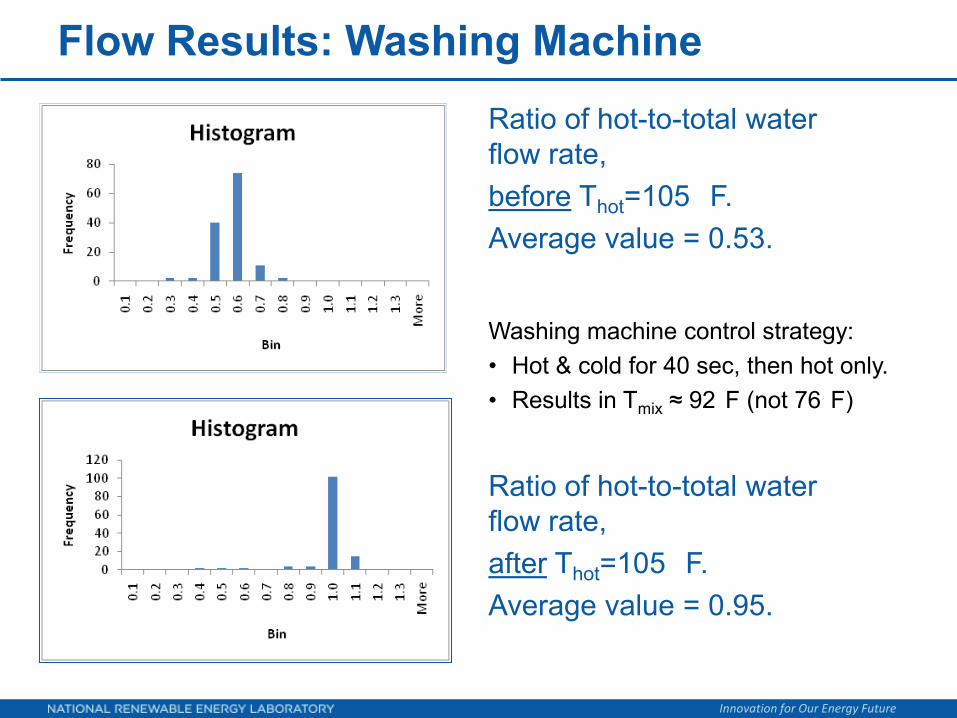
Flow Results: Washing MachineRatio of hot-to-total water flow rate,before Thot=105 F.Average value = 0.53.
Ratio of hot-to-total water flow rate,after Thot=105 F.Average value = 0.95.
Washing machine control strategy:• Hot & cold for 40 sec, then hot only.• Results in Tmix ≈ 92 F (not 76 F)
Innovation for Our Energy Future
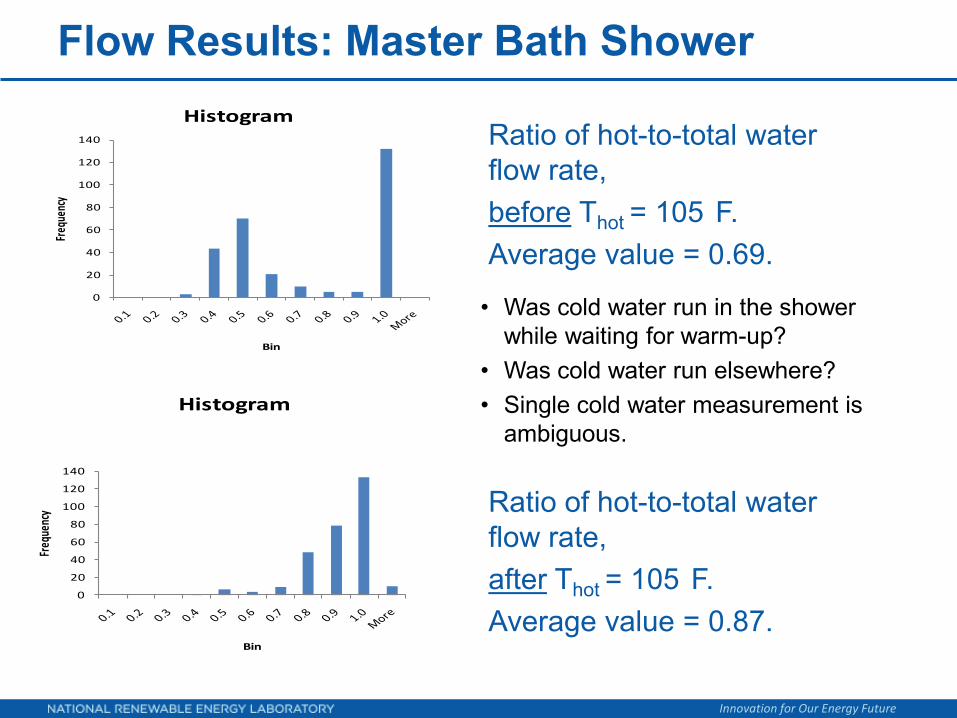
Flow Results: Master Bath Shower
Ratio of hot-to-total water flow rate,before Thot = 105 F.Average value = 0.69.
Ratio of hot-to-total water flow rate,after Thot = 105 F.Average value = 0.87.
0
20
40
60
80
100
120
140
Freq
uenc
y
Bin
Histogram
0
20
40
60
80
100
120
140
Freq
uenc
y
Bin
Histogram
• Was cold water run in the shower while waiting for warm-up?
• Was cold water run elsewhere?• Single cold water measurement is
ambiguous.
Innovation for Our Energy Future
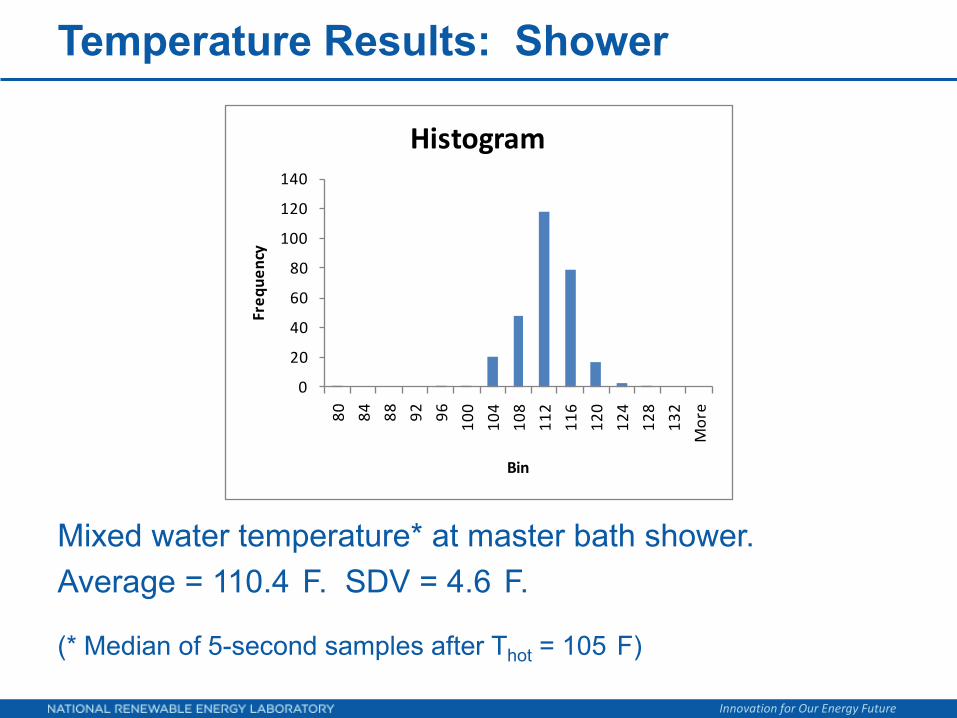
Temperature Results: Shower
Mixed water temperature* at master bath shower. Average = 110.4 F. SDV = 4.6 F.
(* Median of 5-second samples after Thot = 105 F)
0
20
40
60
80
100
120
140
80 84 88 92 96 100
104
108
112
116
120
124
128
132
Mor
e
Freq
uenc
y
Bin
Histogram
Innovation for Our Energy Future
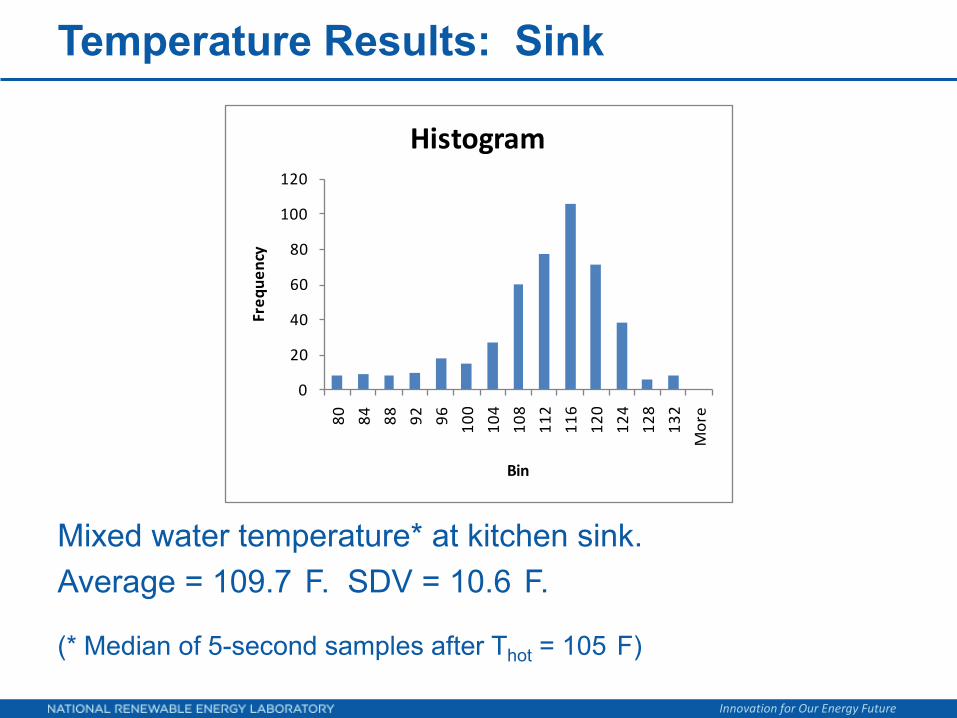
Temperature Results: Sink
Mixed water temperature* at kitchen sink.Average = 109.7 F. SDV = 10.6 F.
(* Median of 5-second samples after Thot = 105 F)
0
20
40
60
80
100
120
80 84 88 92 96 100
104
108
112
116
120
124
128
132
Mor
e
Freq
uenc
y
Bin
Histogram
Innovation for Our Energy Future
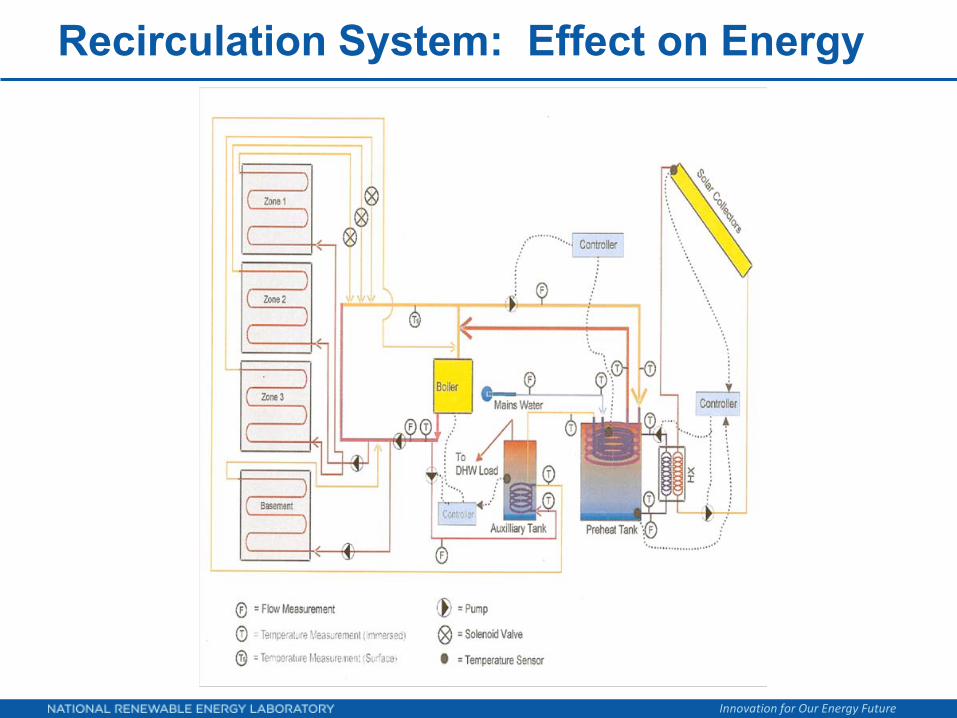
Recirculation System: Description
Purpose: To try to measure runoff of water during warm up at the fixtures, by comparing periods with recirculation off and on.
Configuration: Three zones.
Control: Occupant detectors turn pump on.Temperature sensor on return pipe turns pump off.Sensitivity set high to avoid false negatives.
Innovation for Our Energy Future
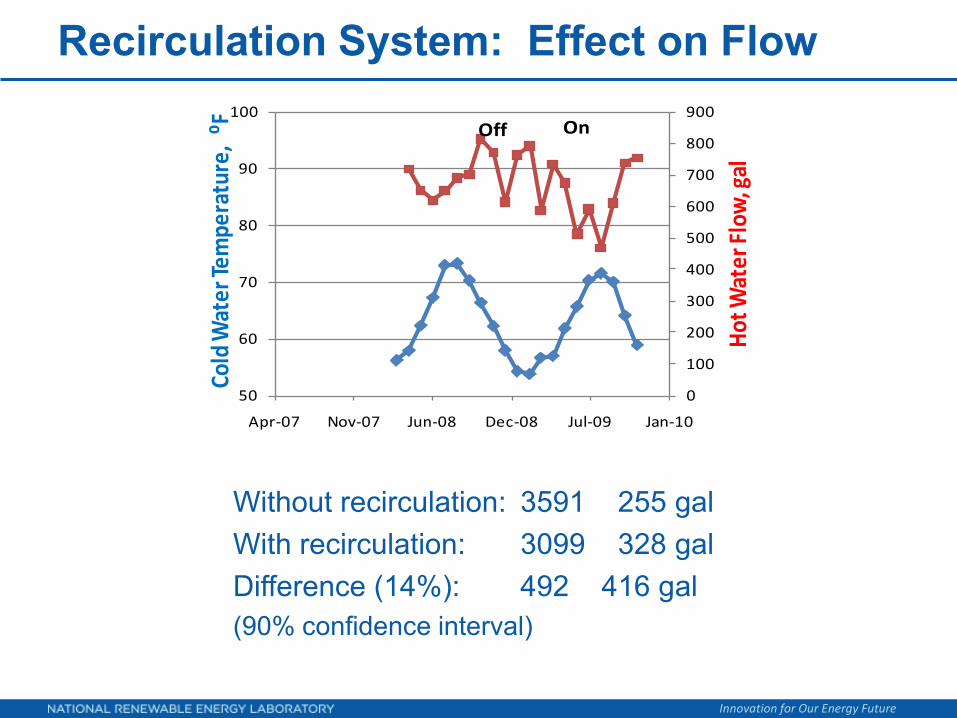
Recirculation System: Effect on Flow
Without recirculation: 3591 255 galWith recirculation: 3099 328 galDifference (14%): 492 416 gal(90% confidence interval)
0
100
200
300
400
500
600
700
800
900
50
60
70
80
90
100
Apr-07 Nov-07 Jun-08 Dec-08 Jul-09 Jan-10
Hot W
ater
Flow
, gal
Cold
Wat
er Te
mpe
ratu
re, ⁰F Off On
Innovation for Our Energy Future
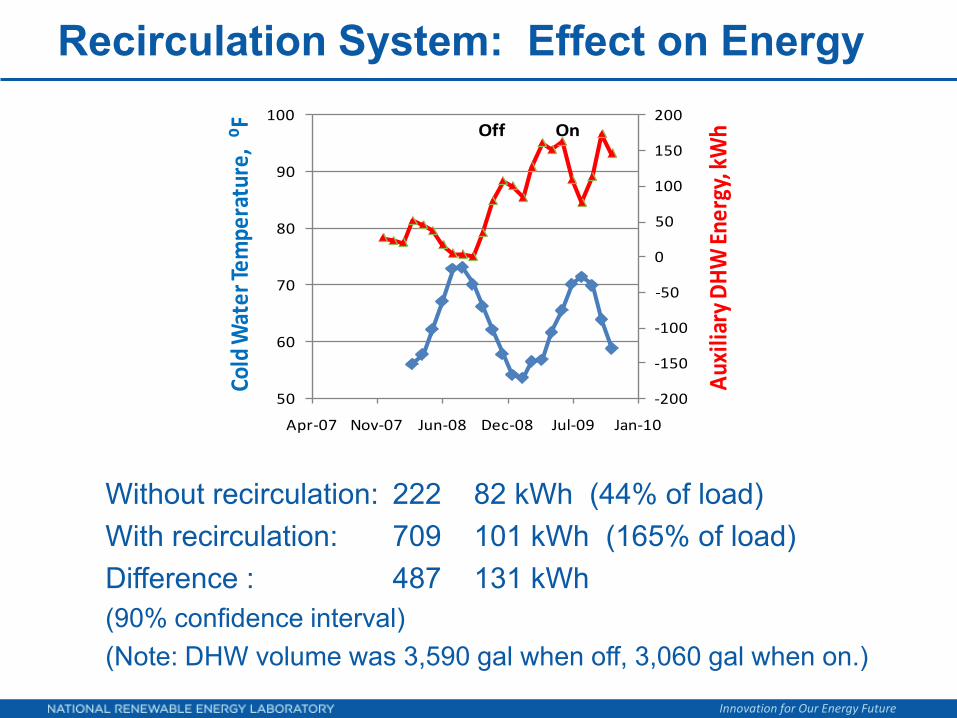
Recirculation System: Effect on Energy
Without recirculation: 222 82 kWh (44% of load)With recirculation: 709 101 kWh (165% of load)Difference : 487 131 kWh(90% confidence interval)(Note: DHW volume was 3,590 gal when off, 3,060 gal when on.)
-200
-150
-100
-50
0
50
100
150
200
50
60
70
80
90
100
Apr-07 Nov-07 Jun-08 Dec-08 Jul-09 Jan-10
Aux
iliar
y D
HW
Ene
rgy,
kW
h
Cold
Wat
er Te
mpe
ratu
re, ⁰F Off On
Innovation for Our Energy Future
Recirculation System: Effect on Energy
Innovation for Our Energy Future
Flow Disaggregation Methods: About
Temperature Disaggregation• Temperatures measured in hot water pipes at the fixtures• Identify which fixture drew hot water based on temperature rise• Method described by:
Weihl, J.S. and Kempton, W. (1985). “Residential Hot Water Energy Analysis: Instruments and Algorithms.” Energy and Buildings, Vol. 8, pp. 197-204.
Aquacraft Trace Wizard© Software• Given sample data from various fixture flows• Given aggregate hot water usage data• Identify which fixture drew hot water based on the draw pattern.
Innovation for Our Energy Future
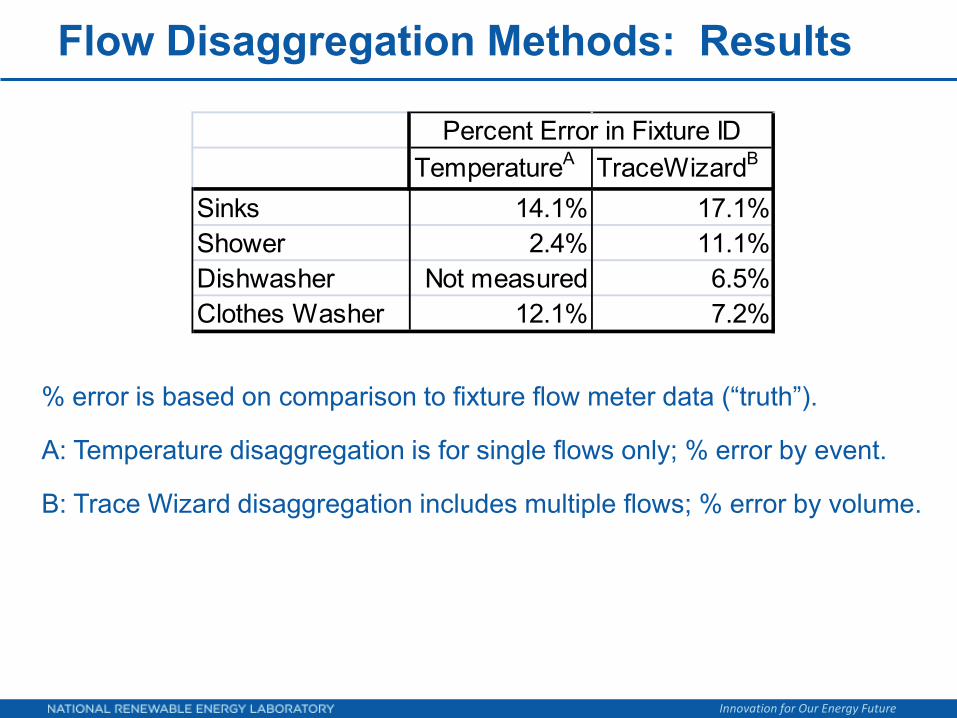
Flow Disaggregation Methods: Results
% error is based on comparison to fixture flow meter data (“truth”).
A: Temperature disaggregation is for single flows only; % error by event.
B: Trace Wizard disaggregation includes multiple flows; % error by volume.
TemperatureA TraceWizardB
Sinks 14.1% 17.1%Shower 2.4% 11.1%Dishwasher Not measured 6.5%Clothes Washer 12.1% 7.2%
Percent Error in Fixture ID
Innovation for Our Energy Future
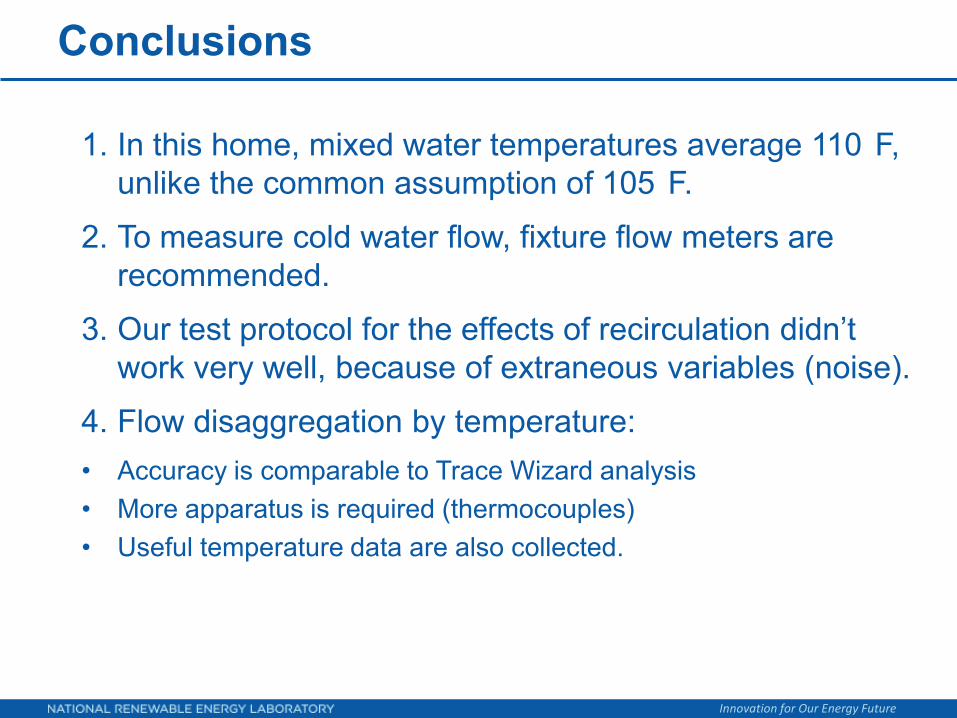
Conclusions
1. In this home, mixed water temperatures average 110 F, unlike the common assumption of 105 F.
2. To measure cold water flow, fixture flow meters are recommended.
3. Our test protocol for the effects of recirculation didn’t work very well, because of extraneous variables (noise).
4. Flow disaggregation by temperature:• Accuracy is comparable to Trace Wizard analysis• More apparatus is required (thermocouples)• Useful temperature data are also collected.
Innovation for Our Energy Future
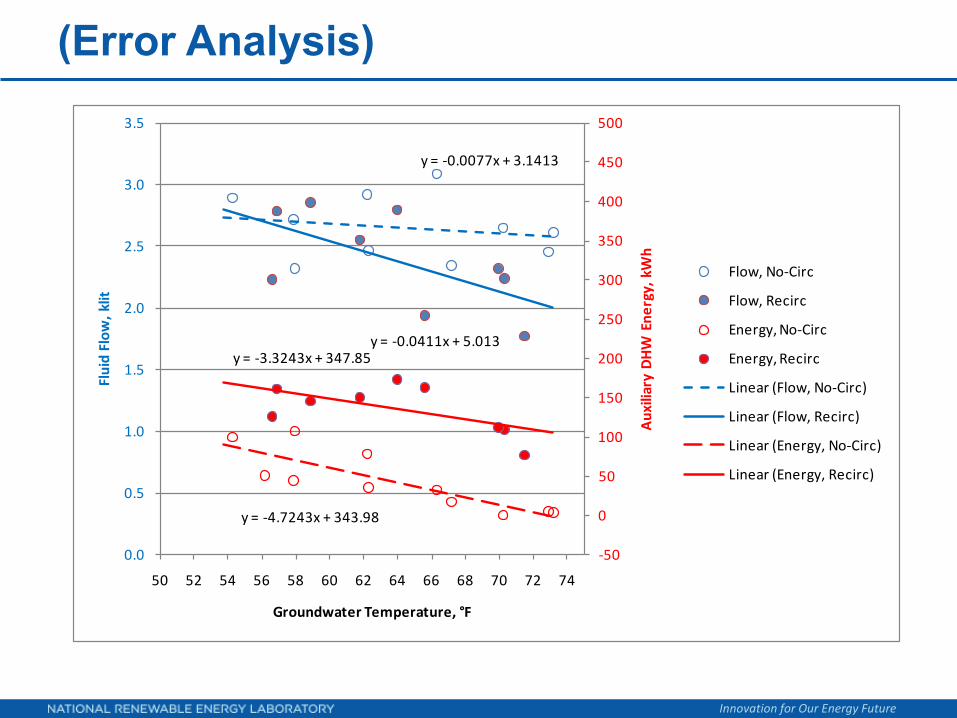
(Error Analysis)
y = -0.0077x + 3.1413
y = -0.0411x + 5.013
y = -4.7243x + 343.98
y = -3.3243x + 347.85
-50
0
50
100
150
200
250
300
350
400
450
500
0.0
0.5
1.0
1.5
2.0
2.5
3.0
3.5
50 52 54 56 58 60 62 64 66 68 70 72 74
Aux
iliar
y D
HW
Ene
rgy,
kW
h
Flui
d Fl
ow, k
lit
Groundwater Temperature, °F
Flow, No-Circ
Flow, Recirc
Energy, No-Circ
Energy, Recirc
Linear (Flow, No-Circ)
Linear (Flow, Recirc)
Linear (Energy, No-Circ)
Linear (Energy, Recirc)

![· [4] DHW PRODUCTION/STORAGE TANKS MODELS CAPACITIES DHW / TOTAL (l.) STAINLESS STEEL MATERIAL STANDARD DHW PRODUCTION TYPE/SYSTEM OPTIONAL DHW PRODUCTION SYSTEM STAINLESS STEEL](https://img.dokumen.tips/doc/110x75/5f5c613d17a42d66c03c4e61/4-dhw-productionstorage-tanks-models-capacities-dhw-total-l-stainless-steel.jpg)