Embed Size (px)
Citation preview
GeoCanada 2010 – Working with the Earth 1
Field scale static reservoir modeling workflow for a Steam Assisted Gravity Drainage (SAGD) Project in the Athabasca Oil Sands, NE Alberta, Canada Sorin Bujor MEG Energy, Calgary, Alberta, Canada [email protected]
and
Damien Thenin* Boyd PetroSearch, Calgary, Alberta, Canada [email protected]
and
Ian Perry MEG Energy, Calgary, Alberta, Canada [email protected]
Summary Three dimensional reservoir modeling plays an important role in the exploration and development phases of many fields in the Athabasca Oil Sands of northeastern Alberta. Reservoir models are used for optimizing reservoir delineation, horizontal well placement and field management.
This case study will present the initial reservoir modeling workflow designed for a Steam Assisted Gravity Drainage (SAGD) project, and how it evolved into a best practice workflow based on feedbacks from the asset team. Learning from the different modeling techniques tested will be discussed.
Introduction The Athabasca Oil Sands of northeastern Alberta are thought to contain nearly 1.4 trillion barrels of bitumen. The majority of this resource is contained within the lower Cretaceous McMurray Formation. The McMurray Formation consists of a complex succession of unconsolidated sand and mud deposited in fluvial to marginal marine environments. Deposition was strongly influenced by paleovalleys that were eroded into underlying Devonian carbonates. McMurray sands are variably saturated with saline water, bitumen and natural gas. Reservoir sands typically have bitumen saturations in excess of 75%, in situ porosity greater than 30% and absolute permeability greater than 3 Darcies. In situ bitumen viscosities in excess of 1,000,000 cp require the use of thermal extraction processes such as SAGD.
The stratigraphic complexity of the McMurray Formation makes it very important to develop an in-depth understanding of the spatial distribution of lithofacies and associated reservoir parameters. This is done in a three dimensional reservoir model which is further used for optimizing reservoir delineation, horizontal well placement and field management. Reservoir models also form the foundation for dynamic modeling to quantify future production performance using SAGD.
Method Drill cores, high-resolution conventional petrophysical logs and borehole images were used to determine lithofacies logs for all vertical delineation wells. Petrophysical analysis was performed for all existing vertical wells for resolving Vclay, porosity, permeability and water saturation.
GeoCanada 2010 – Working with the Earth 2
Bedding and other sedimentary structures from image logs helped guide sand body orientation and geometry.
Several scenarios were tested to define the best lithofacies modeling approach by using various combinations of well data and seismic attributes. The scenarios were using either a stochastic or deterministic method, or a combination of both. One hundred stochastic realizations of the lithofacies were generated for each scenario. Local and global uncertainties on lithofacies parameters were computed and used to rank realizations and scenarios.
Petrophysical parameters were stochastically simulated by lithofacies for each realization of the best scenario. Local and global uncertainties on reservoir parameters and volumetrics were computed. The one hundred realizations were ranked using the connected hydrocarbon volume weighted by permeability for a dynamic modeling study.
Using the best scenario, a series of models based on reduced numbers of delineation wells were created to test the predictive capability of the reservoir model. This will help plan and optimize delineation well programs for other projects in the earlier stages of field development.
Examples The modeled area covers nine sections. Ninety six wells with stratigraphic markers are available within this area, including ninety three with facies description and petrophysical logs.
Structural model The stratigraphic zone of interest is the McMurray formation. The top McMurray cannot be mapped on seismic. Therefore the top of the upper formation (Wabiskaw) was seismically mapped, then converted to depth. The top McMurray was then mapped using an isopach from the well markers with the top Wabiskaw as reference. The top Devonian was interpreted from seismic and converted to depth.
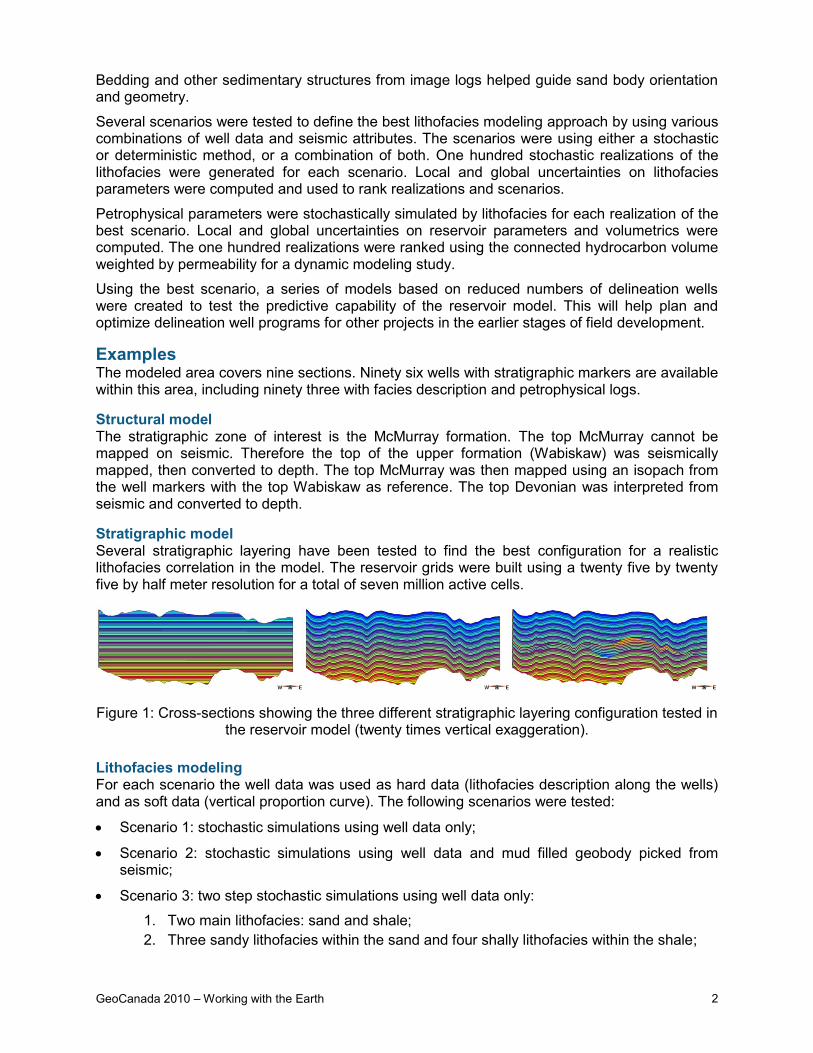
Stratigraphic model Several stratigraphic layering have been tested to find the best configuration for a realistic lithofacies correlation in the model. The reservoir grids were built using a twenty five by twenty five by half meter resolution for a total of seven million active cells.
Figure 1: Cross-sections showing the three different stratigraphic layering configuration tested in the reservoir model (twenty times vertical exaggeration).
Lithofacies modeling For each scenario the well data was used as hard data (lithofacies description along the wells) and as soft data (vertical proportion curve). The following scenarios were tested:
Scenario 1: stochastic simulations using well data only;
Scenario 2: stochastic simulations using well data and mud filled geobody picked from seismic;
Scenario 3: two step stochastic simulations using well data only:
1. Two main lithofacies: sand and shale;
2. Three sandy lithofacies within the sand and four shally lithofacies within the shale;
GeoCanada 2010 – Working with the Earth 3
Scenario 4: stochastic simulations using well data and seismic isochrone to guide the sand distribution;
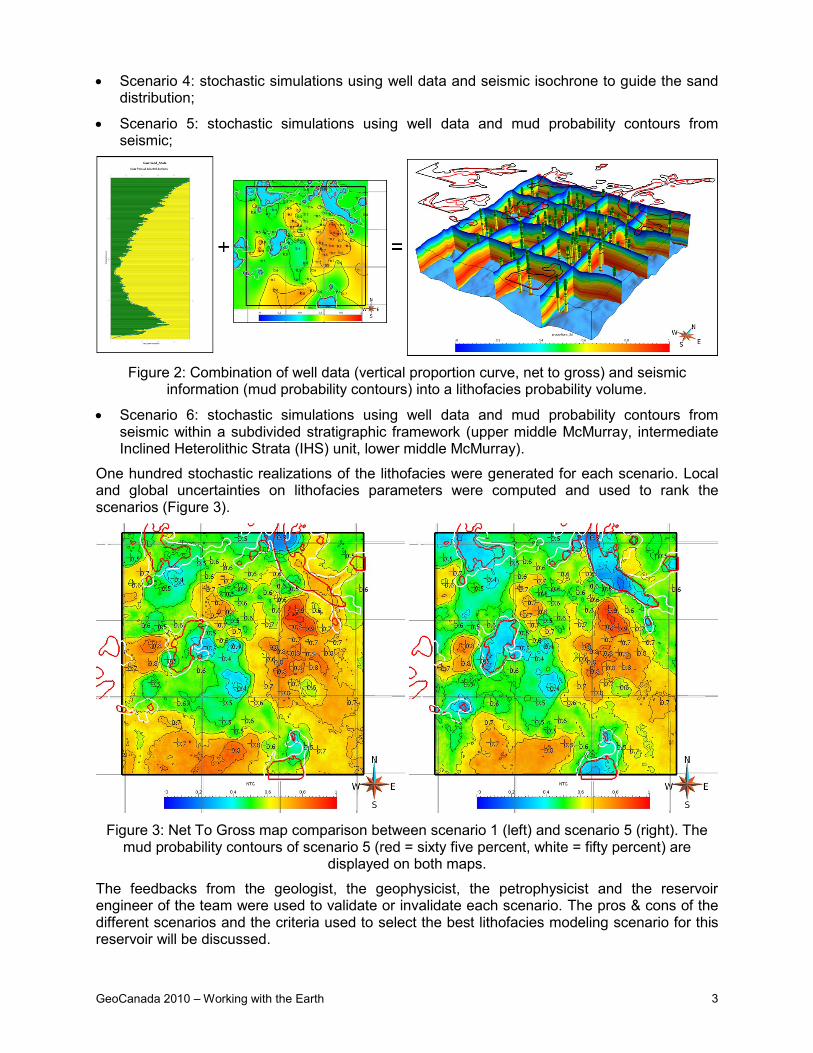
Scenario 5: stochastic simulations using well data and mud probability contours from seismic;
Figure 2: Combination of well data (vertical proportion curve, net to gross) and seismic information (mud probability contours) into a lithofacies probability volume.
Scenario 6: stochastic simulations using well data and mud probability contours from seismic within a subdivided stratigraphic framework (upper middle McMurray, intermediate Inclined Heterolithic Strata (IHS) unit, lower middle McMurray).
One hundred stochastic realizations of the lithofacies were generated for each scenario. Local and global uncertainties on lithofacies parameters were computed and used to rank the scenarios (Figure 3).
Figure 3: Net To Gross map comparison between scenario 1 (left) and scenario 5 (right). The mud probability contours of scenario 5 (red = sixty five percent, white = fifty percent) are
displayed on both maps.
The feedbacks from the geologist, the geophysicist, the petrophysicist and the reservoir engineer of the team were used to validate or invalidate each scenario. The pros & cons of the different scenarios and the criteria used to select the best lithofacies modeling scenario for this reservoir will be discussed.
GeoCanada 2010 – Working with the Earth 4
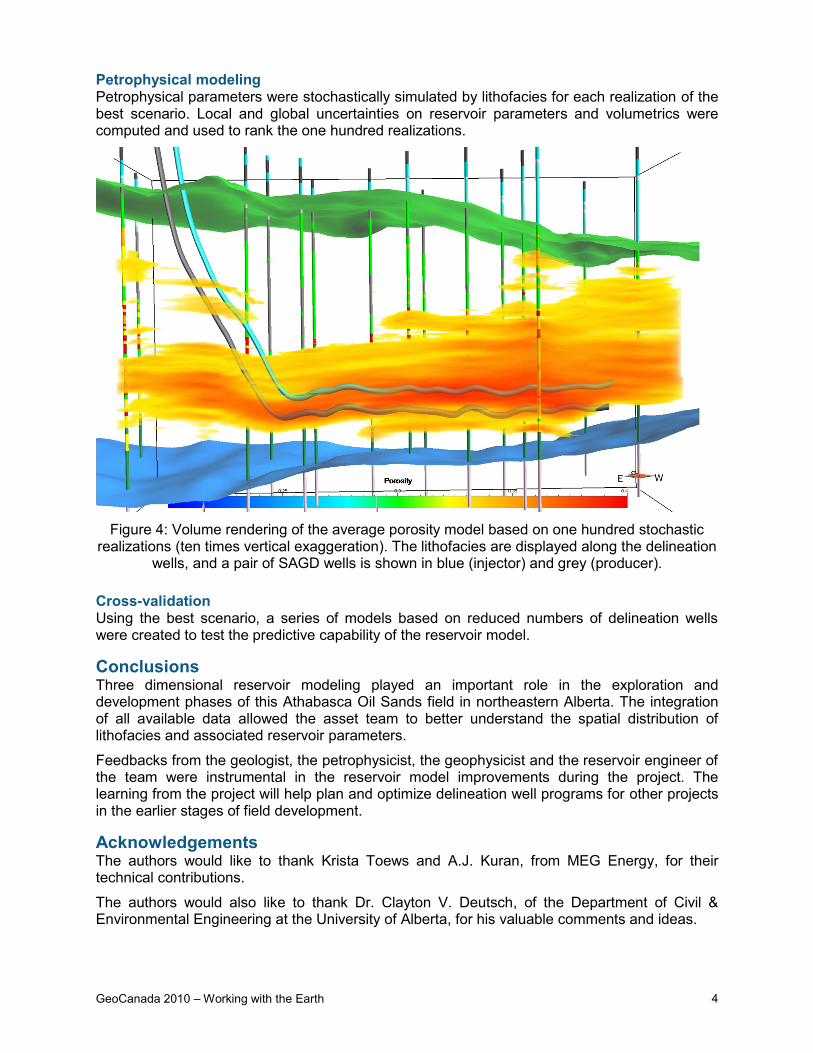
Petrophysical modeling Petrophysical parameters were stochastically simulated by lithofacies for each realization of the best scenario. Local and global uncertainties on reservoir parameters and volumetrics were computed and used to rank the one hundred realizations.
Figure 4: Volume rendering of the average porosity model based on one hundred stochastic realizations (ten times vertical exaggeration). The lithofacies are displayed along the delineation
wells, and a pair of SAGD wells is shown in blue (injector) and grey (producer).
Cross-validation Using the best scenario, a series of models based on reduced numbers of delineation wells were created to test the predictive capability of the reservoir model.
Conclusions Three dimensional reservoir modeling played an important role in the exploration and development phases of this Athabasca Oil Sands field in northeastern Alberta. The integration of all available data allowed the asset team to better understand the spatial distribution of lithofacies and associated reservoir parameters.
Feedbacks from the geologist, the petrophysicist, the geophysicist and the reservoir engineer of the team were instrumental in the reservoir model improvements during the project. The learning from the project will help plan and optimize delineation well programs for other projects in the earlier stages of field development.
Acknowledgements The authors would like to thank Krista Toews and A.J. Kuran, from MEG Energy, for their technical contributions.
The authors would also like to thank Dr. Clayton V. Deutsch, of the Department of Civil & Environmental Engineering at the University of Alberta, for his valuable comments and ideas.