Embed Size (px)
Citation preview
Field behaviour of driven Pre-stressed High-strength Concrete piles in sandy soils 1
2
ZX Yang1, WB Guo2, FS Zha3, RJ Jardine4, CJ Xu5, YQ Cai6 3
4
Abstract 5
Driven piles are used widely both offshore and onshore. However, accurate axial capacity 6
and load-displacement prediction is difficult at sand dominated sites and offshore practice is 7
moving towards Cone Penetration Test (CPT) based design methods developed from 8
instrumented pile research and database studies. However, onshore use of these methods 9
remains limited; there is a paucity of high quality case-histories to assess their potential 10
benefits clearly and application in layered profiles may be uncertain. This paper presents 11
new tests on Pre-stressed Concrete (PHC) pipe-piles driven in sands for a major new Yangtze 12
River bridge project in China, assessing the performance of the ‘new CPT’ and conventional 13
capacity approaches, considering the influence of weak sub-layers on base resistance and 14
noting the marked changes in shaft capacity that apply over time. 15
Keywords: PHC driven pile; cone penetration test; onshore; sand; capacity; layered profile; 16
time effect and aging 17
Introduction 18
Large driven piles are often used to support long-span bridges, port facilities or offshore 19
platforms and wind turbines. While steel pipe piles dominate offshore, Pre-stressed 20
High-strength Concrete (PHC) piles are used widely in China for high-rise buildings, river 21
1Associate Professor, Research Centre of Coastal and Urban Geotechnical Engineering, Dept. of Civil Engineering, Zhejiang University, China, [email protected] 2PhD student, Dept. of Civil Engineering, Zhejiang University, China, [email protected] 3Professor, School of Recourses and Environmental Engineering, Hefei University of Technology, China,
[email protected] 4Professor, Dept. of Civil and Environmental Engineering, Imperial College, UK, [email protected] 5Professor, School of Civil Engineering and Architecture, East China Jiaotong University, Nanchang, China; Dept. of Civil Engineering, Zhejiang University, China, [email protected] 6Professor, Research Centre of Coastal and Urban Geotechnical Engineering, Dept. of Civil Engineering, Zhejiang University, China, [email protected]

crossings, high-speed railways, ports and piers. PHC piles are normally pre-cast open-ended 22
cylinders with outside diameters of 300-1000mm and 70-130mm wall thicknesses that are 23
assembled on-site by welding circumferential steel connection plates. Installation usually 24
involves driving or jacking; a vibration and pre-drilling has also been utilized. 25
Most international offshore projects apply API RP2GEO (2014) or the equivalent ISO design 26
recommendations. While the API and ISO methods are employed internationally for some 27
major bridge and harbor projects, local technical foundation specifications apply more 28
frequently in onshore work and JGJ 94-2008 (CABR2008) is the most common design rule for 29
large structures in China. Pile load tests are often called for as conventional design methods 30
are known to be subject to relatively poor reliability and potential bias (Briaud and Tucker 31
1988). However, such tests are usually unfeasible in offshore projects. Rigorous database 32
studies show that measured driven pile test capacities (Qm) can vary very significantly from 33
those expected from calculation (Qc), especially for piles driven in sands. For example, Chow 34
(1997), Kolk et al. (2005), Jardine et al. (2005) and Schneider et al. (2008) all found that 35
compressive capacity predictions made with the industry-standard ‘Main text’ API (2014) 36
approach are subject to overall CoVs in Qc/Qm of 0.60 to 0.88. The latter two studies 37
explored the degrees of bias found with respect to the pile Diameter D, slenderness L/D, and 38
the average relative densities (Dr) applying over the shafts and tips. They showed that the 39
API ‘Main Text’ method gives least scatter and Qc/Qm closest to unity in cases with 40
40≤L/D≤65, 35%≤Dr≤65% and 0.4m≤D≤0.8m. When all other factors are held constant, the 41
shaft resistance expression tends to become non-conservative with: higher L/D ratios, looser 42
sands and in tension. Base resistance can also be over-predicted when D≥0.8m. The 43

opposite trend applies in denser sands in cases that fall below the above L/D and Diameter 44
lower bounds. Williams et al (1997), Jardine et al (2005) and Overy (2007) report case 45
histories where the Main Text approach led to Qc/Qm values ranging from 0.4 to 2.9. Jardine 46
and Chow (2007) discussed how such discrepancies could be reconciled with the low 47
incidence of reported offshore foundation failures, concluding that unanticipated beneficial 48
effects of time on shaft resistance contributed to the perception of satisfactory performance, 49
along with the sand and pile conditions typically encountered offshore. The present lack of 50
offshore pile monitoring that could detect the axial movements (of perhaps ≈D/100) at 51
which shaft failure can develop is also relevant. 52
Instrumented field and model instrumented piles (Lehane et al. 1993, Chow 1997, Gavin and 53
Lehane 2003, Yang et al. 2010, Jardine et al. 2013a and 2013b, Yang et al. 2014) offer new 54
insights into the fundamental behavior of driven piles and the basis for simple design 55
methods that capture more faithfully the stress conditions developed by driving, the 56
fundamental shaft failure mechanisms and the key factors that govern base resistance. API 57
RP2GEO (2014) recognizes its Main Text approach’s limitations and the potential of four 58
alternative CPT-based methods set out in its commentary from: Fugro-05 (Kolk et al. 2005), 59
Imperial College London (ICP-05, Jardine et al 2005, albeit in a ‘simplified form’), Norwegian 60
Geotechnical Institute (NGI-05, Clausen et al 2005), and University of Western Australia 61
(UWA-05, Lehane et al 2005). Crucial to all is recognition that end bearing and shaft 62
resistances are more sensitive than expected to local variations in sand state, which they 63
capture through CPT profiling. The new methods also: (i) address explicitly the previously 64
unrecognized dependence of the radial stresses developed on the pile shaft at any given 65
level on the relative depth h of the pile tip and (ii) give closer attention to the effect of tip 66
geometry on base capacity. A comprehensive assessment by Schneider et al. (2008) showed 67
the ‘CPT’ approaches giving lower Qc/Qm CoVs than the API Main Text treatment. The 68
UWA-05 and ICP-05 methods offered the best overall reliability, with mean Qc/Qm close to 69
unity and CoV values below 30%. While API RP2GEO (2014) remarks on the CPT methods’ 70
limited historical use, the ICP-05 has now developed a significant track-record: see for 71
example Williams et al (1997), Overy (2007) or Merritt et al (2012). 72
The international pile test databases include surprisingly few high quality tests to failure on 73
large pipe-piles driven in sand at sites with full CPT profiles. For example, the well-known 74
French LCPC/IFSTTAR dataset (Bustamante and Gianeselli 1982, Frank and Burlon 2012) 75
contains no such entry. The most comprehensive sets appear to be those assembled by 76
Jardine et al (2005) and Schneider et al (2008) which include over 100 different piles driven 77
in silica sand and tested to failure. However, only 11 piles tested at just three sites were 78
open-ended, had D≥600mm and full CPT profiles. No concrete pipe pile and only two Asian 79
test sites were included. Further tests are required to (i) augment this sparse dataset, (ii) 80
address uncertainty over end bearing in layered strata, (iii) assess whether the CPT methods 81
apply to concrete piles and silty sands and (iv) give further insight into the effects of pile age 82
on capacity as reported by Jardine et al (2006) and Gavin et al (2013). This paper contributes 83
as part of an on-going Zhejiang University/Imperial College London database project four 84
new good quality static loading tests conducted to failure at three Chinese sites with full CPT 85
profiles. 86
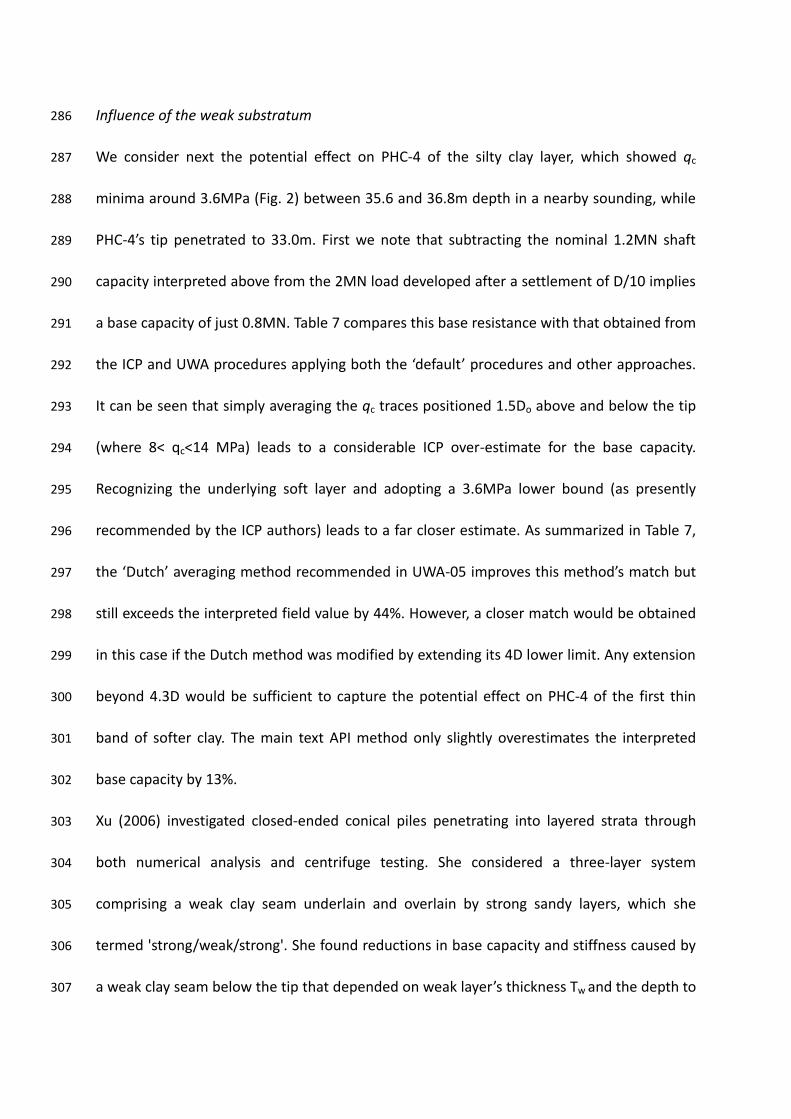
The test piles were driven to either side of the Second Wuhu Bridge crossing of the Yangtze 87
River in Anhui Province, China, 100 km SE of Hefei. The bridge will be ≈14km long and its 88
central cable-stayed steel box girder bridge spans 1,622m. Driven PHC piles are used to 89
support the many approach piers driven on both sides of the river into Quaternary, mainly 90
sand, alluvium transported from weathered rock colluvium eroded from upstream locations. 91
We focus first on piles PHC-1 to 3 that have sand-dominated profiles and were tested 92
statically 13 to 15 days after driving. Attention is then turned to an ‘untypical’ pile PHC-4 93
that was (i) driven to a final penetration underlain at modest depth by a clay layer and (ii) 94
tested at a relatively young ‘age’, 5 days after driving. We acknowledge that adding strain 95
gages or conducting tension tests would have helped separate the shaft and base resistances. 96
However, even when this is possible, great care is required to address ‘gage-drift’ after 97
driving as well as temperature and radial stress cross-sensitivity effects. A carefully designed 98
study of aging trends would also have been helpful. Nevertheless, the tests conducted 99
provide clear outcomes concerning the axial capacity assessment, pile-soil stiffness, pile age 100
and the importance of accounting for weak substrata when predicting base resistance. 101
Pile details and test ground conditions 102
Piles PHC-1, PHC-3 and PHC-4 outer diameters D=600mm while that for PHC-2 was 800mm. 103
All had a uniform wall thickness t=130mm, were formed from grade C80 concrete 104
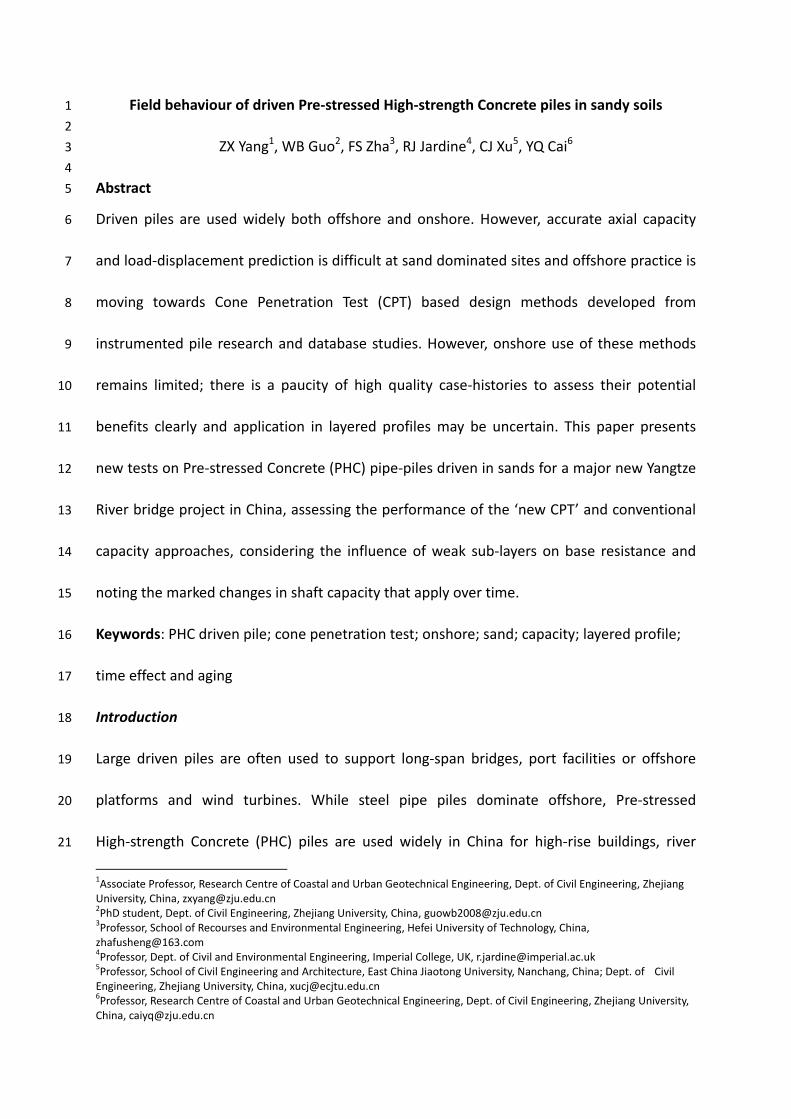
(reinforced to give section moduli, EA of 7,300 and 10,400 MN respectively) and were driven 105
by a 10.3T drop-hammer employing a drop height of 1.8 m. No pile toe modification was 106
used to aid driving. Table 1 summarizes the pile make-up, dimensions and driving details, 107
while Fig. 1 shows the bridge and test pile layout at sites K34 (PHC-1, south-east of the River), 108
K27 (PHC-2 seven km to the north-west) and K24+500 (PHC-3 and 4, 2.5 km north-west from 109
K27) where subsurface conditions comprise mainly silty and fine sands, with thin agricultural 110
soil over muddy silty clay in the top 0 to 4m. The ground water tables were all relatively 111
close to ground level. Site K24+500 also presented a thin layer of silty clay between ≈35 and 112
36m depth. Cone penetration tests (CPT) were performed at each test site, and their cone 113
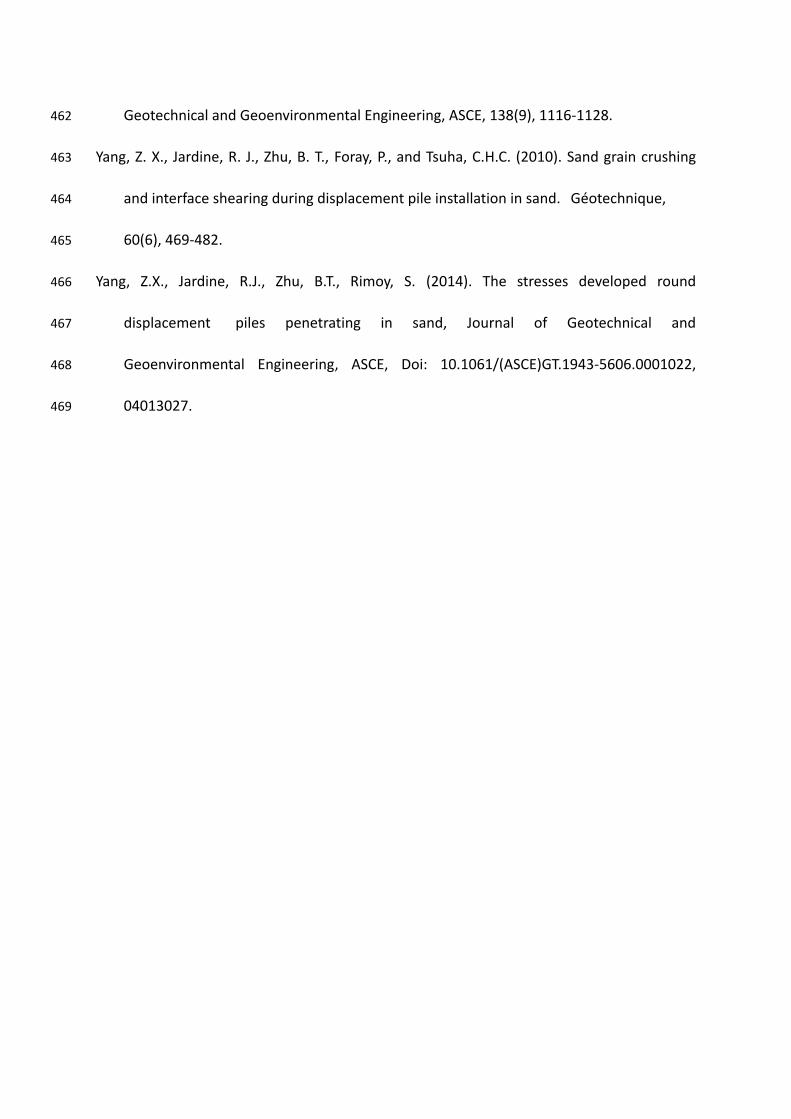
resistance qc and are compared directly in Fig 2a). Site K24+500 has the ‘loosest’ profile and 114
K34 the ‘densest’. Figure 2b) presents relative density Dr profiles derived from CPT qc profiles 115
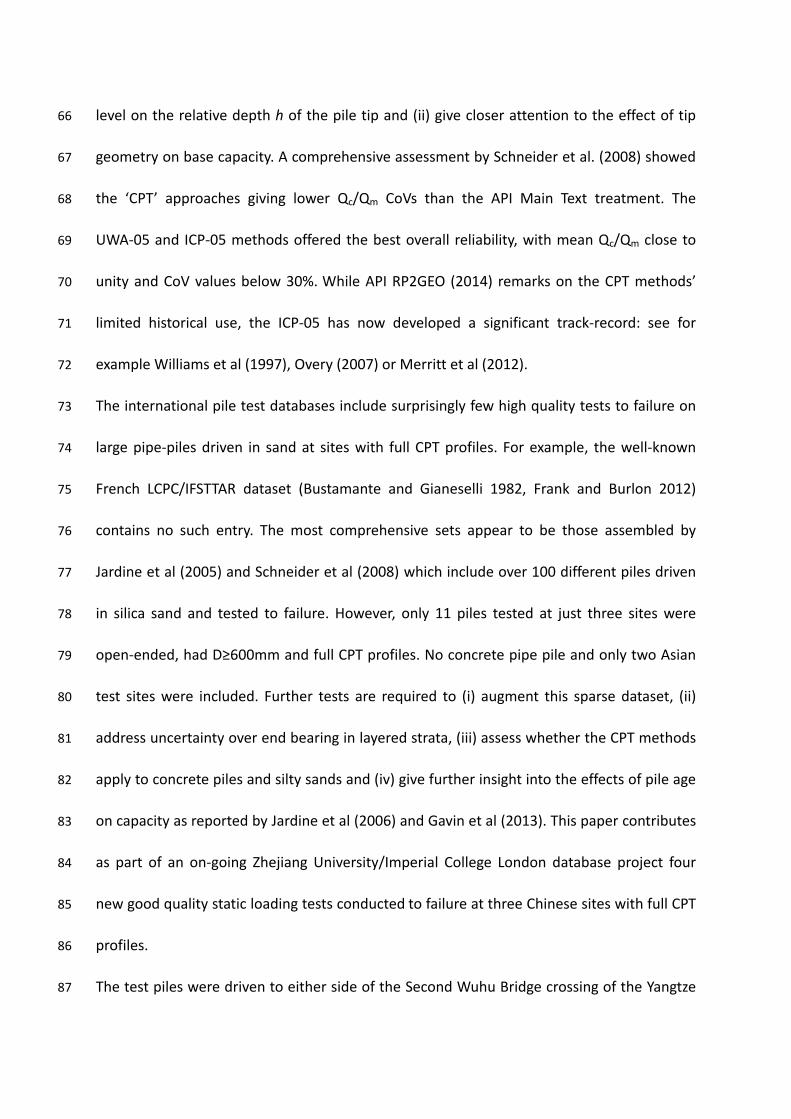
by the Jamiolkowski et al. (2003) expressions; broadly similar profiles are obtained in this 116
case if one adopts the earlier Baldi et al (1986) expressions. We interpret the thin layers 117
appearing to show Dr≤20% as comprising silts or clays. Site investigations indicated saturated 118
unit weights of 19-20kN/m3 for the sands and ≈16 kN/m3 for the clays. Figure 3 shows the 119
spread of soil grading curves. The mean D50 values of the silty and fine sands are 0.15 mm 120
and 0.18 mm, respectively, while the <0.075mm fines fraction is 23-31% for the silty sand 121
and 8-10% for the fine sand. Direct shear tests on the silty sand and fine sands show 122
26o≤φ′≤29o, assuming zero c′. No site-specific interface tests were available. However, 123
ring-shear experiments reported by Barmpopoulos et al (2009) involving a wide range of 124
clean silica sands and concrete indicate large-displacement interface shear resistance angles 125
that depend on the pile roughness-to-soil D50 ratio and indicate for these piles a critical state 126
δ'cv= 29o that coincidentally matches the value proposed for steel piles in Fugro-05 and 127
UWA-05. 128
Static load test 129
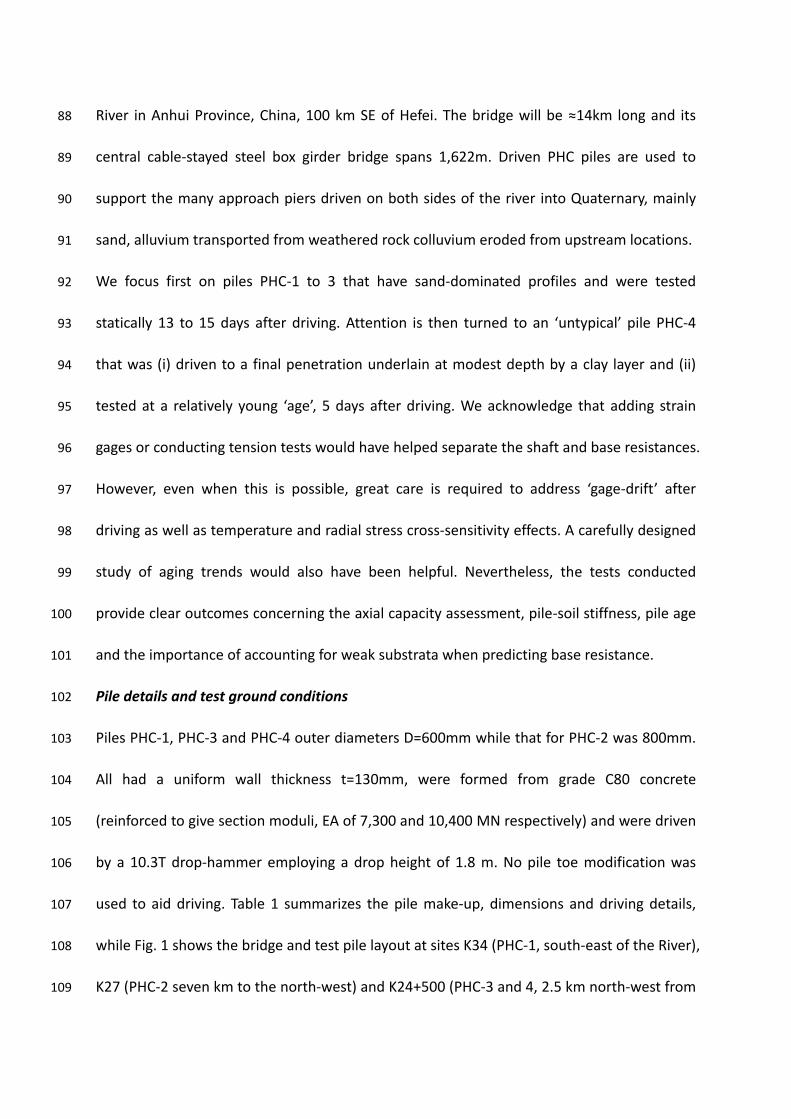
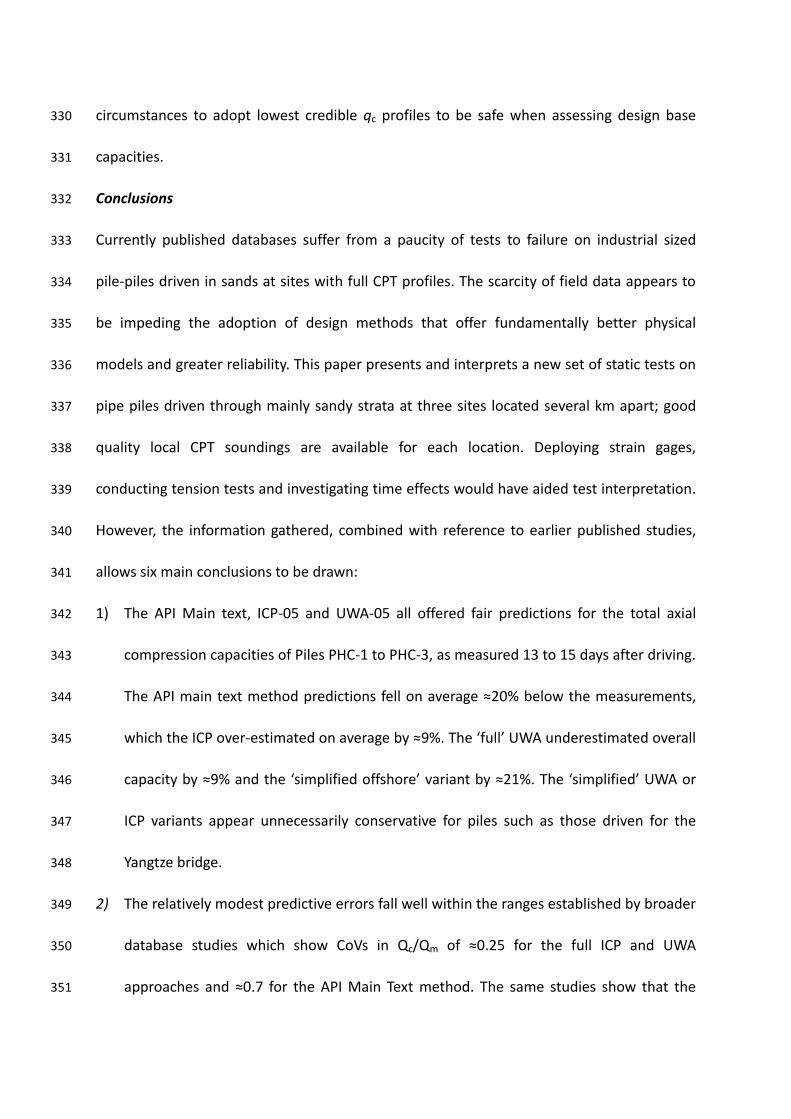
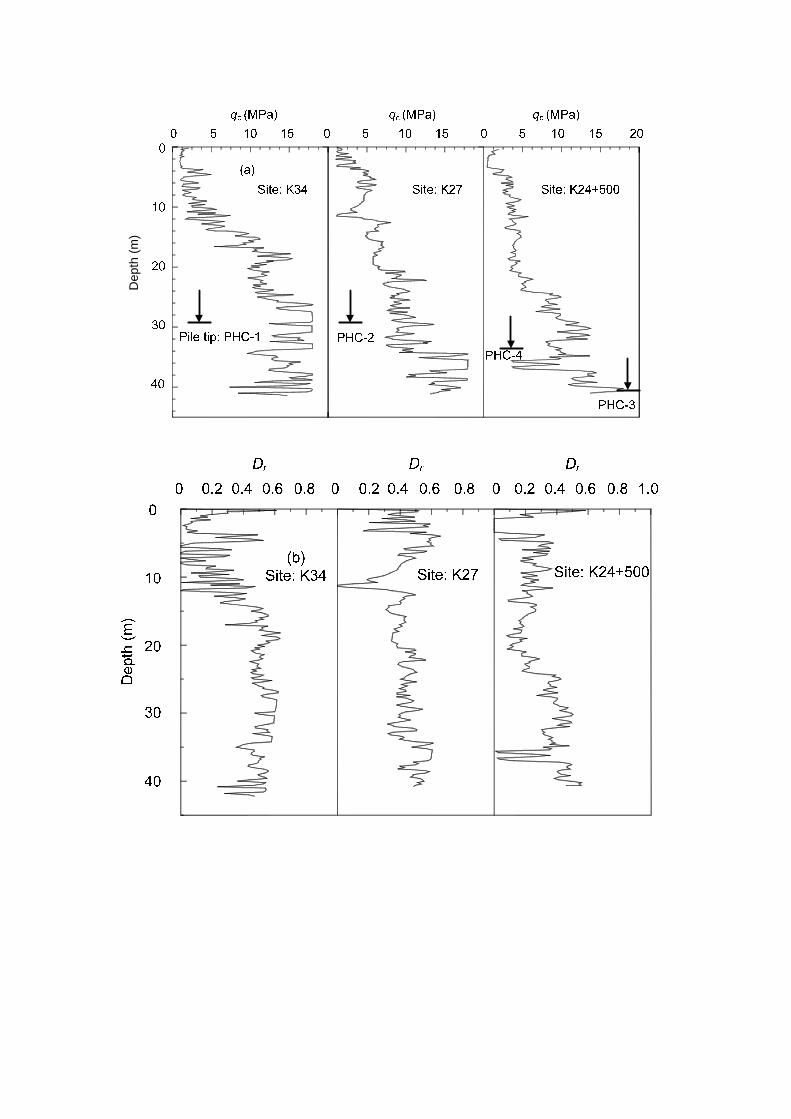
Two phases of multiple tests were conducted on the bridge’s PHC piles. We consider only 130
the four PHC pipe-piles driven in dominantly sandy soils for which nearby high quality CPT 131

tests are available. As listed in Table 1, PHC-1, 2 and 4 were installed and tested in Phase I 132
while PHC-3 was added in Phase II after PHC-4 gave disappointing results. Table 1, Fig. 4a) 133
and Fig. 4b) summarizes how driving progressed with penetration depth. No measurements 134
were made of the sand plug. However, the UWA-05 methodology described later predicts 135
final Incremental Filling Ratios (IFRs) between 74 and 82% for all piles. 136
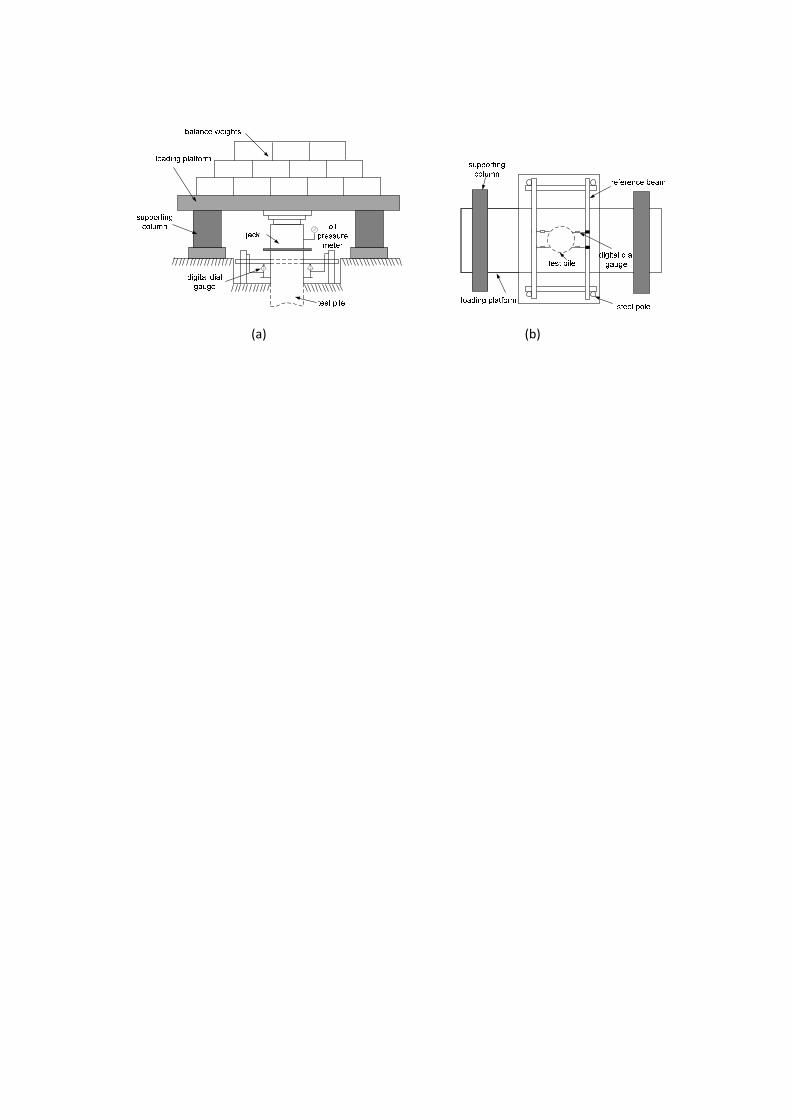
The load tests employed the arrangements shown in Fig. 5. It is likely that any untested piles’ 137
shaft resistances would have grown considerably in the weeks and months that followed 138
driving; see Jardine et al (2006). The reported static tests on PHC-1 to 3 followed 13 to 15 139
days after driving, with the automated hydraulic loading system reacting against large 140
concrete kentledge masses. The loads were measured through the hydraulic oil pressure 141
system and the displacements monitored by four digital dial gauges fixed to reference beams 142
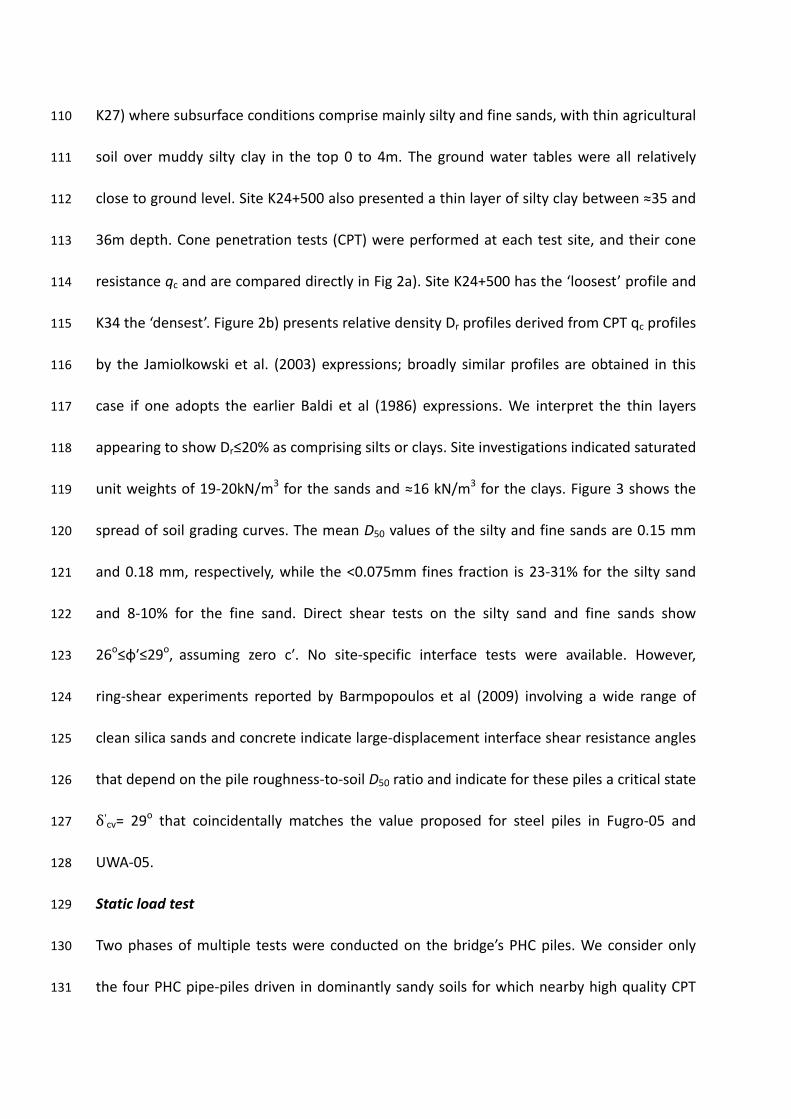
supported by steel poles driven at some distances away from the loading platform. The first 143
load increment was 1200 kN, while the subsequent increments were each 600 kN. Load 144
steps were applied each hour until abrupt increases were seen in pile head displacement. 145
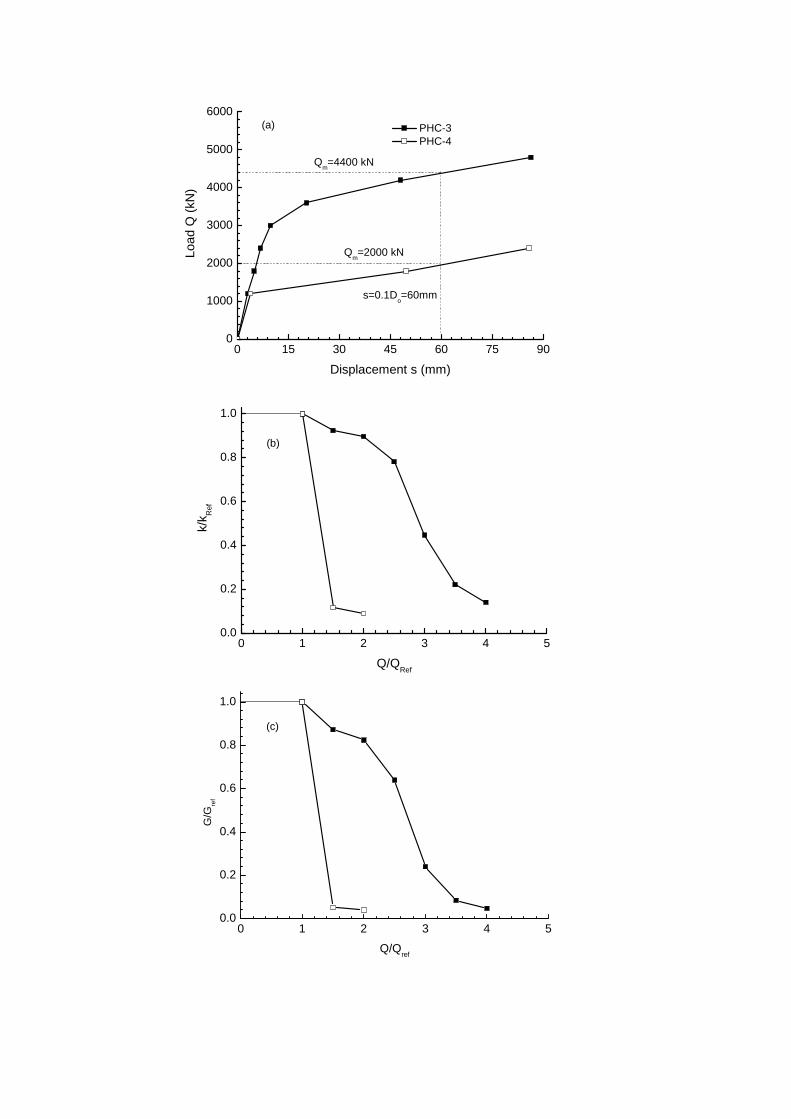
The complete load-displacement curves for piles PHC-1, PHC-2 and PHC-3, are given in Fig. 6, 146
which identifies the overall resistance developed after displacements s=0.1D. Tables 1 to 2 147
summarize the pile configurations and load test outcomes. The larger diameter of PHC-2 148
contributed to it having the largest capacity. PHC-3 was driven to the greatest depth (in 149
Phase II) because PHC-4 had developed (in Phase I) a far lower capacity than PHC-1 or 2, 150
whose site conditions and pile lengths had been thought comparable. Following Fleming et 151
al (2009), indicative ‘shaft-yield’ loads are listed at which settlements reached D/100 and 152
may correspond approximately to the stages where peak shaft resistances were mobilized. 153

We discuss later how strata, penetration depth and age may have affected the anomalous 154
test on PHC-4. 155
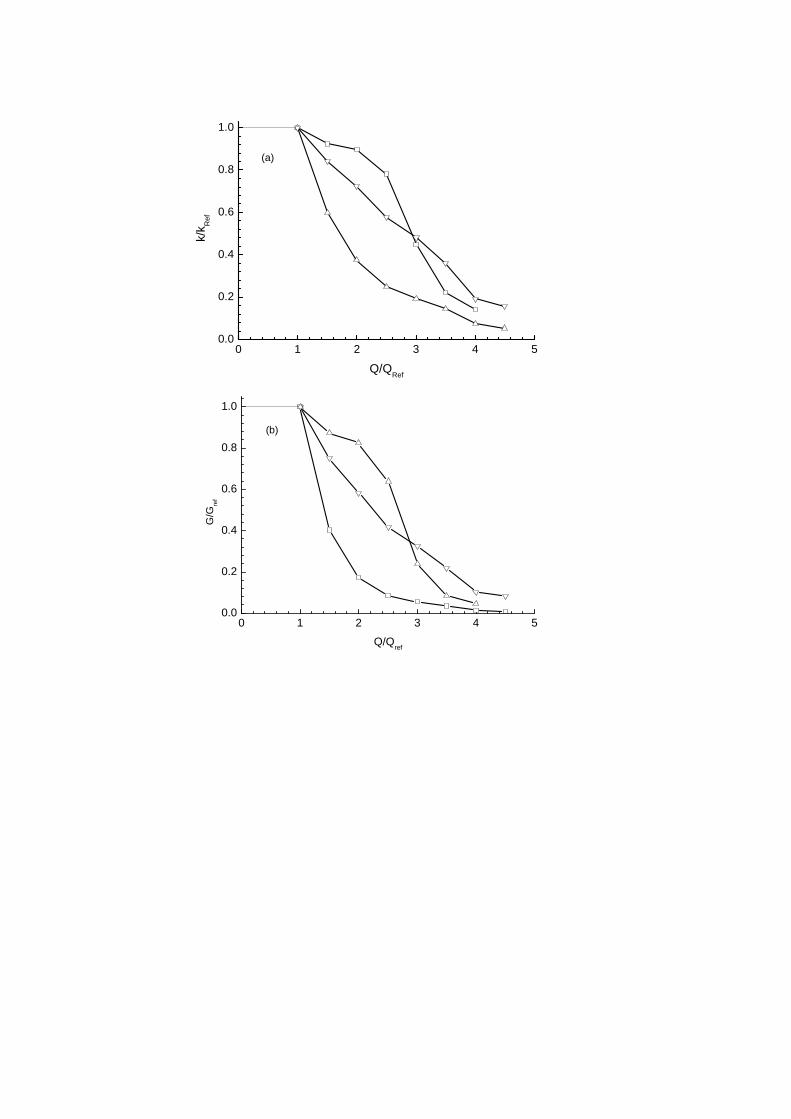
Piles PHC-1 to 3 exhibited both broadly similar load-displacement responses, as shown in Fig. 156
6). Table 3 lists initial secant pile head stiffness initial values kRef = ΔQ/Δs determined for 157
each pile from the first 1200 kN load increment applied (QRef), while Fig. 7a) demonstrates 158
their subsequently steeply non-linear stiffness trends in normalized k/kRef - Q/QRef plots. Also 159
listed in Table 3 are initial sand shear stiffness GRef values found for the mid-pile depth 160
position (under QRef) by applying the Randolph (1977) analysis for compressible piles in 161
elastic soils. While stiffness was assumed to be proportional to depth, checks made 162
assuming uniform conditions show only marginally (≤10%) lower G values. Overall, PHC-1 163
shows the highest GRef and kRef values, reflecting perhaps its generally ‘denser’ shaft CPT 164
profile. However, this pile also shows the steepest decay of normalized k with load in Fig. 7a). 165
The same trend is clear in Fig. 7b), which reveals how secant G/GRef ratios (found elastic 166
analysis of each load step) degraded with Q/QRef. 167
Randolph (1977) also derived from his elastic analysis expressions for the shaft-to-base load 168
split and Table 3 applies these to the listed nominal ‘shaft yield’ points, indicating that only 1 169
to 6% of the total loads mobilized at s=D/100 went to the bases. These estimates led to the 170
nominal shaft capacity Qs estimates listed in Table 3. Assuming that shaft failure is ductile, as 171
found in highly instrumented tests by Lehane et al (1993) and Chow (1997), allowed nominal 172
base capacities Qb to be assessed for the s=D/10 stages by deducting the indicative Qs values 173
from the total measured loads. We acknowledge that the base-to-shaft split is highly 174
approximate: elastic analyses cannot be expected to be accurate for large piles in non-linear 175
soils: see Jardine et al (1986). The base and shaft capacities could have been separated more 176
securely if strain gages had been installed, or tension tests conducted. 177
Capacity prediction 178
The PHC pile parameters listed in Tables 1 and 4 all fall within the ranges 36<L/D<66, 179
33%<mean Dr<65% and 0.6m<D<0.8m. As mentioned earlier, independent database studies 180
indicate that the two CPT methods and API Main text approach should give broadly 181
satisfactory medium-term total capacity predictions within these ranges. The API scheme 182
assumes that local shaft and base resistances grow in proportion with the free field vertical 183
effective stress (σ'vo) and are relatively insensitive to changes in sand state with depth. It 184
does not recognize any relative pile tip depth dependency of shaft resistance but specifies 185
upper limits to the unit shaft and base resistances. The ICP-05 and UWA-05 methods 186
consider other factors that influence the radial stresses acting on the pile shaft and 187
consequently the capacity of the pile, including the local qc values, the relative height (h) of 188
any point on the shaft above the tip, the pile end conditions and the free-field vertical 189
effective stress. 190
None of the methods includes an explicit time allowance. While age is known to affect shaft 191
capacity strongly, the early rates of capacity growth after driving are not fully clear. The 192
average age after driving within the database against which the ICP was tested was 25 days. 193
However, the ICP capacity was available at an earlier stage (after ≈10 days) in field ageing 194
tests by Jardine et al (2006) and slightly faster shaft capacity growth was reported over the 195
first 12 days after driving by Gavin et al (2013). 196
The static axial bearing capacity Qc of a pile under compression loading at a displacement of 197
0.1D is the sum of the shaft capacity Qs and base capacity Qb: 198
Qc=Qs+Qb=πD∫τfdz+qb,0.1Ab Eq. (1) 199
where D is the pile diameter; τf is the local ultimate shaft friction; z is depth; qb,0.1 is the end 200
bearing available after displacement by D/10 and Ab is the base area. Different qb,0.1 201
expressions apply in ICP-05 and UWA-05. For ICP-05, qb,0.1 is expressed as, 202
2,0.1 ,
2,0.1 ,
unplugged: [1 ( / ) ]
plugged: max[0.14 0.25log ,0.15,1 ( / ) ]
b c avg i o
b c avg o i o
q q D D
q q D D D
Eq. (2) 203
in which Do and Di are the outer and inner diameters and qc,avg is averaged (under routine 204
conditions) over an interval ±1.5D above and below the pile tip. However, Jardine et al (2005) 205
note that “the selection of appropriate qc values should account for the form of the CPT 206
traces. Because the postulated annular end bearing mechanism can develop over a relatively 207
short depth range of perhaps three pile wall thicknesses, the design value should reflect the 208
weakest sufficiently thick sub-layer within the soil unit in which the pile tip might credibly be 209
terminated. Equally, consideration should be given to the possibility of a more critical fully 210
plugged failure mode developing if a generally weaker layer exists within 8 pile diameters of 211
the expected final tip depth.” More recently, the ICP-05 authors have proposed that while 212
shaft resistance design assessments can be based on best estimate (average) qc profiles, a 213
lower bound profile should be adopted for base capacity. 214
With UWA-05, qb,0.1 is calculated by, 215
2,0.1 , [0.6 0.45( / ) IFR]b c avg i oq q D D Eq. (3) 216
where IFR is the incremental filling ratio, and qc,avg is evaluated by the Dutch technique, 217
which considers the qc profile over a greater depth range that the ICP. 218
The local ultimate shaft friction τf in Eq. (1) is calculated in ICP-05 as, 219

τf=[0.029qc(σ'vo/pA)0.13[max(h/R*,8)]-0.38+Δσ'rd]tanδf Eq. (4) 220
in which σ'vo is free-field vertical effective stress; pA is the atmospheric pressure; R* is the 221
equivalent pile radius; h is the relative height above the tip and δf is found from interface 222
ring shear tests or from correlations with mean grain size (D50); Δσ'rd the dilatant increase in 223
local radial stress during pile loading can be obtained by: 224
Δσ'rd=2GΔr/R Eq. (5) 225
where G is the operational shear modulus (estimated from correlations with CPT qc and σ'vo) 226
and Δr is the radial displacement related to pile shaft roughness, which is taken as 0.02mm 227
for industrial (lightly rusted) steel piles. With open piles an equivalent radius R* is used to 228
replace R is Eq. 4, calculated from the pile’s outer and inner radii (Ro and Ri) as R*=(Ro2-Ri
2)1/2. 229
UWA-05 employs a variant of Eq. (2) to calculate the local ultimate shaft friction, 230
τf=[0.03qcArs,eff0.3[max(h/2R,2)]-0.5+Δσ'rd]tanδf Eq. (6) 231
in which Ars,eff =1-IFR(Ri/R)2 is the effective area ratio. The UWA approach applies Eq. (5) to 232
estimate Δσ'rd but its different G-qc correlation function gives marginally different results. 233
It is necessary when applying the UWA method to specify the full IFR profile. The latter can 234
be measured on site and employed in hind-casts, but cannot be known in advance. UWA-05 235
offers Eq. 7 to estimate IFR in design predictions or hindcast analyses, where ΔLp is the 236
change in plug length and Δz is the change in penetration per blow. Lehane et al (2005) 237
propose that IFR should be set to unity and Δσ'rd to zero for offshore applications. 238
IFR=ΔLp/Δz=min[1,(Di(m)/1.5)0.2] Eq. (7) 239
As noted earlier, δf=δ'cv was taken as 29o for the ICP and UWA calculations (after 240
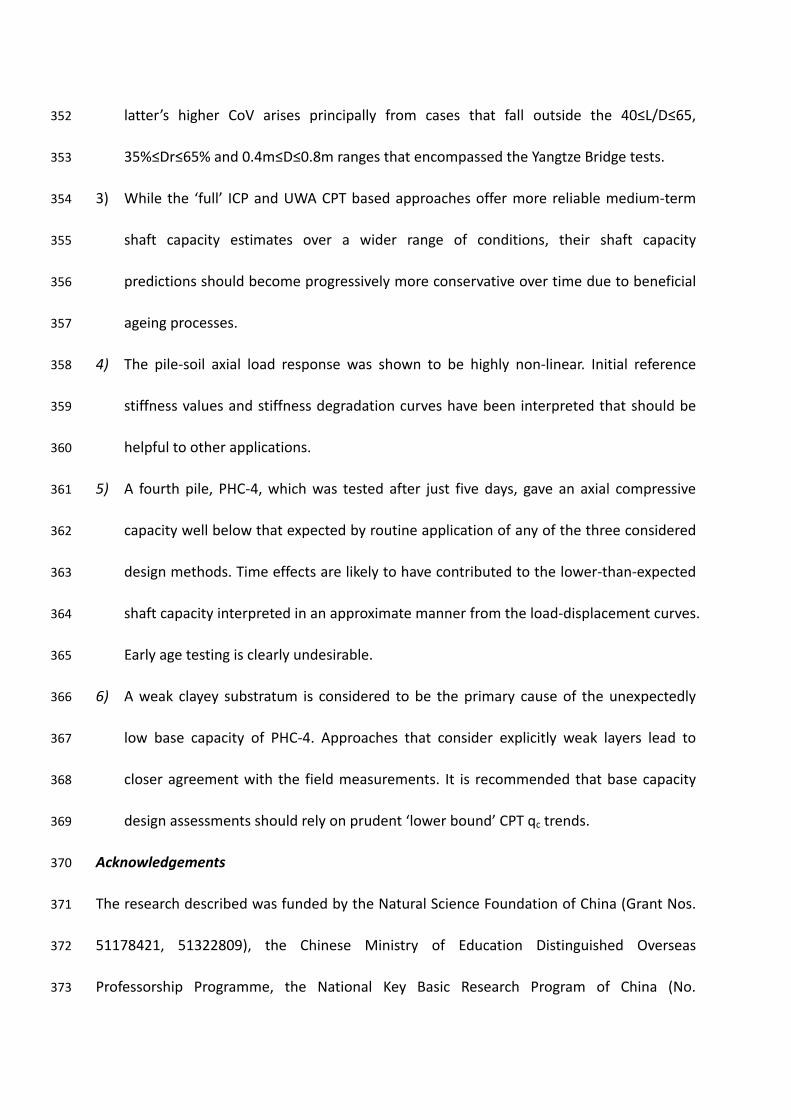
Barmpopoulos et al. 2009); Δr was also taken as 0.02mm (as with steel piles). Noting that 241
the three site profiles include some minor clay layers at shallow depth and that there is a 242
thin clay layer in K24+500, Lehane et al’s (2005) approximate estimate for local shaft 243
resistances τf≈ qc/35 was applied in any thin clay strata present over the shaft length, where 244
qc was the local cone resistance, with the that clay layers contributing <1% of shaft capacity. 245
Table 4 gives the tip qc values, the average qc,avg derived by the alternate procedures and the 246
relative densities adopted in assessing the capacities of these four piles. Table 5 summarizes 247
the calculations made for PHC-1 to PHC-3 using the API, full-ICP and UWA (both full and 248
offshore) methods. Noting the difficulties of separating the measured shaft and base 249
components, we consider the overall total Qc/Qm ratios. The average ratio for ICP-05 is 1.09, 250
while means of 0.91 and 0.79 apply to ‘full’ and ‘offshore’ UWA assessments; the API Main 251
Text approach gives a mean Qc/Qm= 0.80. 252
Potential explanations for the ‘anomalous’ Test PHC-4 253
As noted earlier, Pile PHC-4 developed a far lower capacity than PHC-1 to 3. Fig. 8a) 254
compares its load-displacement behavior with PHC-3, which was installed at the same 255
location, but to a different tip penetration (see Fig. 2), while Fig. 8b) shows the 256
corresponding stiffness degradation trends. Factors that may have led to this outcome 257
include: 258
This test being staged 5 days after installation, while the others were conducted after 259
13 to 15 days 260
A thin clay band located 4.3 to 6.3D beneath the pile tip (see Fig 2) 261
Local variations in ground conditions between the CPT and pile locations, which were 262
set 3.2m apart. 263
The load displacement curves for the two K24+500 test piles PHC-3 and PHC-4 are compared 264
in Fig. 8, showing that the ‘early-age’ PHC-4 test mobilized its shaft resistance after smaller 265
displacements. The axial load was just 1.2MN at 6mm and the Randolph (1977) analysis 266
outlined earlier indicates that the shaft carried almost all (97%, see Table 3) of this applied 267
load. The later stages of both tests show parallel load-displacement curves with base 268
capacity building at ≈15kN/mm, without any clear peak or reduction in gradient; Table 3 269
summarizes the indicative shaft-to-base load split determined as outlined earlier. 270
Time effects 271
We can apply the shaft capacity time-age curves developed by Jardine et al (2006) to gage 272
what effect age after driving might have had on first-time shaft capacity. As noted by 273
Tavenas and Audy (1972) and Rimoy (2013) overall static compression capacities grow at 274
slower rates, because their base components remain relatively unaffected by time. Relatively 275
little data exists to define the early age shaft set-up, but the trends defined by Jardine et al 276
(2006) imply that the 5 day capacity should be 15% lower that the ICP capacity. Recent tests 277
by Gavin et al (2013) indicate slightly faster earlier growth rates. While pile age corrections 278
reduce the PHC-4 shaft capacity mismatch, they cannot explain all of the observed 279
discrepancy. 280
Table 6 offers a comparison between the interpreted PHC-4 shaft capacity after applying a 281
15% correction for time effects and those derived by the ICP and UWA methods, as applied 282
with their ‘default’ qc averaging techniques. The corrected interpreted shaft resistance still 283
falls 28% below the default ICP estimate, while the full UWA approach leads to a slightly 284
closer match, and the API main text method over-predicts the capacity by 121%. 285
Influence of the weak substratum 286
We consider next the potential effect on PHC-4 of the silty clay layer, which showed qc 287
minima around 3.6MPa (Fig. 2) between 35.6 and 36.8m depth in a nearby sounding, while 288
PHC-4’s tip penetrated to 33.0m. First we note that subtracting the nominal 1.2MN shaft 289
capacity interpreted above from the 2MN load developed after a settlement of D/10 implies 290
a base capacity of just 0.8MN. Table 7 compares this base resistance with that obtained from 291
the ICP and UWA procedures applying both the ‘default’ procedures and other approaches. 292
It can be seen that simply averaging the qc traces positioned 1.5Do above and below the tip 293
(where 8< qc<14 MPa) leads to a considerable ICP over-estimate for the base capacity. 294
Recognizing the underlying soft layer and adopting a 3.6MPa lower bound (as presently 295
recommended by the ICP authors) leads to a far closer estimate. As summarized in Table 7, 296
the ‘Dutch’ averaging method recommended in UWA-05 improves this method’s match but 297
still exceeds the interpreted field value by 44%. However, a closer match would be obtained 298
in this case if the Dutch method was modified by extending its 4D lower limit. Any extension 299
beyond 4.3D would be sufficient to capture the potential effect on PHC-4 of the first thin 300
band of softer clay. The main text API method only slightly overestimates the interpreted 301
base capacity by 13%. 302
Xu (2006) investigated closed-ended conical piles penetrating into layered strata through 303
both numerical analysis and centrifuge testing. She considered a three-layer system 304
comprising a weak clay seam underlain and overlain by strong sandy layers, which she 305
termed 'strong/weak/strong'. She found reductions in base capacity and stiffness caused by 306
a weak clay seam below the tip that depended on weak layer’s thickness Tw and the depth to 307
its upper surface H. Applying her plots to the PHC-4 pile geometry with Tw/D=2 and H/D=4.3 308
suggests a reduction factor ≈0.73 in the end bearing capacity due to the underlying weak 309
layer that would bring the ICP or UWA predictions into better agreement with the 310
interpreted field data, as outlined in Table 7. Yu and Yang (2012) proposed a base capacity 311
method, termed the HKU method, in which the governing influence zone depends on 312
embedded conditions, sand compressibility, and qc profile variations. They consider that 313
base capacity to be more influenced by the soil beneath than above the pile tip. As shown in 314
Table 7, the HKU method gives the closest estimate for the base capacity interpreted above 315
for PHC-4. The presence of the clay layer may have also downgraded the shaft resistance. 316
Given that the base capacity profile ‘sensed’ the weak layer, it is also likely to have reduced 317
the radial stresses built-up over the shaft just behind the tip, which often contributes a 318
major part of the pile’s capacity. Overall, early testing and the underlying weak clay layer 319
appear to be plausible factors in explaining PHC-4’s low shaft and base capacities. 320
Stratum variability 321
Variability in the local stratigraphy is a further factor that may have contributed to the 322
lower-than-expected capacity of PHC-4. The silty sand and silty clay layers could vary over 323
relatively short distances, as shown by the two logs in Fig. 9 from two boreholes positioned 324
40m apart to either side of PHC-4 (K24+500) at K24+482 and K24+522 respectively. The 325
PHC-4 qc profile was taken from a CPT test conducted within 3.2 meters of the pile, but 326
reductions in the depth to the clay layer’s upper surface, or variations in the depth of 327
‘low-spots’ in the silty sand profiles could have affected on the base capacity assessment 328
made by any of the procedures outlined above. It appears prudent under such 329
circumstances to adopt lowest credible qc profiles to be safe when assessing design base 330
capacities. 331
Conclusions 332
Currently published databases suffer from a paucity of tests to failure on industrial sized 333
pile-piles driven in sands at sites with full CPT profiles. The scarcity of field data appears to 334
be impeding the adoption of design methods that offer fundamentally better physical 335
models and greater reliability. This paper presents and interprets a new set of static tests on 336
pipe piles driven through mainly sandy strata at three sites located several km apart; good 337
quality local CPT soundings are available for each location. Deploying strain gages, 338
conducting tension tests and investigating time effects would have aided test interpretation. 339
However, the information gathered, combined with reference to earlier published studies, 340
allows six main conclusions to be drawn: 341
1) The API Main text, ICP-05 and UWA-05 all offered fair predictions for the total axial 342
compression capacities of Piles PHC-1 to PHC-3, as measured 13 to 15 days after driving. 343
The API main text method predictions fell on average ≈20% below the measurements, 344
which the ICP over-estimated on average by ≈9%. The ‘full’ UWA underestimated overall 345
capacity by ≈9% and the ‘simplified offshore’ variant by ≈21%. The ‘simplified’ UWA or 346
ICP variants appear unnecessarily conservative for piles such as those driven for the 347
Yangtze bridge. 348
2) The relatively modest predictive errors fall well within the ranges established by broader 349
database studies which show CoVs in Qc/Qm of ≈0.25 for the full ICP and UWA 350
approaches and ≈0.7 for the API Main Text method. The same studies show that the 351
latter’s higher CoV arises principally from cases that fall outside the 40≤L/D≤65, 352
35%≤Dr≤65% and 0.4m≤D≤0.8m ranges that encompassed the Yangtze Bridge tests. 353
3) While the ‘full’ ICP and UWA CPT based approaches offer more reliable medium-term 354
shaft capacity estimates over a wider range of conditions, their shaft capacity 355
predictions should become progressively more conservative over time due to beneficial 356
ageing processes. 357
4) The pile-soil axial load response was shown to be highly non-linear. Initial reference 358
stiffness values and stiffness degradation curves have been interpreted that should be 359
helpful to other applications. 360
5) A fourth pile, PHC-4, which was tested after just five days, gave an axial compressive 361
capacity well below that expected by routine application of any of the three considered 362
design methods. Time effects are likely to have contributed to the lower-than-expected 363
shaft capacity interpreted in an approximate manner from the load-displacement curves. 364
Early age testing is clearly undesirable. 365
6) A weak clayey substratum is considered to be the primary cause of the unexpectedly 366
low base capacity of PHC-4. Approaches that consider explicitly weak layers lead to 367
closer agreement with the field measurements. It is recommended that base capacity 368
design assessments should rely on prudent ‘lower bound’ CPT qc trends. 369
Acknowledgements 370
The research described was funded by the Natural Science Foundation of China (Grant Nos. 371
51178421, 51322809), the Chinese Ministry of Education Distinguished Overseas 372
Professorship Programme, the National Key Basic Research Program of China (No. 373
SQ2015CB070563), Zhejiang University K.P. Chao’s High Technology Development 374
Foundation and the Fundamental Research Fund for Central Universities (No. 375
2014XZZX003-15). Their support is gratefully acknowledged. The third author also 376
acknowledges his support from Natural Science Foundation of China (Grant Nos. 41172273 377
and 41372281). 378
Reference 379
American Petroleum Institute (API). (2014). ANSI/API recommended practice 2GEO, 1st Ed., 380
RP2GEO, Washington, DC. 381
Barmpopoulos, I. H., Ho, T. Y. K., Jardine, R. J., and Anh-Minh, N. (2009). The large 382
displacement shear characteristics of granular media against concrete and steel 383
interfaces. Proc. Research Symposium on the Characterization and Behaviour of 384
Interfaces (CBI). Atlanta, Frost, J.D. Editor, IOS Press, Amsterdam, 17-24. 385
Baldi, G., Bellotti, R., Ghionna, V., Jamiolkowski, M. and Pasqualini, E. (1986). Interpretation 386
of CPT's and CPTU's, 2nd Part: Drained Penetration in Sands, Fourth Int. Geotechnical 387
Seminar Field Instrumentation and In Situ Measurements, Nanyang Technological 388
Institute, Singapore, November 1986, 143-156. 389
Bustamante, M., and Gianeselli, L. (1982). Pile bearing capacity prediction by means of static 390
penetrometer CPT. Proc. 2nd European Symp. On Penetration Test., Balkema, Rotterdam, 391
493-500. 392
China Academy of Building Research (CABR). (2008). Technical code for building pile 393
foundations. JGJ 94-2008, China Construction Industry Press, Beijing (in Chinese). 394
Clausen, C. J. F., Aas, P. M., and Karlsrud, K. (2005). Bearing capacity of driven piles in sand, 395
the NGI approach. Proc., Int. Symp. On Frontiers in Offshore Geotechnics, Taylor & 396
Francis, London, 677–681. 397
Chow, F.C. (1997). Investigations into displacement pile behaviour for offshore 398
foundations. PhD thesis, University of London (Imperial College), UK. 399
Dai, Z. G., and Fang, X. (2005). A preliminary investigation into the soft soils in the river 400
region of Wuhu. Geotechnical Engineering World, 8(1), 35-38 (in Chinese). 401
Frank, R., and Burlon, S. (2012). Personal communication. 402
Fleming, K., Weltman, A., Randolph, M, and Elson, K. (2009). Piling Engineering, 3rd 403
Edition, Taylor & Francis, London and New York. 404
Gavin, K. G., Igoe, D. J. P., and Kirwan, L. (2013). The effect of ageing on the axial capacity of 405
piles in sand. Proceedings of the ICE-Geotechnical Engineering, 166(2), 122-130. 406
Gavin, K. G., and Lehane, B. M. (2003). The shaft capacity of pipe piles in sand. Can. 407
Geotech. J., 40(1), 36–45. 408
Jamiolkowski, M.B., Lo Presti, D.F.C., and Manassero, M. (2003). Evaluation of relative 409
density and shear strength of sands from cone penetration test. Soil behaviour and soft 410
ground construction, Geotechnical Special Publication, No. 119, ASCE, Reston, Va., 411
201-238. 412
Jardine, R. J., Chow, F. C., and Overy, R. (2005). ICP design methods for driven piles in sands 413
and clays, Thomas Telford, London. 414
Jardine, R. J., Potts, D. M., Fourie, A. B., and Burland, J. B. (1986). Studies of the influence of 415
non-linear stress–strain characteristics in soil–structure interaction. Géotechnique, 36(3), 416
377-396. 417
Jardine, R. J., Standing, J. R., and Chow, F. C. (2006). Some observations of the effects of time 418
on the capacity of piles driven in sand. Géotechnique, 56(4), 227–244. 419
Jardine, R. J., and Chow, F. C. (2007). Some developments in the design of offshore piles. 420
Proc., 6th Int. Conf. on Offshore Site Investigations and Geotechnics, Society for 421
Underwater Technology, London. 422
Jardine, R. J., Zhu, B. T., Foray, P., and Yang, Z. X. (2013a). Measurement of stresses 423
around closed-ended displacement piles in sand. Géotechnique, 63(1), 1–17. 424
Jardine, R. J., Zhu, B. T., Foray, P., and Yang, Z. X. (2013b). Interpretation of stress 425
measurements around closed-ended displacement piles in sand. Géotechnique, 426
63(8), 613–627. 427
Kolk, H. J., Baaijens, A. E., and Sender, M. (2005). Design criteria for pipe piles in silica sands. 428
Proc., Int. Symp. on Frontiers in Offshore Geotechnics, Taylor & Francis, London, 711–429
716. 430
Lehane, B. M., Jardine, R. J., Bond, A. J. & Frank, R. (1993). Mechanisms of shaft friction in 431
sand from instrumented pile tests. J. Geotech. Engng Div. ASCE 119, No. 1, 19–35. 432
Lehane, B. M., Schneider, J. A., and Xu, X. (2005). A review of design methods for offshore 433
driven piles in siliceous sand.UWA Rep. No. GEO 05358, The University of Western 434
Australia, Perth, Australia. 435
Merritt, A., Schroeder, F., Jardine, R.J., Stuyts, B., Cathie, D. and Cleverly, W. (2012). 436
Development of pile design methodology for an offshore wind farm in the North Sea. 437
In: Proc. 7th Offshore Site Investigation and Geotechnics: Integrated 438
Geotechnologies-Present and Future. London: SUT. 439
Overy, R. (2007). The use of ICP design methods for the foundations of nine platforms 440
installed in the U.K. North Sea. Proc., 6th Int. Conf. on Offshore Site Investigations and 441
Geotechnics, Society for Underwater Technology, London. 442
Randolph, M. F. (1977). A theoretical study of the performance of piles, PhD dissertation, 443
University of Cambridge. 444
Rimoy, S. P. (2013). Ageing and axial cyclic loading studies of displacement piles in sands, 445
PhD dissertation, Imperial College, London, UK. 446
Rimoy, S., Jardine, R.J and Standing, J.R. (2013). Displacement response to axial cycling of 447
piles driven in sand. Geotechnical Engineering, 116 (2): 131-146. 448
Schneider, J.A., Xu, X., and Lehane, B. M. (2008). Database assessment of CPT-based 449
design methods for axial capacity of driven piles in siliceous sands, Journal of 450
Geotechnical and Geoenvironmental Engineering, ASCE, 134(9), 1227-1244. 451
Tavenas, F., and Audy, R. (1972). Limitations of the driving formulas for predicting the 452
bearing capacities of piles in sand. Canadian Geotechnical Journal, 9(1), 47-62. 453
Williams, R.E., Chow, F.C. and Jardine, R.J. (1997). Proc. Int. Conf. on Foundation Failures. IES, 454
NTU, NUS and Inst. Structural Engineers, Singapore, 363-378. 455
Xu, X. (2006). Investigation of the end bearing performance of displacement piles in sand. 456
The University of Western A2006ustralia, PhD dissertation, Perth, Australia. 457
Xu, X., Schneider, J.A., and Lehane, B.M. (2008). Cone penetration test (CPT) methods for 458
end bearing assessment of open- and closed-ended driven piles in siliceous sand. 459
Canadian Geotechnical Journal, 45, 1130-1141. 460
Yu, F., and Yang, J. (2012). Base capacity of open-ended steel pipe piles in sand. Journal of 461
Geotechnical and Geoenvironmental Engineering, ASCE, 138(9), 1116-1128. 462
Yang, Z. X., Jardine, R. J., Zhu, B. T., Foray, P., and Tsuha, C.H.C. (2010). Sand grain crushing 463
and interface shearing during displacement pile installation in sand. Géotechnique, 464
60(6), 469-482. 465
Yang, Z.X., Jardine, R.J., Zhu, B.T., Rimoy, S. (2014). The stresses developed round 466
displacement piles penetrating in sand, Journal of Geotechnical and 467
Geoenvironmental Engineering, ASCE, Doi: 10.1061/(ASCE)GT.1943-5606.0001022, 468
04013027. 469

NXiaojiangba
K24+500
Liuzhou
Baimao
K34
Yangt
ze R
iver
Yangtze River
Jitoushan
Hengshanqiao
K27
Wuhu Second
Bridge
0 0.9 1.5 3 km
Dep
th (
m)

1E-3 0.01 0.1 10
20
40
60
80
100
cum
ulat
ive
perc
enta
ge (
%)
particle size (mm)
Silty sand (K24+500) Silty sand (K27) Silty sand (K34) Finesand (K24+500) Fine sand (K27) Fine sand (K34)
0.001
0 300 600 900 1200 1500
40
30
20
10
0
PHC-1 PHC-2 PHC-3 PHC-4
Total blow counts
Pen
etra
tion
(m)
(a)
0 50 100 150 200
40
30
20
10
0
PHC-1 PHC-2 PHC-3 PHC-4
Normalised blow count (blows/m)
Pen
etra
tion
(m)
(b)
(a) (b)

90
75
60
45
30
15
00 1500 3000 4500 6000
PHC-1 PHC-2 PHC-3
s=0.1Do=80mm
Load Q (kN)
Dis
pla
cem
en
t s
(mm
)
s=0.1Do=60mm
0 1 2 3 4 50.0
0.2
0.4
0.6
0.8
1.0
k/k R
ef
Q/QRef
(a)
0 1 2 3 4 50.0
0.2
0.4
0.6
0.8
1.0
G/G
ref
Q/Qref
(b)
0
1000
2000
3000
4000
5000
6000
0 15 30 45 60 75 90
Qm=4400 kN
s=0.1Do=60mm
PHC-3 PHC-4
Displacement s (mm)
Load
Q (
kN)
(a)
Qm=2000 kN
0 1 2 3 4 50.0
0.2
0.4
0.6
0.8
1.0
k/k R
ef
Q/QRef
(b)
0 1 2 3 4 50.0
0.2
0.4
0.6
0.8
1.0
G/G
ref
Q/Qref
(c)
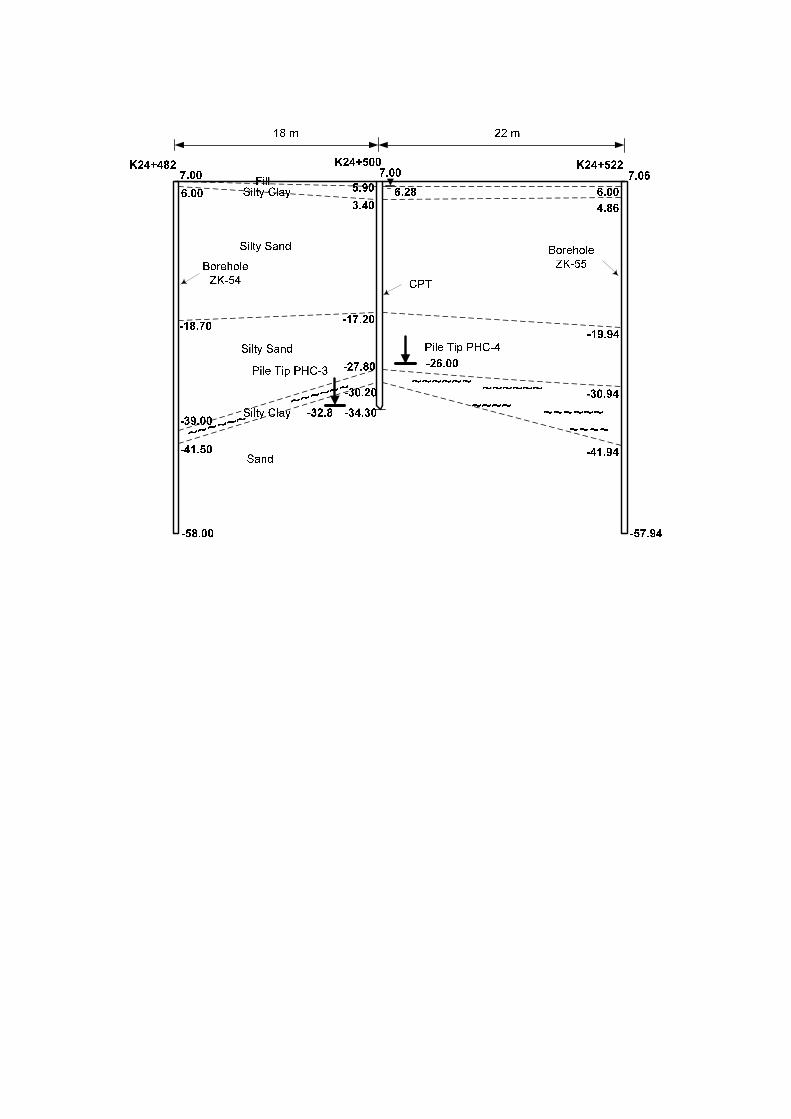
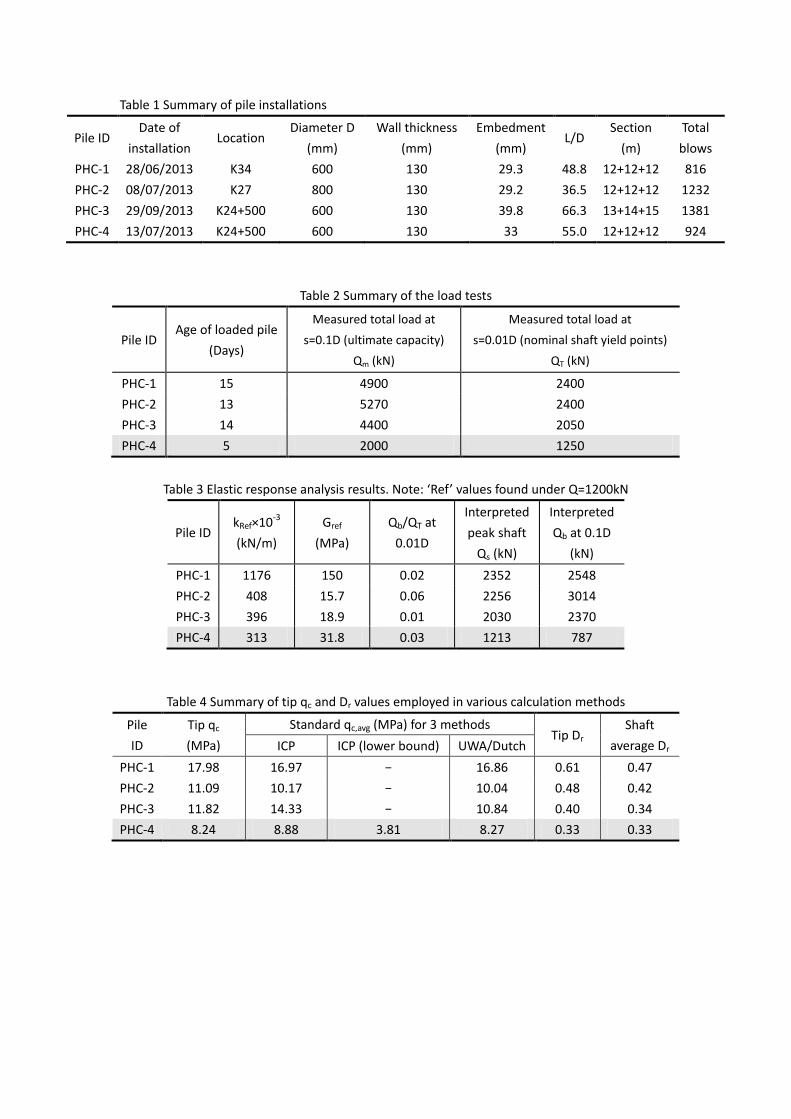
Table 1 Summary of pile installations
Pile ID Date of
installation Location
Diameter D
(mm)
Wall thickness
(mm)
Embedment
(mm) L/D
Section
(m)
Total
blows
PHC-1 28/06/2013 K34 600 130 29.3 48.8 12+12+12 816
PHC-2 08/07/2013 K27 800 130 29.2 36.5 12+12+12 1232
PHC-3 29/09/2013 K24+500 600 130 39.8 66.3 13+14+15 1381
PHC-4 13/07/2013 K24+500 600 130 33 55.0 12+12+12 924
Table 2 Summary of the load tests
Pile ID Age of loaded pile
(Days)
Measured total load at
s=0.1D (ultimate capacity)
Qm (kN)
Measured total load at
s=0.01D (nominal shaft yield points)
QT (kN)
PHC-1 15 4900 2400
PHC-2 13 5270 2400
PHC-3 14 4400 2050
PHC-4 5 2000 1250
Table 3 Elastic response analysis results. Note: ‘Ref’ values found under Q=1200kN
Pile ID kRef×10-3
(kN/m)
Gref
(MPa)
Qb/QT at
0.01D
Interpreted
peak shaft
Qs (kN)
Interpreted
Qb at 0.1D
(kN)
PHC-1 1176 150 0.02 2352 2548
PHC-2 408 15.7 0.06 2256 3014
PHC-3 396 18.9 0.01 2030 2370
PHC-4 313 31.8 0.03 1213 787
Table 4 Summary of tip qc and Dr values employed in various calculation methods
Pile
ID
Tip qc
(MPa)
Standard qc,avg (MPa) for 3 methods Tip Dr
Shaft
average Dr ICP ICP (lower bound) UWA/Dutch
PHC-1 17.98 16.97 − 16.86 0.61 0.47
PHC-2 11.09 10.17 − 10.04 0.48 0.42
PHC-3 11.82 14.33 − 10.84 0.40 0.34
PHC-4 8.24 8.88 3.81 8.27 0.33 0.33
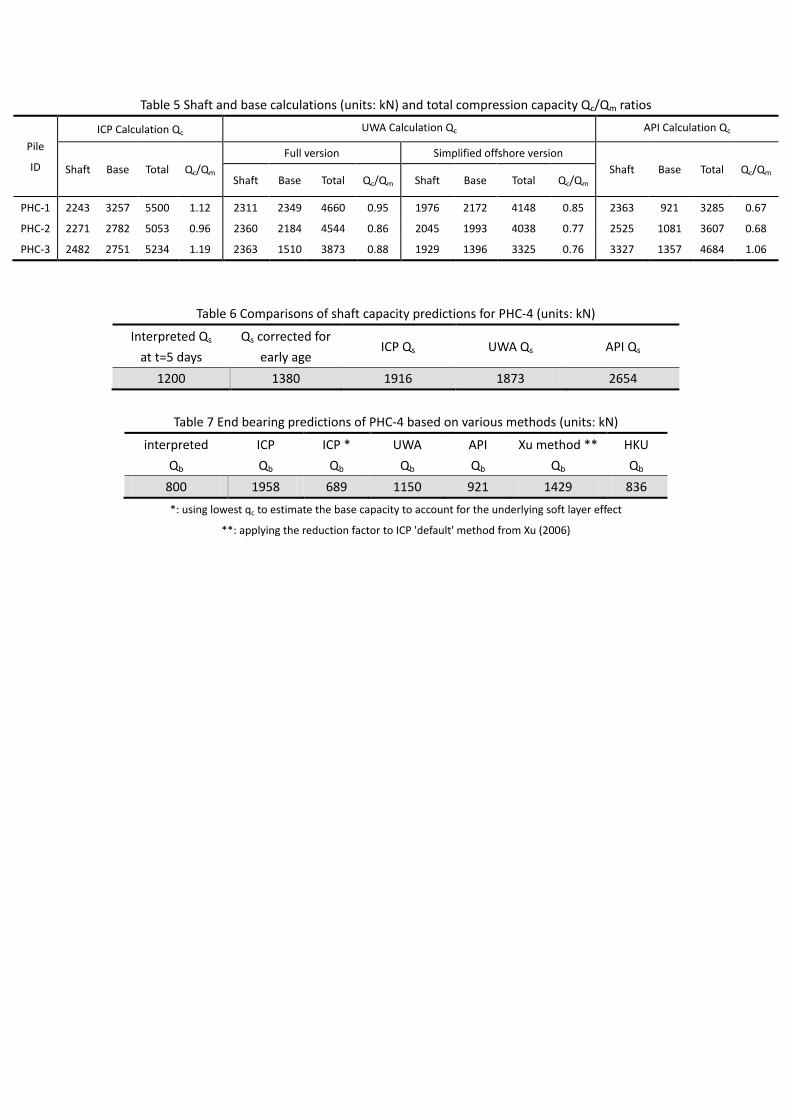
Table 5 Shaft and base calculations (units: kN) and total compression capacity Qc/Qm ratios
Pile
ID
ICP Calculation Qc UWA Calculation Qc API Calculation Qc
Shaft Base Total Qc/Qm
Full version Simplified offshore version
Shaft Base Total Qc/Qm Shaft Base Total Qc/Qm Shaft Base Total Qc/Qm
PHC-1 2243 3257 5500 1.12 2311 2349 4660 0.95 1976 2172 4148 0.85 2363 921 3285 0.67
PHC-2 2271 2782 5053 0.96 2360 2184 4544 0.86 2045 1993 4038 0.77 2525 1081 3607 0.68
PHC-3 2482 2751 5234 1.19 2363 1510 3873 0.88 1929 1396 3325 0.76 3327 1357 4684 1.06
Table 6 Comparisons of shaft capacity predictions for PHC-4 (units: kN)
Interpreted Qs
at t=5 days
Qs corrected for
early age ICP Qs UWA Qs API Qs
1200 1380 1916 1873 2654
Table 7 End bearing predictions of PHC-4 based on various methods (units: kN)
interpreted
Qb
ICP
Qb
ICP *
Qb
UWA
Qb
API
Qb
Xu method **
Qb
HKU
Qb
800 1958 689 1150 921 1429 836
*: using lowest qc to estimate the base capacity to account for the underlying soft layer effect
**: applying the reduction factor to ICP 'default' method from Xu (2006)


